
Fiscal Second Quarter 2027 Financial Results Conference Call September 9, 2026 NASDAQ: LAKE Exhibit 99.2
Safe Harbor & Non-GAAP Statements “Safe Harbor” Statement Under the Private Securities Litigation Reform Act of 1995 This presentation contains estimates, predictions, opinions, goals and other “forward-looking statements” as that phrase is defined in the Private Securities Litigation Reform Act of 1995. Such statements include, without limitation, references to the Company's predictions or expectations of future business or financial performance as well as its goals and objectives for future operations, financial and business trends, business prospects, and management's expectations for earnings, revenues, expenses, inventory levels, capital levels, liquidity levels, or other future financial or business performance, strategies or expectations, including without limitation our expectations of margin improvement. All statements, other than statements of historical facts, which address Lakeland's expectations of sources or uses for capital, or which express the Company's expectation for the future with respect to financial performance or operating strategies can be identified as forward-looking statements. Forward-looking statements involve risks, uncertainties and assumptions as described from time to time in press releases and Forms 8-K, presentations, registration statements, quarterly and annual reports and other reports and filings filed with the Securities and Exchange Commission or made by management. As a result, there can be no assurance that Lakeland's future results will not be materially different from those described herein as "believed," "projected," "planned," "intended," "anticipated," "can," "estimated" or "expected," or other words which reflect the current view of the Company with respect to future events. We caution readers that these forward-looking statements speak only as of the date hereof. The Company hereby expressly disclaims any obligation or undertaking to release publicly any updates or revisions to any such statements to reflect any change in the Company's expectations or any change in events, conditions or circumstances on which such statement is based, except as may be required by law. Non-GAAP Financial Measures To supplement its consolidated financial statements, which are prepared and presented in accordance with Generally Accepted Accounting Principles (GAAP), the Company uses the following non-GAAP financial measures in this presentation: Adjusted Gross Profit, Adjusted Gross Margin, Adjusted Operating Expenses, Adjusted EBITDA excluding FX, and Adjusted EBITDA excluding FX margin. The presentation of this financial information is not intended to be considered in isolation or as a substitute for, or superior to, the financial information prepared and presented in accordance with GAAP. The Company uses these non-GAAP financial measures for financial and operational decision-making and as a means to evaluate period-to-period comparisons. The Company believes that these measures provide useful information about operating results, enhance the overall understanding of past financial performance and future prospects, and allow for greater transparency with respect to key metrics used by management in its financial and operational decision-making. The non-GAAP financial measures used by the Company in this presentation may be different from the methods used by other companies. For more information on the non-GAAP financial measures, please see the Reconciliation of GAAP to non-GAAP Financial Measures tables in this presentation. These accompanying tables include details on the GAAP financial measures that are most directly comparable to non-GAAP financial measures and the related reconciliations between these financial measures.
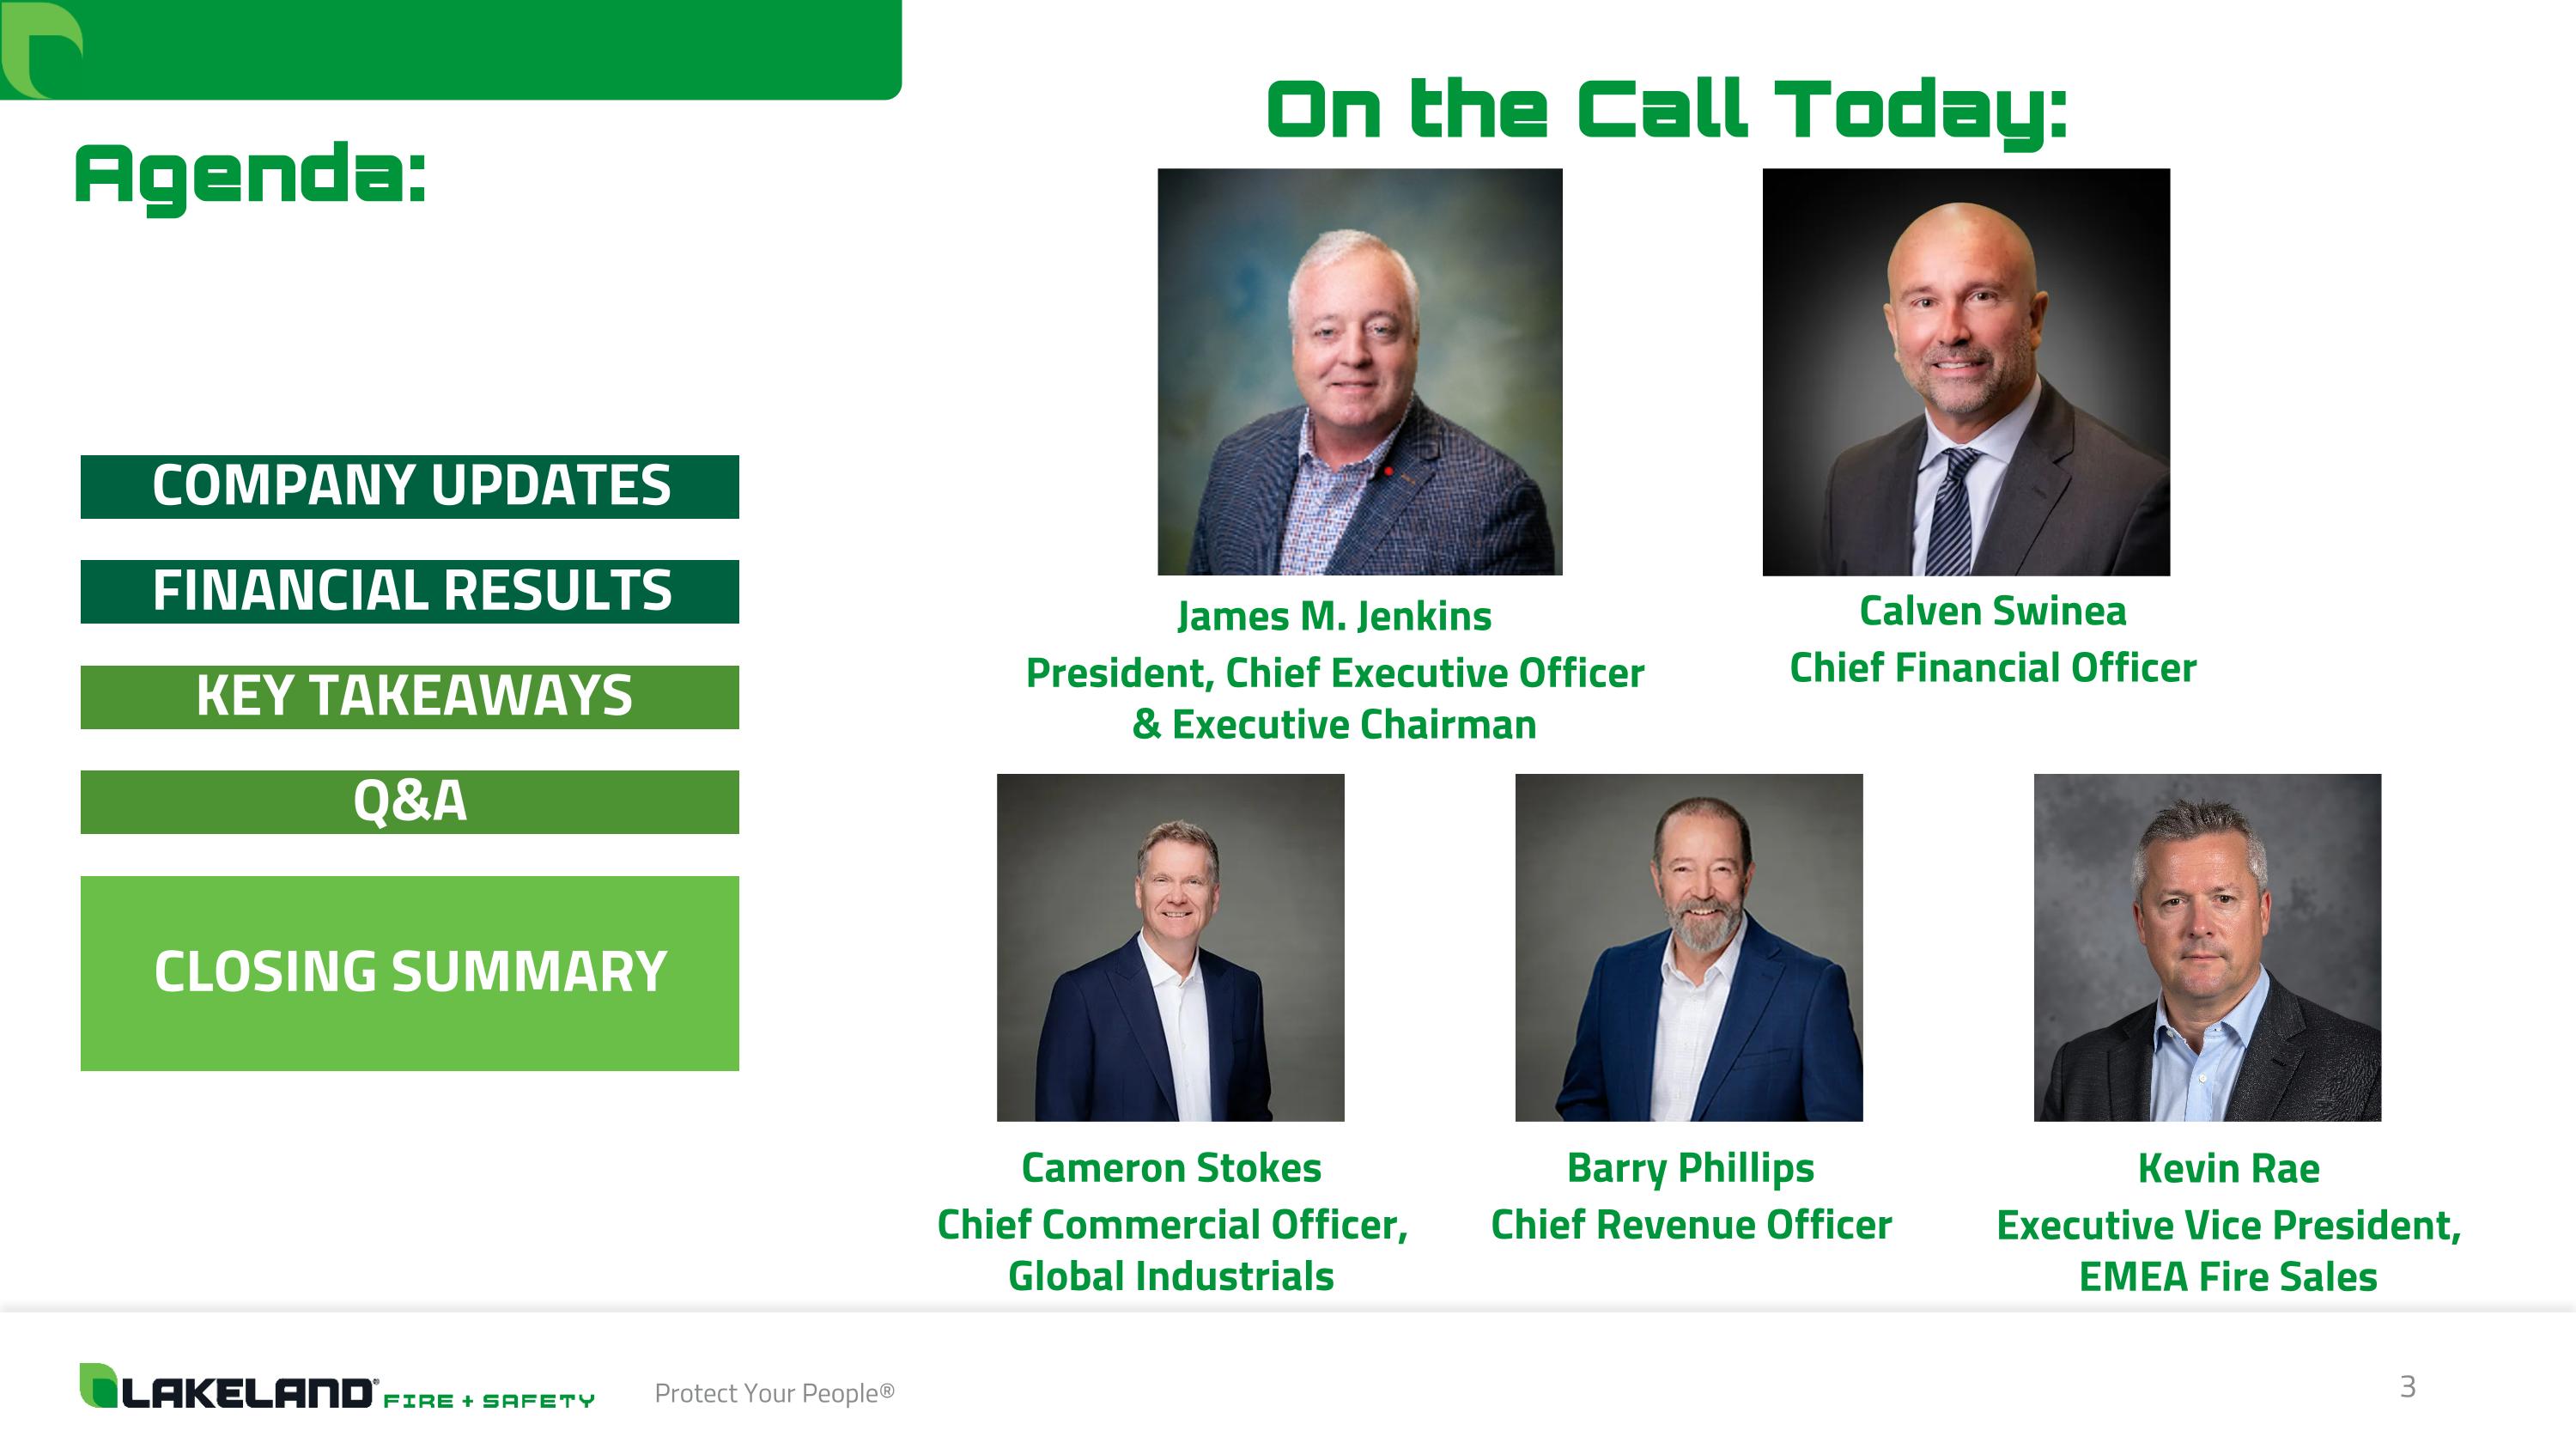
Agenda: On the Call Today: COMPANY UPDATES CLOSING SUMMARY FINANCIAL RESULTS Q&A KEY TAKEAWAYS James M. Jenkins President, Chief Executive Officer & Executive Chairman Calven Swinea Chief Financial Officer Cameron Stokes Chief Commercial Officer, Global Industrials Barry Phillips Chief Revenue Officer Kevin Rae Executive Vice President, EMEA Fire Sales
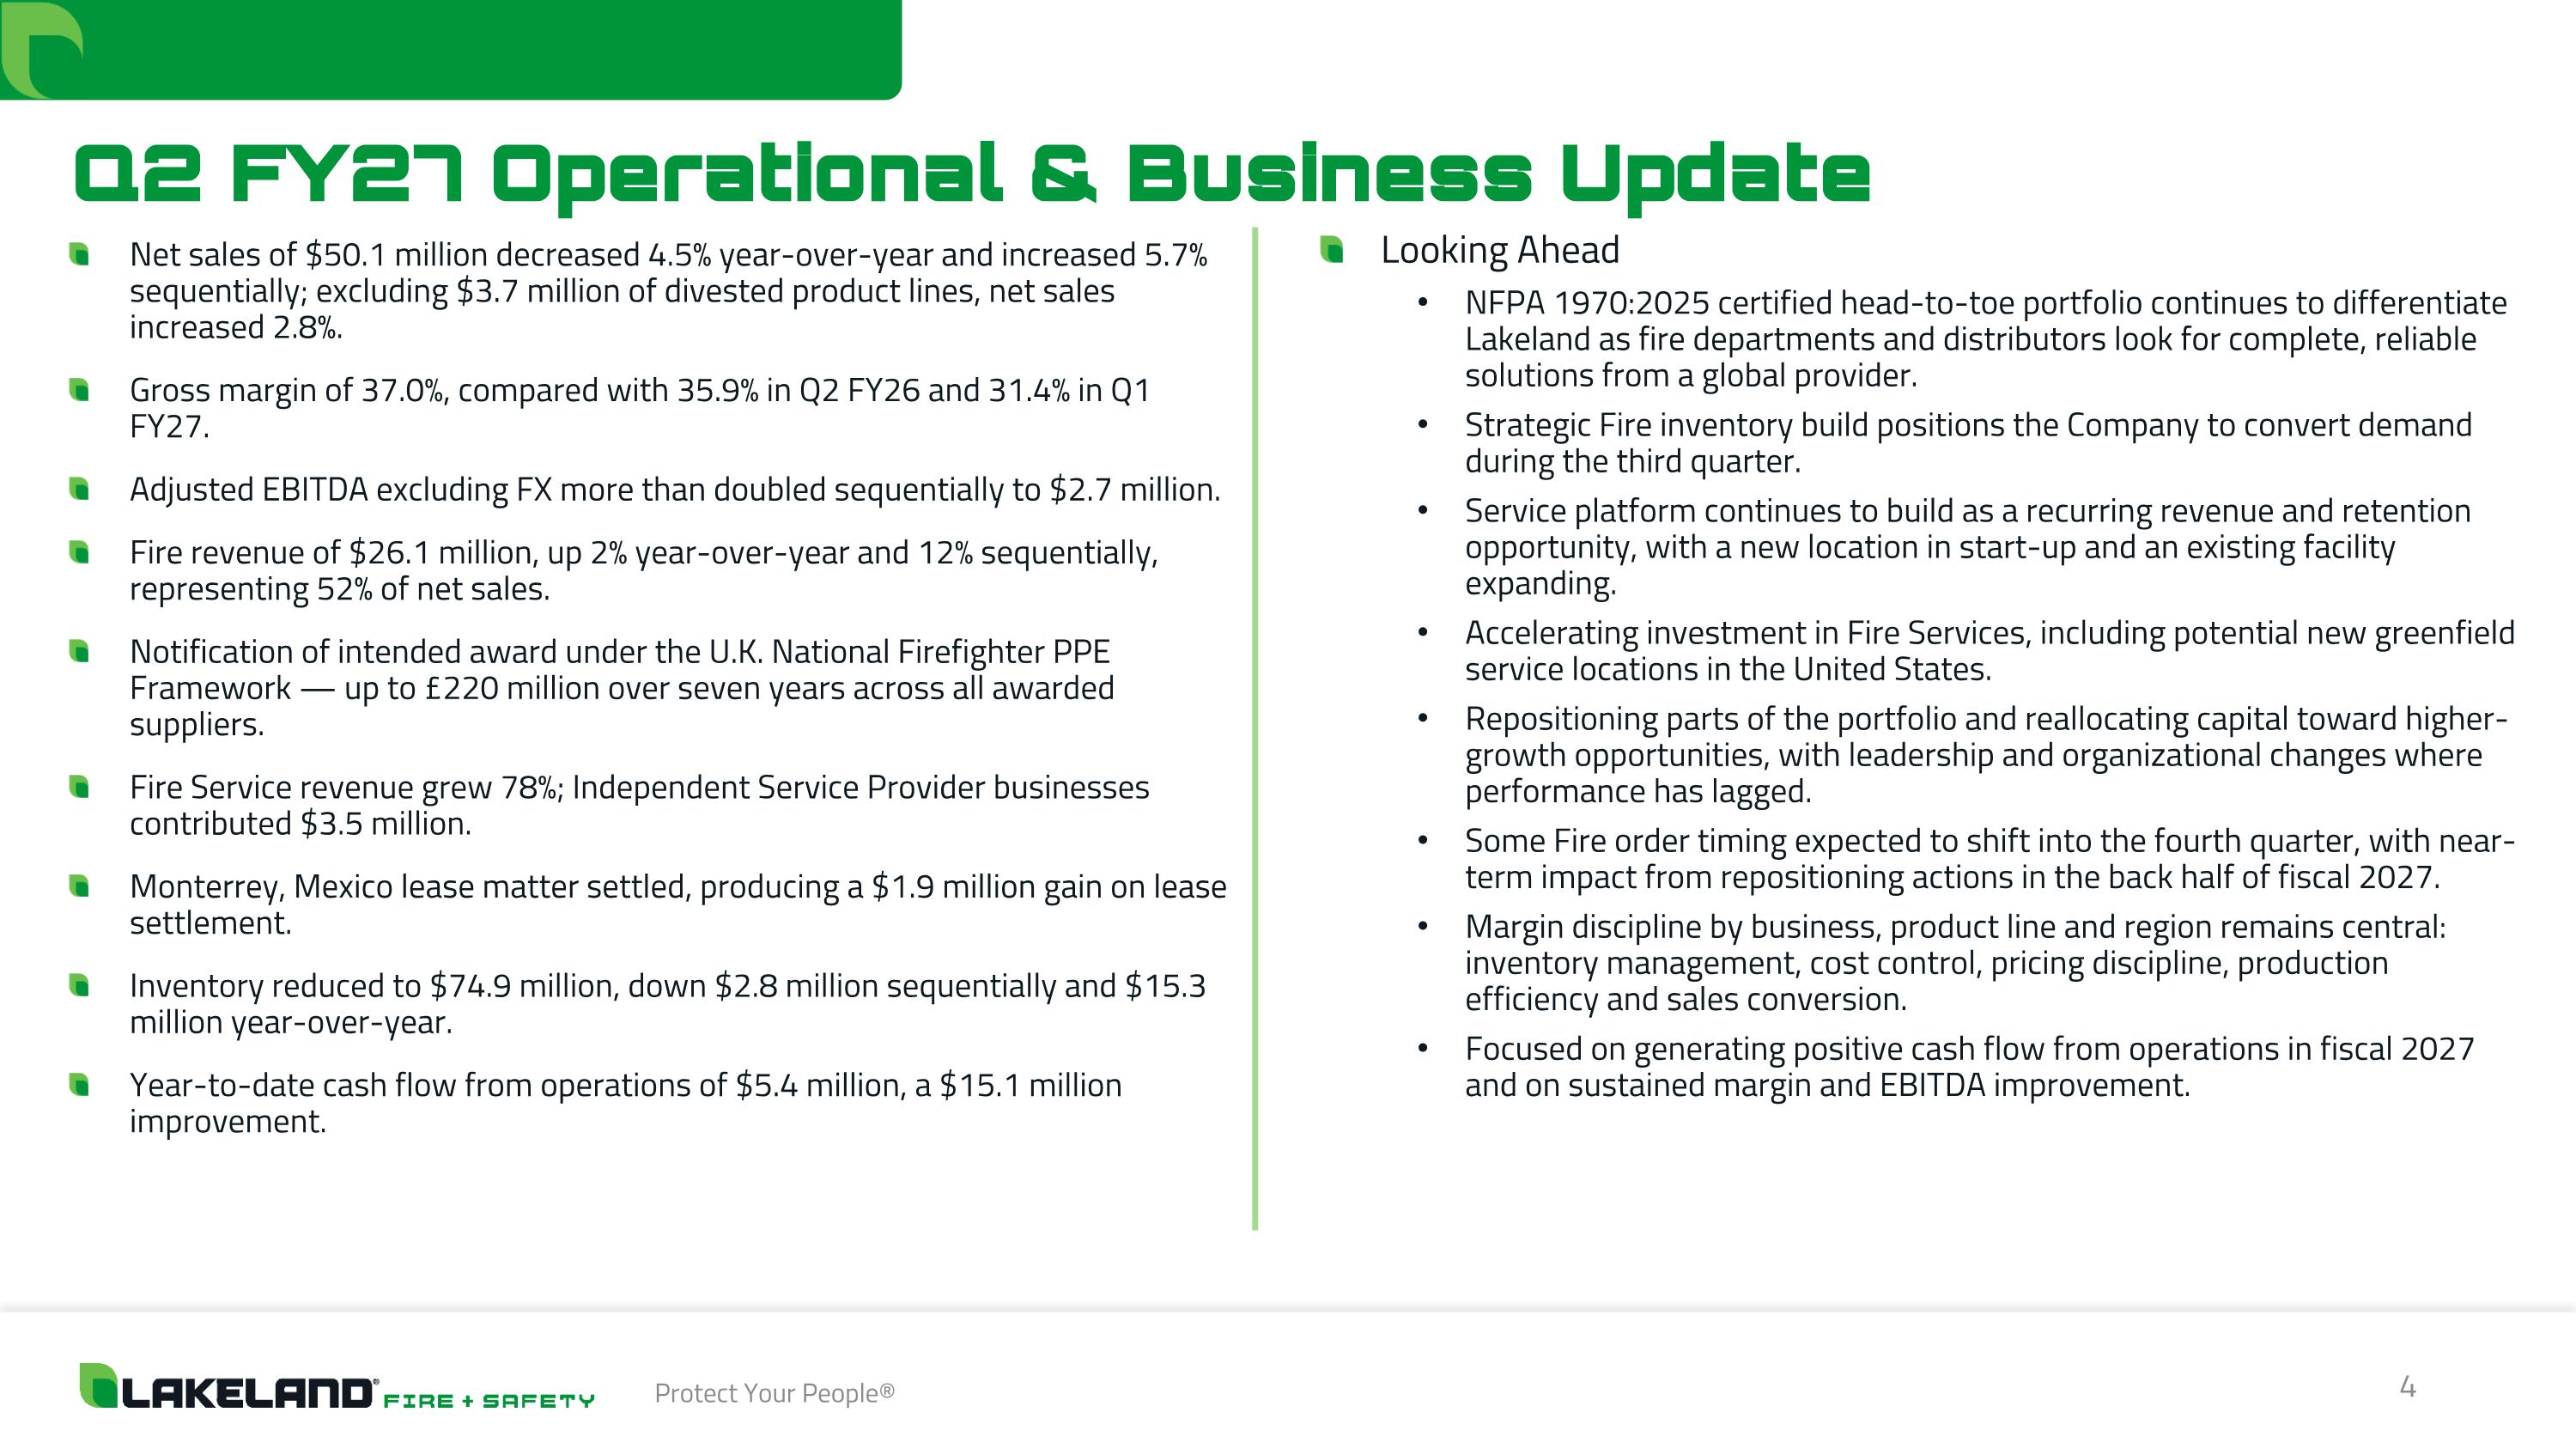
Q2 FY27 Operational & Business Update Net sales of $50.1 million decreased 4.5% year-over-year and increased 5.7% sequentially; excluding $3.7 million of divested product lines, net sales increased 2.8%. Gross margin of 37.0%, compared with 35.9% in Q2 FY26 and 31.4% in Q1 FY27. Adjusted EBITDA excluding FX more than doubled sequentially to $2.7 million. Fire revenue of $26.1 million, up 2% year-over-year and 12% sequentially, representing 52% of net sales. Notification of intended award under the U.K. National Firefighter PPE Framework — up to £220 million over seven years across all awarded suppliers. Fire Service revenue grew 78%; Independent Service Provider businesses contributed $3.5 million. Monterrey, Mexico lease matter settled, producing a $1.9 million gain on lease settlement. Inventory reduced to $74.9 million, down $2.8 million sequentially and $15.3 million year-over-year. Year-to-date cash flow from operations of $5.4 million, a $15.1 million improvement. Looking Ahead NFPA 1970:2025 certified head-to-toe portfolio continues to differentiate Lakeland as fire departments and distributors look for complete, reliable solutions from a global provider. Strategic Fire inventory build positions the Company to convert demand during the third quarter. Service platform continues to build as a recurring revenue and retention opportunity, with a new location in start-up and an existing facility expanding. Accelerating investment in Fire Services, including potential new greenfield service locations in the United States. Repositioning parts of the portfolio and reallocating capital toward higher-growth opportunities, with leadership and organizational changes where performance has lagged. Some Fire order timing expected to shift into the fourth quarter, with near-term impact from repositioning actions in the back half of fiscal 2027. Margin discipline by business, product line and region remains central: inventory management, cost control, pricing discipline, production efficiency and sales conversion. Focused on generating positive cash flow from operations in fiscal 2027 and on sustained margin and EBITDA improvement.
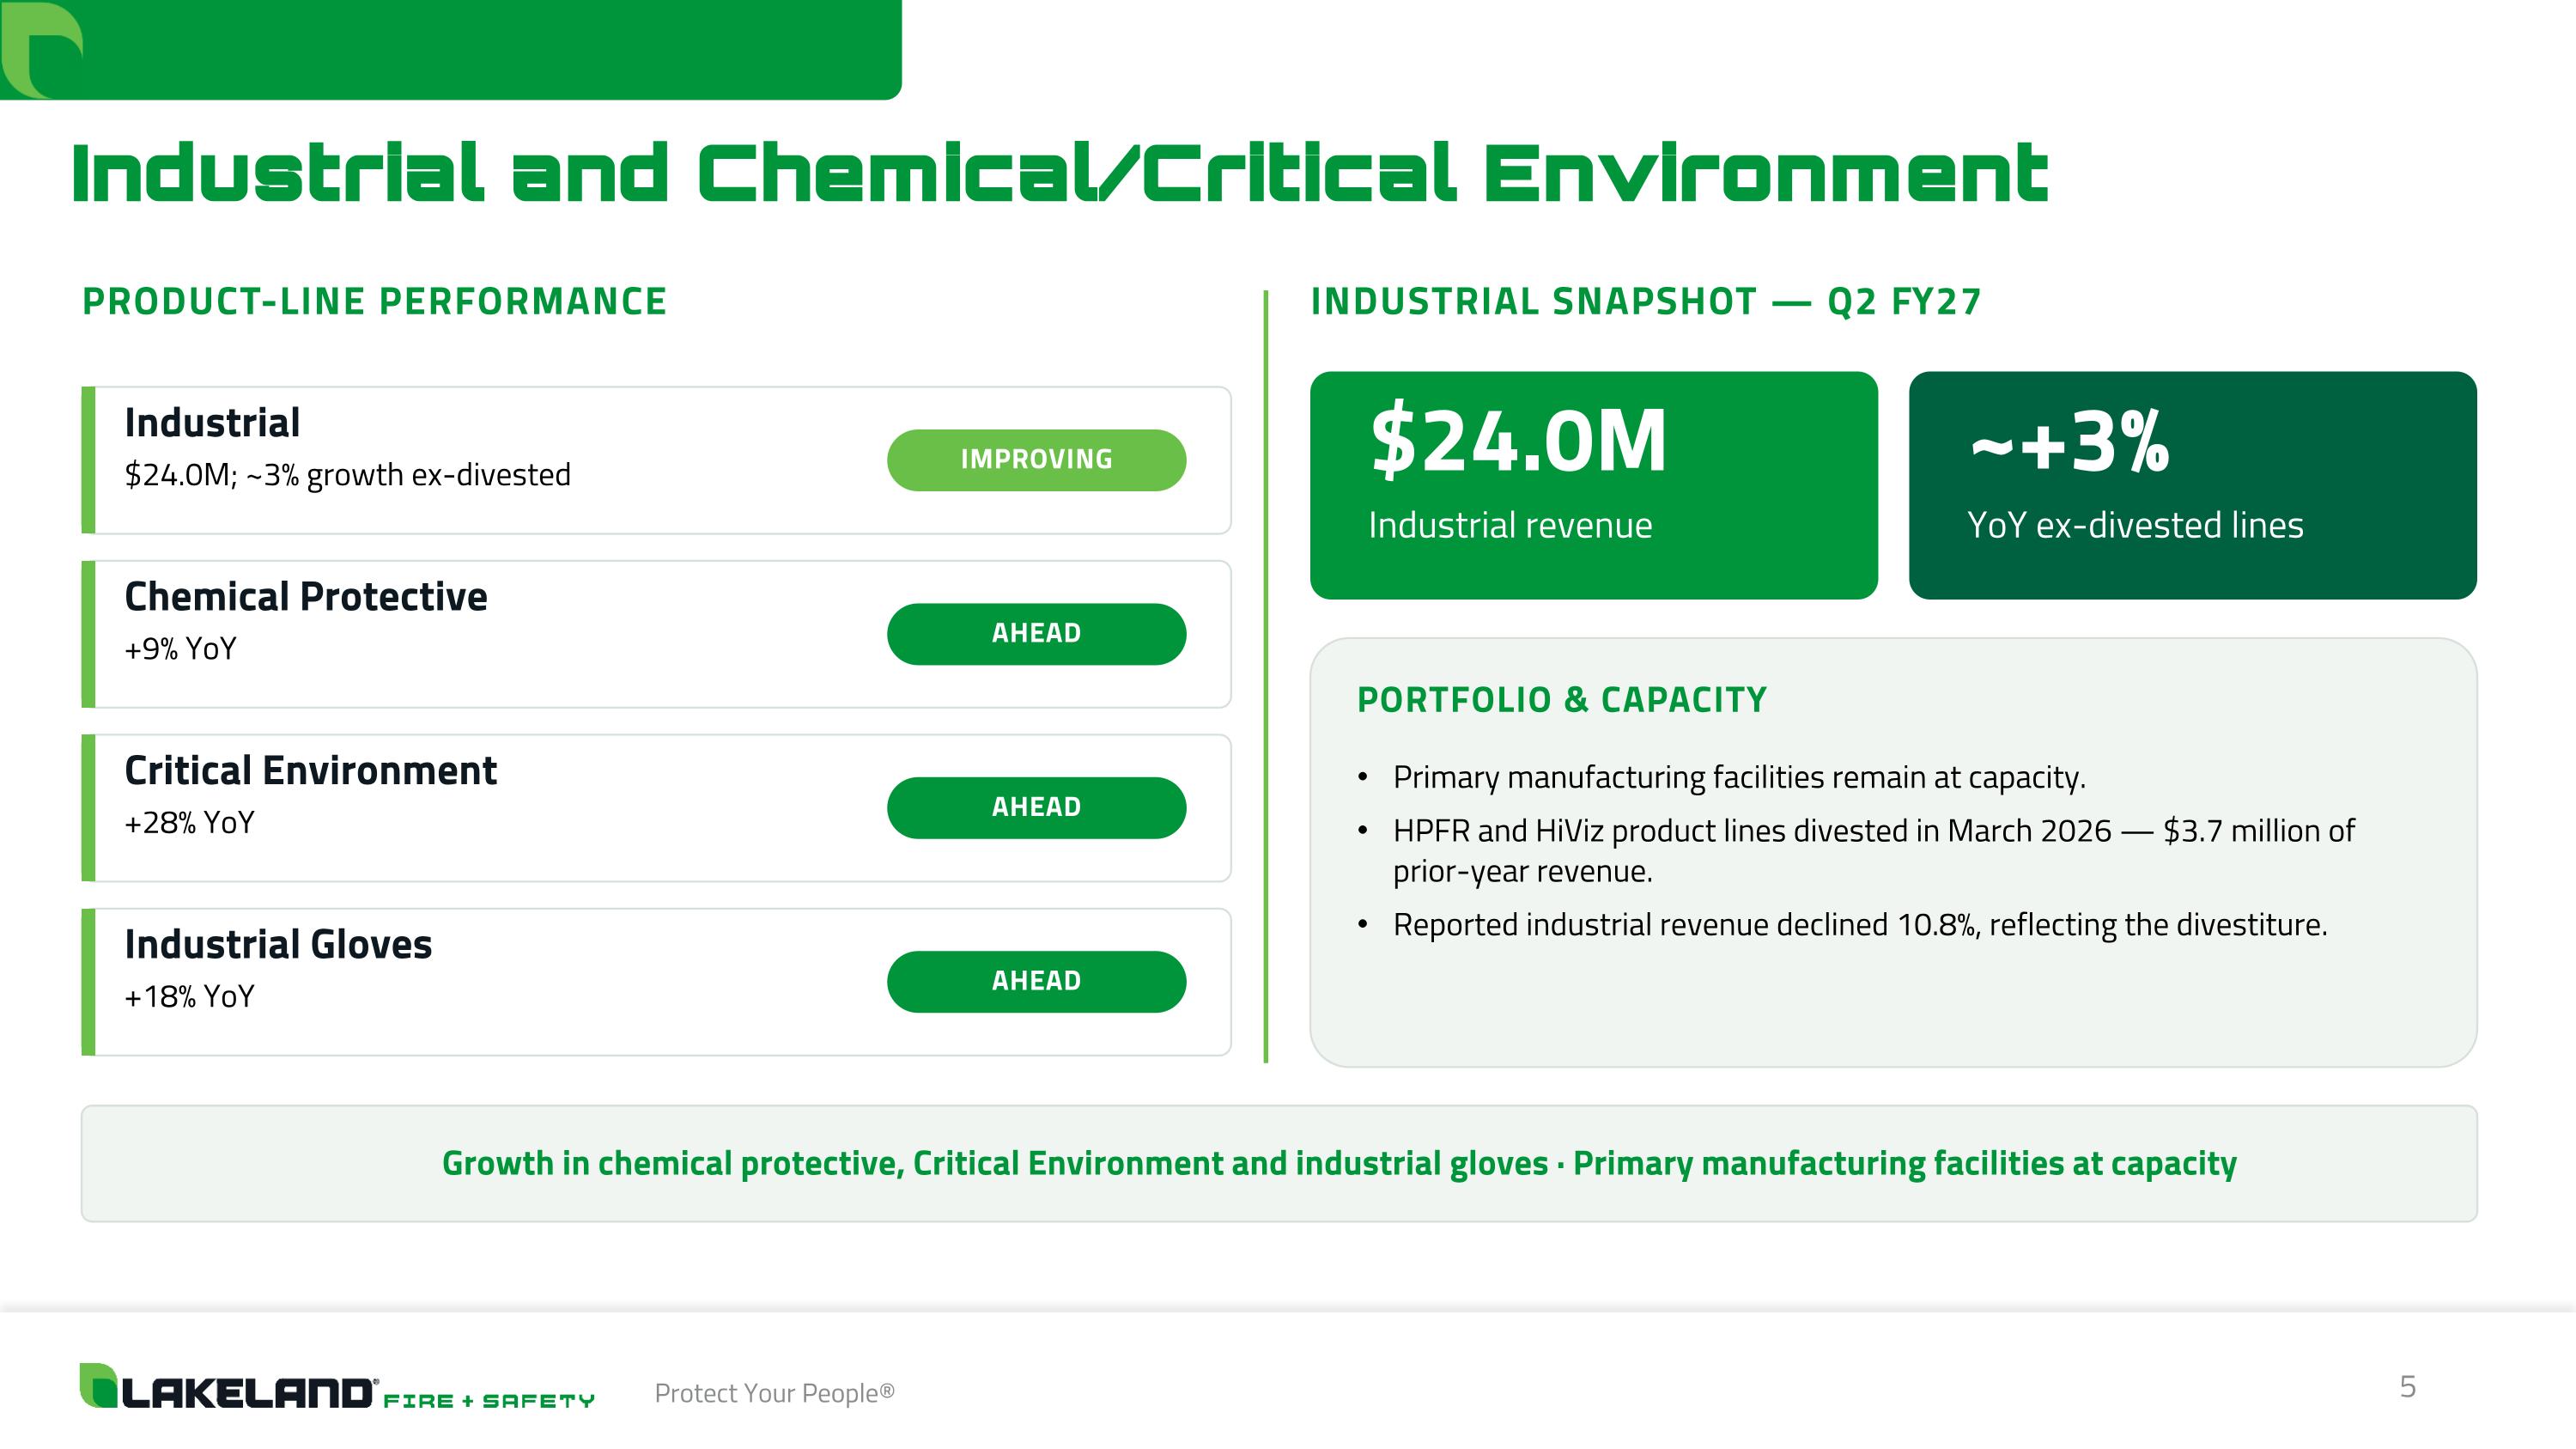
Industrial and Chemical/Critical Environment PRODUCT-LINE PERFORMANCE Industrial $24.0M; ~3% growth ex-divested IMPROVING Chemical Protective +9% YoY AHEAD Critical Environment +28% YoY AHEAD Industrial Gloves +18% YoY AHEAD INDUSTRIAL SNAPSHOT — Q2 FY27 $24.0M Industrial revenue ~+3% YoY ex-divested lines PORTFOLIO & CAPACITY Primary manufacturing facilities remain at capacity. HPFR and HiViz product lines divested in March 2026 — $3.7 million of prior-year revenue. Reported industrial revenue declined 10.8%, reflecting the divestiture. Growth in chemical protective, Critical Environment and industrial gloves · Primary manufacturing facilities at capacity
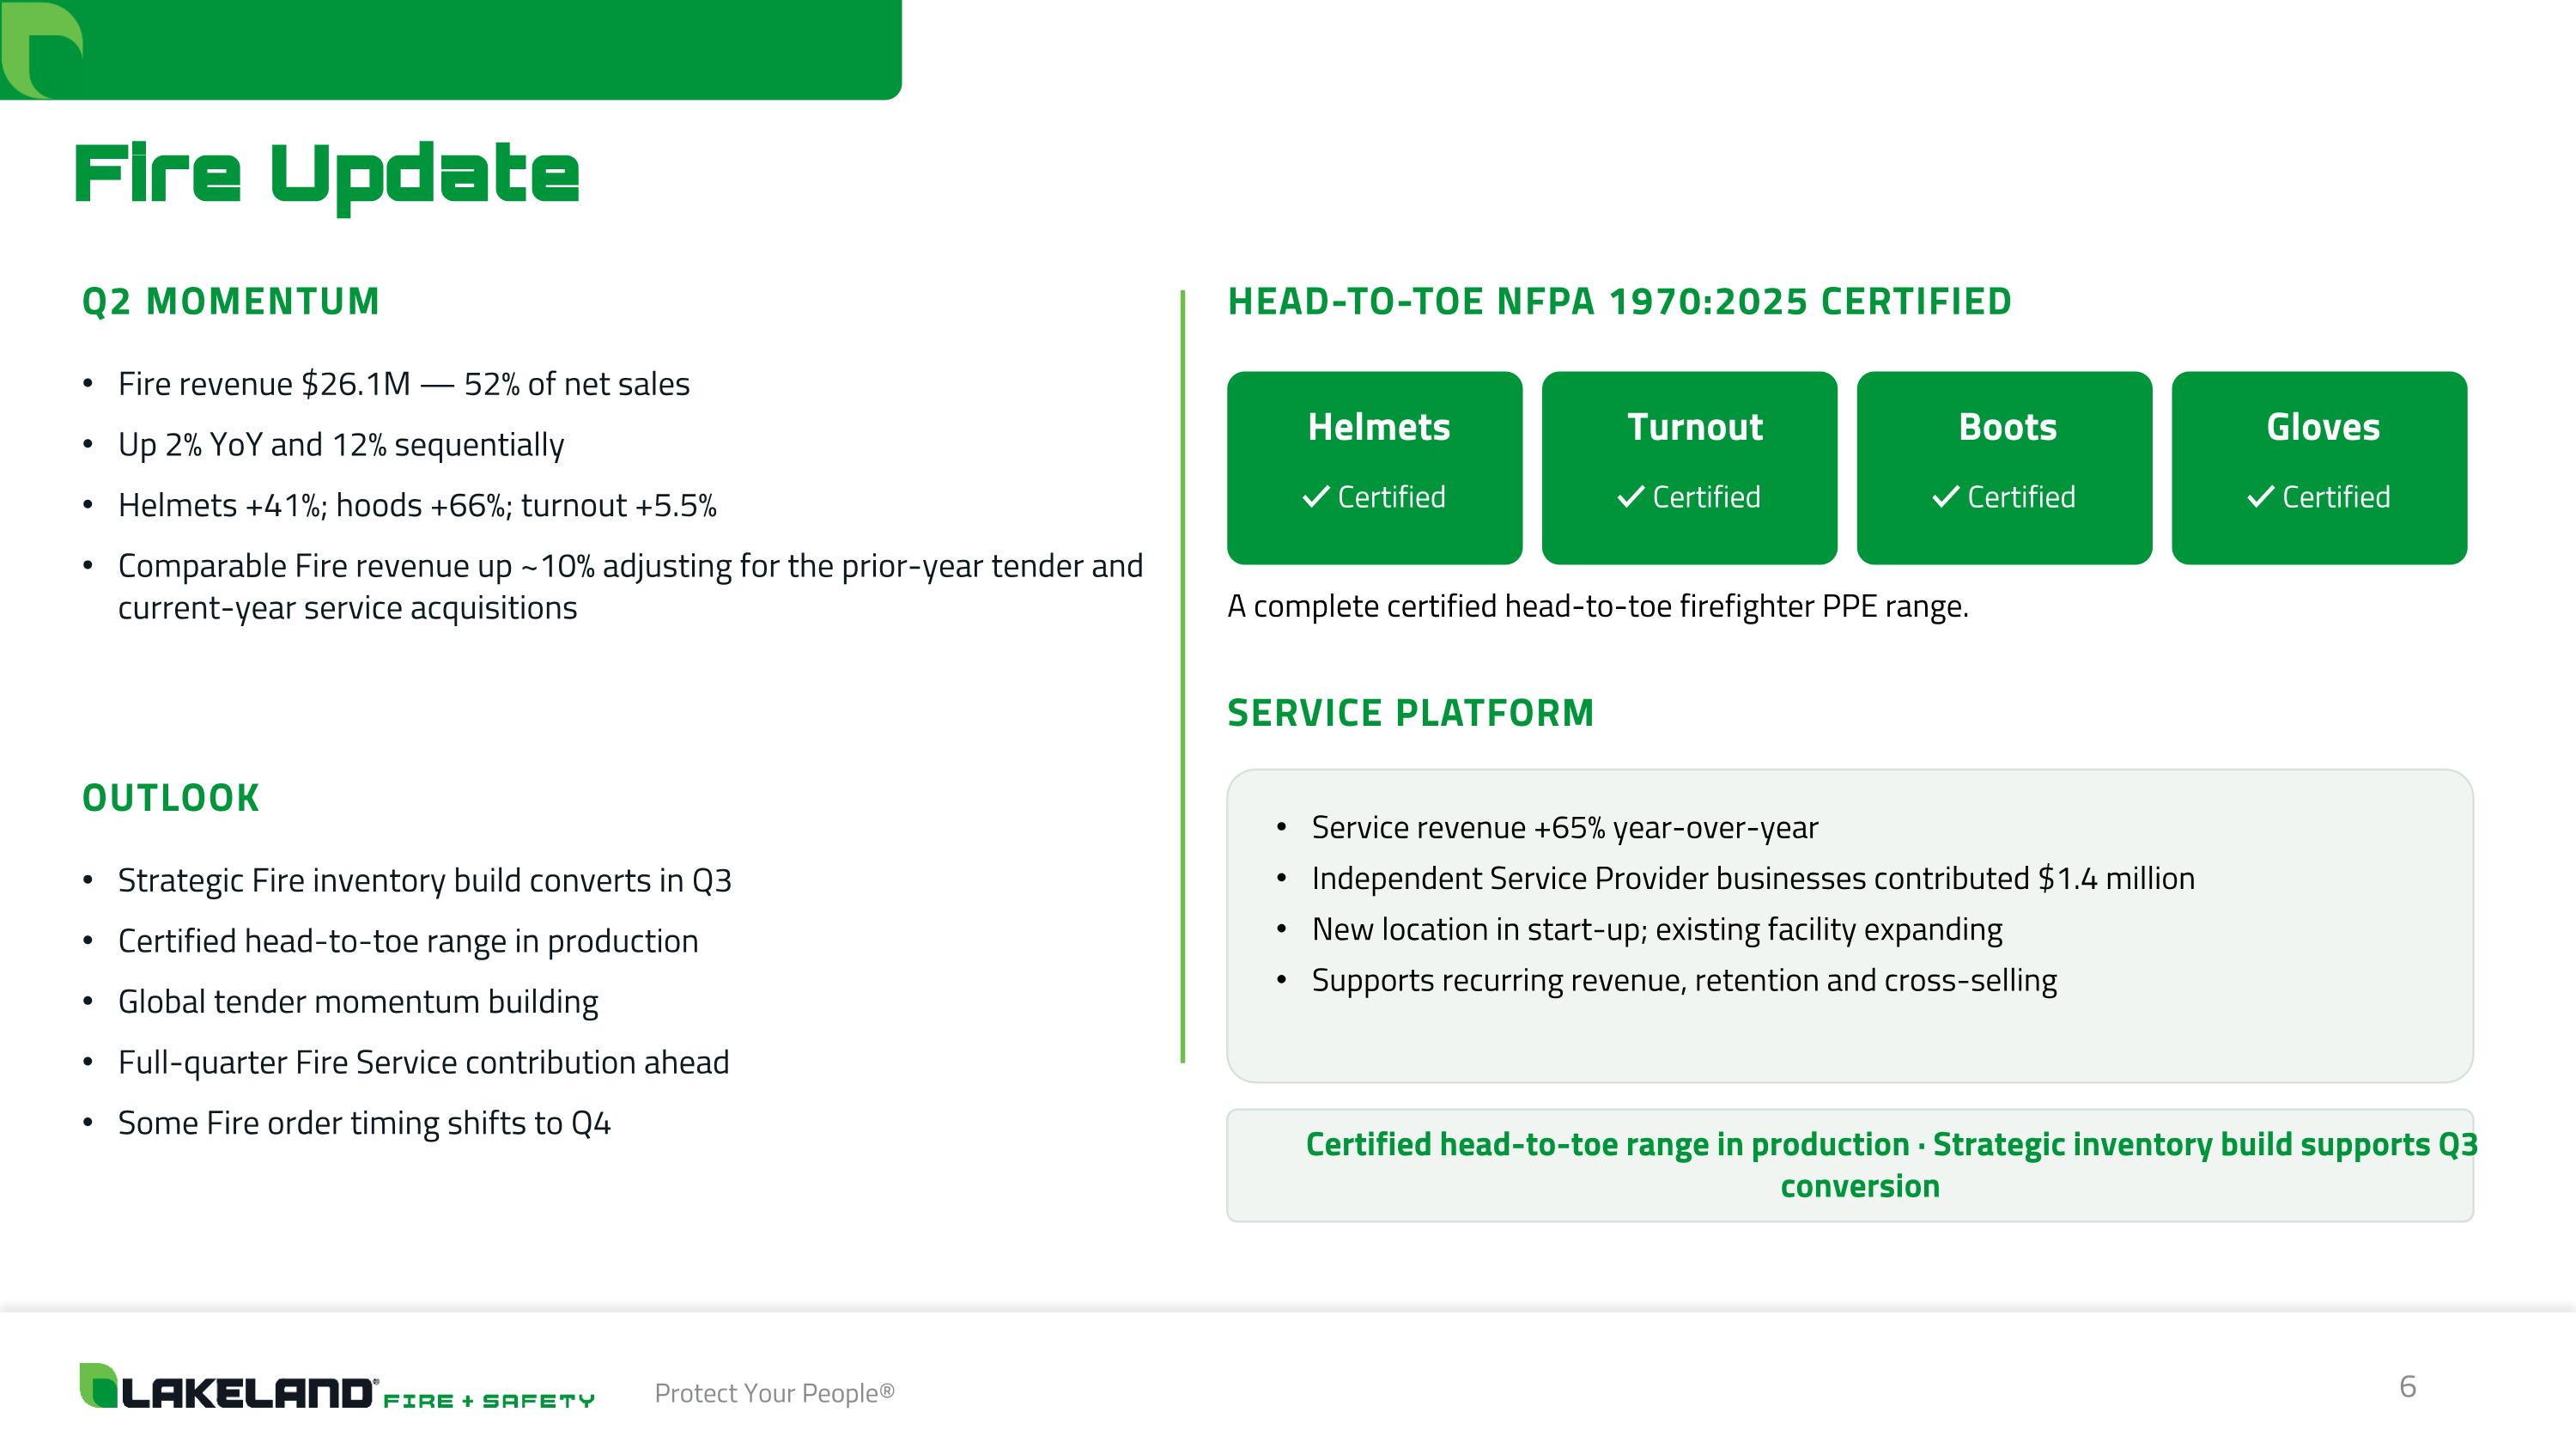
Fire Update Q2 MOMENTUM Fire revenue $26.1M — 52% of net sales Up 2% YoY and 12% sequentially Helmets +41%; hoods +66%; turnout +5.5% Comparable Fire revenue up ~10% adjusting for the prior-year tender and current-year service acquisitions OUTLOOK Strategic Fire inventory build converts in Q3 Certified head-to-toe range in production Global tender momentum building Full-quarter Fire Service contribution ahead Some Fire order timing shifts to Q4 HEAD-TO-TOE NFPA 1970:2025 CERTIFIED Helmets ✓ Certified Turnout ✓ Certified Boots ✓ Certified Gloves ✓ Certified A complete certified head-to-toe firefighter PPE range. SERVICE PLATFORM Service revenue +65% year-over-year Independent Service Provider businesses contributed $1.4 million New location in start-up; existing facility expanding Supports recurring revenue, retention and cross-selling Certified head-to-toe range in production · Strategic inventory build supports Q3 conversion
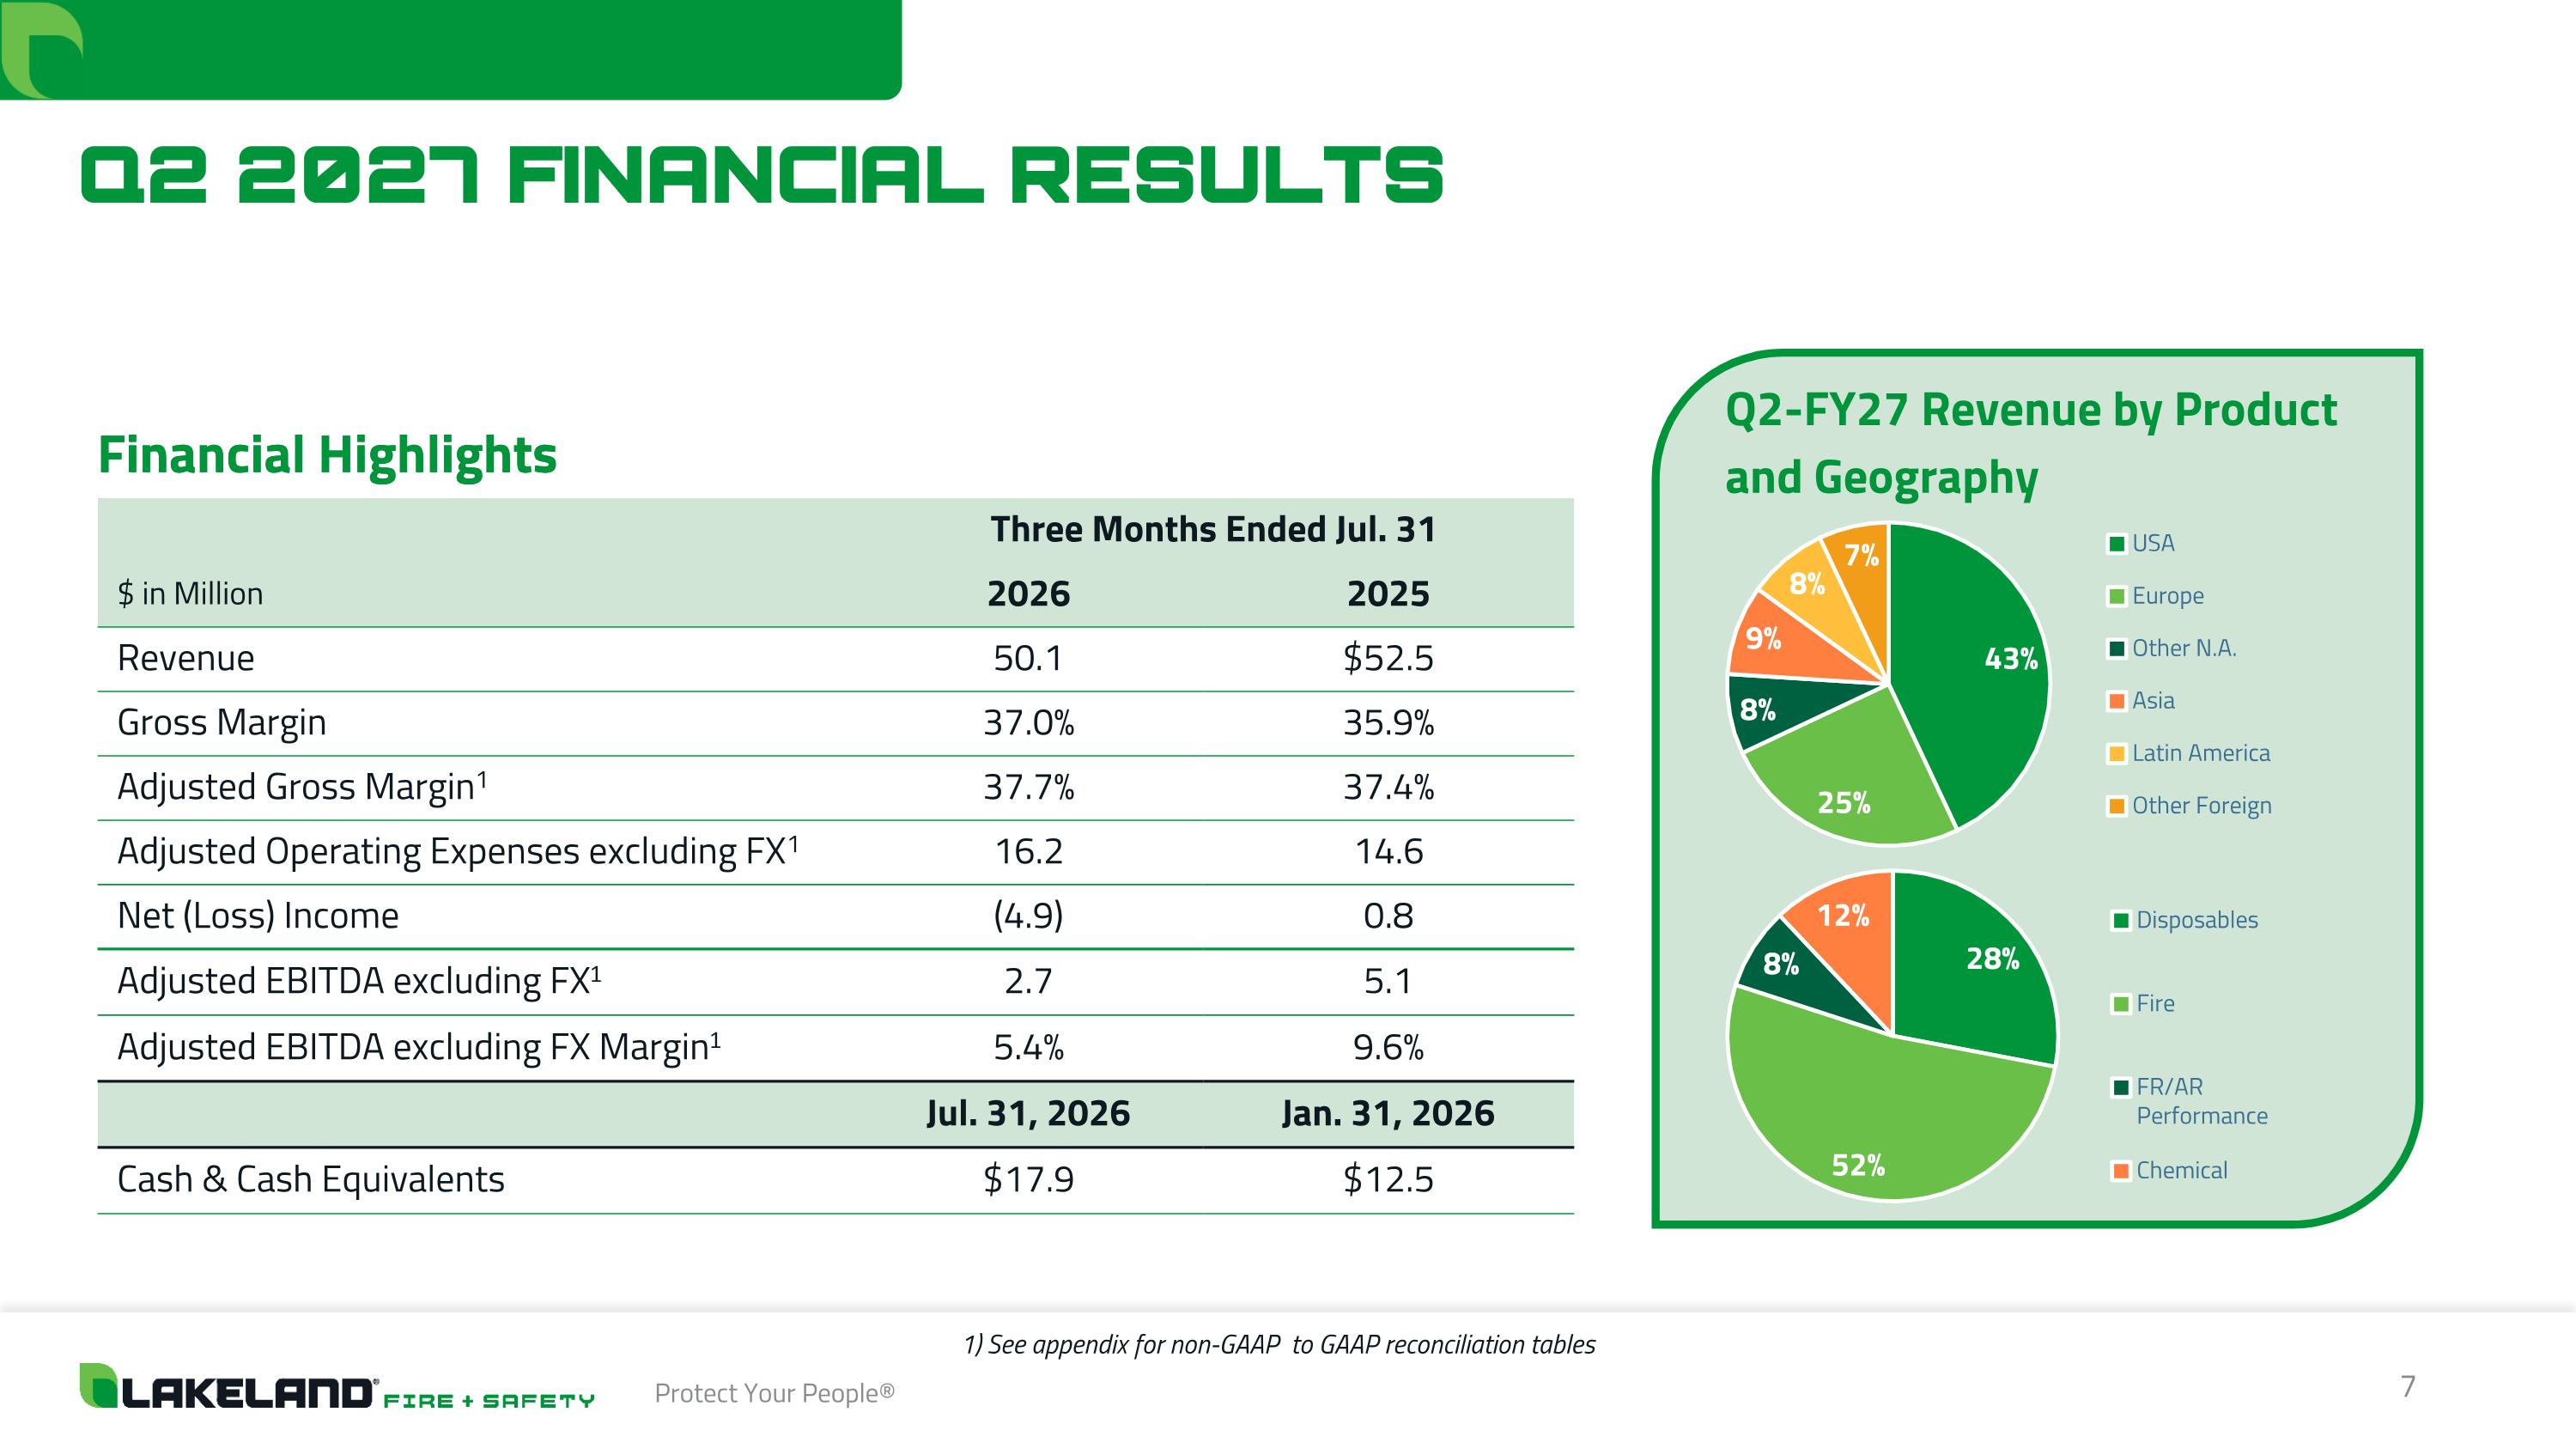
Q2 2027 FINANCIAL RESULTS Financial Highlights Q2-FY27 Revenue by Product and Geography Financial Highlights Three Months Ended Jul. 31 $ in Million 2026 2025 Revenue 50.1 $52.5 Gross Margin 37.0% 35.9% Adjusted Gross Margin1 37.7% 37.4% Adjusted Operating Expenses excluding FX1 16.2 14.6 Net (Loss) Income (4.9) 0.8 Adjusted EBITDA excluding FX1 2.7 5.1 Adjusted EBITDA excluding FX Margin1 5.4% 9.6% Jul. 31, 2026 Jan. 31, 2026 Cash & Cash Equivalents $17.9 $12.5 1) See appendix for non-GAAP to GAAP reconciliation tables
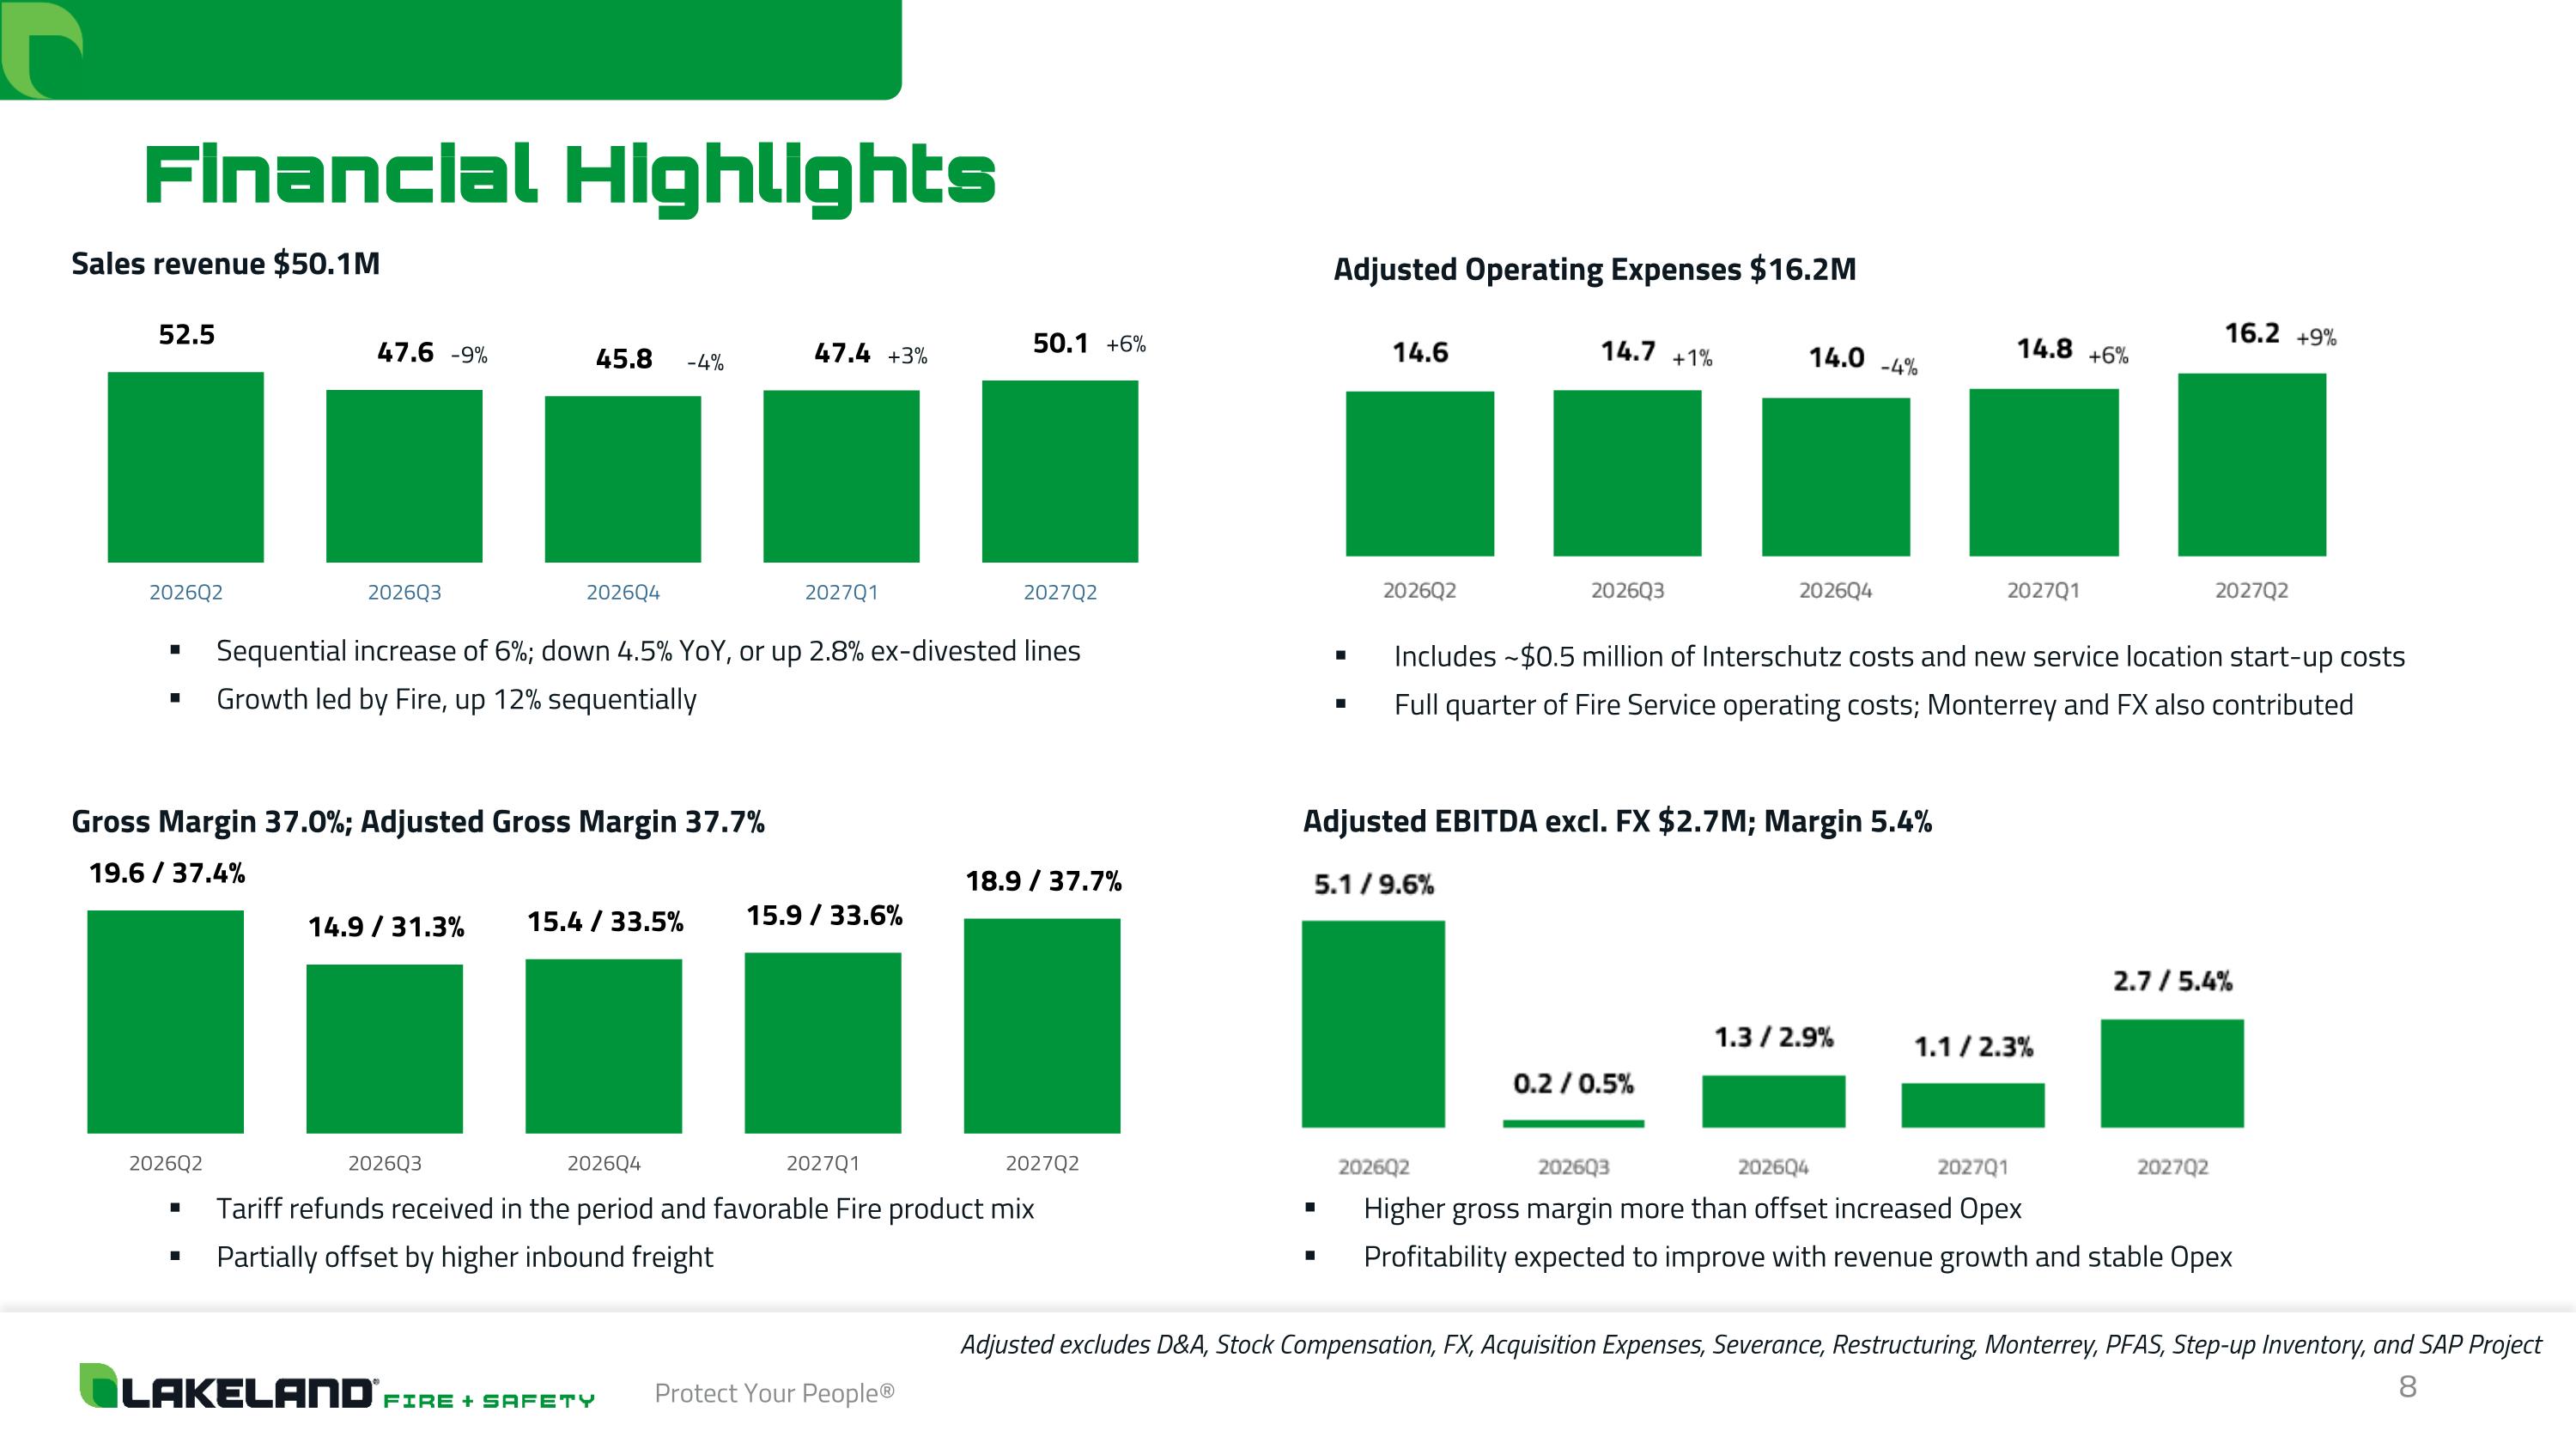
Financial Highlights Adjusted excludes D&A, Stock Compensation, FX, Acquisition Expenses, Severance, Restructuring, Monterrey, PFAS, Step-up Inventory, and SAP Project Adjusted Operating Expenses $16.2M Includes ~$0.5 million of Interschutz costs and new service location start-up costs Full quarter of Fire Service operating costs; Monterrey and FX also contributed Adjusted EBITDA excl. FX $2.7M; Margin 5.4% Higher gross margin more than offset increased Opex Profitability expected to improve with revenue growth and stable Opex Gross Margin 37.0%; Adjusted Gross Margin 37.7% Tariff refunds received in the period and favorable Fire product mix Partially offset by higher inbound freight Sales revenue $50.1M Sequential increase of 6%; down 4.5% YoY, or up 2.8% ex-divested lines Growth led by Fire, up 12% sequentially
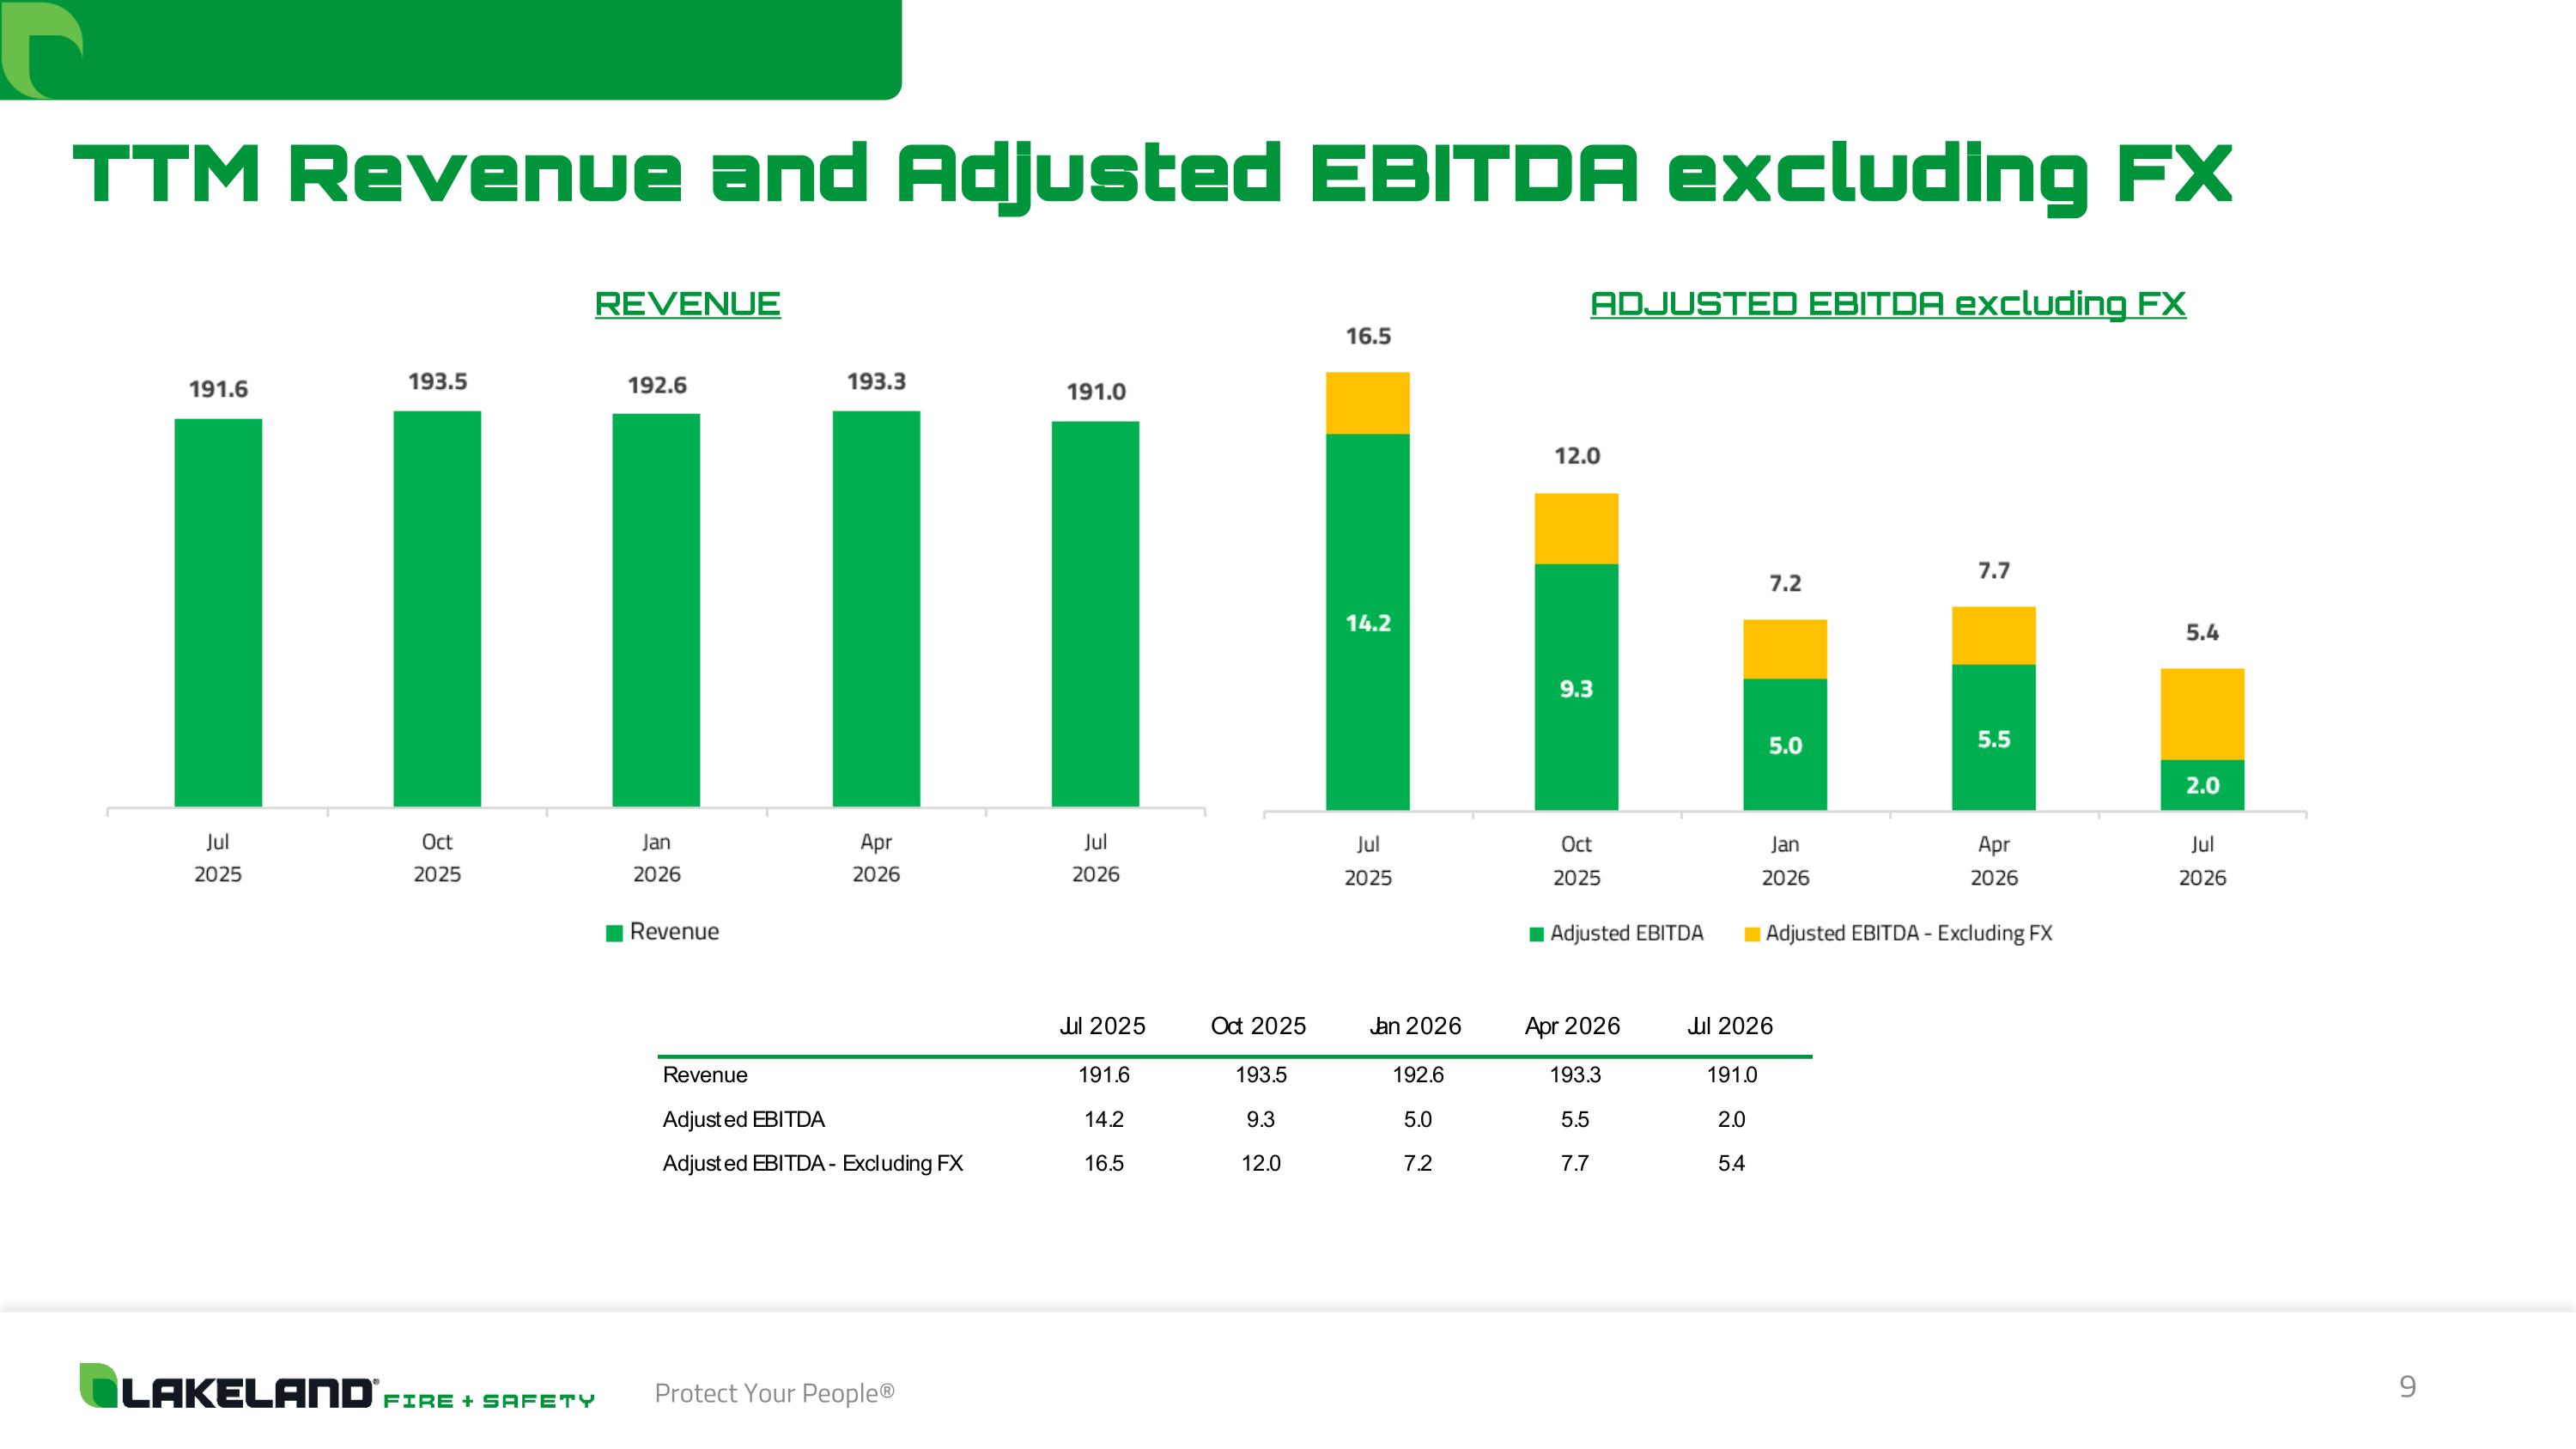
TTM Revenue and Adjusted EBITDA excluding FX REVENUE ADJUSTED EBITDA excluding FX
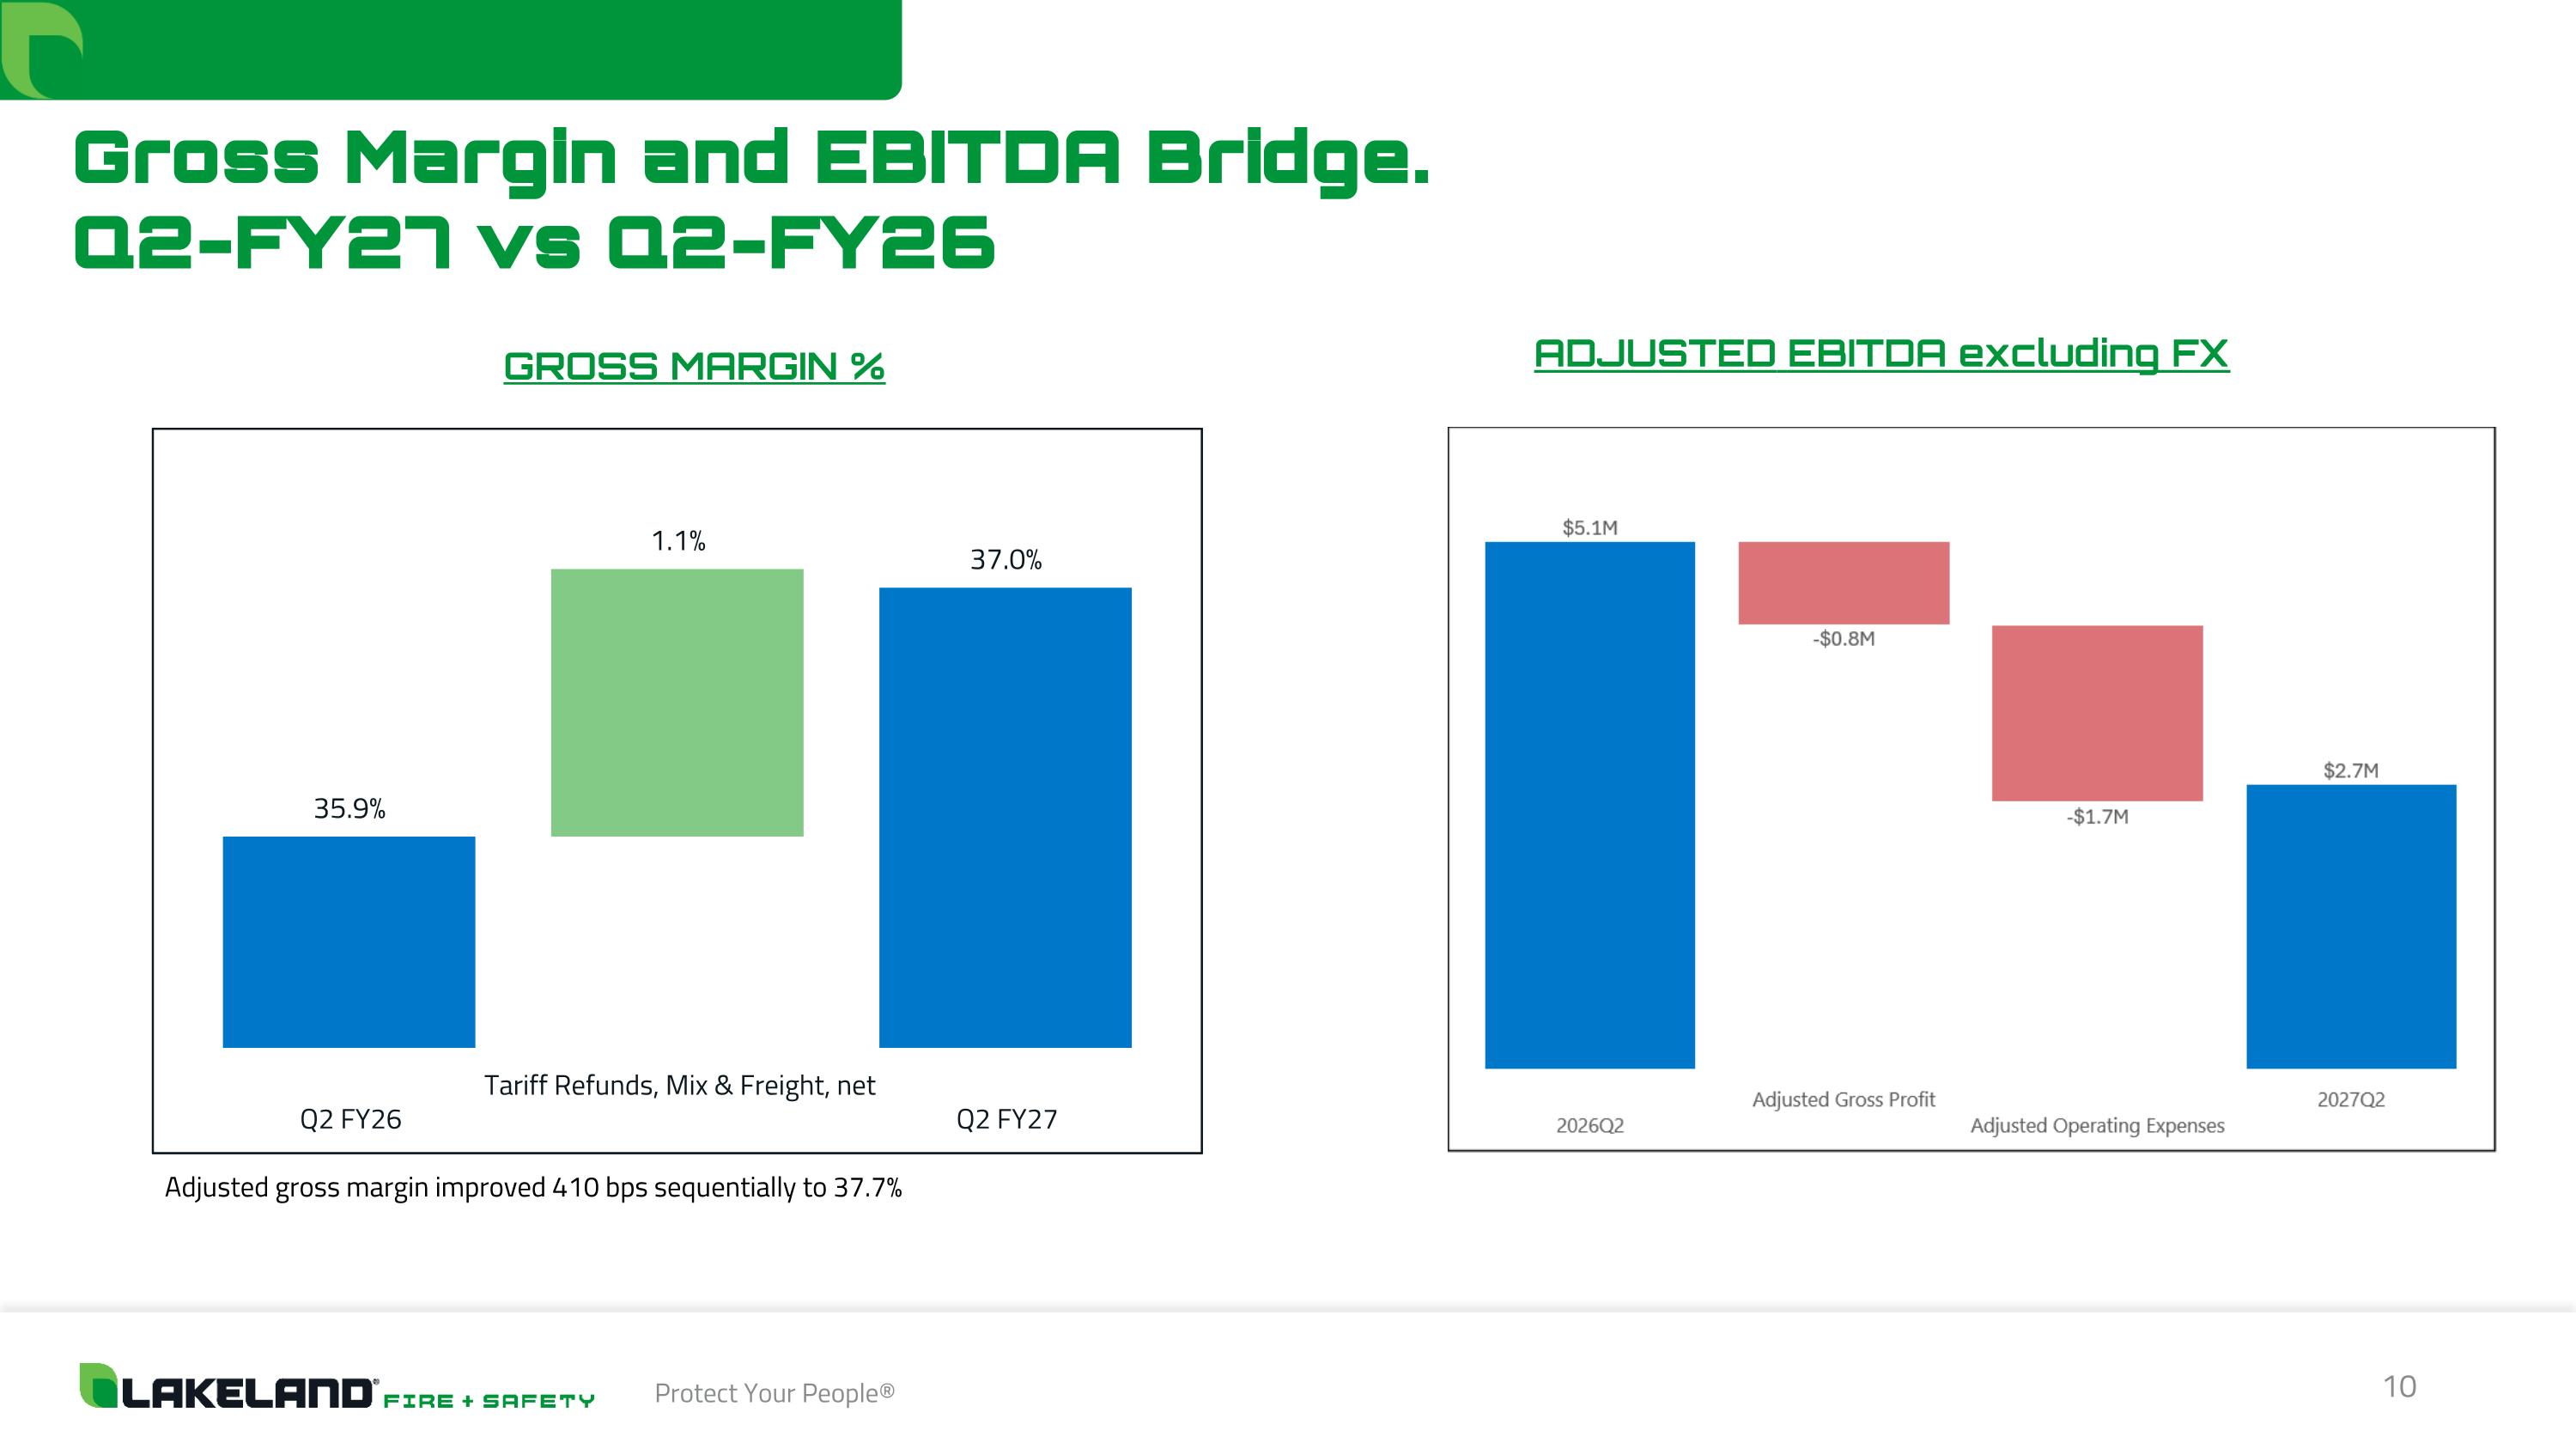
Gross Margin and EBITDA Bridge. Q2-FY27 vs Q2-FY26 GROSS MARGIN % ADJUSTED EBITDA excluding FX Adjusted gross margin improved 410 bps sequentially to 37.7%
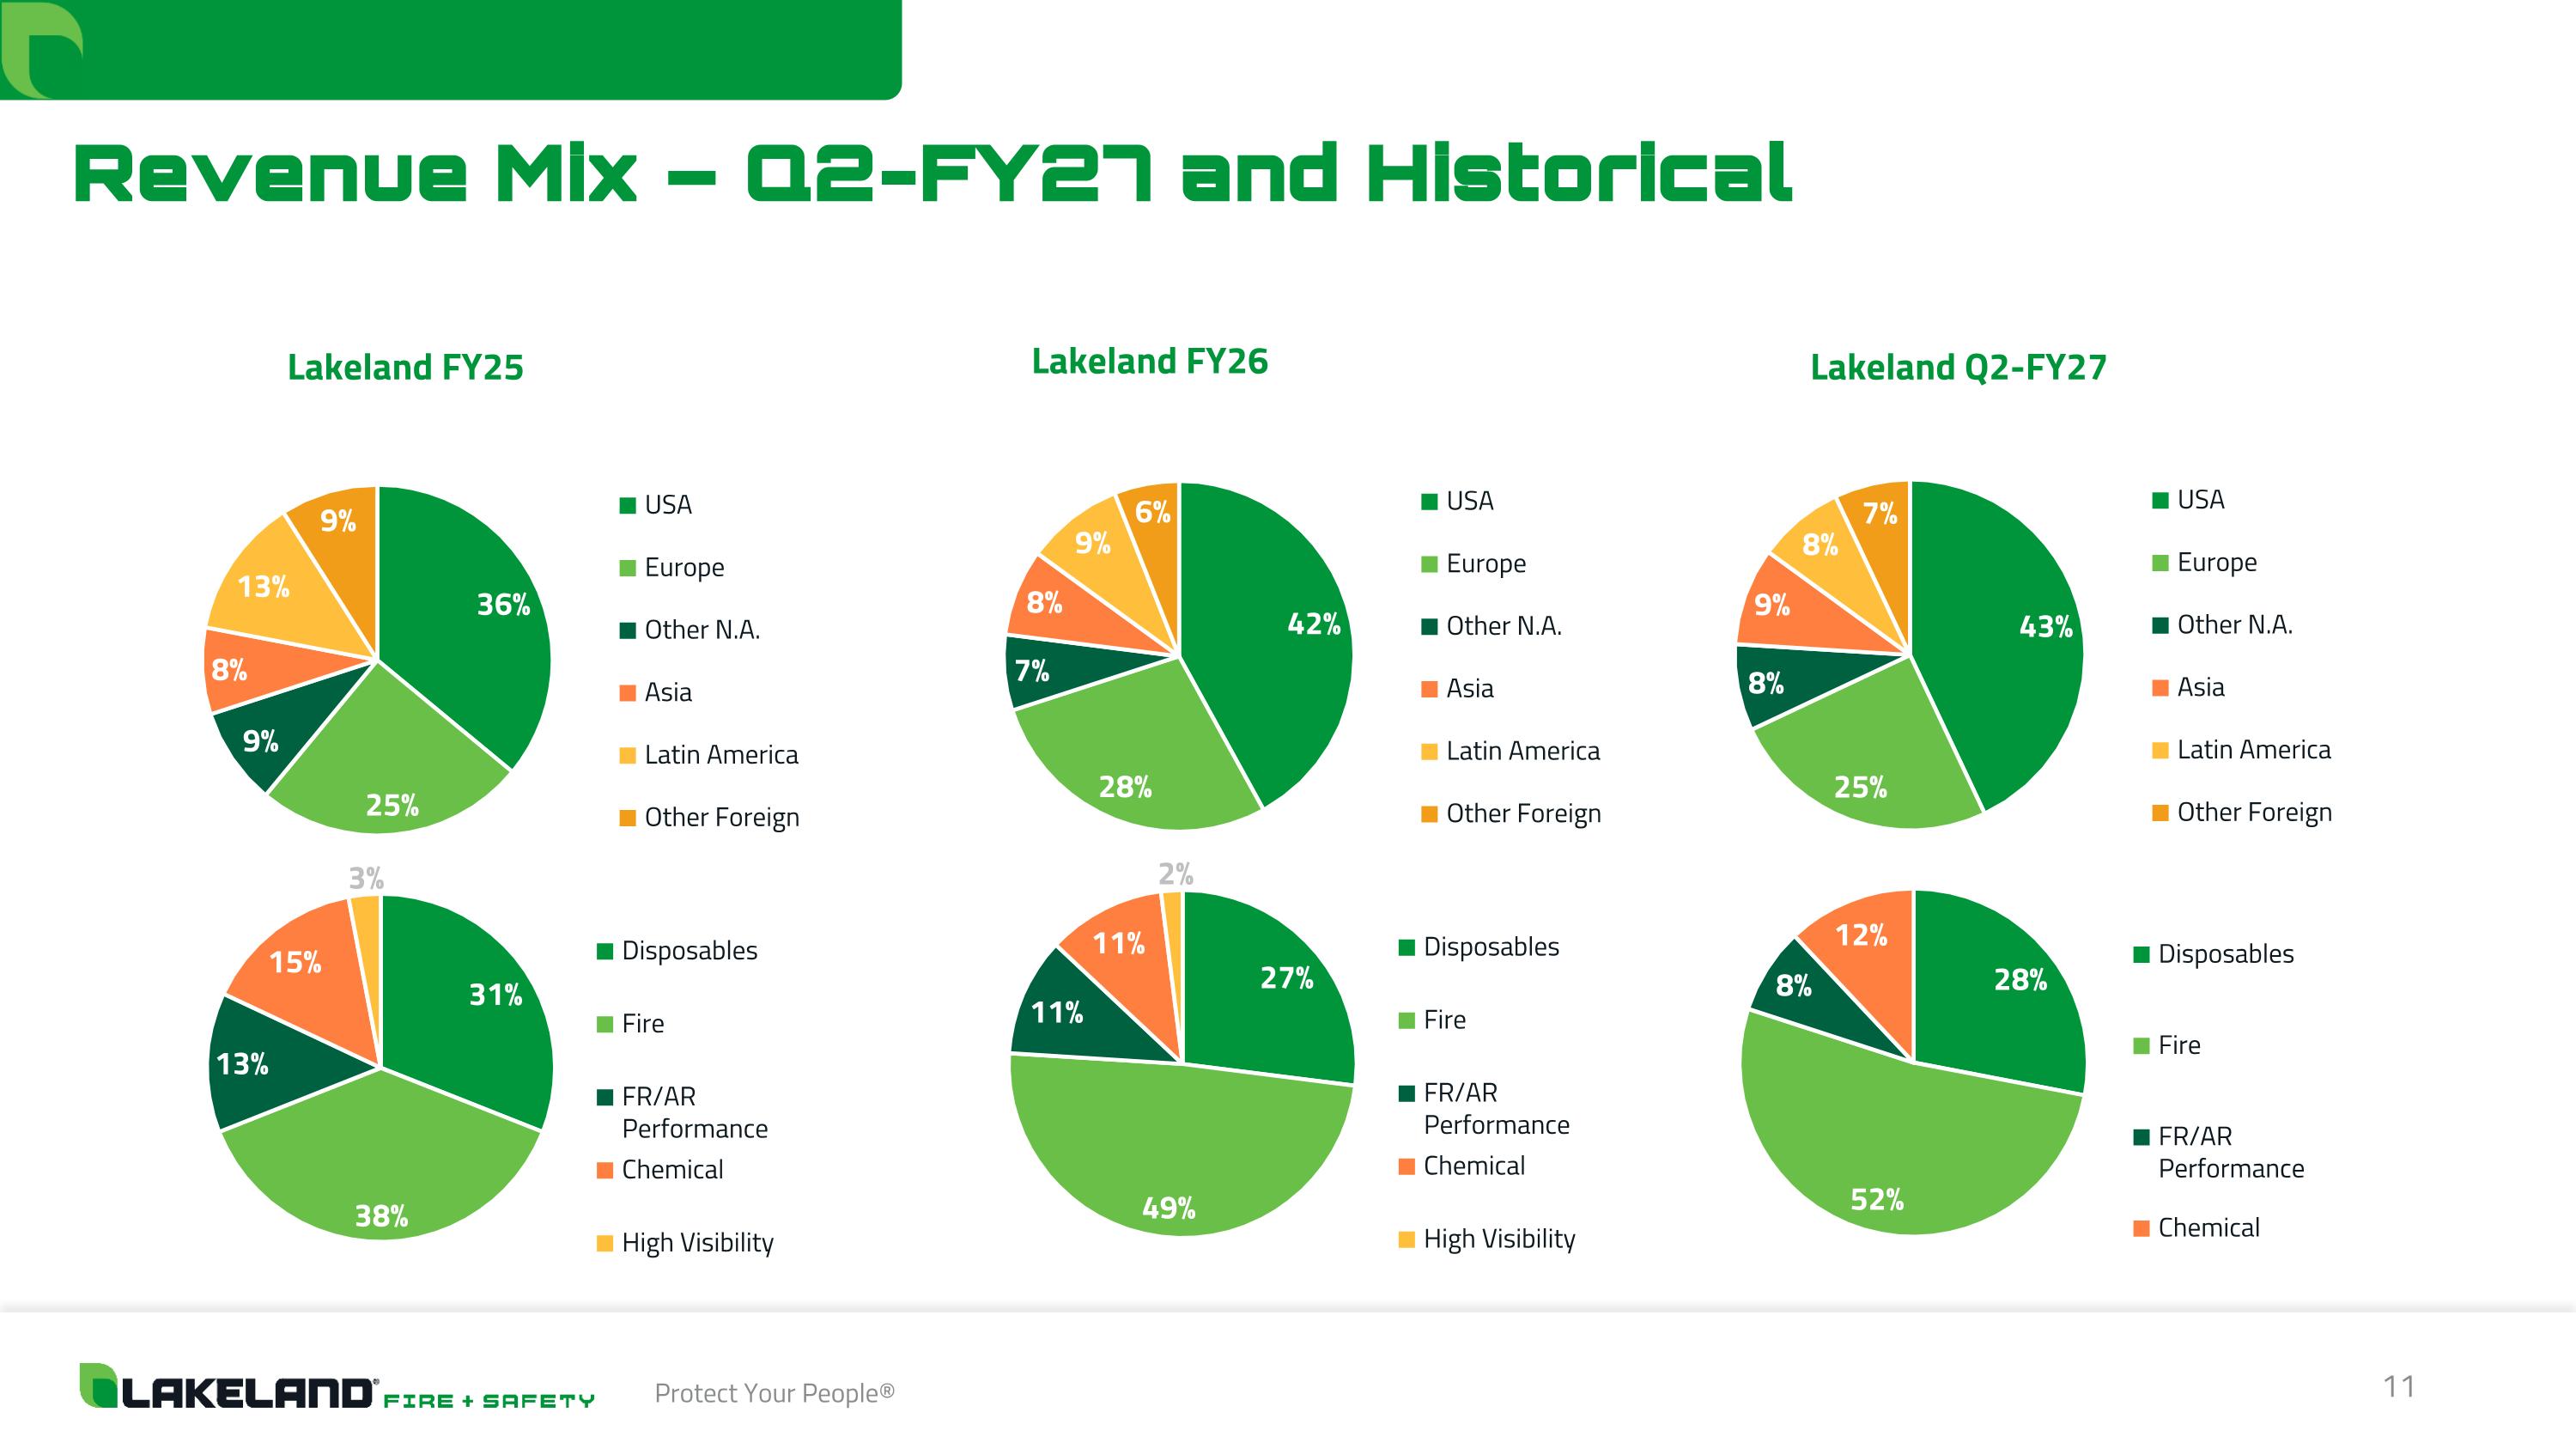
Revenue Mix – Q2-FY27 and Historical Lakeland FY25 Lakeland Q2-FY27 Lakeland FY26
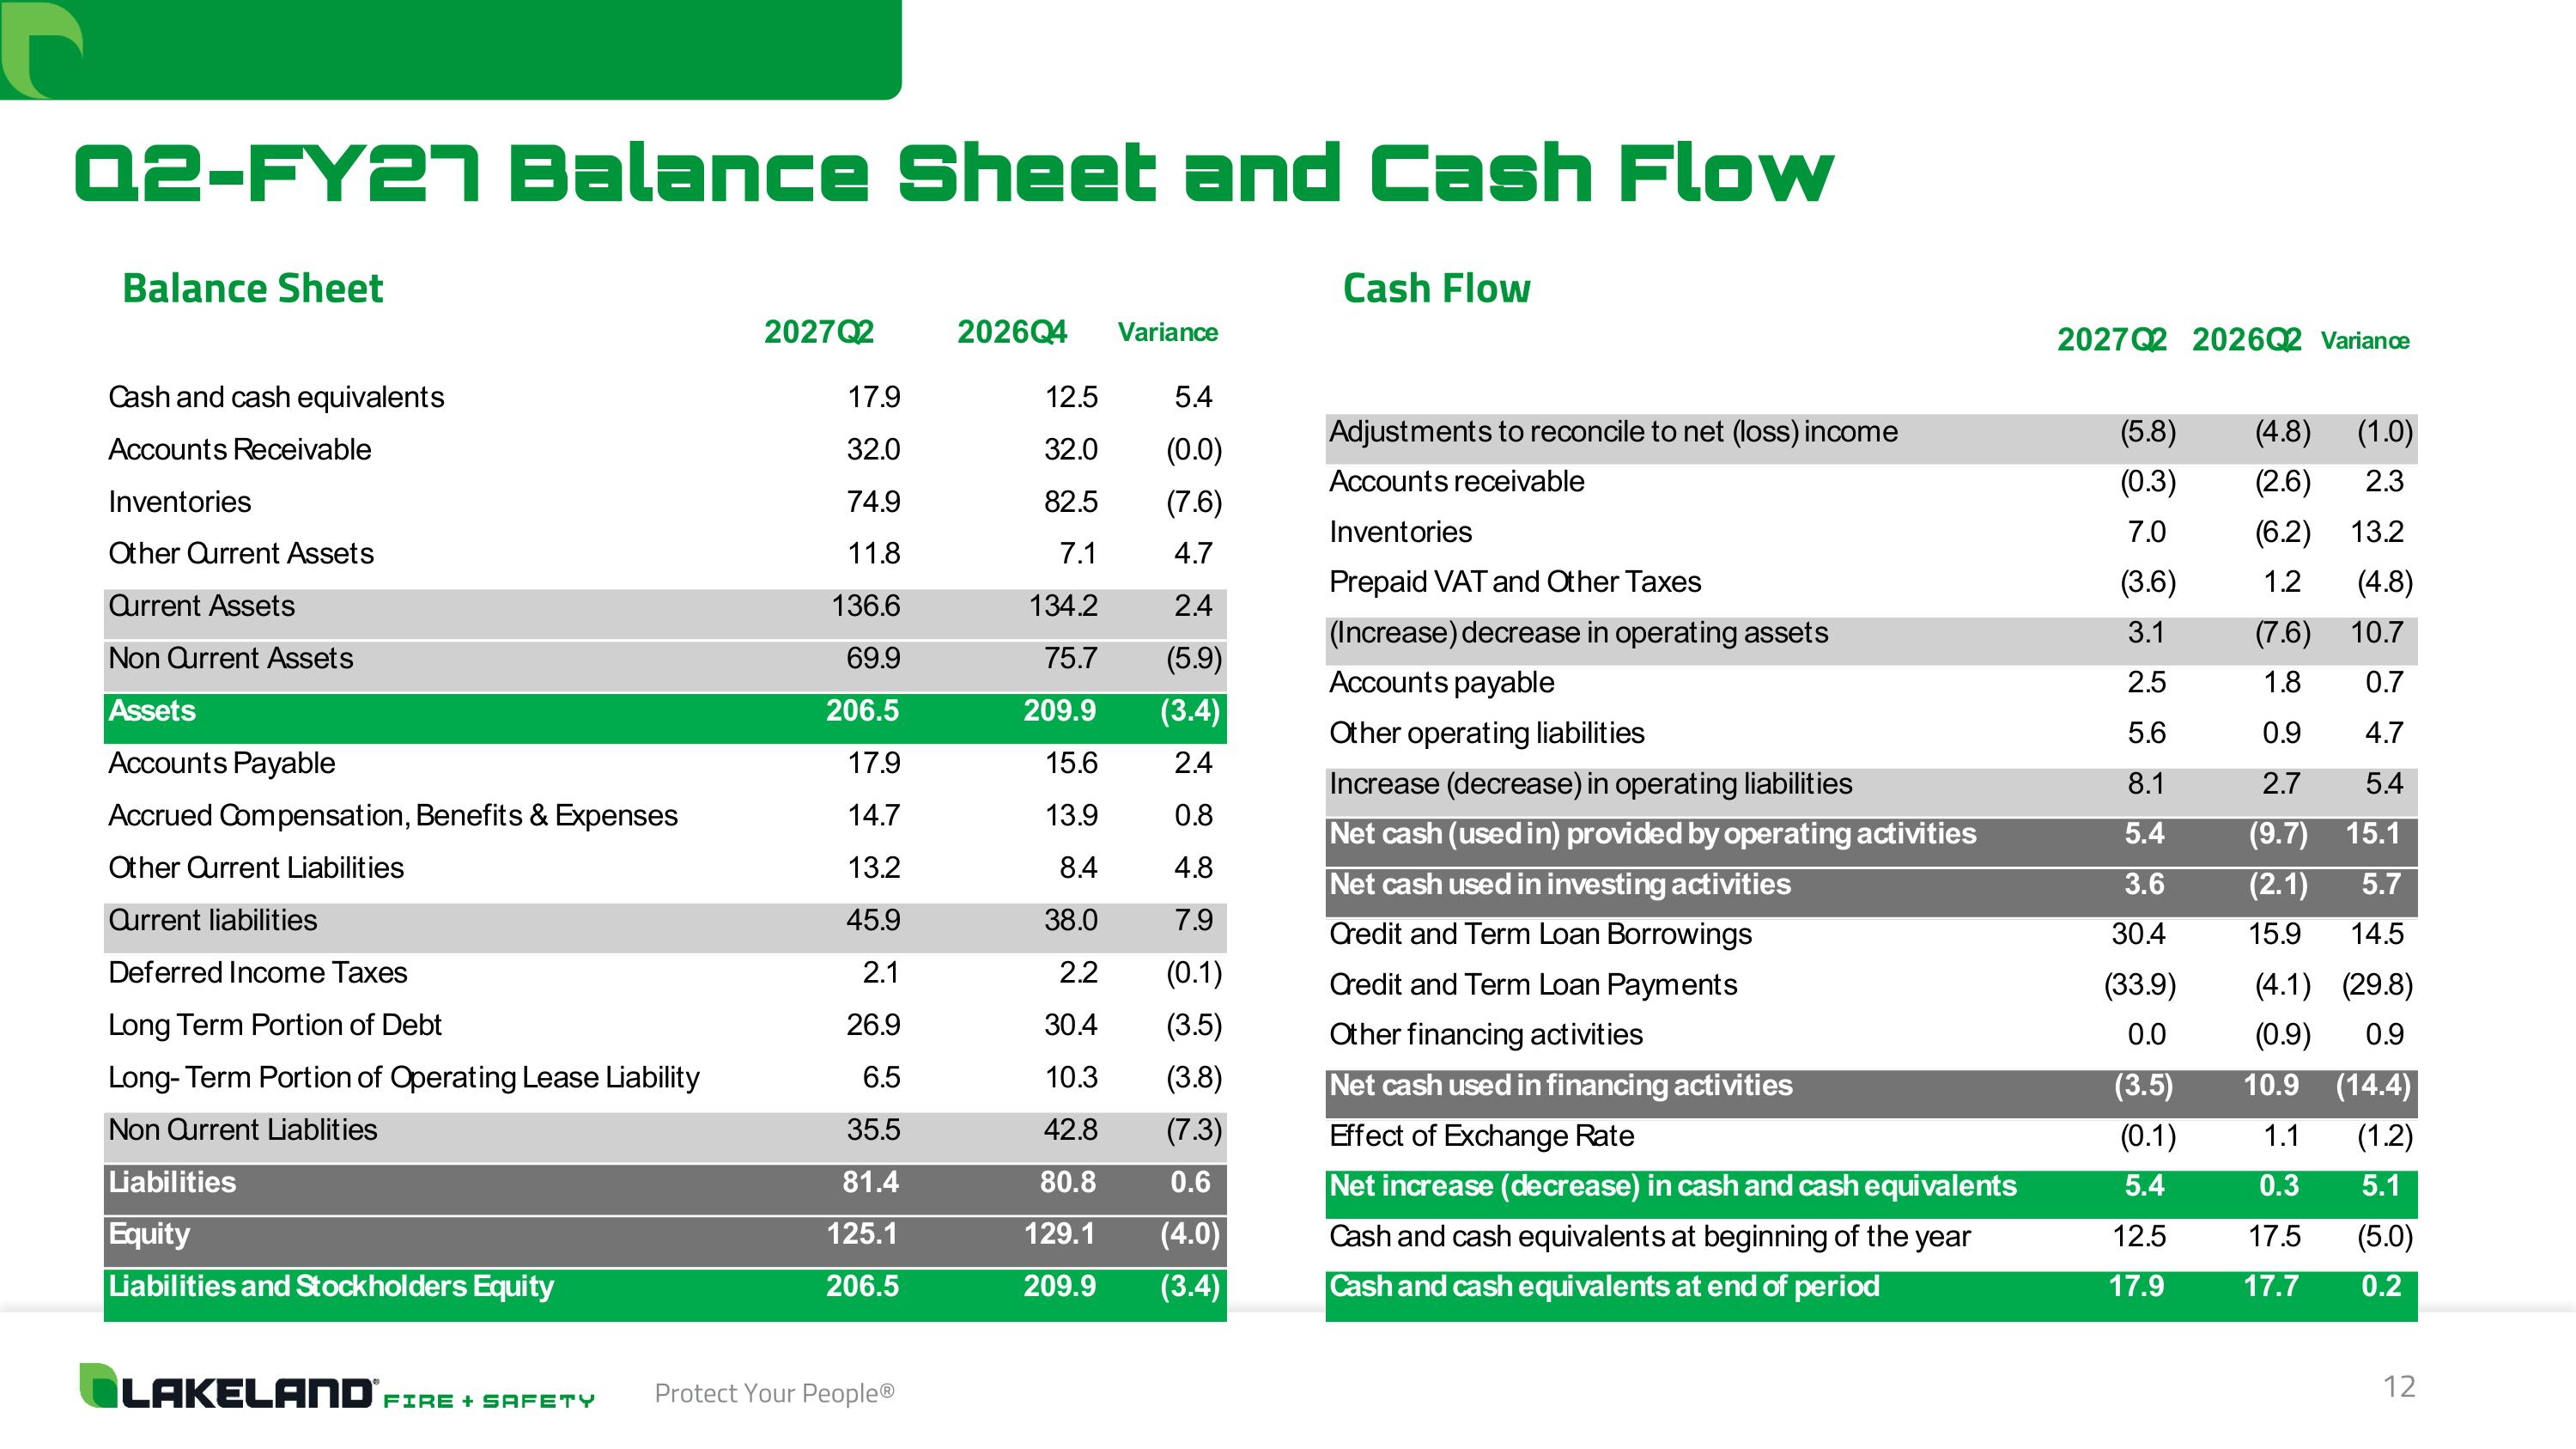
Q2-FY27 Balance Sheet and Cash Flow Balance Sheet Cash Flow
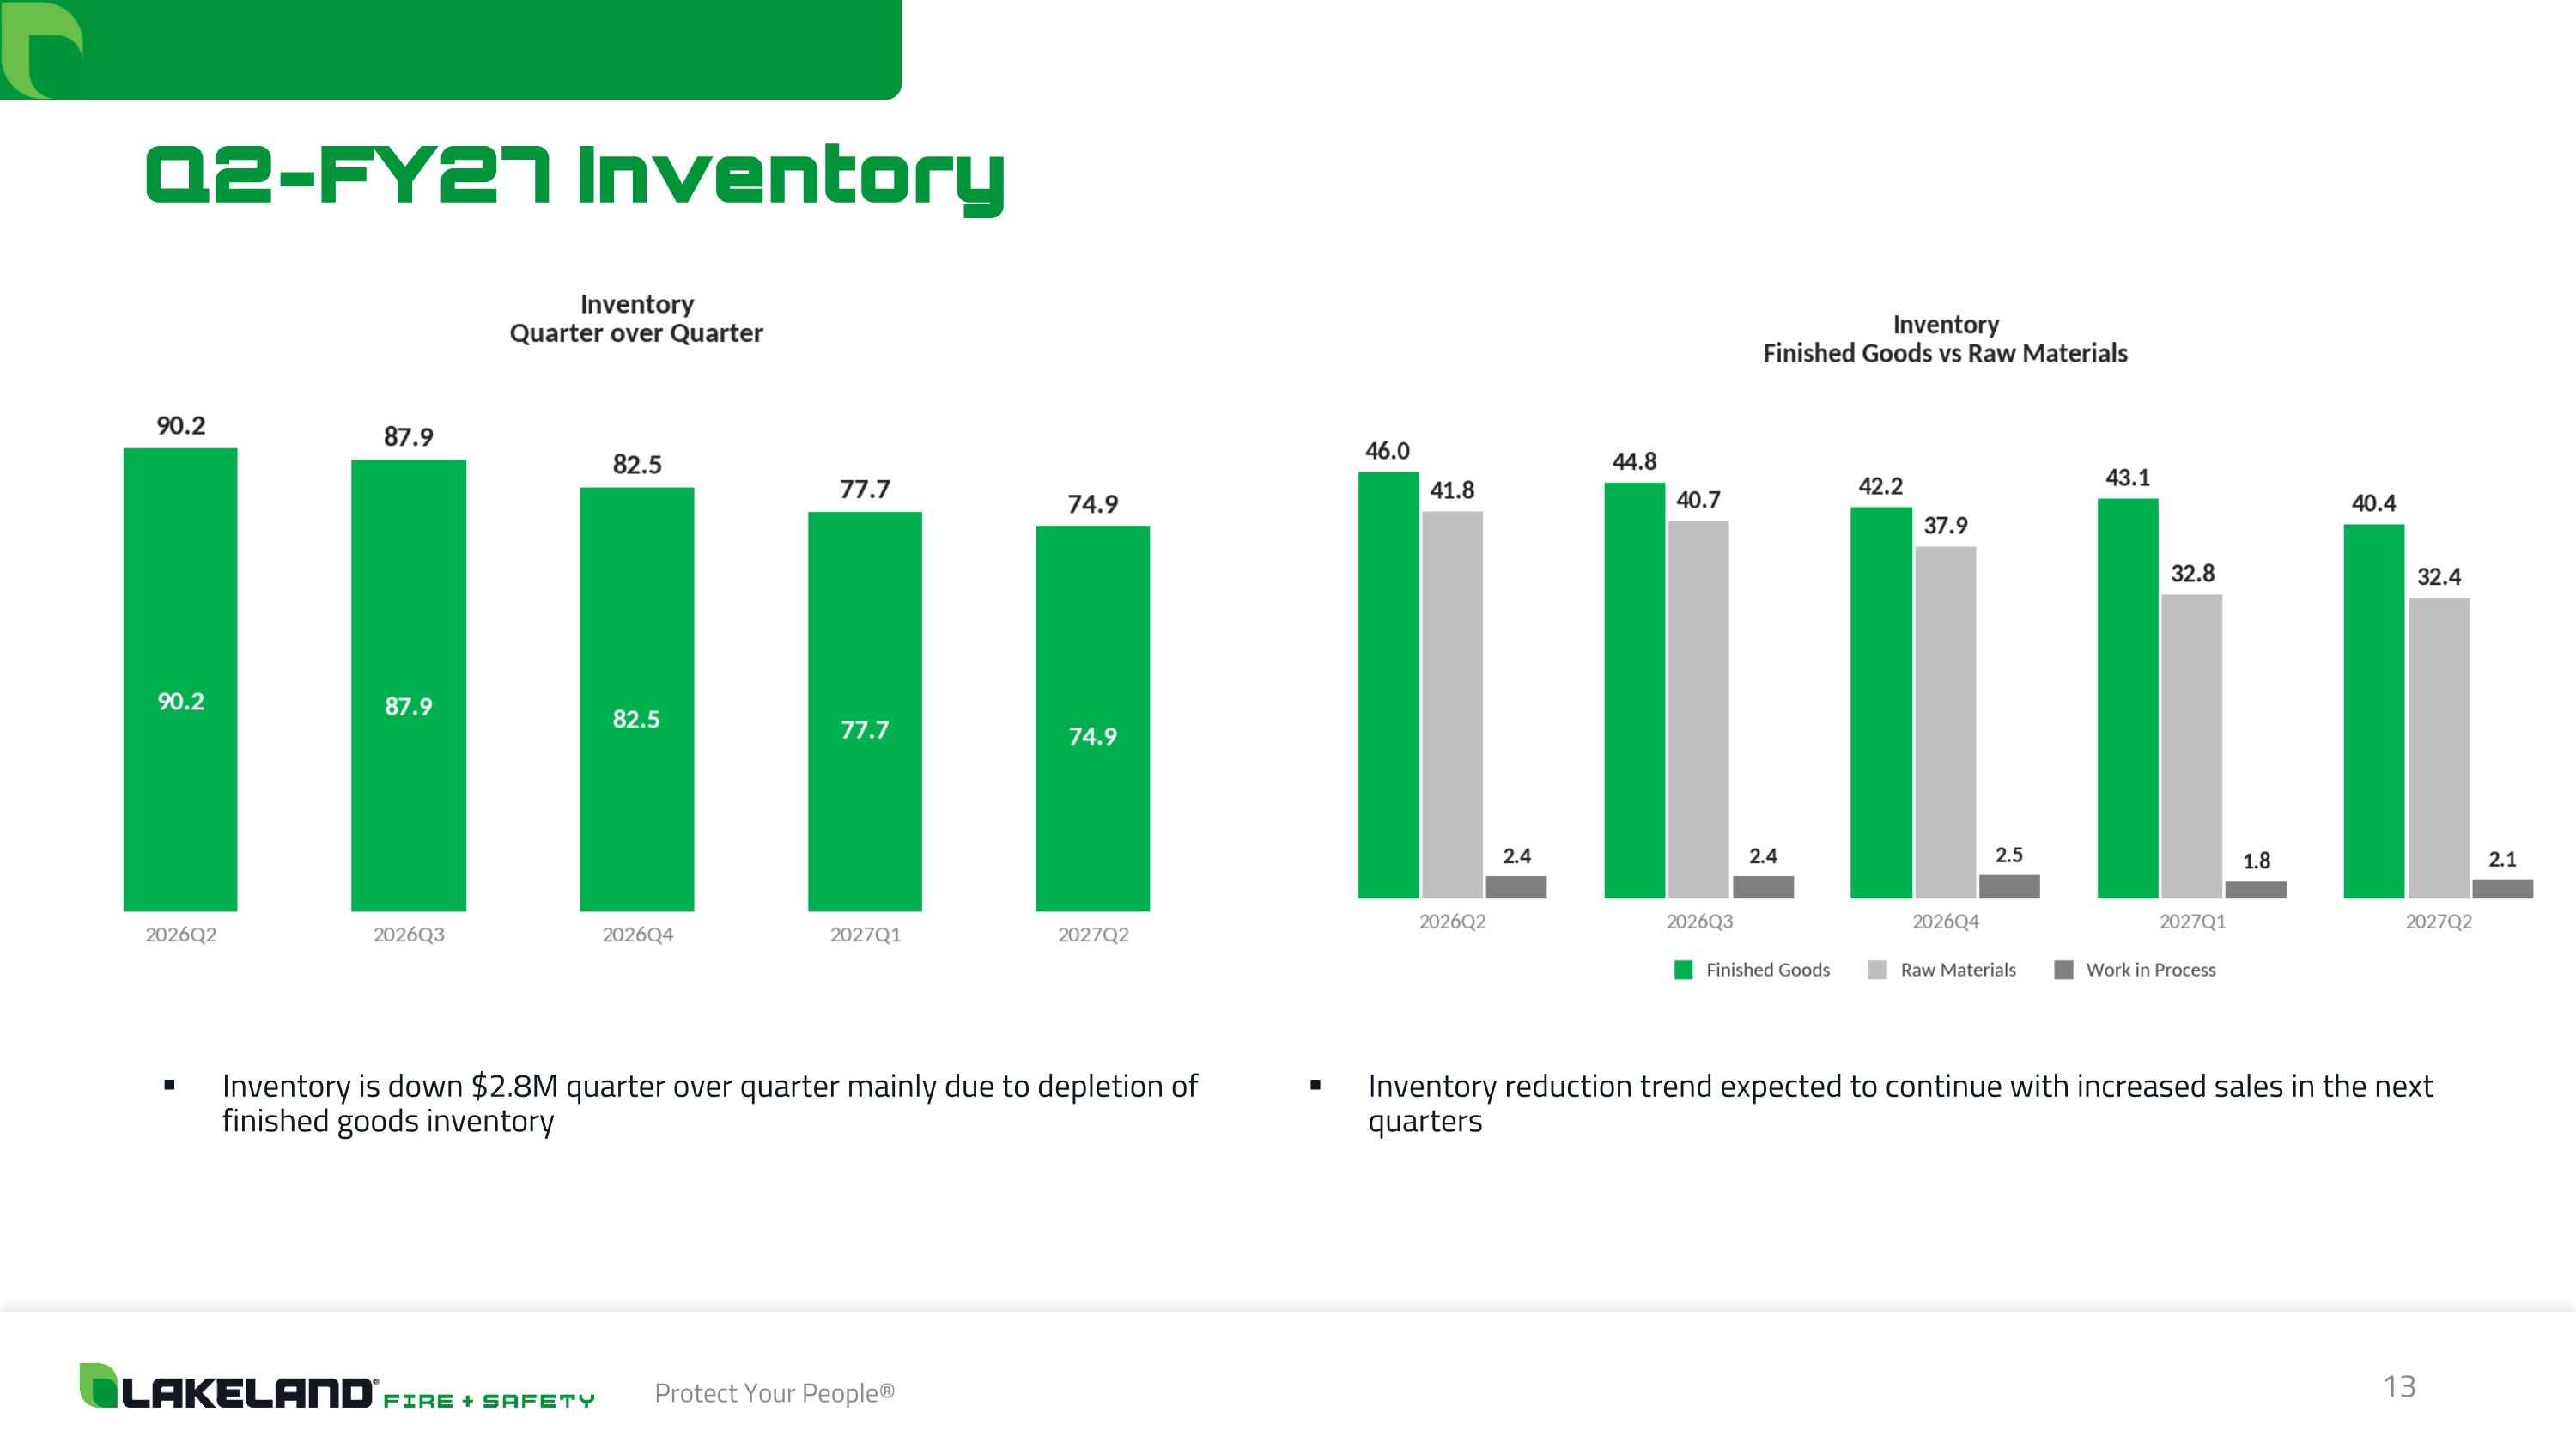
Q2-FY27 Inventory Inventory is down $2.8M quarter over quarter mainly due to depletion of finished goods inventory Inventory reduction trend expected to continue with increased sales in the next quarters
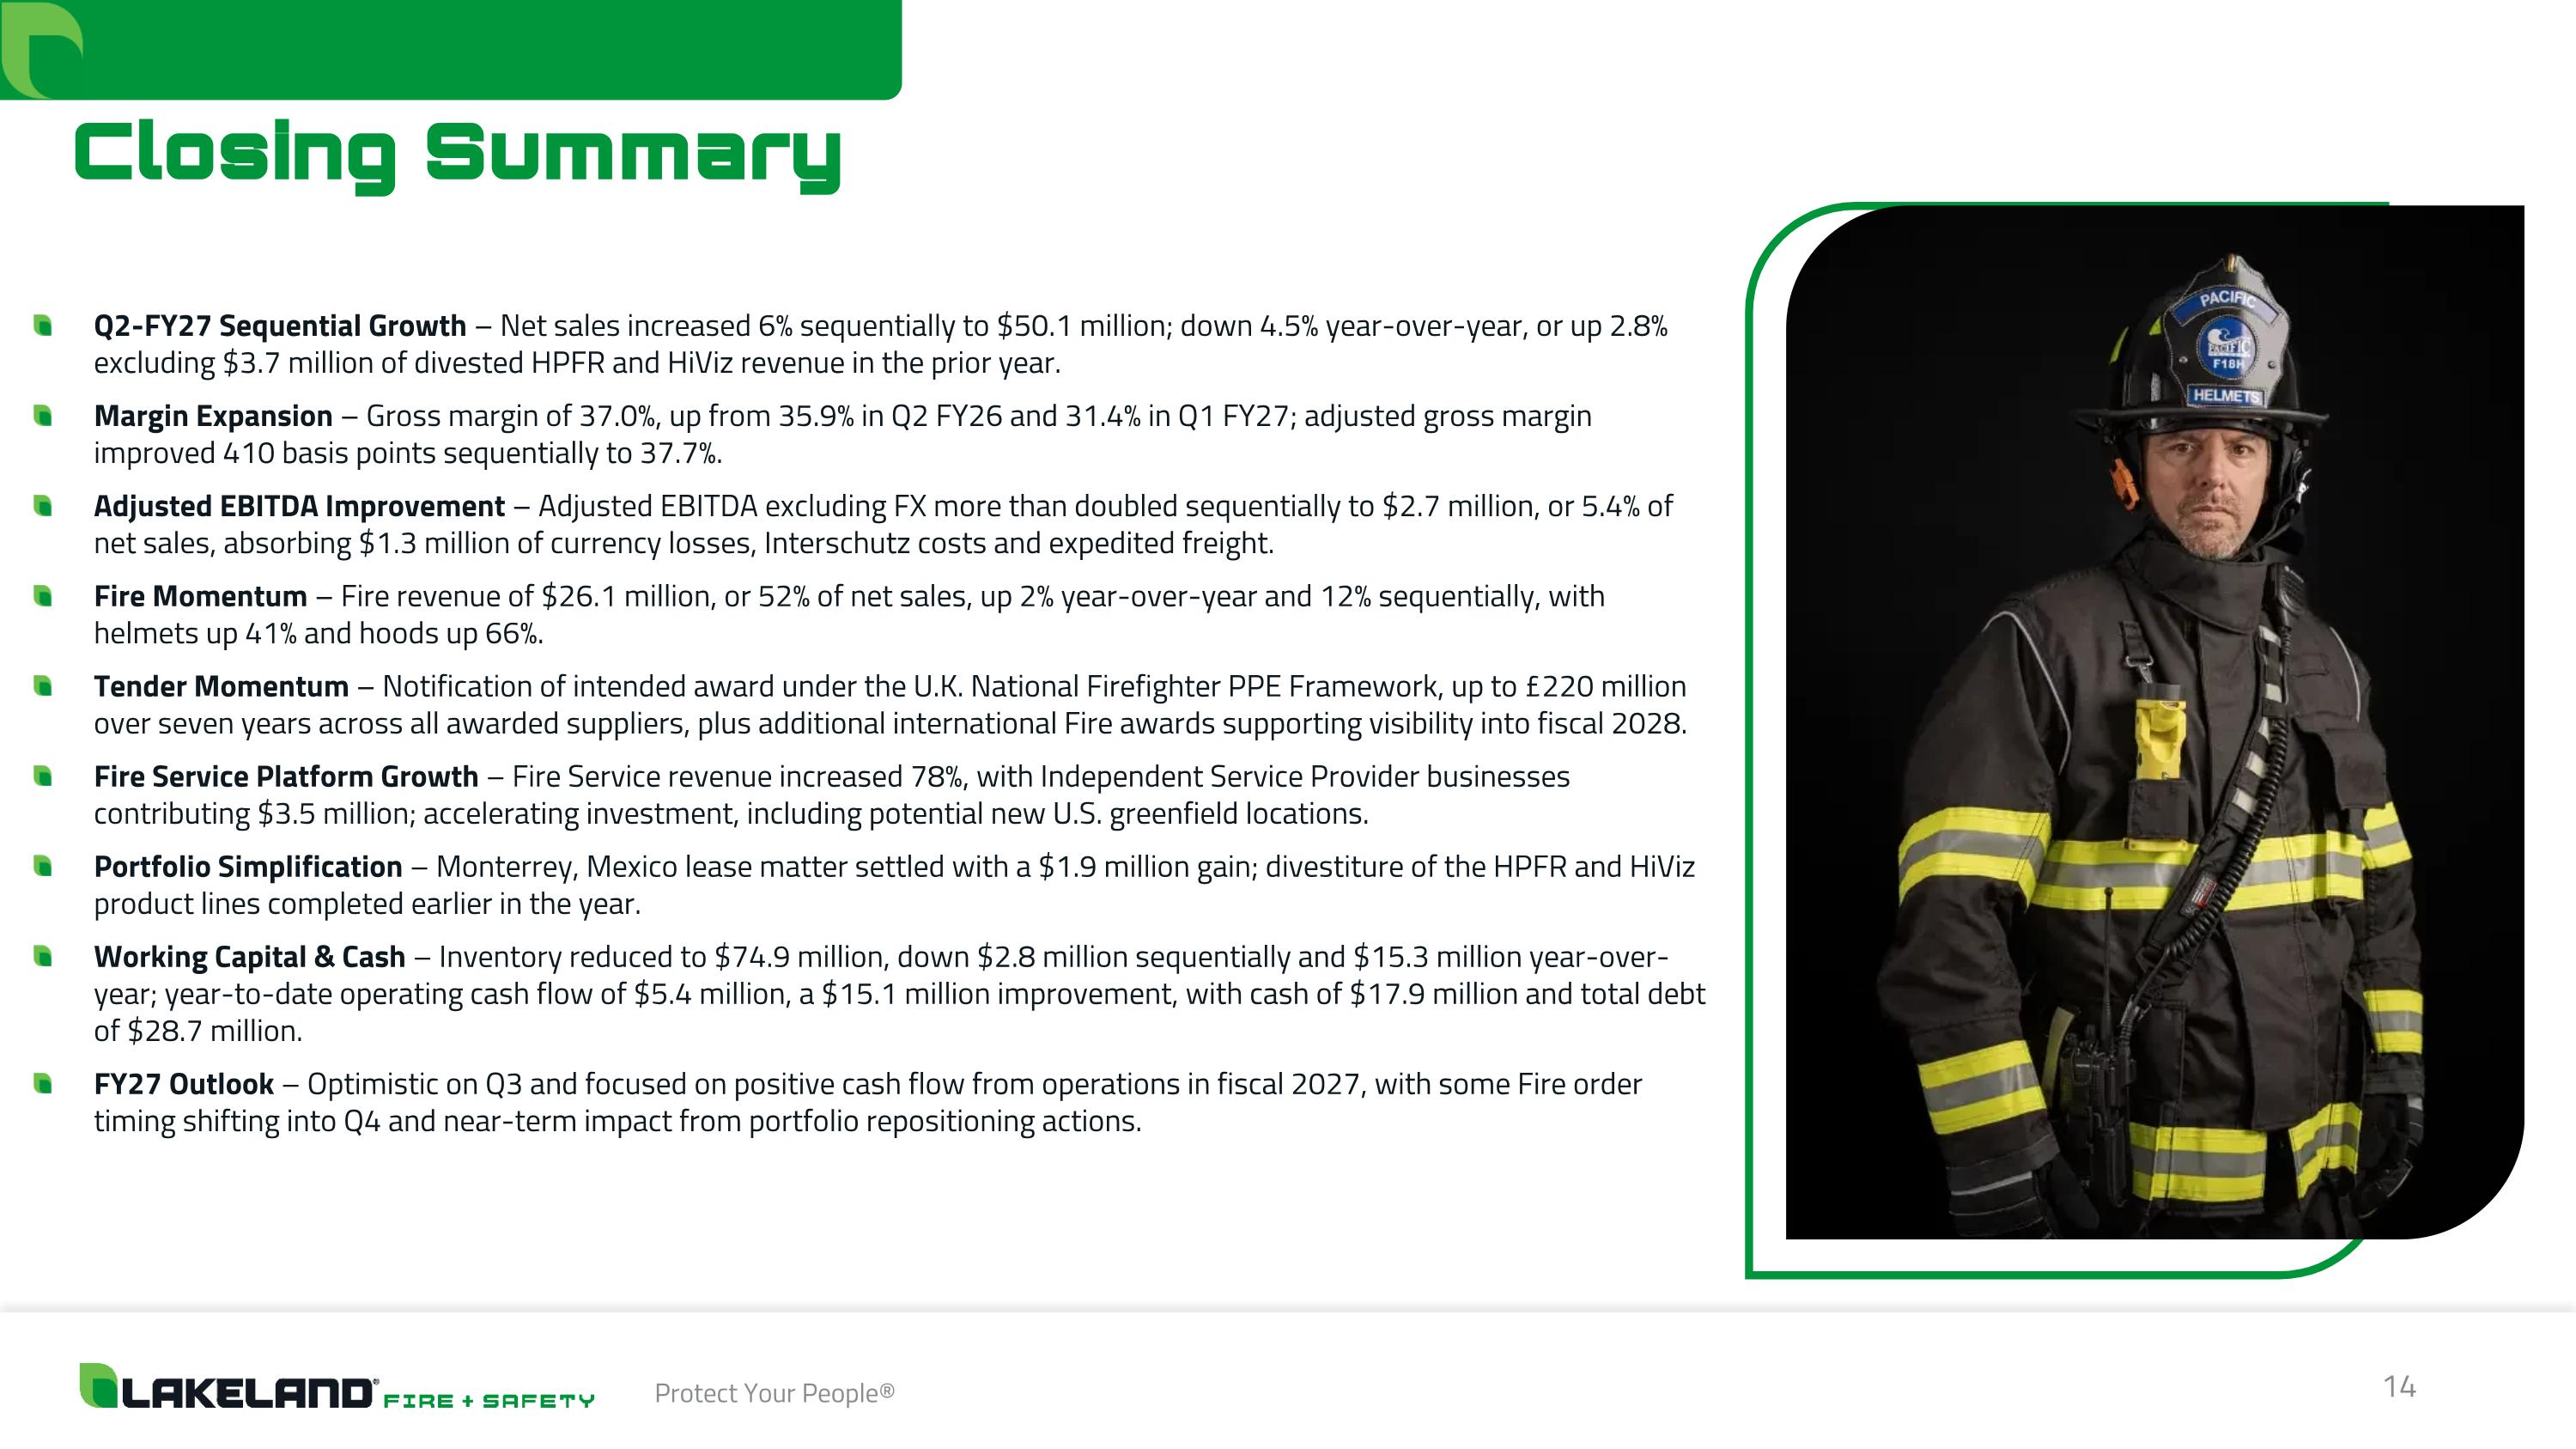
Closing Summary Q2-FY27 Sequential Growth – Net sales increased 6% sequentially to $50.1 million; down 4.5% year-over-year, or up 2.8% excluding $3.7 million of divested HPFR and HiViz revenue in the prior year. Margin Expansion – Gross margin of 37.0%, up from 35.9% in Q2 FY26 and 31.4% in Q1 FY27; adjusted gross margin improved 410 basis points sequentially to 37.7%. Adjusted EBITDA Improvement – Adjusted EBITDA excluding FX more than doubled sequentially to $2.7 million, or 5.4% of net sales, absorbing $1.3 million of currency losses, Interschutz costs and expedited freight. Fire Momentum – Fire revenue of $26.1 million, or 52% of net sales, up 2% year-over-year and 12% sequentially, with helmets up 41% and hoods up 66%. Tender Momentum – Notification of intended award under the U.K. National Firefighter PPE Framework, up to £220 million over seven years across all awarded suppliers, plus additional international Fire awards supporting visibility into fiscal 2028. Fire Service Platform Growth – Fire Service revenue increased 78%, with Independent Service Provider businesses contributing $3.5 million; accelerating investment, including potential new U.S. greenfield locations. Portfolio Simplification – Monterrey, Mexico lease matter settled with a $1.9 million gain; divestiture of the HPFR and HiViz product lines completed earlier in the year. Working Capital & Cash – Inventory reduced to $74.9 million, down $2.8 million sequentially and $15.3 million year-over-year; year-to-date operating cash flow of $5.4 million, a $15.1 million improvement, with cash of $17.9 million and total debt of $28.7 million. FY27 Outlook – Optimistic on Q3 and focused on positive cash flow from operations in fiscal 2027, with some Fire order timing shifting into Q4 and near-term impact from portfolio repositioning actions.

NASDAQ: LAKE www.lakeland.com Investor Relations Chris Tyson MZ Group 949-491-8235 LAKE@mzgroup.us Company 1525 Perimeter Parkway Suite 325 Huntsville, AL 35806
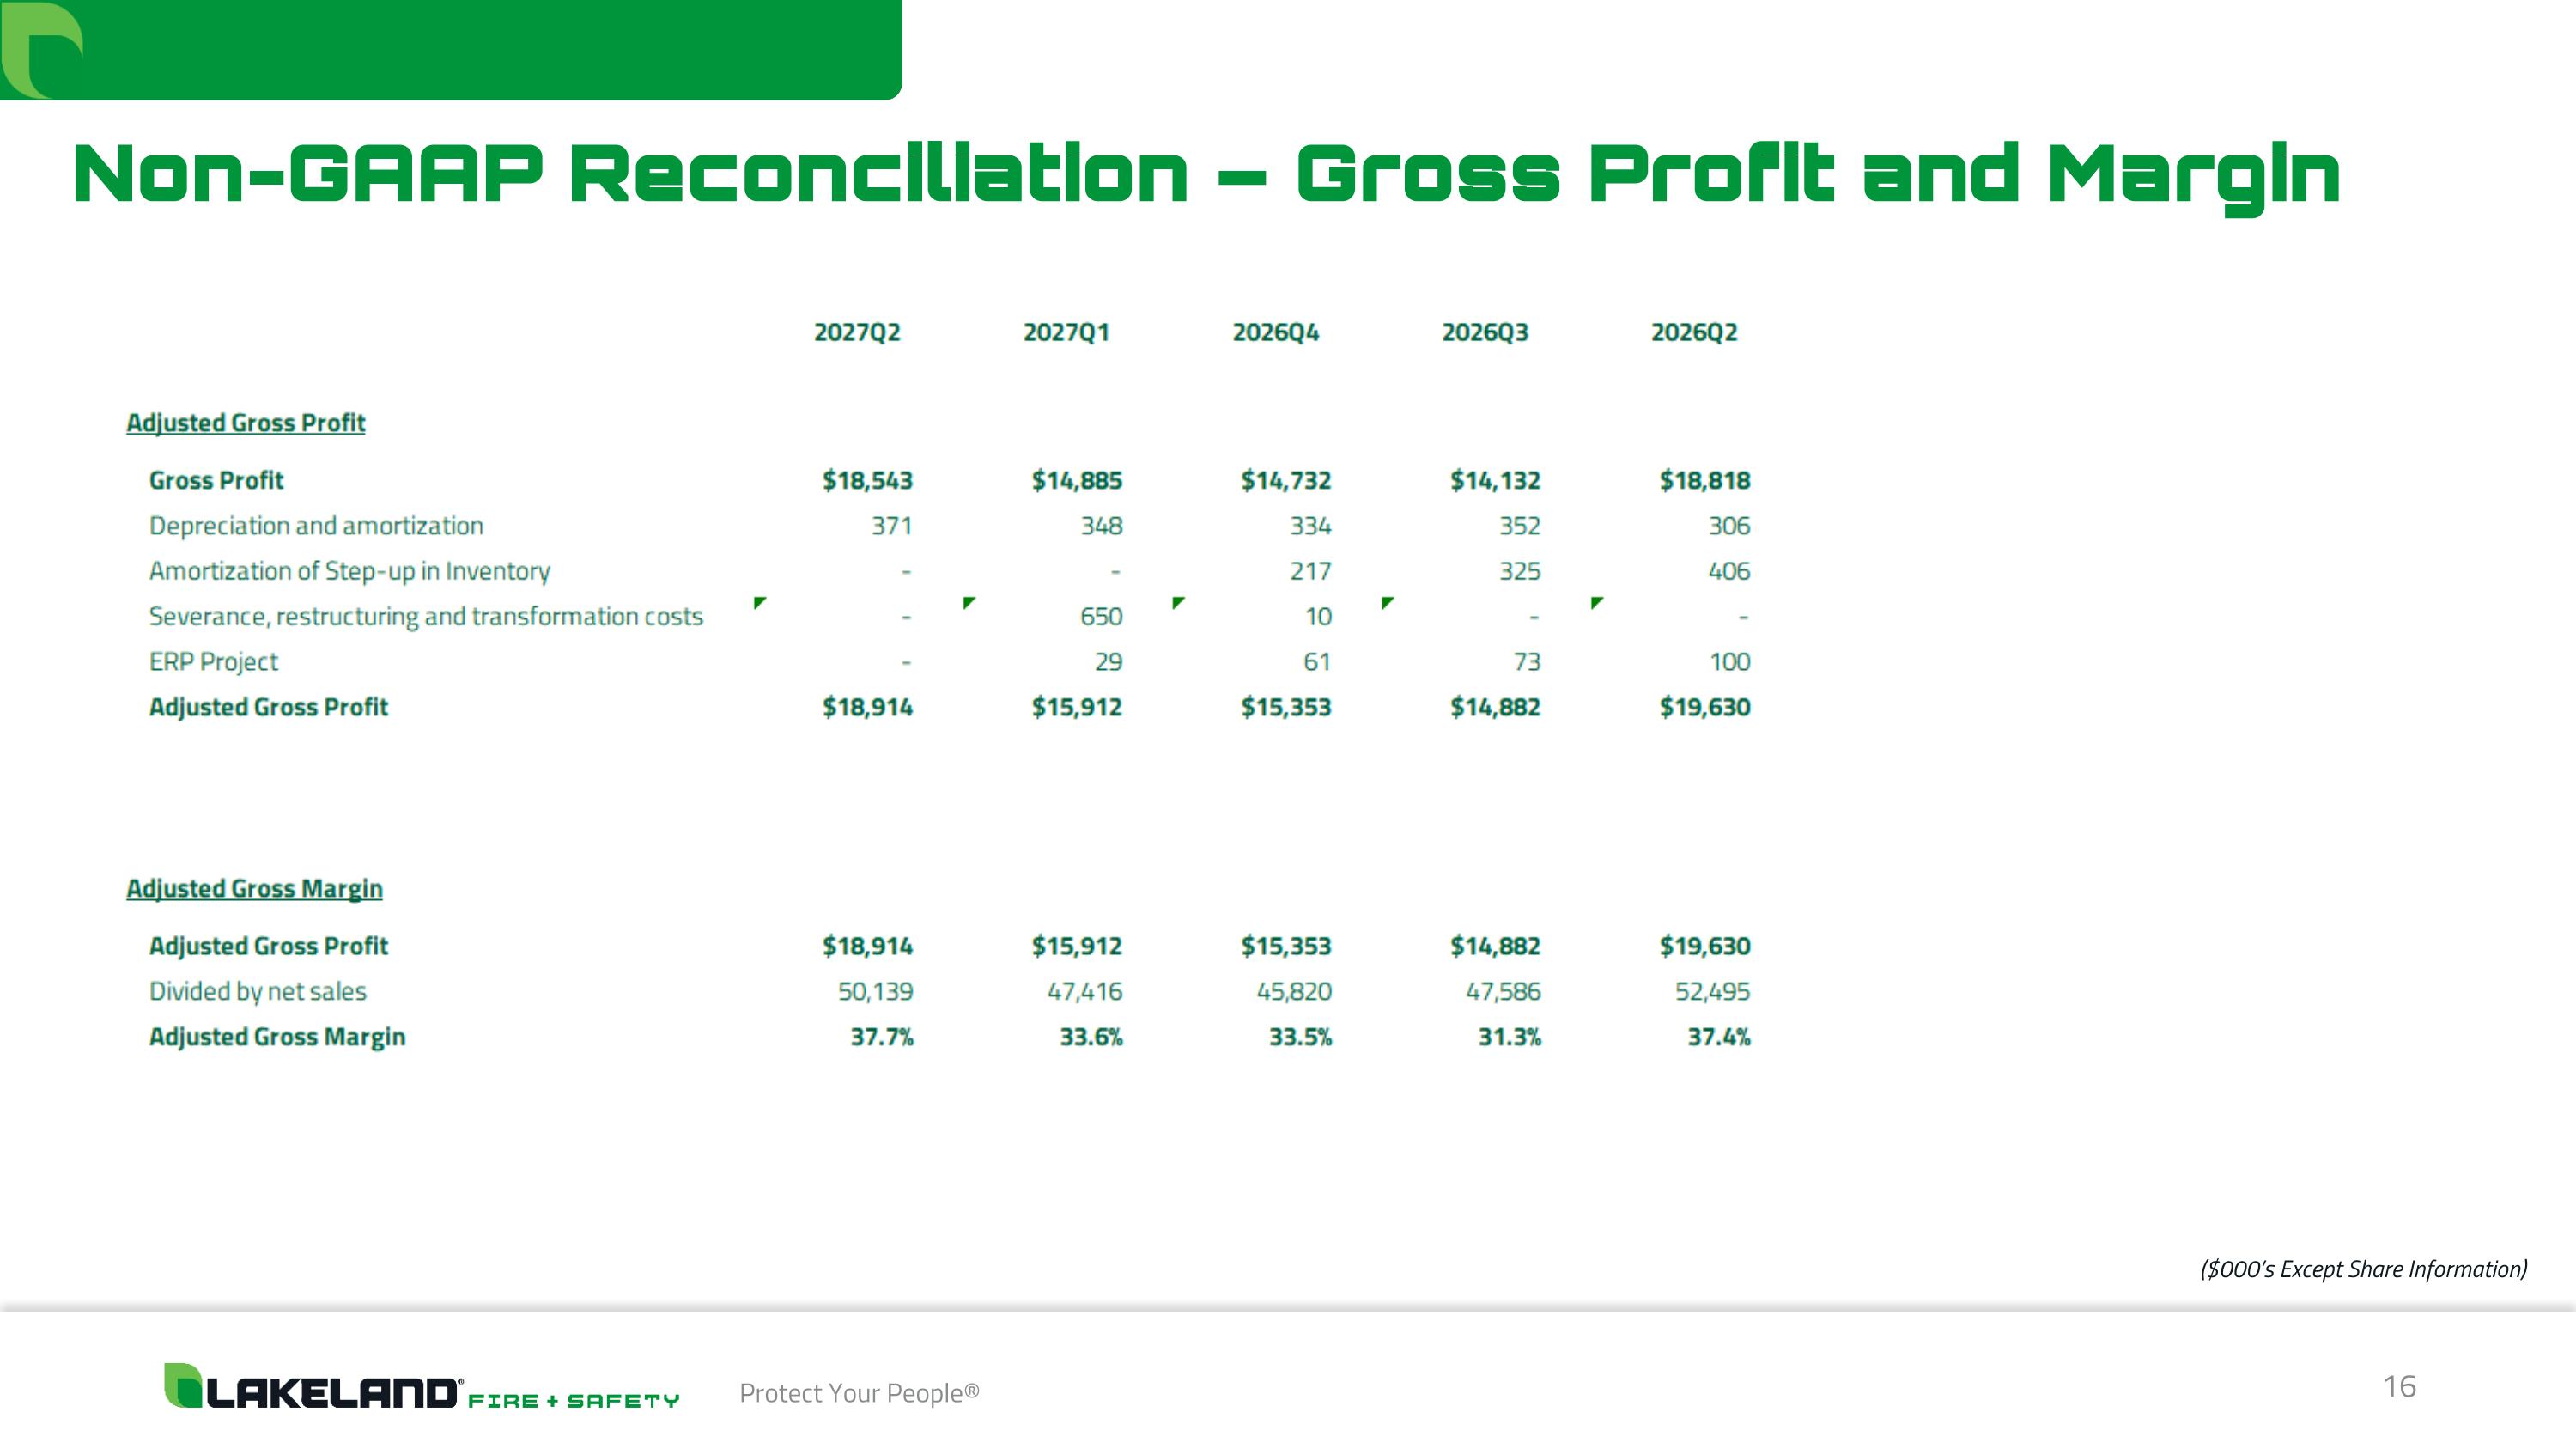
16 Protect Your People® Non-GAAP Reconciliation – Gross Profit and Margin ($000’s Except Share Information)
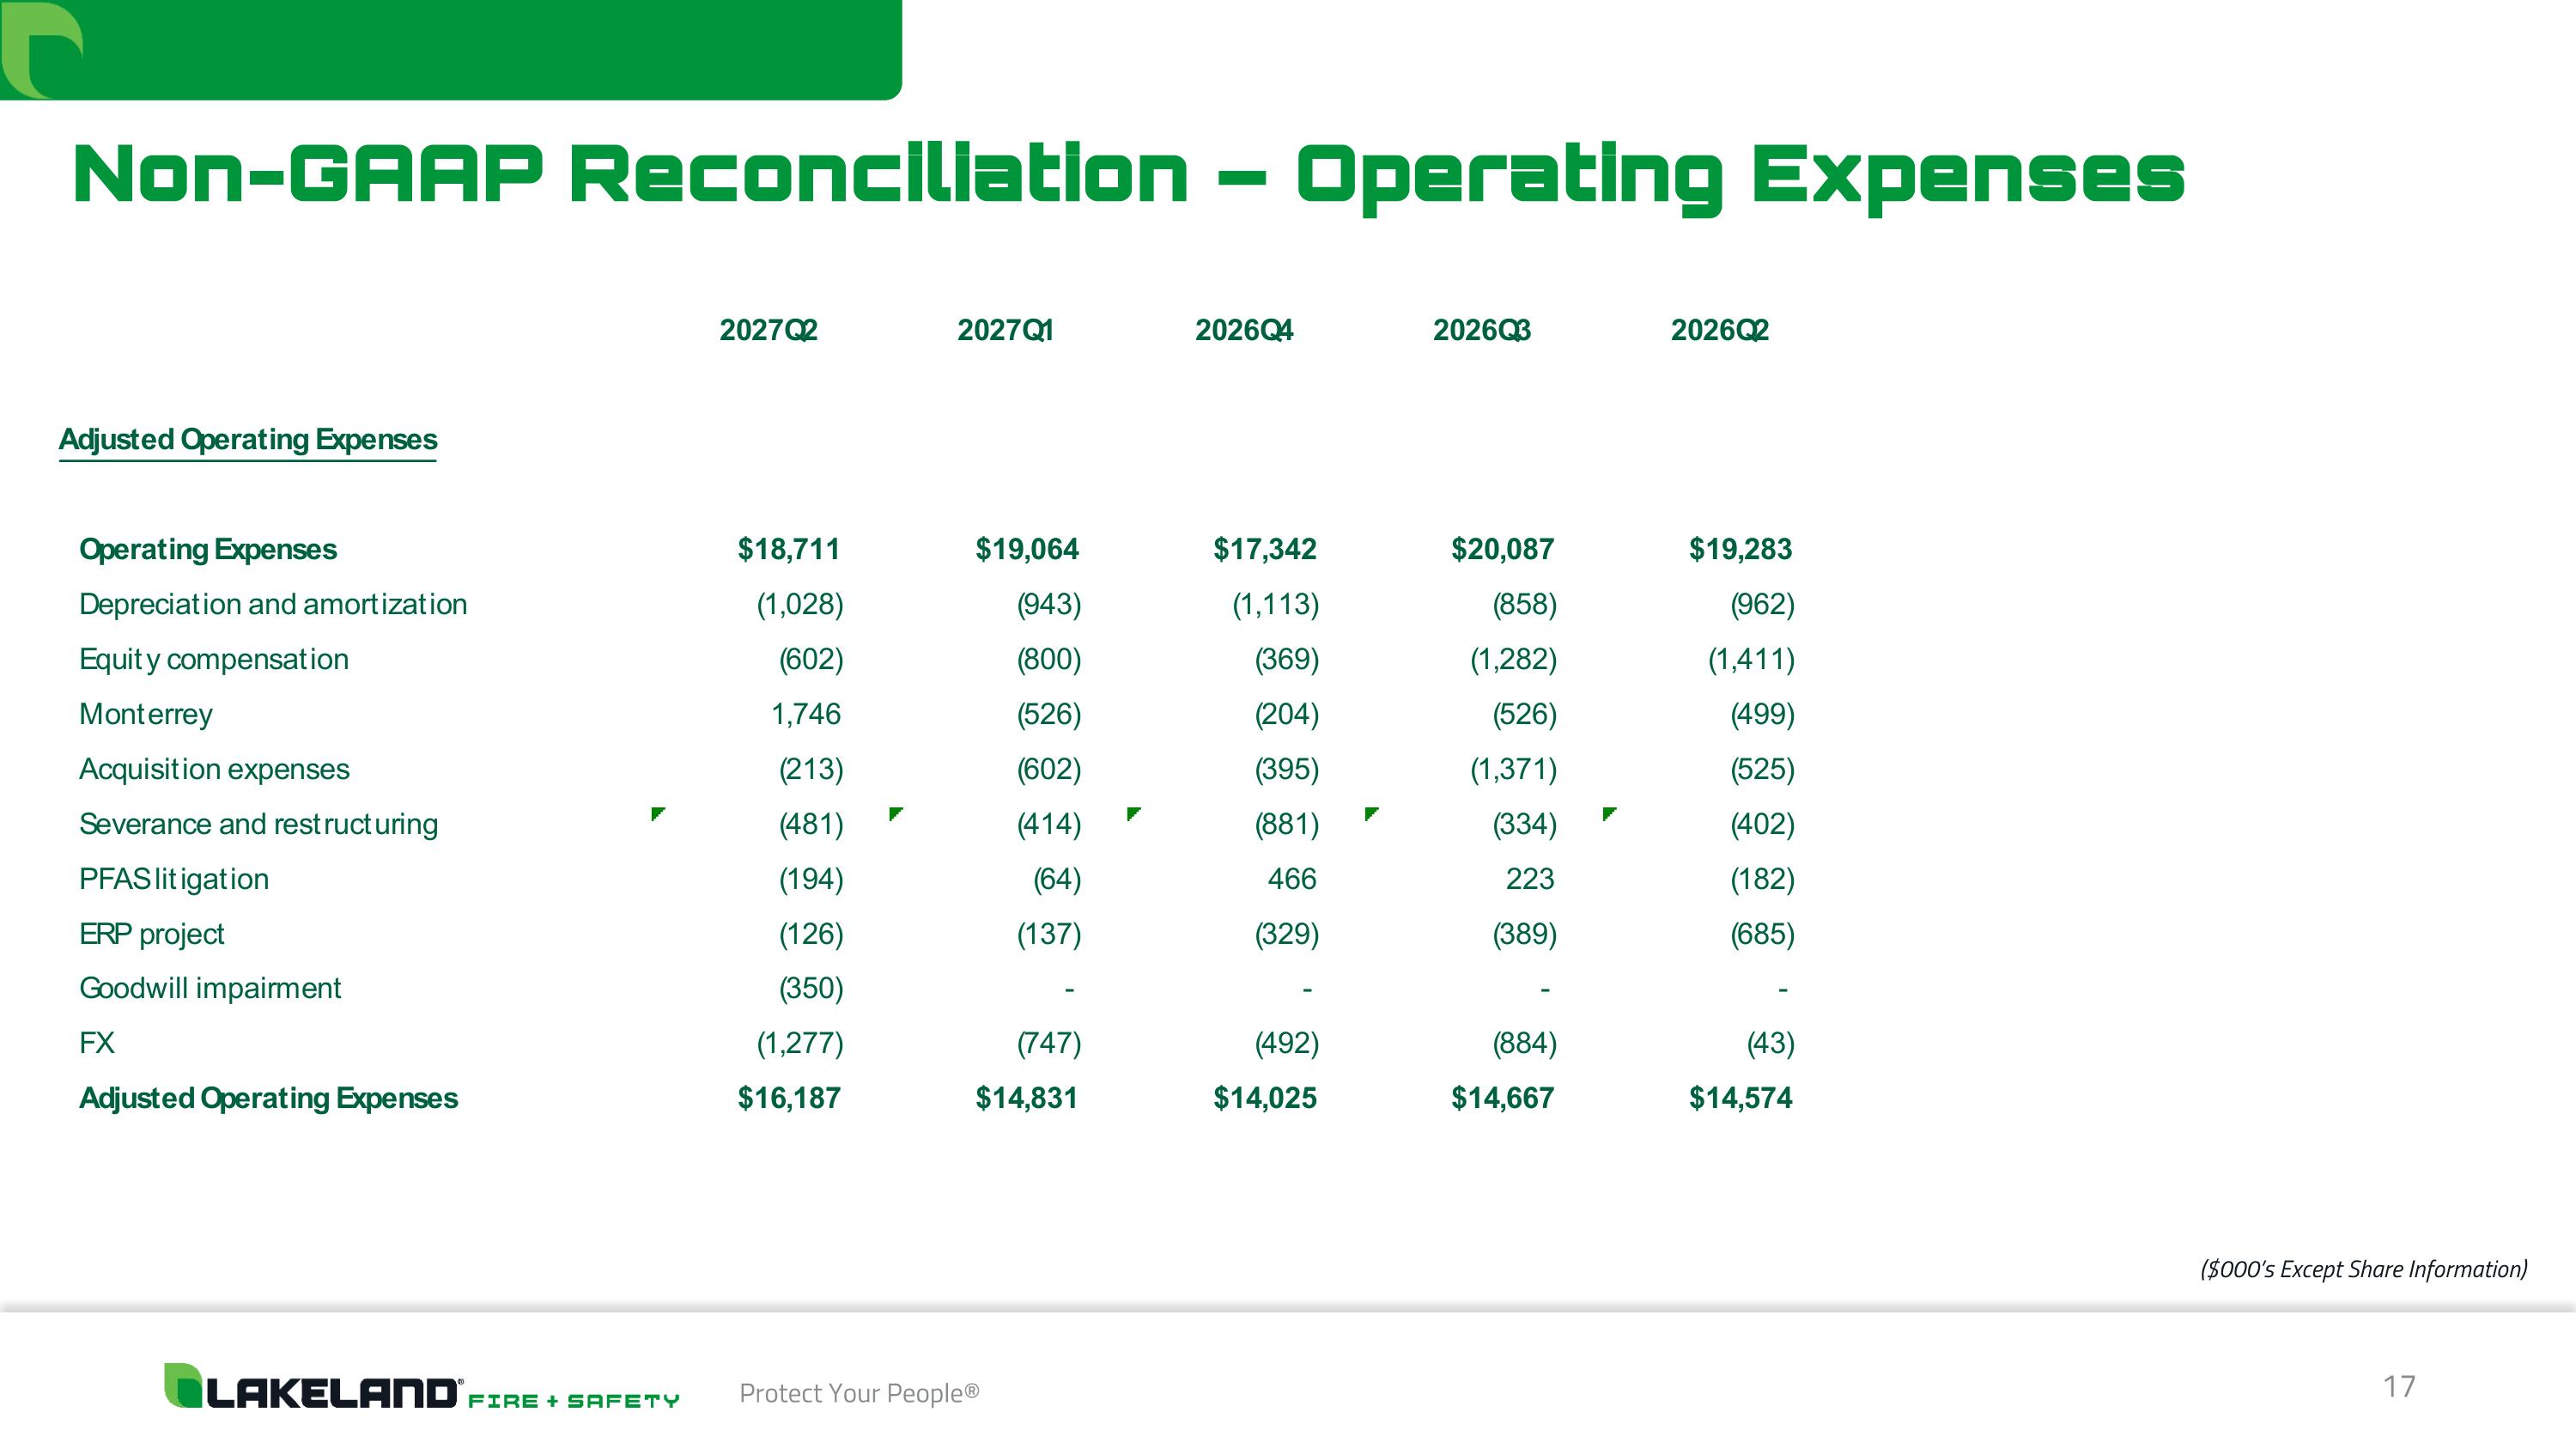
17 Protect Your People® Non-GAAP Reconciliation – Operating Expenses ($000’s Except Share Information)
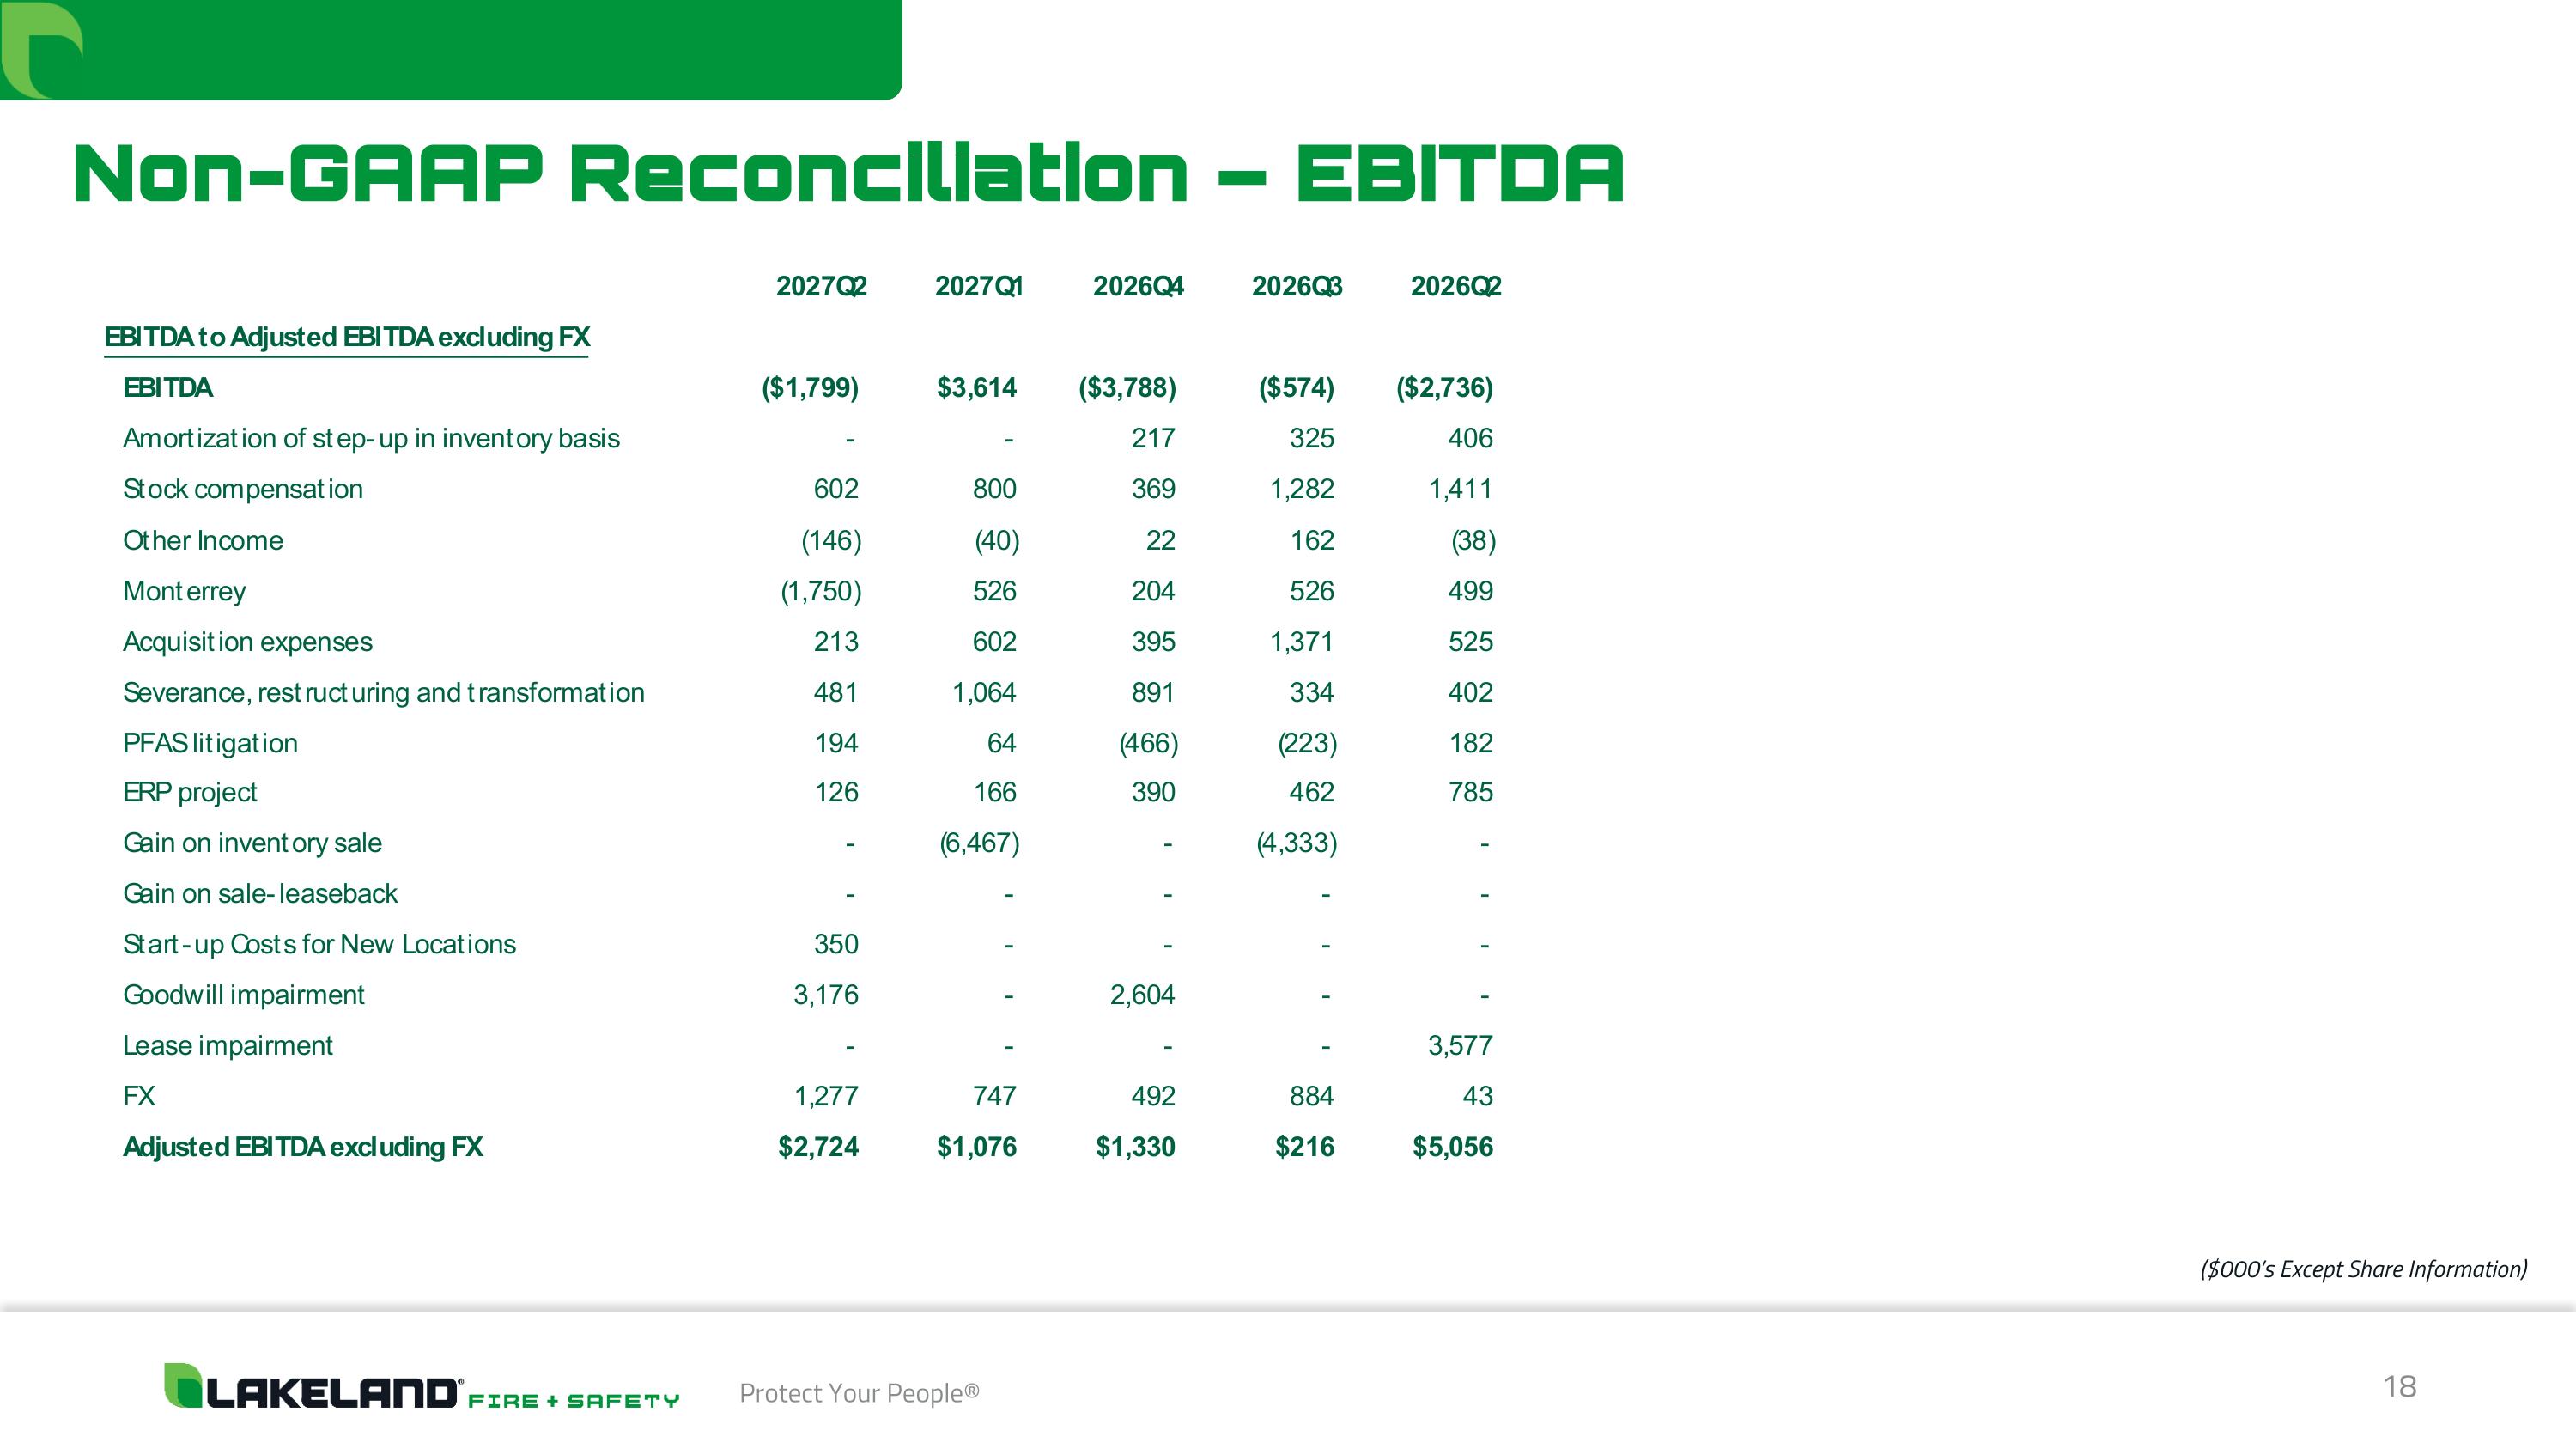
18 Protect Your People® Non-GAAP Reconciliation – EBITDA ($000’s Except Share Information)
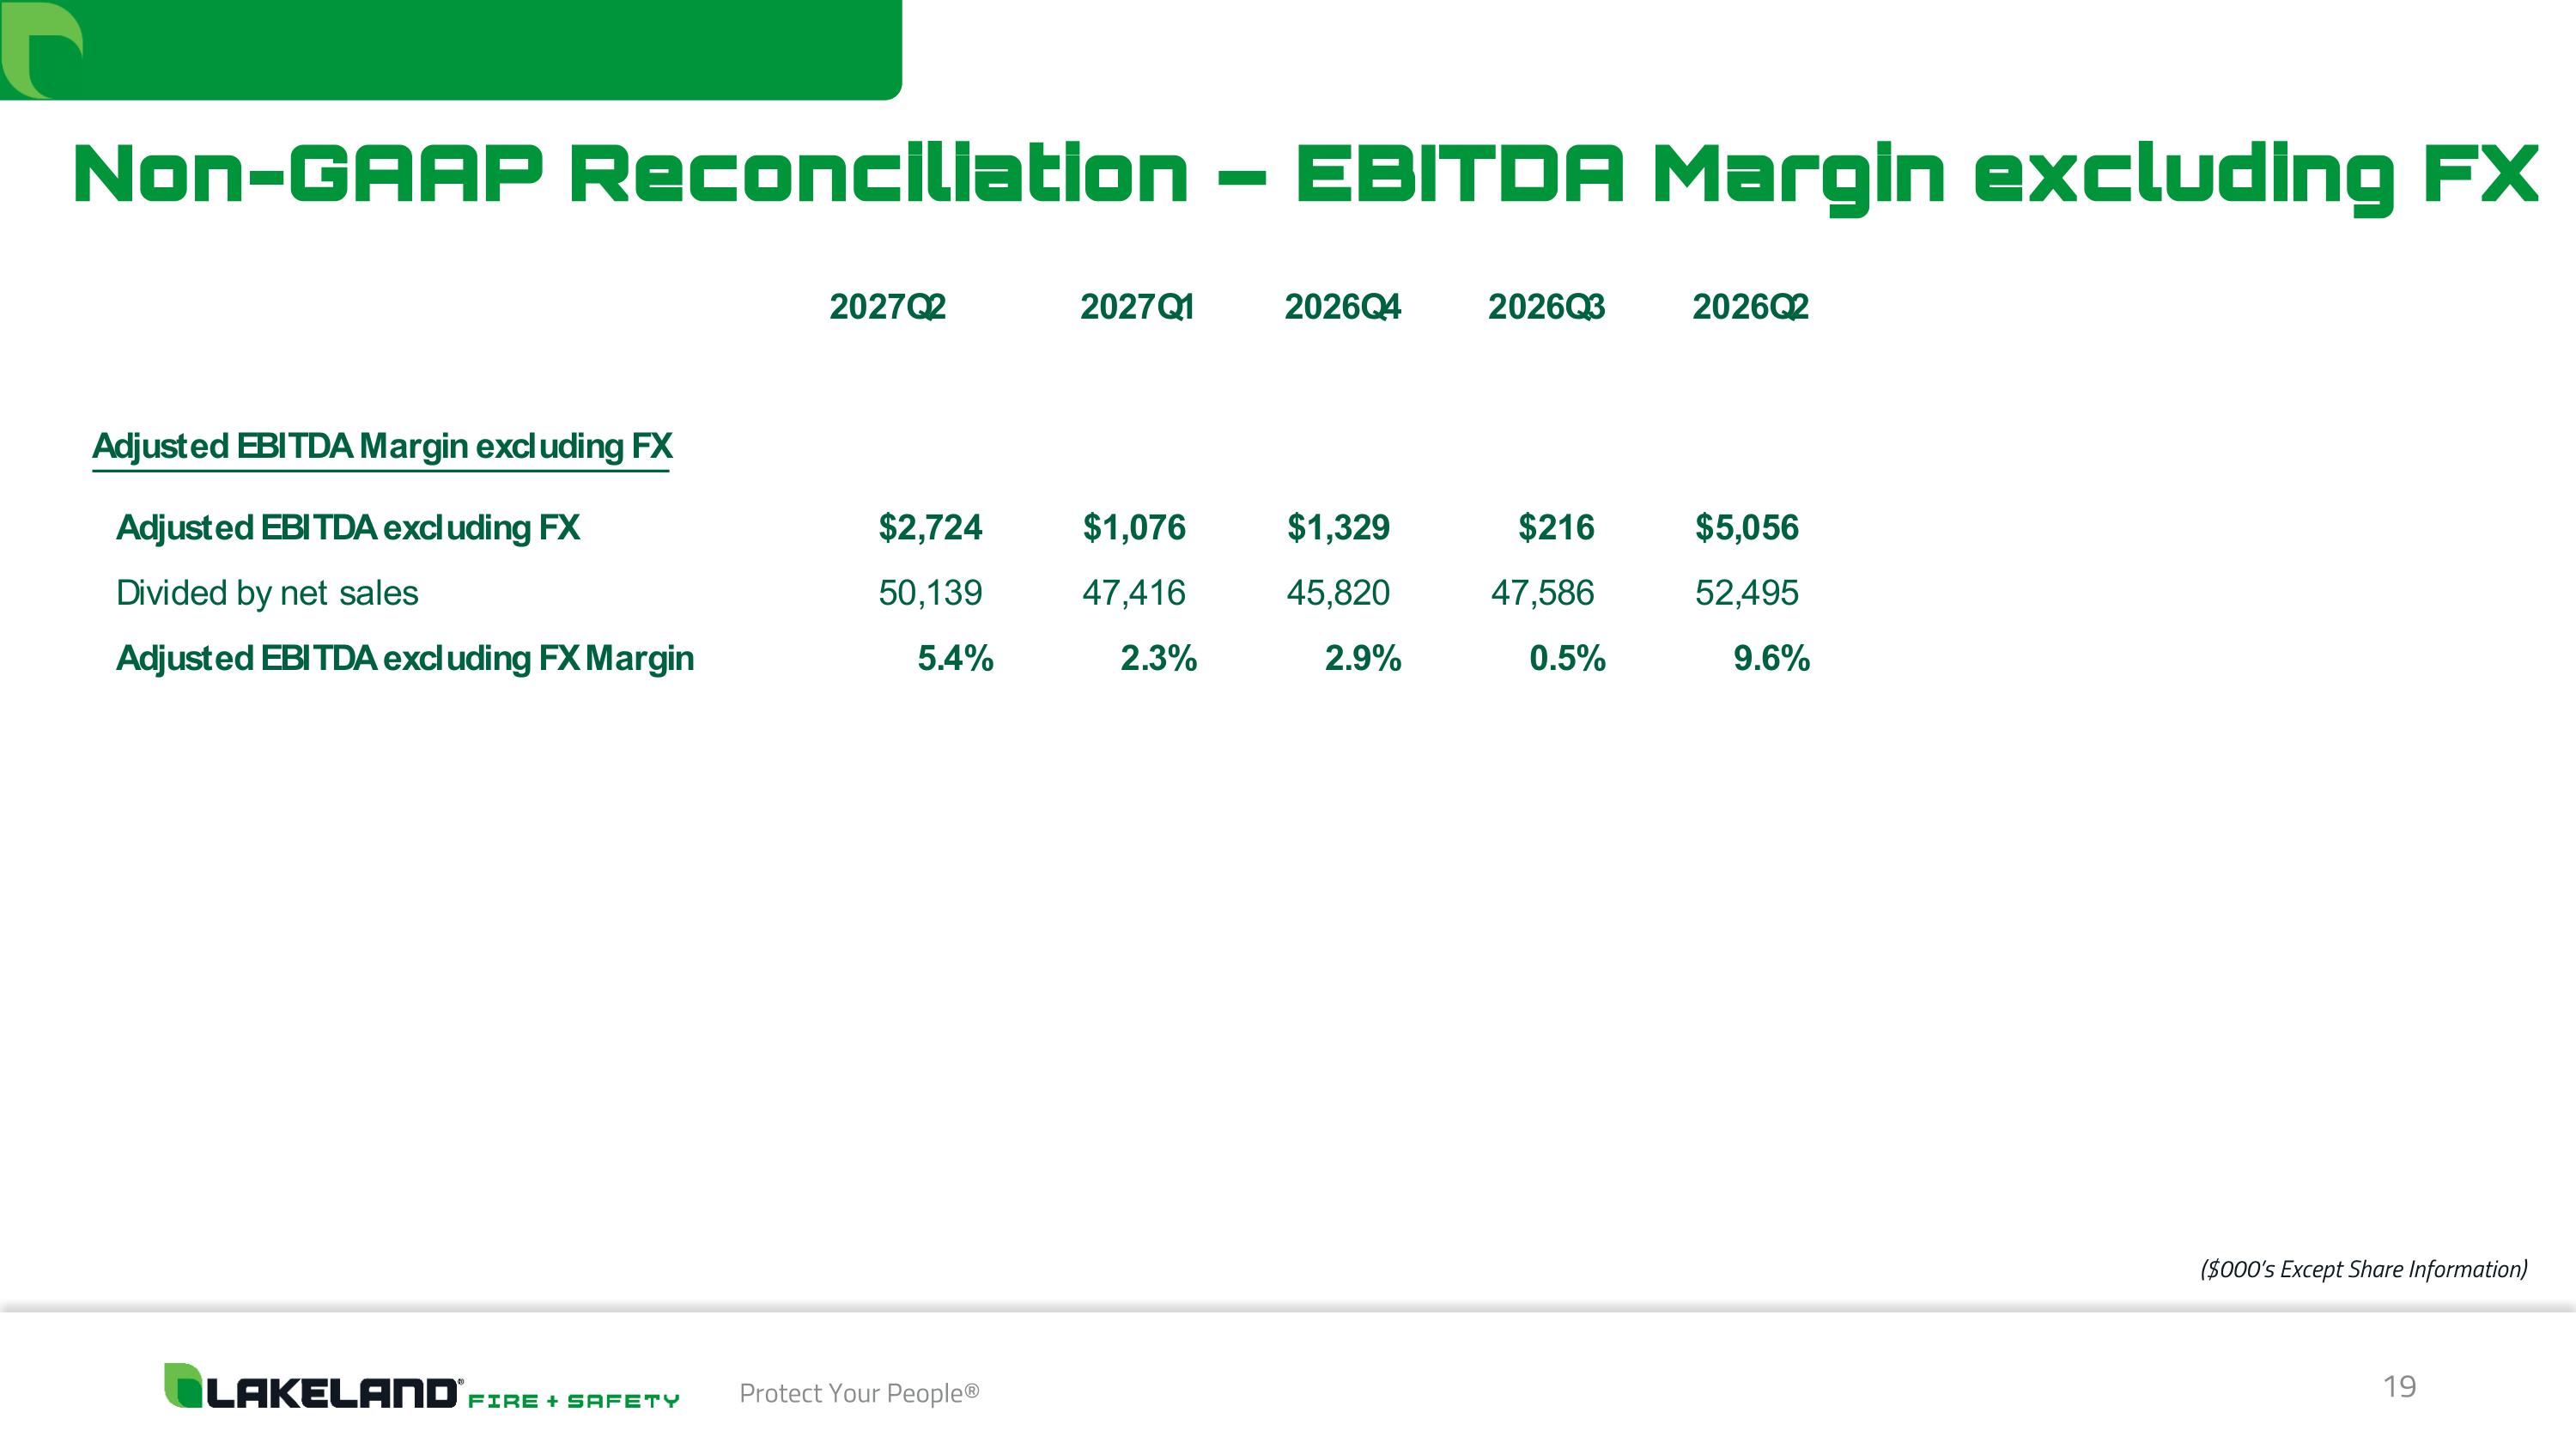
19 Protect Your People® Non-GAAP Reconciliation – EBITDA Margin excluding FX ($000’s Except Share Information)