Shareholder Report
|
6 Months Ended |
|
Jun. 30, 2026
USD ($)
Holding
|
|---|
| Shareholder Report [Line Items] |
|
|
| Document Type |
N-CSRS
|
|
| Amendment Flag |
false
|
|
| Registrant Name |
Northern Lights Variable Trust
|
|
| Entity Central Index Key |
0001352621
|
|
| Entity Investment Company Type |
N-1A
|
|
| Document Period End Date |
Jun. 30, 2026
|
|
| Shareholder Report Annual or Semi-Annual |
Semi-Annual Shareholder Report
|
|
| C000097931 |
|
|
| Shareholder Report [Line Items] |
|
|
| Fund Name |
TOPS Aggressive ETF Portfolio
|
|
| Class Name |
Class 1
|
|
| Trading Symbol |
TAG1
|
|
| Annual or Semi-Annual Statement [Text Block] |
This semi-annual shareholder report contains important information about TOPS Aggressive ETF Portfolio for the period of January 1, 2026 to June 30, 2026.
|
|
| Additional Information [Text Block] |
You can find additional information about the Fund at https://topsfunds.com/tops-portfolios/vit/. You can also request this information by contacting us at 1-855-572-5945.
|
|
| Material Fund Change Notice [Text Block] |
This report describes changes to the Fund that occurred during the reporting period.
|
|
| Additional Information Phone Number |
1-855-572-5945
|
|
| Additional Information Website |
https://topsfunds.com/tops-portfolios/vit/
|
|
| Expenses [Text Block] |
What were the Fund’s costs for the last six months?(based on a hypothetical $10,000 investment) Table SummaryClass Name | Costs of a $10,000 investment | Costs paid as a percentage of a $10,000 investment |
|---|
Class 1 | $11 | 0.21%Footnote Reference* |
|---|
| Footnote | Description | Footnote* | Annualized |
|
|
| Expenses Paid, Amount |
$ 11
|
|
| Expense Ratio, Percent |
0.21%
|
[1] |
| Factors Affecting Performance [Text Block] |
How did the Fund perform during the reporting period? The S&P 500 and the Bloomberg U.S. Aggregate Bond Index both fell during the 1st quarter of 2026 ( 4.3% and 0.1%, respectively), yet all the TOPS portfolios delivered positive returns for investors. As the S&P 500 rebounded +15.2% in the 2nd quarter, the TOPS portfolios had a very strong quarter as well, leading to particularly strong performance for the equity-centric TOPS models versus the S&P 500’s return of +10.2% YTD. Year-to-date, small cap (S&P Small Cap 600 Total Return Index) leads at +23.9%, followed by mid cap (S&P MidCap 400 Total Return Index) at +17.3%. Large cap growth (S&P 500 Growth Total Return Index) has gained +12.0%, while large cap value (S&P 500 Value Total Return Index) is up +8.0%. Internationally, emerging markets ex-China (MSCI Emerging Markets ex China Net Return USD Index) leads at +38.8%. Emerging markets ex-state-owned enterprises (WisdomTree Emerging Markets ex State Owned Enterprises Index) have returned +22.4%, while developed international (FTSE Developed ex US All Cap Net Tax [US RIC] Index) is up +14.3%. Broad-based emerging markets (FTSE Emerging Markets All Cap China A Inclusion Net Tax [US RIC] Index) have gained +9.3%. Among other asset classes, global real estate (FTSE EPRA Nareit Global REITs Net Tax Index) has gained +11.6%, while global natural resources (Morningstar Global Upstream Natural Resources Net Return Index) are up +8.4% On the fixed income side, high yield corporate bonds (Solactive USD High Yield Corporates Total Market Index) and emerging market local currency bonds (J.P. Morgan Government Bond Index Emerging Markets Global Core) lead at +1.8%. Short-term TIPS (Bloomberg US Treasury TIPS 0-5 Years Total Return Index Unhedged USD) have gained +1.6%, while global ex-US aggregate bonds (Bloomberg GLA xUSD Float Adjusted RIC Capped Index TR Index Value Hedged USD) are up +1.4%. Short-term corporate bonds (Bloomberg US Corporate 1-3 Yr Total Return Index Value Unhedged USD) have returned +1.2%, followed by mortgage-backed securities (Bloomberg US MBS Float Adjusted Total Return Index Value Unhedged USD) at +1.1% and corporate bonds (ICE BofA US Corporate Index) at +1.0%. Short-term Treasuries (Bloomberg U.S. Treasury: 1-3 Year Total Return Index Value Unhedged USD) are up +0.6%, while intermediate-term Treasuries (Bloomberg U.S. Treasury 3-10 Year Total Return Index Value Unhedged USD) remain slightly negative at -0.1%. |
|
| Performance Past Does Not Indicate Future [Text] |
The Fund’s past performance is not a good predictor of how the Fund will perform in the future.
|
|
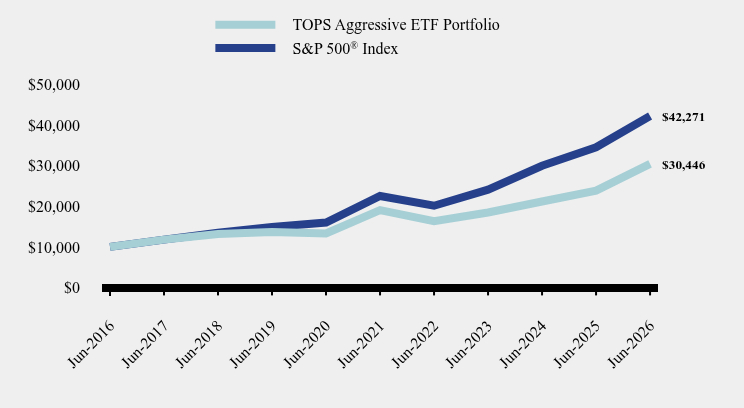
| Line Graph [Table Text Block] |
Table Summary | TOPS Aggressive ETF Portfolio | S&P 500® Index |
|---|
Jun-2016 | $10,000 | $10,000 |
|---|
Jun-2017 | $11,785 | $11,790 |
|---|
Jun-2018 | $13,193 | $13,484 |
|---|
Jun-2019 | $13,642 | $14,889 |
|---|
Jun-2020 | $13,318 | $16,006 |
|---|
Jun-2021 | $19,067 | $22,536 |
|---|
Jun-2022 | $16,345 | $20,144 |
|---|
Jun-2023 | $18,463 | $24,091 |
|---|
Jun-2024 | $21,184 | $30,006 |
|---|
Jun-2025 | $23,869 | $34,556 |
|---|
Jun-2026 | $30,446 | $42,271 |
|---|
|
|
| Average Annual Return [Table Text Block] |
Table Summary | 6 Months | 1 Year | 5 Years | 10 Years |
|---|
TOPS Aggressive ETF Portfolio | 15.25% | 27.55% | 9.81% | 11.78% |
|---|
S&P 500® Index | 10.21% | 22.32% | 13.41% | 15.51% |
|---|
|
|
| No Deduction of Taxes [Text Block] |
The graph and table do not reflect the deduction of taxes that a shareholder would pay on fund distributions or redemption of fund shares.
|
|
| AssetsNet |
$ 374,911,127
|
|
| Holdings Count | Holding |
14
|
|
| Advisory Fees Paid, Amount |
$ 161,353
|
|
| InvestmentCompanyPortfolioTurnover |
4.00%
|
|
| Additional Fund Statistics [Text Block] |
- Net Assets$374,911,127
- Number of Portfolio Holdings14
- Advisory Fee $161,353
- Portfolio Turnover4%
|
|
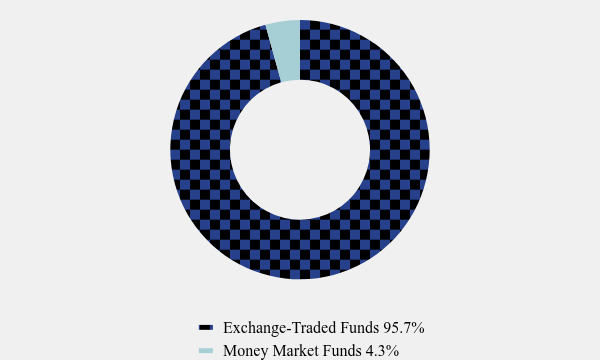
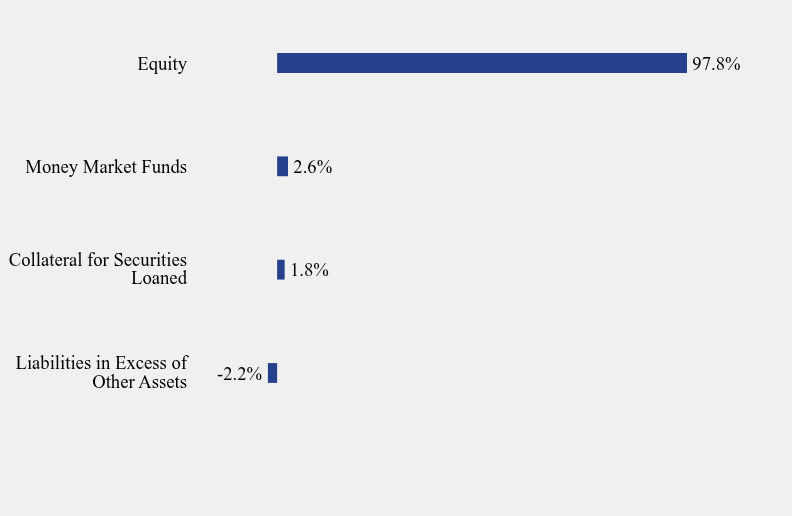
| Holdings [Text Block] |
Asset Weighting (% of total investments)Table SummaryValue | Value |
|---|
Exchange-Traded Funds | 95.7% | Money Market Funds | 4.3% | Sector Weighting (% of net assets)Table SummaryValue | Value |
|---|
Liabilities in Excess of Other Assets | -2.2% | Collateral for Securities Loaned | 1.8% | Money Market Funds | 2.6% | Equity | 97.8% | • May represent asset weighting given fund’s investment approach/investments in other investment companies. |
|
| Largest Holdings [Text Block] |
Top 10 Holdings (% of net assets)Table SummaryHolding Name | % of Net Assets |
|---|
Vanguard S&P 500 ETF | 25.0% |
|---|
Vanguard FTSE Developed Markets ETF | 17.9% |
|---|
State Street SPDR Portfolio S&P 400 Mid Cap ETF | 14.0% |
|---|
State Street SPDR Portfolio S&P 600 Small Cap ETF | 9.0% |
|---|
Vanguard FTSE Emerging Markets ETF | 6.0% |
|---|
iShares MSCI Emerging Markets ex China ETF | 5.0% |
|---|
State Street SPDR Portfolio S&P 500 Growth ETF | 4.0% |
|---|
FlexShares Global Upstream Natural Resources Index Fund | 4.0% |
|---|
State Street SPDR Portfolio S&P 500 Value ETF | 4.0% |
|---|
iShares Global REIT ETF | 3.9% |
|---|
|
|
| Material Fund Change [Text Block] |
Effective May 1, 2026, the name of the Fund changed from "TOPS Aggressive Growth ETF Portfolio" to "TOPS Aggressive ETF Portfolio." |
|
| C000097930 |
|
|
| Shareholder Report [Line Items] |
|
|
| Fund Name |
TOPS Aggressive ETF Portfolio
|
|
| Class Name |
Class 2
|
|
| Trading Symbol |
TAG2
|
|
| Annual or Semi-Annual Statement [Text Block] |
This semi-annual shareholder report contains important information about TOPS Aggressive ETF Portfolio for the period of January 1, 2026 to June 30, 2026.
|
|
| Additional Information [Text Block] |
You can find additional information about the Fund at https://topsfunds.com/tops-portfolios/vit/. You can also request this information by contacting us at 1-855-572-5945.
|
|
| Material Fund Change Notice [Text Block] |
This report describes changes to the Fund that occurred during the reporting period.
|
|
| Additional Information Phone Number |
1-855-572-5945
|
|
| Additional Information Website |
https://topsfunds.com/tops-portfolios/vit/
|
|
| Expenses [Text Block] |
What were the Fund’s costs for the last six months?(based on a hypothetical $10,000 investment) Table SummaryClass Name | Costs of a $10,000 investment | Costs paid as a percentage of a $10,000 investment |
|---|
Class 2 | $25 | 0.46%Footnote Reference* |
|---|
| Footnote | Description | Footnote* | Annualized |
|
|
| Expenses Paid, Amount |
$ 25
|
|
| Expense Ratio, Percent |
0.46%
|
[2] |
| Factors Affecting Performance [Text Block] |
How did the Fund perform during the reporting period? The S&P 500 and the Bloomberg U.S. Aggregate Bond Index both fell during the 1st quarter of 2026 ( 4.3% and 0.1%, respectively), yet all the TOPS portfolios delivered positive returns for investors. As the S&P 500 rebounded +15.2% in the 2nd quarter, the TOPS portfolios had a very strong quarter as well, leading to particularly strong performance for the equity-centric TOPS models versus the S&P 500’s return of +10.2% YTD. Year-to-date, small cap (S&P Small Cap 600 Total Return Index) leads at +23.9%, followed by mid cap (S&P MidCap 400 Total Return Index) at +17.3%. Large cap growth (S&P 500 Growth Total Return Index) has gained +12.0%, while large cap value (S&P 500 Value Total Return Index) is up +8.0%. Internationally, emerging markets ex-China (MSCI Emerging Markets ex China Net Return USD Index) leads at +38.8%. Emerging markets ex-state-owned enterprises (WisdomTree Emerging Markets ex State Owned Enterprises Index) have returned +22.4%, while developed international (FTSE Developed ex US All Cap Net Tax [US RIC] Index) is up +14.3%. Broad-based emerging markets (FTSE Emerging Markets All Cap China A Inclusion Net Tax [US RIC] Index) have gained +9.3%. Among other asset classes, global real estate (FTSE EPRA Nareit Global REITs Net Tax Index) has gained +11.6%, while global natural resources (Morningstar Global Upstream Natural Resources Net Return Index) are up +8.4% On the fixed income side, high yield corporate bonds (Solactive USD High Yield Corporates Total Market Index) and emerging market local currency bonds (J.P. Morgan Government Bond Index Emerging Markets Global Core) lead at +1.8%. Short-term TIPS (Bloomberg US Treasury TIPS 0-5 Years Total Return Index Unhedged USD) have gained +1.6%, while global ex-US aggregate bonds (Bloomberg GLA xUSD Float Adjusted RIC Capped Index TR Index Value Hedged USD) are up +1.4%. Short-term corporate bonds (Bloomberg US Corporate 1-3 Yr Total Return Index Value Unhedged USD) have returned +1.2%, followed by mortgage-backed securities (Bloomberg US MBS Float Adjusted Total Return Index Value Unhedged USD) at +1.1% and corporate bonds (ICE BofA US Corporate Index) at +1.0%. Short-term Treasuries (Bloomberg U.S. Treasury: 1-3 Year Total Return Index Value Unhedged USD) are up +0.6%, while intermediate-term Treasuries (Bloomberg U.S. Treasury 3-10 Year Total Return Index Value Unhedged USD) remain slightly negative at -0.1%. |
|
| Performance Past Does Not Indicate Future [Text] |
The Fund’s past performance is not a good predictor of how the Fund will perform in the future.
|
|
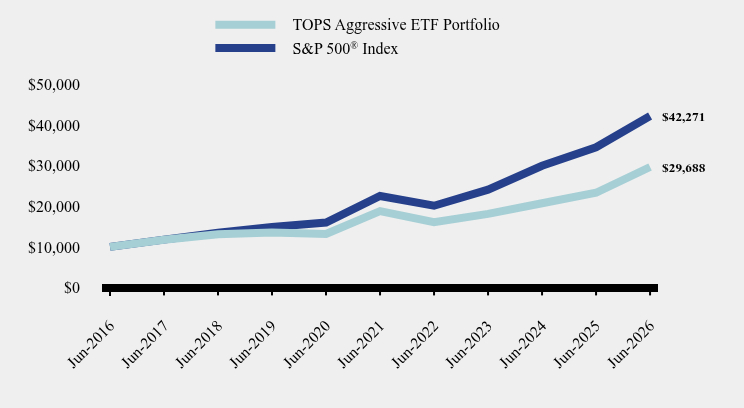
| Line Graph [Table Text Block] |
Table Summary | TOPS Aggressive ETF Portfolio | S&P 500® Index |
|---|
Jun-2016 | $10,000 | $10,000 |
|---|
Jun-2017 | $11,757 | $11,790 |
|---|
Jun-2018 | $13,124 | $13,484 |
|---|
Jun-2019 | $13,536 | $14,889 |
|---|
Jun-2020 | $13,191 | $16,006 |
|---|
Jun-2021 | $18,823 | $22,536 |
|---|
Jun-2022 | $16,095 | $20,144 |
|---|
Jun-2023 | $18,137 | $24,091 |
|---|
Jun-2024 | $20,763 | $30,006 |
|---|
Jun-2025 | $23,335 | $34,556 |
|---|
Jun-2026 | $29,688 | $42,271 |
|---|
|
|
| Average Annual Return [Table Text Block] |
Table Summary | 6 Months | 1 Year | 5 Years | 10 Years |
|---|
TOPS Aggressive ETF Portfolio | 15.10% | 27.23% | 9.54% | 11.50% |
|---|
S&P 500® Index | 10.21% | 22.32% | 13.41% | 15.51% |
|---|
|
|
| No Deduction of Taxes [Text Block] |
The graph and table do not reflect the deduction of taxes that a shareholder would pay on fund distributions or redemption of fund shares.
|
|
| AssetsNet |
$ 374,911,127
|
|
| Holdings Count | Holding |
14
|
|
| Advisory Fees Paid, Amount |
$ 161,353
|
|
| InvestmentCompanyPortfolioTurnover |
4.00%
|
|
| Additional Fund Statistics [Text Block] |
- Net Assets$374,911,127
- Number of Portfolio Holdings14
- Advisory Fee $161,353
- Portfolio Turnover4%
|
|
| Holdings [Text Block] |
Asset Weighting (% of total investments)Table SummaryValue | Value |
|---|
Exchange-Traded Funds | 95.7% | Money Market Funds | 4.3% | Sector Weighting (% of net assets)Table SummaryValue | Value |
|---|
Liabilities in Excess of Other Assets | -2.2% | Collateral for Securities Loaned | 1.8% | Money Market Funds | 2.6% | Equity | 97.8% | • May represent asset weighting given fund’s investment approach/investments in other investment companies. |
|
| Largest Holdings [Text Block] |
Top 10 Holdings (% of net assets)Table SummaryHolding Name | % of Net Assets |
|---|
Vanguard S&P 500 ETF | 25.0% |
|---|
Vanguard FTSE Developed Markets ETF | 17.9% |
|---|
State Street SPDR Portfolio S&P 400 Mid Cap ETF | 14.0% |
|---|
State Street SPDR Portfolio S&P 600 Small Cap ETF | 9.0% |
|---|
Vanguard FTSE Emerging Markets ETF | 6.0% |
|---|
iShares MSCI Emerging Markets ex China ETF | 5.0% |
|---|
State Street SPDR Portfolio S&P 500 Growth ETF | 4.0% |
|---|
FlexShares Global Upstream Natural Resources Index Fund | 4.0% |
|---|
State Street SPDR Portfolio S&P 500 Value ETF | 4.0% |
|---|
iShares Global REIT ETF | 3.9% |
|---|
|
|
| Material Fund Change [Text Block] |
Effective May 1, 2026, the name of the Fund changed from "TOPS Aggressive Growth ETF Portfolio" to "TOPS Aggressive ETF Portfolio." |
|
| C000158839 |
|
|
| Shareholder Report [Line Items] |
|
|
| Fund Name |
TOPS Aggressive ETF Portfolio
|
|
| Class Name |
Investor Class
|
|
| Trading Symbol |
TAGI
|
|
| Annual or Semi-Annual Statement [Text Block] |
This semi-annual shareholder report contains important information about TOPS Aggressive ETF Portfolio for the period of January 1, 2026 to June 30, 2026.
|
|
| Additional Information [Text Block] |
You can find additional information about the Fund at https://topsfunds.com/tops-portfolios/vit/. You can also request this information by contacting us at 1-855-572-5945.
|
|
| Material Fund Change Notice [Text Block] |
This report describes changes to the Fund that occurred during the reporting period.
|
|
| Additional Information Phone Number |
1-855-572-5945
|
|
| Additional Information Website |
https://topsfunds.com/tops-portfolios/vit/
|
|
| Expenses [Text Block] |
What were the Fund’s costs for the last six months?(based on a hypothetical $10,000 investment) Table SummaryClass Name | Costs of a $10,000 investment | Costs paid as a percentage of a $10,000 investment |
|---|
Investor Class | $38 | 0.71%Footnote Reference* |
|---|
| Footnote | Description | Footnote* | Annualized |
|
|
| Expenses Paid, Amount |
$ 38
|
|
| Expense Ratio, Percent |
0.71%
|
[3] |
| Factors Affecting Performance [Text Block] |
How did the Fund perform during the reporting period? The S&P 500 and the Bloomberg U.S. Aggregate Bond Index both fell during the 1st quarter of 2026 ( 4.3% and 0.1%, respectively), yet all the TOPS portfolios delivered positive returns for investors. As the S&P 500 rebounded +15.2% in the 2nd quarter, the TOPS portfolios had a very strong quarter as well, leading to particularly strong performance for the equity-centric TOPS models versus the S&P 500’s return of +10.2% YTD. Year-to-date, small cap (S&P Small Cap 600 Total Return Index) leads at +23.9%, followed by mid cap (S&P MidCap 400 Total Return Index) at +17.3%. Large cap growth (S&P 500 Growth Total Return Index) has gained +12.0%, while large cap value (S&P 500 Value Total Return Index) is up +8.0%. Internationally, emerging markets ex-China (MSCI Emerging Markets ex China Net Return USD Index) leads at +38.8%. Emerging markets ex-state-owned enterprises (WisdomTree Emerging Markets ex State Owned Enterprises Index) have returned +22.4%, while developed international (FTSE Developed ex US All Cap Net Tax [US RIC] Index) is up +14.3%. Broad-based emerging markets (FTSE Emerging Markets All Cap China A Inclusion Net Tax [US RIC] Index) have gained +9.3%. Among other asset classes, global real estate (FTSE EPRA Nareit Global REITs Net Tax Index) has gained +11.6%, while global natural resources (Morningstar Global Upstream Natural Resources Net Return Index) are up +8.4% On the fixed income side, high yield corporate bonds (Solactive USD High Yield Corporates Total Market Index) and emerging market local currency bonds (J.P. Morgan Government Bond Index Emerging Markets Global Core) lead at +1.8%. Short-term TIPS (Bloomberg US Treasury TIPS 0-5 Years Total Return Index Unhedged USD) have gained +1.6%, while global ex-US aggregate bonds (Bloomberg GLA xUSD Float Adjusted RIC Capped Index TR Index Value Hedged USD) are up +1.4%. Short-term corporate bonds (Bloomberg US Corporate 1-3 Yr Total Return Index Value Unhedged USD) have returned +1.2%, followed by mortgage-backed securities (Bloomberg US MBS Float Adjusted Total Return Index Value Unhedged USD) at +1.1% and corporate bonds (ICE BofA US Corporate Index) at +1.0%. Short-term Treasuries (Bloomberg U.S. Treasury: 1-3 Year Total Return Index Value Unhedged USD) are up +0.6%, while intermediate-term Treasuries (Bloomberg U.S. Treasury 3-10 Year Total Return Index Value Unhedged USD) remain slightly negative at -0.1%. |
|
| Performance Past Does Not Indicate Future [Text] |
The Fund’s past performance is not a good predictor of how the Fund will perform in the future.
|
|
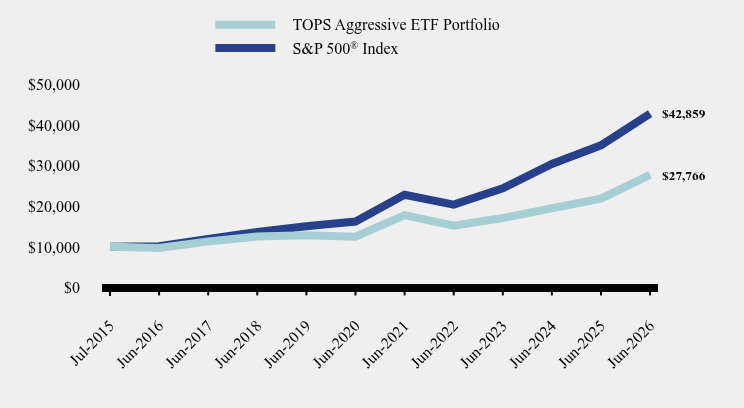
| Line Graph [Table Text Block] |
Table Summary | TOPS Aggressive ETF Portfolio | S&P 500® Index |
|---|
Jul-2015 | $10,000 | $10,000 |
|---|
Jun-2016 | $9,727 | $10,139 |
|---|
Jun-2017 | $11,325 | $11,954 |
|---|
Jun-2018 | $12,549 | $13,672 |
|---|
Jun-2019 | $12,882 | $15,096 |
|---|
Jun-2020 | $12,517 | $16,229 |
|---|
Jun-2021 | $17,829 | $22,850 |
|---|
Jun-2022 | $15,203 | $20,424 |
|---|
Jun-2023 | $17,097 | $24,426 |
|---|
Jun-2024 | $19,519 | $30,424 |
|---|
Jun-2025 | $21,879 | $35,037 |
|---|
Jun-2026 | $27,766 | $42,859 |
|---|
|
|
| Average Annual Return [Table Text Block] |
Table Summary | 6 Months | 1 Year | 5 Years | 10 Years |
|---|
TOPS Aggressive ETF Portfolio | 14.95% | 26.91% | 9.26% | 11.06% |
|---|
S&P 500® Index | 10.21% | 22.32% | 13.41% | 15.51% |
|---|
|
|
| No Deduction of Taxes [Text Block] |
The graph and table do not reflect the deduction of taxes that a shareholder would pay on fund distributions or redemption of fund shares.
|
|
| AssetsNet |
$ 374,911,127
|
|
| Holdings Count | Holding |
14
|
|
| Advisory Fees Paid, Amount |
$ 161,353
|
|
| InvestmentCompanyPortfolioTurnover |
4.00%
|
|
| Additional Fund Statistics [Text Block] |
- Net Assets$374,911,127
- Number of Portfolio Holdings14
- Advisory Fee $161,353
- Portfolio Turnover4%
|
|
| Holdings [Text Block] |
Asset Weighting (% of total investments)Table SummaryValue | Value |
|---|
Exchange-Traded Funds | 95.7% | Money Market Funds | 4.3% | Sector Weighting (% of net assets)Table SummaryValue | Value |
|---|
Liabilities in Excess of Other Assets | -2.2% | Collateral for Securities Loaned | 1.8% | Money Market Funds | 2.6% | Equity | 97.8% | • May represent asset weighting given fund’s investment approach/investments in other investment companies. |
|
| Largest Holdings [Text Block] |
Top 10 Holdings (% of net assets)Table SummaryHolding Name | % of Net Assets |
|---|
Vanguard S&P 500 ETF | 25.0% |
|---|
Vanguard FTSE Developed Markets ETF | 17.9% |
|---|
State Street SPDR Portfolio S&P 400 Mid Cap ETF | 14.0% |
|---|
State Street SPDR Portfolio S&P 600 Small Cap ETF | 9.0% |
|---|
Vanguard FTSE Emerging Markets ETF | 6.0% |
|---|
iShares MSCI Emerging Markets ex China ETF | 5.0% |
|---|
State Street SPDR Portfolio S&P 500 Growth ETF | 4.0% |
|---|
FlexShares Global Upstream Natural Resources Index Fund | 4.0% |
|---|
State Street SPDR Portfolio S&P 500 Value ETF | 4.0% |
|---|
iShares Global REIT ETF | 3.9% |
|---|
|
|
| Material Fund Change [Text Block] |
Effective May 1, 2026, the name of the Fund changed from "TOPS Aggressive Growth ETF Portfolio" to "TOPS Aggressive ETF Portfolio." |
|
| C000211504 |
|
|
| Shareholder Report [Line Items] |
|
|
| Fund Name |
TOPS Aggressive ETF Portfolio
|
|
| Class Name |
Service Class
|
|
| Trading Symbol |
TAGS
|
|
| Annual or Semi-Annual Statement [Text Block] |
This semi-annual shareholder report contains important information about TOPS Aggressive ETF Portfolio for the period of January 1, 2026 to June 30, 2026.
|
|
| Additional Information [Text Block] |
You can find additional information about the Fund at https://topsfunds.com/tops-portfolios/vit/. You can also request this information by contacting us at 1-855-572-5945.
|
|
| Material Fund Change Notice [Text Block] |
This report describes changes to the Fund that occurred during the reporting period.
|
|
| Additional Information Phone Number |
1-855-572-5945
|
|
| Additional Information Website |
https://topsfunds.com/tops-portfolios/vit/
|
|
| Expenses [Text Block] |
What were the Fund’s costs for the last six months?(based on a hypothetical $10,000 investment) Table SummaryClass Name | Costs of a $10,000 investment | Costs paid as a percentage of a $10,000 investment |
|---|
Service Class | $27 | 0.51%Footnote Reference* |
|---|
| Footnote | Description | Footnote* | Annualized |
|
|
| Expenses Paid, Amount |
$ 27
|
|
| Expense Ratio, Percent |
0.51%
|
[4] |
| Factors Affecting Performance [Text Block] |
How did the Fund perform during the reporting period? The S&P 500 and the Bloomberg U.S. Aggregate Bond Index both fell during the 1st quarter of 2026 ( 4.3% and 0.1%, respectively), yet all the TOPS portfolios delivered positive returns for investors. As the S&P 500 rebounded +15.2% in the 2nd quarter, the TOPS portfolios had a very strong quarter as well, leading to particularly strong performance for the equity-centric TOPS models versus the S&P 500’s return of +10.2% YTD. Year-to-date, small cap (S&P Small Cap 600 Total Return Index) leads at +23.9%, followed by mid cap (S&P MidCap 400 Total Return Index) at +17.3%. Large cap growth (S&P 500 Growth Total Return Index) has gained +12.0%, while large cap value (S&P 500 Value Total Return Index) is up +8.0%. Internationally, emerging markets ex-China (MSCI Emerging Markets ex China Net Return USD Index) leads at +38.8%. Emerging markets ex-state-owned enterprises (WisdomTree Emerging Markets ex State Owned Enterprises Index) have returned +22.4%, while developed international (FTSE Developed ex US All Cap Net Tax [US RIC] Index) is up +14.3%. Broad-based emerging markets (FTSE Emerging Markets All Cap China A Inclusion Net Tax [US RIC] Index) have gained +9.3%. Among other asset classes, global real estate (FTSE EPRA Nareit Global REITs Net Tax Index) has gained +11.6%, while global natural resources (Morningstar Global Upstream Natural Resources Net Return Index) are up +8.4% On the fixed income side, high yield corporate bonds (Solactive USD High Yield Corporates Total Market Index) and emerging market local currency bonds (J.P. Morgan Government Bond Index Emerging Markets Global Core) lead at +1.8%. Short-term TIPS (Bloomberg US Treasury TIPS 0-5 Years Total Return Index Unhedged USD) have gained +1.6%, while global ex-US aggregate bonds (Bloomberg GLA xUSD Float Adjusted RIC Capped Index TR Index Value Hedged USD) are up +1.4%. Short-term corporate bonds (Bloomberg US Corporate 1-3 Yr Total Return Index Value Unhedged USD) have returned +1.2%, followed by mortgage-backed securities (Bloomberg US MBS Float Adjusted Total Return Index Value Unhedged USD) at +1.1% and corporate bonds (ICE BofA US Corporate Index) at +1.0%. Short-term Treasuries (Bloomberg U.S. Treasury: 1-3 Year Total Return Index Value Unhedged USD) are up +0.6%, while intermediate-term Treasuries (Bloomberg U.S. Treasury 3-10 Year Total Return Index Value Unhedged USD) remain slightly negative at -0.1%. |
|
| Performance Past Does Not Indicate Future [Text] |
The Fund’s past performance is not a good predictor of how the Fund will perform in the future.
|
|
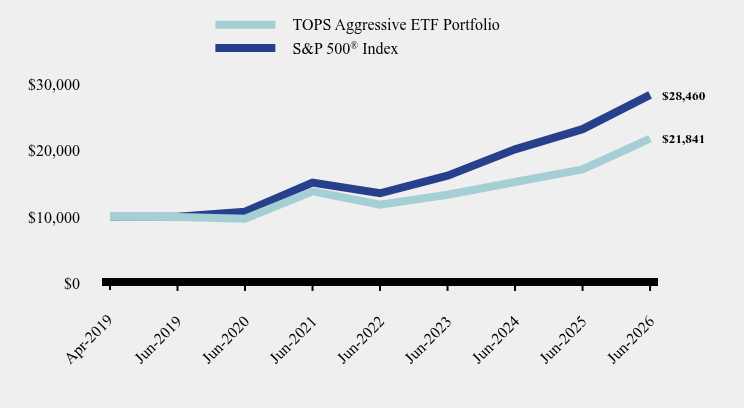
| Line Graph [Table Text Block] |
Table Summary | TOPS Aggressive ETF Portfolio | S&P 500® Index |
|---|
Apr-2019 | $10,000 | $10,000 |
|---|
Jun-2019 | $9,959 | $10,024 |
|---|
Jun-2020 | $9,704 | $10,777 |
|---|
Jun-2021 | $13,848 | $15,173 |
|---|
Jun-2022 | $11,841 | $13,562 |
|---|
Jun-2023 | $13,343 | $16,220 |
|---|
Jun-2024 | $15,275 | $20,203 |
|---|
Jun-2025 | $17,167 | $23,266 |
|---|
Jun-2026 | $21,841 | $28,460 |
|---|
|
|
| Average Annual Return [Table Text Block] |
Table Summary | 6 Months | 1 Year | 5 Years | Since Inception (April 30, 2019) |
|---|
TOPS Aggressive ETF Portfolio | 15.10% | 27.23% | 9.54% | 11.52% |
|---|
S&P 500® Index | 10.21% | 22.32% | 13.41% | 15.71% |
|---|
|
|
| Performance Inception Date |
Apr. 30, 2019
|
|
| No Deduction of Taxes [Text Block] |
The graph and table do not reflect the deduction of taxes that a shareholder would pay on fund distributions or redemption of fund shares.
|
|
| AssetsNet |
$ 374,911,127
|
|
| Holdings Count | Holding |
14
|
|
| Advisory Fees Paid, Amount |
$ 161,353
|
|
| InvestmentCompanyPortfolioTurnover |
4.00%
|
|
| Additional Fund Statistics [Text Block] |
- Net Assets$374,911,127
- Number of Portfolio Holdings14
- Advisory Fee $161,353
- Portfolio Turnover4%
|
|
| Holdings [Text Block] |
Asset Weighting (% of total investments)Table SummaryValue | Value |
|---|
Exchange-Traded Funds | 95.7% | Money Market Funds | 4.3% | Sector Weighting (% of net assets)Table SummaryValue | Value |
|---|
Liabilities in Excess of Other Assets | -2.2% | Collateral for Securities Loaned | 1.8% | Money Market Funds | 2.6% | Equity | 97.8% | • May represent asset weighting given fund’s investment approach/investments in other investment companies. |
|
| Largest Holdings [Text Block] |
Top 10 Holdings (% of net assets)Table SummaryHolding Name | % of Net Assets |
|---|
Vanguard S&P 500 ETF | 25.0% |
|---|
Vanguard FTSE Developed Markets ETF | 17.9% |
|---|
State Street SPDR Portfolio S&P 400 Mid Cap ETF | 14.0% |
|---|
State Street SPDR Portfolio S&P 600 Small Cap ETF | 9.0% |
|---|
Vanguard FTSE Emerging Markets ETF | 6.0% |
|---|
iShares MSCI Emerging Markets ex China ETF | 5.0% |
|---|
State Street SPDR Portfolio S&P 500 Growth ETF | 4.0% |
|---|
FlexShares Global Upstream Natural Resources Index Fund | 4.0% |
|---|
State Street SPDR Portfolio S&P 500 Value ETF | 4.0% |
|---|
iShares Global REIT ETF | 3.9% |
|---|
|
|
| Material Fund Change [Text Block] |
Effective May 1, 2026, the name of the Fund changed from "TOPS Aggressive Growth ETF Portfolio" to "TOPS Aggressive ETF Portfolio." |
|
| C000097924 |
|
|
| Shareholder Report [Line Items] |
|
|
| Fund Name |
TOPS Balanced ETF Portfolio
|
|
| Class Name |
Class 1
|
|
| Trading Symbol |
TB1
|
|
| Annual or Semi-Annual Statement [Text Block] |
This semi-annual shareholder report contains important information about TOPS Balanced ETF Portfolio for the period of January 1, 2026 to June 30, 2026.
|
|
| Additional Information [Text Block] |
You can find additional information about the Fund at https://topsfunds.com/tops-portfolios/vit/. You can also request this information by contacting us at 1-855-572-5945.
|
|
| Additional Information Phone Number |
1-855-572-5945
|
|
| Additional Information Website |
https://topsfunds.com/tops-portfolios/vit/
|
|
| Expenses [Text Block] |
What were the Fund’s costs for the last six months?(based on a hypothetical $10,000 investment) Table SummaryClass Name | Costs of a $10,000 investment | Costs paid as a percentage of a $10,000 investment |
|---|
Class 1 | $11 | 0.21%Footnote Reference* |
|---|
| Footnote | Description | Footnote* | Annualized |
|
|
| Expenses Paid, Amount |
$ 11
|
|
| Expense Ratio, Percent |
0.21%
|
[5] |
| Factors Affecting Performance [Text Block] |
How did the Fund perform during the reporting period? The S&P 500 and the Bloomberg U.S. Aggregate Bond Index both fell during the 1st quarter of 2026 ( 4.3% and 0.1%, respectively), yet all the TOPS portfolios delivered positive returns for investors. As the S&P 500 rebounded +15.2% in the 2nd quarter, the TOPS portfolios had a very strong quarter as well, leading to particularly strong performance for the equity-centric TOPS models versus the S&P 500’s return of +10.2% YTD. Year-to-date, small cap (S&P Small Cap 600 Total Return Index) leads at +23.9%, followed by mid cap (S&P MidCap 400 Total Return Index) at +17.3%. Large cap growth (S&P 500 Growth Total Return Index) has gained +12.0%, while large cap value (S&P 500 Value Total Return Index) is up +8.0%. Internationally, emerging markets ex-China (MSCI Emerging Markets ex China Net Return USD Index) leads at +38.8%. Emerging markets ex-state-owned enterprises (WisdomTree Emerging Markets ex State Owned Enterprises Index) have returned +22.4%, while developed international (FTSE Developed ex US All Cap Net Tax [US RIC] Index) is up +14.3%. Broad-based emerging markets (FTSE Emerging Markets All Cap China A Inclusion Net Tax [US RIC] Index) have gained +9.3%. Among other asset classes, global real estate (FTSE EPRA Nareit Global REITs Net Tax Index) has gained +11.6%, while global natural resources (Morningstar Global Upstream Natural Resources Net Return Index) are up +8.4% On the fixed income side, high yield corporate bonds (Solactive USD High Yield Corporates Total Market Index) and emerging market local currency bonds (J.P. Morgan Government Bond Index Emerging Markets Global Core) lead at +1.8%. Short-term TIPS (Bloomberg US Treasury TIPS 0-5 Years Total Return Index Unhedged USD) have gained +1.6%, while global ex-US aggregate bonds (Bloomberg GLA xUSD Float Adjusted RIC Capped Index TR Index Value Hedged USD) are up +1.4%. Short-term corporate bonds (Bloomberg US Corporate 1-3 Yr Total Return Index Value Unhedged USD) have returned +1.2%, followed by mortgage-backed securities (Bloomberg US MBS Float Adjusted Total Return Index Value Unhedged USD) at +1.1% and corporate bonds (ICE BofA US Corporate Index) at +1.0%. Short-term Treasuries (Bloomberg U.S. Treasury: 1-3 Year Total Return Index Value Unhedged USD) are up +0.6%, while intermediate-term Treasuries (Bloomberg U.S. Treasury 3-10 Year Total Return Index Value Unhedged USD) remain slightly negative at -0.1%. |
|
| Performance Past Does Not Indicate Future [Text] |
The Fund’s past performance is not a good predictor of how the Fund will perform in the future.
|
|
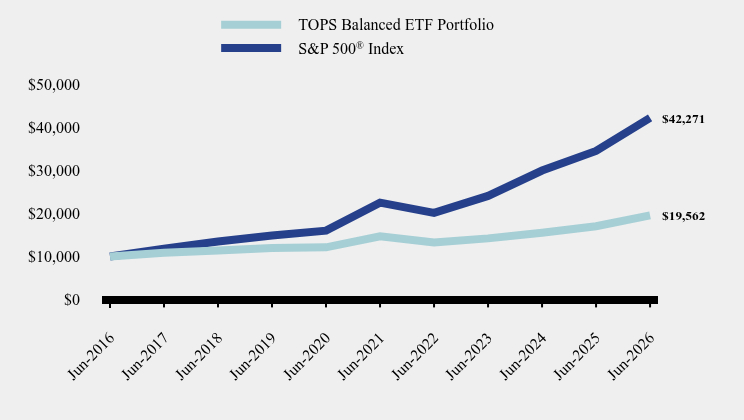
| Line Graph [Table Text Block] |
Table Summary | TOPS Balanced ETF Portfolio | S&P 500® Index |
|---|
Jun-2016 | $10,000 | $10,000 |
|---|
Jun-2017 | $10,837 | $11,790 |
|---|
Jun-2018 | $11,404 | $13,484 |
|---|
Jun-2019 | $11,980 | $14,889 |
|---|
Jun-2020 | $12,126 | $16,006 |
|---|
Jun-2021 | $14,703 | $22,536 |
|---|
Jun-2022 | $13,274 | $20,144 |
|---|
Jun-2023 | $14,208 | $24,091 |
|---|
Jun-2024 | $15,511 | $30,006 |
|---|
Jun-2025 | $17,030 | $34,556 |
|---|
Jun-2026 | $19,562 | $42,271 |
|---|
|
|
| Average Annual Return [Table Text Block] |
Table Summary | 6 Months | 1 Year | 5 Years | 10 Years |
|---|
TOPS Balanced ETF Portfolio | 7.75% | 14.87% | 5.88% | 6.94% |
|---|
S&P 500® Index | 10.21% | 22.32% | 13.41% | 15.51% |
|---|
|
|
| No Deduction of Taxes [Text Block] |
The graph and table do not reflect the deduction of taxes that a shareholder would pay on fund distributions or redemption of fund shares.
|
|
| AssetsNet |
$ 168,205,469
|
|
| Holdings Count | Holding |
24
|
|
| Advisory Fees Paid, Amount |
$ 79,688
|
|
| InvestmentCompanyPortfolioTurnover |
10.00%
|
|
| Additional Fund Statistics [Text Block] |
- Net Assets$168,205,469
- Number of Portfolio Holdings24
- Advisory Fee $79,688
- Portfolio Turnover10%
|
|
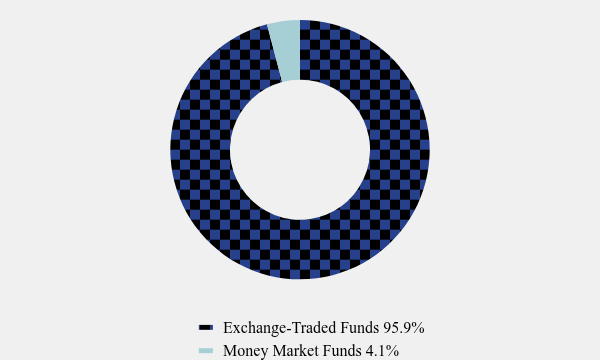
| Holdings [Text Block] |
Asset Weighting (% of total investments)Table SummaryValue | Value |
|---|
Exchange-Traded Funds | 95.9% | Money Market Funds | 4.1% | Sector Weighting (% of net assets)Table SummaryValue | Value |
|---|
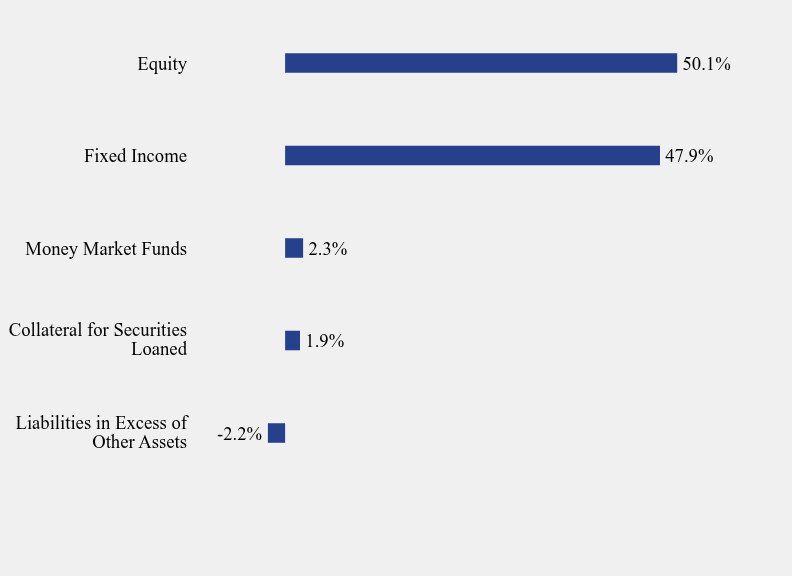
Liabilities in Excess of Other Assets | -2.2% | Collateral for Securities Loaned | 1.9% | Money Market Funds | 2.3% | Fixed Income | 47.9% | Equity | 50.1% | • May represent asset weighting given fund’s investment approach/investments in other investment companies. |
|
| Largest Holdings [Text Block] |
Top 10 Holdings (% of net assets)Table SummaryHolding Name | % of Net Assets |
|---|
Vanguard Short-Term Inflation-Protected Securities ETF | 12.0% |
|---|
Vanguard S&P 500 ETF | 9.1% |
|---|
Vanguard FTSE Developed Markets ETF | 9.0% |
|---|
State Street SPDR Portfolio Short Term Corporate Bond ETF | 9.0% |
|---|
iShares iBoxx $ Investment Grade Corporate Bond ETF | 7.9% |
|---|
State Street SPDR Portfolio S&P 500 Value ETF | 7.0% |
|---|
State Street SPDR Portfolio S&P 400 Mid Cap ETF | 5.0% |
|---|
Vanguard Intermediate-Term Treasury ETF | 5.0% |
|---|
State Street SPDR Portfolio S&P 600 Small Cap ETF | 4.0% |
|---|
Vanguard Short-Term Treasury ETF | 4.0% |
|---|
|
|
| Material Fund Change [Text Block] |
No material changes occurred during the period ended June 30, 2026. |
|
| C000097925 |
|
|
| Shareholder Report [Line Items] |
|
|
| Fund Name |
TOPS Balanced ETF Portfolio
|
|
| Class Name |
Class 2
|
|
| Trading Symbol |
TB2
|
|
| Annual or Semi-Annual Statement [Text Block] |
This semi-annual shareholder report contains important information about TOPS Balanced ETF Portfolio for the period of January 1, 2026 to June 30, 2026.
|
|
| Additional Information [Text Block] |
You can find additional information about the Fund at https://topsfunds.com/tops-portfolios/vit/. You can also request this information by contacting us at 1-855-572-5945.
|
|
| Additional Information Phone Number |
1-855-572-5945
|
|
| Additional Information Website |
https://topsfunds.com/tops-portfolios/vit/
|
|
| Expenses [Text Block] |
What were the Fund’s costs for the last six months?(based on a hypothetical $10,000 investment) Table SummaryClass Name | Costs of a $10,000 investment | Costs paid as a percentage of a $10,000 investment |
|---|
Class 2 | $24 | 0.46%Footnote Reference* |
|---|
| Footnote | Description | Footnote* | Annualized |
|
|
| Expenses Paid, Amount |
$ 24
|
|
| Expense Ratio, Percent |
0.46%
|
[6] |
| Factors Affecting Performance [Text Block] |
How did the Fund perform during the reporting period? The S&P 500 and the Bloomberg U.S. Aggregate Bond Index both fell during the 1st quarter of 2026 ( 4.3% and 0.1%, respectively), yet all the TOPS portfolios delivered positive returns for investors. As the S&P 500 rebounded +15.2% in the 2nd quarter, the TOPS portfolios had a very strong quarter as well, leading to particularly strong performance for the equity-centric TOPS models versus the S&P 500’s return of +10.2% YTD. Year-to-date, small cap (S&P Small Cap 600 Total Return Index) leads at +23.9%, followed by mid cap (S&P MidCap 400 Total Return Index) at +17.3%. Large cap growth (S&P 500 Growth Total Return Index) has gained +12.0%, while large cap value (S&P 500 Value Total Return Index) is up +8.0%. Internationally, emerging markets ex-China (MSCI Emerging Markets ex China Net Return USD Index) leads at +38.8%. Emerging markets ex-state-owned enterprises (WisdomTree Emerging Markets ex State Owned Enterprises Index) have returned +22.4%, while developed international (FTSE Developed ex US All Cap Net Tax [US RIC] Index) is up +14.3%. Broad-based emerging markets (FTSE Emerging Markets All Cap China A Inclusion Net Tax [US RIC] Index) have gained +9.3%. Among other asset classes, global real estate (FTSE EPRA Nareit Global REITs Net Tax Index) has gained +11.6%, while global natural resources (Morningstar Global Upstream Natural Resources Net Return Index) are up +8.4% On the fixed income side, high yield corporate bonds (Solactive USD High Yield Corporates Total Market Index) and emerging market local currency bonds (J.P. Morgan Government Bond Index Emerging Markets Global Core) lead at +1.8%. Short-term TIPS (Bloomberg US Treasury TIPS 0-5 Years Total Return Index Unhedged USD) have gained +1.6%, while global ex-US aggregate bonds (Bloomberg GLA xUSD Float Adjusted RIC Capped Index TR Index Value Hedged USD) are up +1.4%. Short-term corporate bonds (Bloomberg US Corporate 1-3 Yr Total Return Index Value Unhedged USD) have returned +1.2%, followed by mortgage-backed securities (Bloomberg US MBS Float Adjusted Total Return Index Value Unhedged USD) at +1.1% and corporate bonds (ICE BofA US Corporate Index) at +1.0%. Short-term Treasuries (Bloomberg U.S. Treasury: 1-3 Year Total Return Index Value Unhedged USD) are up +0.6%, while intermediate-term Treasuries (Bloomberg U.S. Treasury 3-10 Year Total Return Index Value Unhedged USD) remain slightly negative at -0.1%. |
|
| Performance Past Does Not Indicate Future [Text] |
The Fund’s past performance is not a good predictor of how the Fund will perform in the future.
|
|
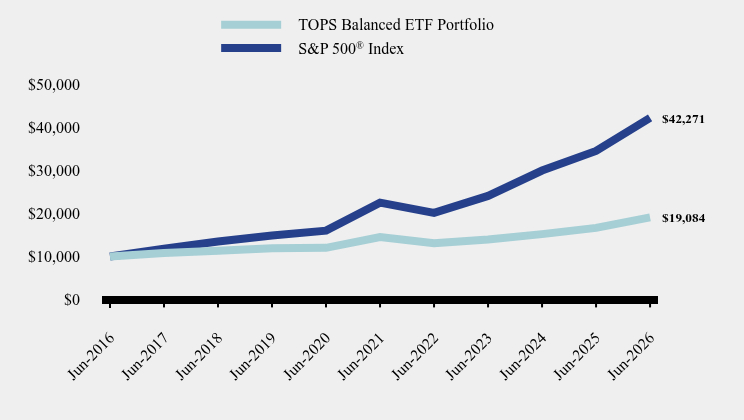
| Line Graph [Table Text Block] |
Table Summary | TOPS Balanced ETF Portfolio | S&P 500® Index |
|---|
Jun-2016 | $10,000 | $10,000 |
|---|
Jun-2017 | $10,809 | $11,790 |
|---|
Jun-2018 | $11,348 | $13,484 |
|---|
Jun-2019 | $11,885 | $14,889 |
|---|
Jun-2020 | $12,005 | $16,006 |
|---|
Jun-2021 | $14,516 | $22,536 |
|---|
Jun-2022 | $13,070 | $20,144 |
|---|
Jun-2023 | $13,959 | $24,091 |
|---|
Jun-2024 | $15,202 | $30,006 |
|---|
Jun-2025 | $16,650 | $34,556 |
|---|
Jun-2026 | $19,084 | $42,271 |
|---|
|
|
| Average Annual Return [Table Text Block] |
Table Summary | 6 Months | 1 Year | 5 Years | 10 Years |
|---|
TOPS Balanced ETF Portfolio | 7.67% | 14.62% | 5.62% | 6.68% |
|---|
S&P 500® Index | 10.21% | 22.32% | 13.41% | 15.51% |
|---|
|
|
| No Deduction of Taxes [Text Block] |
The graph and table do not reflect the deduction of taxes that a shareholder would pay on fund distributions or redemption of fund shares.
|
|
| AssetsNet |
$ 168,205,469
|
|
| Holdings Count | Holding |
24
|
|
| Advisory Fees Paid, Amount |
$ 79,688
|
|
| InvestmentCompanyPortfolioTurnover |
10.00%
|
|
| Additional Fund Statistics [Text Block] |
- Net Assets$168,205,469
- Number of Portfolio Holdings24
- Advisory Fee $79,688
- Portfolio Turnover10%
|
|
| Holdings [Text Block] |
Asset Weighting (% of total investments)Table SummaryValue | Value |
|---|
Exchange-Traded Funds | 95.9% | Money Market Funds | 4.1% | Sector Weighting (% of net assets)Table SummaryValue | Value |
|---|
Liabilities in Excess of Other Assets | -2.2% | Collateral for Securities Loaned | 1.9% | Money Market Funds | 2.3% | Fixed Income | 47.9% | Equity | 50.1% | • May represent asset weighting given fund’s investment approach/investments in other investment companies. |
|
| Largest Holdings [Text Block] |
Top 10 Holdings (% of net assets)Table SummaryHolding Name | % of Net Assets |
|---|
Vanguard Short-Term Inflation-Protected Securities ETF | 12.0% |
|---|
Vanguard S&P 500 ETF | 9.1% |
|---|
Vanguard FTSE Developed Markets ETF | 9.0% |
|---|
State Street SPDR Portfolio Short Term Corporate Bond ETF | 9.0% |
|---|
iShares iBoxx $ Investment Grade Corporate Bond ETF | 7.9% |
|---|
State Street SPDR Portfolio S&P 500 Value ETF | 7.0% |
|---|
State Street SPDR Portfolio S&P 400 Mid Cap ETF | 5.0% |
|---|
Vanguard Intermediate-Term Treasury ETF | 5.0% |
|---|
State Street SPDR Portfolio S&P 600 Small Cap ETF | 4.0% |
|---|
Vanguard Short-Term Treasury ETF | 4.0% |
|---|
|
|
| Material Fund Change [Text Block] |
No material changes occurred during the period ended June 30, 2026. |
|
| C000211501 |
|
|
| Shareholder Report [Line Items] |
|
|
| Fund Name |
TOPS Balanced ETF Portfolio
|
|
| Class Name |
Service Class
|
|
| Trading Symbol |
TBS
|
|
| Annual or Semi-Annual Statement [Text Block] |
This semi-annual shareholder report contains important information about TOPS Balanced ETF Portfolio for the period of January 1, 2026 to June 30, 2026.
|
|
| Additional Information [Text Block] |
You can find additional information about the Fund at https://topsfunds.com/tops-portfolios/vit/. You can also request this information by contacting us at 1-855-572-5945.
|
|
| Additional Information Phone Number |
1-855-572-5945
|
|
| Additional Information Website |
https://topsfunds.com/tops-portfolios/vit/
|
|
| Expenses [Text Block] |
What were the Fund’s costs for the last six months?(based on a hypothetical $10,000 investment) Table SummaryClass Name | Costs of a $10,000 investment | Costs paid as a percentage of a $10,000 investment |
|---|
Service Class | $26 | 0.50%Footnote Reference* |
|---|
| Footnote | Description | Footnote* | Annualized |
|
|
| Expenses Paid, Amount |
$ 26
|
|
| Expense Ratio, Percent |
0.50%
|
[7] |
| Factors Affecting Performance [Text Block] |
How did the Fund perform during the reporting period? The S&P 500 and the Bloomberg U.S. Aggregate Bond Index both fell during the 1st quarter of 2026 ( 4.3% and 0.1%, respectively), yet all the TOPS portfolios delivered positive returns for investors. As the S&P 500 rebounded +15.2% in the 2nd quarter, the TOPS portfolios had a very strong quarter as well, leading to particularly strong performance for the equity-centric TOPS models versus the S&P 500’s return of +10.2% YTD. Year-to-date, small cap (S&P Small Cap 600 Total Return Index) leads at +23.9%, followed by mid cap (S&P MidCap 400 Total Return Index) at +17.3%. Large cap growth (S&P 500 Growth Total Return Index) has gained +12.0%, while large cap value (S&P 500 Value Total Return Index) is up +8.0%. Internationally, emerging markets ex-China (MSCI Emerging Markets ex China Net Return USD Index) leads at +38.8%. Emerging markets ex-state-owned enterprises (WisdomTree Emerging Markets ex State Owned Enterprises Index) have returned +22.4%, while developed international (FTSE Developed ex US All Cap Net Tax [US RIC] Index) is up +14.3%. Broad-based emerging markets (FTSE Emerging Markets All Cap China A Inclusion Net Tax [US RIC] Index) have gained +9.3%. Among other asset classes, global real estate (FTSE EPRA Nareit Global REITs Net Tax Index) has gained +11.6%, while global natural resources (Morningstar Global Upstream Natural Resources Net Return Index) are up +8.4% On the fixed income side, high yield corporate bonds (Solactive USD High Yield Corporates Total Market Index) and emerging market local currency bonds (J.P. Morgan Government Bond Index Emerging Markets Global Core) lead at +1.8%. Short-term TIPS (Bloomberg US Treasury TIPS 0-5 Years Total Return Index Unhedged USD) have gained +1.6%, while global ex-US aggregate bonds (Bloomberg GLA xUSD Float Adjusted RIC Capped Index TR Index Value Hedged USD) are up +1.4%. Short-term corporate bonds (Bloomberg US Corporate 1-3 Yr Total Return Index Value Unhedged USD) have returned +1.2%, followed by mortgage-backed securities (Bloomberg US MBS Float Adjusted Total Return Index Value Unhedged USD) at +1.1% and corporate bonds (ICE BofA US Corporate Index) at +1.0%. Short-term Treasuries (Bloomberg U.S. Treasury: 1-3 Year Total Return Index Value Unhedged USD) are up +0.6%, while intermediate-term Treasuries (Bloomberg U.S. Treasury 3-10 Year Total Return Index Value Unhedged USD) remain slightly negative at -0.1%. |
|
| Performance Past Does Not Indicate Future [Text] |
The Fund’s past performance is not a good predictor of how the Fund will perform in the future.
|
|
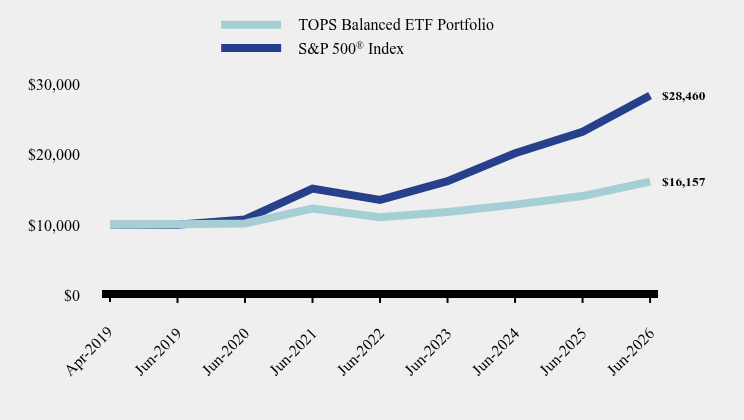
| Line Graph [Table Text Block] |
Table Summary | TOPS Balanced ETF Portfolio | S&P 500® Index |
|---|
Apr-2019 | $10,000 | $10,000 |
|---|
Jun-2019 | $10,090 | $10,024 |
|---|
Jun-2020 | $10,193 | $10,777 |
|---|
Jun-2021 | $12,325 | $15,173 |
|---|
Jun-2022 | $11,088 | $13,562 |
|---|
Jun-2023 | $11,834 | $16,220 |
|---|
Jun-2024 | $12,880 | $20,203 |
|---|
Jun-2025 | $14,100 | $23,266 |
|---|
Jun-2026 | $16,157 | $28,460 |
|---|
|
|
| Average Annual Return [Table Text Block] |
Table Summary | 6 Months | 1 Year | 5 Years | Since Inception (April 30, 2019) |
|---|
TOPS Balanced ETF Portfolio | 7.63% | 14.59% | 5.56% | 6.92% |
|---|
S&P 500® Index | 10.21% | 22.32% | 13.41% | 15.71% |
|---|
|
|
| Performance Inception Date |
Apr. 30, 2019
|
|
| No Deduction of Taxes [Text Block] |
The graph and table do not reflect the deduction of taxes that a shareholder would pay on fund distributions or redemption of fund shares.
|
|
| AssetsNet |
$ 168,205,469
|
|
| Holdings Count | Holding |
24
|
|
| Advisory Fees Paid, Amount |
$ 79,688
|
|
| InvestmentCompanyPortfolioTurnover |
10.00%
|
|
| Additional Fund Statistics [Text Block] |
- Net Assets$168,205,469
- Number of Portfolio Holdings24
- Advisory Fee $79,688
- Portfolio Turnover10%
|
|
| Holdings [Text Block] |
Asset Weighting (% of total investments)Table SummaryValue | Value |
|---|
Exchange-Traded Funds | 95.9% | Money Market Funds | 4.1% | Sector Weighting (% of net assets)Table SummaryValue | Value |
|---|
Liabilities in Excess of Other Assets | -2.2% | Collateral for Securities Loaned | 1.9% | Money Market Funds | 2.3% | Fixed Income | 47.9% | Equity | 50.1% | • May represent asset weighting given fund’s investment approach/investments in other investment companies. |
|
| Largest Holdings [Text Block] |
Top 10 Holdings (% of net assets)Table SummaryHolding Name | % of Net Assets |
|---|
Vanguard Short-Term Inflation-Protected Securities ETF | 12.0% |
|---|
Vanguard S&P 500 ETF | 9.1% |
|---|
Vanguard FTSE Developed Markets ETF | 9.0% |
|---|
State Street SPDR Portfolio Short Term Corporate Bond ETF | 9.0% |
|---|
iShares iBoxx $ Investment Grade Corporate Bond ETF | 7.9% |
|---|
State Street SPDR Portfolio S&P 500 Value ETF | 7.0% |
|---|
State Street SPDR Portfolio S&P 400 Mid Cap ETF | 5.0% |
|---|
Vanguard Intermediate-Term Treasury ETF | 5.0% |
|---|
State Street SPDR Portfolio S&P 600 Small Cap ETF | 4.0% |
|---|
Vanguard Short-Term Treasury ETF | 4.0% |
|---|
|
|
| Material Fund Change [Text Block] |
No material changes occurred during the period ended June 30, 2026. |
|
| C000158836 |
|
|
| Shareholder Report [Line Items] |
|
|
| Fund Name |
TOPS Balanced ETF Portfolio
|
|
| Class Name |
Investor Class
|
|
| Trading Symbol |
TBI
|
|
| Annual or Semi-Annual Statement [Text Block] |
This semi-annual shareholder report contains important information about TOPS Balanced ETF Portfolio for the period of January 1, 2026 to June 30, 2026.
|
|
| Additional Information [Text Block] |
You can find additional information about the Fund at https://topsfunds.com/tops-portfolios/vit/. You can also request this information by contacting us at 1-855-572-5945.
|
|
| Additional Information Phone Number |
1-855-572-5945
|
|
| Additional Information Website |
https://topsfunds.com/tops-portfolios/vit/
|
|
| Expenses [Text Block] |
What were the Fund’s costs for the last six months?(based on a hypothetical $10,000 investment) Table SummaryClass Name | Costs of a $10,000 investment | Costs paid as a percentage of a $10,000 investment |
|---|
Investor Class | $37 | 0.71%Footnote Reference* |
|---|
| Footnote | Description | Footnote* | Annualized |
|
|
| Expenses Paid, Amount |
$ 37
|
|
| Expense Ratio, Percent |
0.71%
|
[8] |
| Factors Affecting Performance [Text Block] |
How did the Fund perform during the reporting period? The S&P 500 and the Bloomberg U.S. Aggregate Bond Index both fell during the 1st quarter of 2026 ( 4.3% and 0.1%, respectively), yet all the TOPS portfolios delivered positive returns for investors. As the S&P 500 rebounded +15.2% in the 2nd quarter, the TOPS portfolios had a very strong quarter as well, leading to particularly strong performance for the equity-centric TOPS models versus the S&P 500’s return of +10.2% YTD. Year-to-date, small cap (S&P Small Cap 600 Total Return Index) leads at +23.9%, followed by mid cap (S&P MidCap 400 Total Return Index) at +17.3%. Large cap growth (S&P 500 Growth Total Return Index) has gained +12.0%, while large cap value (S&P 500 Value Total Return Index) is up +8.0%. Internationally, emerging markets ex-China (MSCI Emerging Markets ex China Net Return USD Index) leads at +38.8%. Emerging markets ex-state-owned enterprises (WisdomTree Emerging Markets ex State Owned Enterprises Index) have returned +22.4%, while developed international (FTSE Developed ex US All Cap Net Tax [US RIC] Index) is up +14.3%. Broad-based emerging markets (FTSE Emerging Markets All Cap China A Inclusion Net Tax [US RIC] Index) have gained +9.3%. Among other asset classes, global real estate (FTSE EPRA Nareit Global REITs Net Tax Index) has gained +11.6%, while global natural resources (Morningstar Global Upstream Natural Resources Net Return Index) are up +8.4% On the fixed income side, high yield corporate bonds (Solactive USD High Yield Corporates Total Market Index) and emerging market local currency bonds (J.P. Morgan Government Bond Index Emerging Markets Global Core) lead at +1.8%. Short-term TIPS (Bloomberg US Treasury TIPS 0-5 Years Total Return Index Unhedged USD) have gained +1.6%, while global ex-US aggregate bonds (Bloomberg GLA xUSD Float Adjusted RIC Capped Index TR Index Value Hedged USD) are up +1.4%. Short-term corporate bonds (Bloomberg US Corporate 1-3 Yr Total Return Index Value Unhedged USD) have returned +1.2%, followed by mortgage-backed securities (Bloomberg US MBS Float Adjusted Total Return Index Value Unhedged USD) at +1.1% and corporate bonds (ICE BofA US Corporate Index) at +1.0%. Short-term Treasuries (Bloomberg U.S. Treasury: 1-3 Year Total Return Index Value Unhedged USD) are up +0.6%, while intermediate-term Treasuries (Bloomberg U.S. Treasury 3-10 Year Total Return Index Value Unhedged USD) remain slightly negative at -0.1%. |
|
| Performance Past Does Not Indicate Future [Text] |
The Fund’s past performance is not a good predictor of how the Fund will perform in the future.
|
|
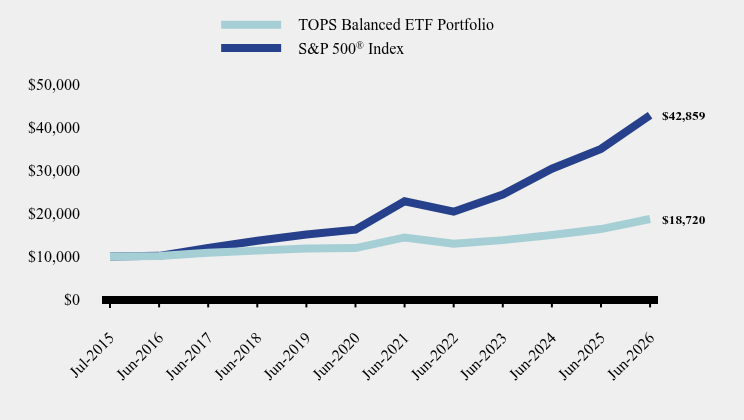
| Line Graph [Table Text Block] |
Table Summary | TOPS Balanced ETF Portfolio | S&P 500® Index |
|---|
Jul-2015 | $10,000 | $10,000 |
|---|
Jun-2016 | $10,079 | $10,139 |
|---|
Jun-2017 | $10,855 | $11,954 |
|---|
Jun-2018 | $11,357 | $13,672 |
|---|
Jun-2019 | $11,869 | $15,096 |
|---|
Jun-2020 | $11,953 | $16,229 |
|---|
Jun-2021 | $14,424 | $22,850 |
|---|
Jun-2022 | $12,952 | $20,424 |
|---|
Jun-2023 | $13,798 | $24,426 |
|---|
Jun-2024 | $14,982 | $30,424 |
|---|
Jun-2025 | $16,372 | $35,037 |
|---|
Jun-2026 | $18,720 | $42,859 |
|---|
|
|
| Average Annual Return [Table Text Block] |
Table Summary | 6 Months | 1 Year | 5 Years | 10 Years |
|---|
TOPS Balanced ETF Portfolio | 7.48% | 14.34% | 5.35% | 6.39% |
|---|
S&P 500® Index | 10.21% | 22.32% | 13.41% | 15.51% |
|---|
|
|
| No Deduction of Taxes [Text Block] |
The graph and table do not reflect the deduction of taxes that a shareholder would pay on fund distributions or redemption of fund shares.
|
|
| AssetsNet |
$ 168,205,469
|
|
| Holdings Count | Holding |
24
|
|
| Advisory Fees Paid, Amount |
$ 79,688
|
|
| InvestmentCompanyPortfolioTurnover |
10.00%
|
|
| Additional Fund Statistics [Text Block] |
- Net Assets$168,205,469
- Number of Portfolio Holdings24
- Advisory Fee $79,688
- Portfolio Turnover10%
|
|
| Holdings [Text Block] |
Asset Weighting (% of total investments)Table SummaryValue | Value |
|---|
Exchange-Traded Funds | 95.9% | Money Market Funds | 4.1% | Sector Weighting (% of net assets)Table SummaryValue | Value |
|---|
Liabilities in Excess of Other Assets | -2.2% | Collateral for Securities Loaned | 1.9% | Money Market Funds | 2.3% | Fixed Income | 47.9% | Equity | 50.1% | • May represent asset weighting given fund’s investment approach/investments in other investment companies. |
|
| Largest Holdings [Text Block] |
Top 10 Holdings (% of net assets)Table SummaryHolding Name | % of Net Assets |
|---|
Vanguard Short-Term Inflation-Protected Securities ETF | 12.0% |
|---|
Vanguard S&P 500 ETF | 9.1% |
|---|
Vanguard FTSE Developed Markets ETF | 9.0% |
|---|
State Street SPDR Portfolio Short Term Corporate Bond ETF | 9.0% |
|---|
iShares iBoxx $ Investment Grade Corporate Bond ETF | 7.9% |
|---|
State Street SPDR Portfolio S&P 500 Value ETF | 7.0% |
|---|
State Street SPDR Portfolio S&P 400 Mid Cap ETF | 5.0% |
|---|
Vanguard Intermediate-Term Treasury ETF | 5.0% |
|---|
State Street SPDR Portfolio S&P 600 Small Cap ETF | 4.0% |
|---|
Vanguard Short-Term Treasury ETF | 4.0% |
|---|
|
|
| Material Fund Change [Text Block] |
No material changes occurred during the period ended June 30, 2026. |
|
| C000097922 |
|
|
| Shareholder Report [Line Items] |
|
|
| Fund Name |
TOPS Conservative ETF Portfolio
|
|
| Class Name |
Class 1
|
|
| Trading Symbol |
TC1
|
|
| Annual or Semi-Annual Statement [Text Block] |
This semi-annual shareholder report contains important information about TOPS Conservative ETF Portfolio for the period of January 1, 2026 to June 30, 2026.
|
|
| Additional Information [Text Block] |
You can find additional information about the Fund at https://topsfunds.com/tops-portfolios/vit/. You can also request this information by contacting us at 1-855-572-5945.
|
|
| Additional Information Phone Number |
1-855-572-5945
|
|
| Additional Information Website |
https://topsfunds.com/tops-portfolios/vit/
|
|
| Expenses [Text Block] |
What were the Fund’s costs for the last six months?(based on a hypothetical $10,000 investment) Table SummaryClass Name | Costs of a $10,000 investment | Costs paid as a percentage of a $10,000 investment |
|---|
Class 1 | $11 | 0.22%Footnote Reference* |
|---|
| Footnote | Description | Footnote* | Annualized |
|
|
| Expenses Paid, Amount |
$ 11
|
|
| Expense Ratio, Percent |
0.22%
|
[9] |
| Factors Affecting Performance [Text Block] |
How did the Fund perform during the reporting period? The S&P 500 and the Bloomberg U.S. Aggregate Bond Index both fell during the 1st quarter of 2026 ( 4.3% and 0.1%, respectively), yet all the TOPS portfolios delivered positive returns for investors. As the S&P 500 rebounded +15.2% in the 2nd quarter, the TOPS portfolios had a very strong quarter as well, leading to particularly strong performance for the equity-centric TOPS models versus the S&P 500’s return of +10.2% YTD. Year-to-date, small cap (S&P Small Cap 600 Total Return Index) leads at +23.9%, followed by mid cap (S&P MidCap 400 Total Return Index) at +17.3%. Large cap growth (S&P 500 Growth Total Return Index) has gained +12.0%, while large cap value (S&P 500 Value Total Return Index) is up +8.0%. Internationally, emerging markets ex-China (MSCI Emerging Markets ex China Net Return USD Index) leads at +38.8%. Emerging markets ex-state-owned enterprises (WisdomTree Emerging Markets ex State Owned Enterprises Index) have returned +22.4%, while developed international (FTSE Developed ex US All Cap Net Tax [US RIC] Index) is up +14.3%. Broad-based emerging markets (FTSE Emerging Markets All Cap China A Inclusion Net Tax [US RIC] Index) have gained +9.3%. Among other asset classes, global real estate (FTSE EPRA Nareit Global REITs Net Tax Index) has gained +11.6%, while global natural resources (Morningstar Global Upstream Natural Resources Net Return Index) are up +8.4% On the fixed income side, high yield corporate bonds (Solactive USD High Yield Corporates Total Market Index) and emerging market local currency bonds (J.P. Morgan Government Bond Index Emerging Markets Global Core) lead at +1.8%. Short-term TIPS (Bloomberg US Treasury TIPS 0-5 Years Total Return Index Unhedged USD) have gained +1.6%, while global ex-US aggregate bonds (Bloomberg GLA xUSD Float Adjusted RIC Capped Index TR Index Value Hedged USD) are up +1.4%. Short-term corporate bonds (Bloomberg US Corporate 1-3 Yr Total Return Index Value Unhedged USD) have returned +1.2%, followed by mortgage-backed securities (Bloomberg US MBS Float Adjusted Total Return Index Value Unhedged USD) at +1.1% and corporate bonds (ICE BofA US Corporate Index) at +1.0%. Short-term Treasuries (Bloomberg U.S. Treasury: 1-3 Year Total Return Index Value Unhedged USD) are up +0.6%, while intermediate-term Treasuries (Bloomberg U.S. Treasury 3-10 Year Total Return Index Value Unhedged USD) remain slightly negative at -0.1%. |
|
| Performance Past Does Not Indicate Future [Text] |
The Fund’s past performance is not a good predictor of how the Fund will perform in the future.
|
|
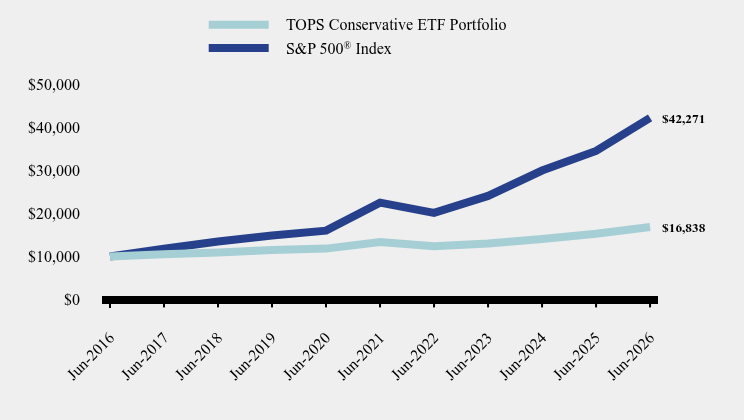
| Line Graph [Table Text Block] |
Table Summary | TOPS Conservative ETF Portfolio | S&P 500® Index |
|---|
Jun-2016 | $10,000 | $10,000 |
|---|
Jun-2017 | $10,533 | $11,790 |
|---|
Jun-2018 | $10,920 | $13,484 |
|---|
Jun-2019 | $11,489 | $14,889 |
|---|
Jun-2020 | $11,823 | $16,006 |
|---|
Jun-2021 | $13,378 | $22,536 |
|---|
Jun-2022 | $12,403 | $20,144 |
|---|
Jun-2023 | $13,042 | $24,091 |
|---|
Jun-2024 | $14,068 | $30,006 |
|---|
Jun-2025 | $15,270 | $34,556 |
|---|
Jun-2026 | $16,838 | $42,271 |
|---|
|
|
| Average Annual Return [Table Text Block] |
Table Summary | 6 Months | 1 Year | 5 Years | 10 Years |
|---|
TOPS Conservative ETF Portfolio | 5.09% | 10.27% | 4.71% | 5.35% |
|---|
S&P 500® Index | 10.21% | 22.32% | 13.41% | 15.51% |
|---|
|
|
| No Deduction of Taxes [Text Block] |
The graph and table do not reflect the deduction of taxes that a shareholder would pay on fund distributions or redemption of fund shares.
|
|
| AssetsNet |
$ 51,688,982
|
|
| Holdings Count | Holding |
24
|
|
| Advisory Fees Paid, Amount |
$ 24,696
|
|
| InvestmentCompanyPortfolioTurnover |
11.00%
|
|
| Additional Fund Statistics [Text Block] |
- Net Assets$51,688,982
- Number of Portfolio Holdings24
- Advisory Fee $24,696
- Portfolio Turnover11%
|
|
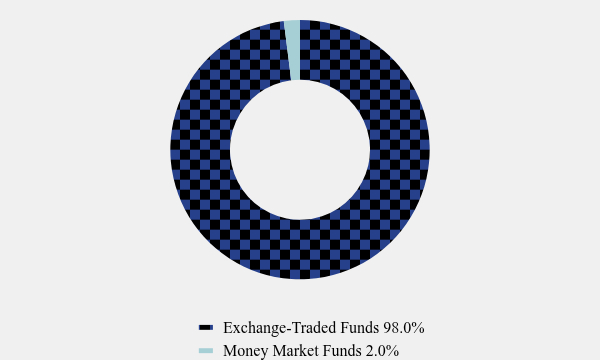
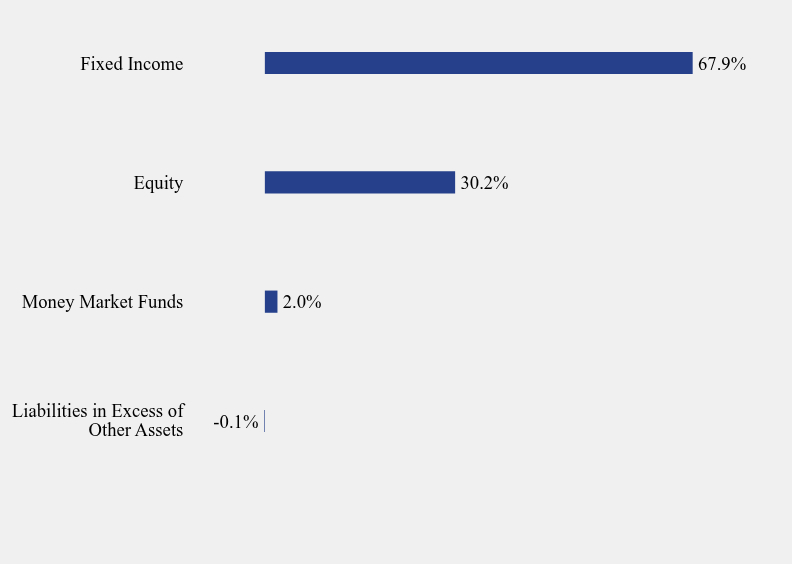
| Holdings [Text Block] |
Asset Weighting (% of total investments)Table SummaryValue | Value |
|---|
Exchange-Traded Funds | 98.0% | Money Market Funds | 2.0% | Sector Weighting (% of net assets)Table SummaryValue | Value |
|---|
Liabilities in Excess of Other Assets | -0.1% | Money Market Funds | 2.0% | Equity | 30.2% | Fixed Income | 67.9% | • May represent asset weighting given fund’s investment approach/investments in other investment companies. |
|
| Largest Holdings [Text Block] |
Top 10 Holdings (% of net assets)Table SummaryHolding Name | % of Net Assets |
|---|
Vanguard Short-Term Inflation-Protected Securities ETF | 16.0% |
|---|
State Street SPDR Portfolio Short Term Corporate Bond ETF | 15.0% |
|---|
Vanguard Short-Term Treasury ETF | 8.0% |
|---|
iShares iBoxx $ Investment Grade Corporate Bond ETF | 7.0% |
|---|
Vanguard S&P 500 ETF | 6.1% |
|---|
Vanguard FTSE Developed Markets ETF | 6.0% |
|---|
Vanguard Intermediate-Term Treasury ETF | 6.0% |
|---|
State Street SPDR Portfolio S&P 400 Mid Cap ETF | 4.0% |
|---|
JP Morgan Ultra-Short Income ETF | 4.0% |
|---|
State Street SPDR Portfolio S&P 500 Value ETF | 4.0% |
|---|
|
|
| Material Fund Change [Text Block] |
No material changes occurred during the period ended June 30, 2026. |
|
| C000097923 |
|
|
| Shareholder Report [Line Items] |
|
|
| Fund Name |
TOPS Conservative ETF Portfolio
|
|
| Class Name |
Class 2
|
|
| Trading Symbol |
TC2
|
|
| Annual or Semi-Annual Statement [Text Block] |
This semi-annual shareholder report contains important information about TOPS Conservative ETF Portfolio for the period of January 1, 2026 to June 30, 2026.
|
|
| Additional Information [Text Block] |
You can find additional information about the Fund at https://topsfunds.com/tops-portfolios/vit/. You can also request this information by contacting us at 1-855-572-5945.
|
|
| Additional Information Phone Number |
1-855-572-5945
|
|
| Additional Information Website |
https://topsfunds.com/tops-portfolios/vit/
|
|
| Expenses [Text Block] |
What were the Fund’s costs for the last six months?(based on a hypothetical $10,000 investment) Table SummaryClass Name | Costs of a $10,000 investment | Costs paid as a percentage of a $10,000 investment |
|---|
Class 2 | $24 | 0.47%Footnote Reference* |
|---|
| Footnote | Description | Footnote* | Annualized |
|
|
| Expenses Paid, Amount |
$ 24
|
|
| Expense Ratio, Percent |
0.47%
|
[10] |
| Factors Affecting Performance [Text Block] |
How did the Fund perform during the reporting period? The S&P 500 and the Bloomberg U.S. Aggregate Bond Index both fell during the 1st quarter of 2026 ( 4.3% and 0.1%, respectively), yet all the TOPS portfolios delivered positive returns for investors. As the S&P 500 rebounded +15.2% in the 2nd quarter, the TOPS portfolios had a very strong quarter as well, leading to particularly strong performance for the equity-centric TOPS models versus the S&P 500’s return of +10.2% YTD. Year-to-date, small cap (S&P Small Cap 600 Total Return Index) leads at +23.9%, followed by mid cap (S&P MidCap 400 Total Return Index) at +17.3%. Large cap growth (S&P 500 Growth Total Return Index) has gained +12.0%, while large cap value (S&P 500 Value Total Return Index) is up +8.0%. Internationally, emerging markets ex-China (MSCI Emerging Markets ex China Net Return USD Index) leads at +38.8%. Emerging markets ex-state-owned enterprises (WisdomTree Emerging Markets ex State Owned Enterprises Index) have returned +22.4%, while developed international (FTSE Developed ex US All Cap Net Tax [US RIC] Index) is up +14.3%. Broad-based emerging markets (FTSE Emerging Markets All Cap China A Inclusion Net Tax [US RIC] Index) have gained +9.3%. Among other asset classes, global real estate (FTSE EPRA Nareit Global REITs Net Tax Index) has gained +11.6%, while global natural resources (Morningstar Global Upstream Natural Resources Net Return Index) are up +8.4% On the fixed income side, high yield corporate bonds (Solactive USD High Yield Corporates Total Market Index) and emerging market local currency bonds (J.P. Morgan Government Bond Index Emerging Markets Global Core) lead at +1.8%. Short-term TIPS (Bloomberg US Treasury TIPS 0-5 Years Total Return Index Unhedged USD) have gained +1.6%, while global ex-US aggregate bonds (Bloomberg GLA xUSD Float Adjusted RIC Capped Index TR Index Value Hedged USD) are up +1.4%. Short-term corporate bonds (Bloomberg US Corporate 1-3 Yr Total Return Index Value Unhedged USD) have returned +1.2%, followed by mortgage-backed securities (Bloomberg US MBS Float Adjusted Total Return Index Value Unhedged USD) at +1.1% and corporate bonds (ICE BofA US Corporate Index) at +1.0%. Short-term Treasuries (Bloomberg U.S. Treasury: 1-3 Year Total Return Index Value Unhedged USD) are up +0.6%, while intermediate-term Treasuries (Bloomberg U.S. Treasury 3-10 Year Total Return Index Value Unhedged USD) remain slightly negative at -0.1%. |
|
| Performance Past Does Not Indicate Future [Text] |
The Fund’s past performance is not a good predictor of how the Fund will perform in the future.
|
|
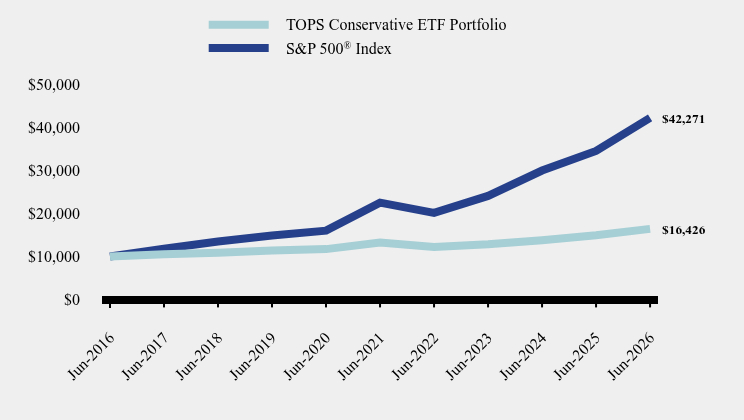
| Line Graph [Table Text Block] |
Table Summary | TOPS Conservative ETF Portfolio | S&P 500® Index |
|---|
Jun-2016 | $10,000 | $10,000 |
|---|
Jun-2017 | $10,508 | $11,790 |
|---|
Jun-2018 | $10,866 | $13,484 |
|---|
Jun-2019 | $11,406 | $14,889 |
|---|
Jun-2020 | $11,706 | $16,006 |
|---|
Jun-2021 | $13,219 | $22,536 |
|---|
Jun-2022 | $12,215 | $20,144 |
|---|
Jun-2023 | $12,816 | $24,091 |
|---|
Jun-2024 | $13,786 | $30,006 |
|---|
Jun-2025 | $14,938 | $34,556 |
|---|
Jun-2026 | $16,426 | $42,271 |
|---|
|
|
| Average Annual Return [Table Text Block] |
Table Summary | 6 Months | 1 Year | 5 Years | 10 Years |
|---|
TOPS Conservative ETF Portfolio | 4.93% | 9.96% | 4.44% | 5.09% |
|---|
S&P 500® Index | 10.21% | 22.32% | 13.41% | 15.51% |
|---|
|
|
| No Deduction of Taxes [Text Block] |
The graph and table do not reflect the deduction of taxes that a shareholder would pay on fund distributions or redemption of fund shares.
|
|
| AssetsNet |
$ 51,688,982
|
|
| Holdings Count | Holding |
24
|
|
| Advisory Fees Paid, Amount |
$ 24,696
|
|
| InvestmentCompanyPortfolioTurnover |
11.00%
|
|
| Additional Fund Statistics [Text Block] |
- Net Assets$51,688,982
- Number of Portfolio Holdings24
- Advisory Fee $24,696
- Portfolio Turnover11%
|
|
| Holdings [Text Block] |
Asset Weighting (% of total investments)Table SummaryValue | Value |
|---|
Exchange-Traded Funds | 98.0% | Money Market Funds | 2.0% | Sector Weighting (% of net assets)Table SummaryValue | Value |
|---|
Liabilities in Excess of Other Assets | -0.1% | Money Market Funds | 2.0% | Equity | 30.2% | Fixed Income | 67.9% | • May represent asset weighting given fund’s investment approach/investments in other investment companies. |
|
| Largest Holdings [Text Block] |
Top 10 Holdings (% of net assets)Table SummaryHolding Name | % of Net Assets |
|---|
Vanguard Short-Term Inflation-Protected Securities ETF | 16.0% |
|---|
State Street SPDR Portfolio Short Term Corporate Bond ETF | 15.0% |
|---|
Vanguard Short-Term Treasury ETF | 8.0% |
|---|
iShares iBoxx $ Investment Grade Corporate Bond ETF | 7.0% |
|---|
Vanguard S&P 500 ETF | 6.1% |
|---|
Vanguard FTSE Developed Markets ETF | 6.0% |
|---|
Vanguard Intermediate-Term Treasury ETF | 6.0% |
|---|
State Street SPDR Portfolio S&P 400 Mid Cap ETF | 4.0% |
|---|
JP Morgan Ultra-Short Income ETF | 4.0% |
|---|
State Street SPDR Portfolio S&P 500 Value ETF | 4.0% |
|---|
|
|
| Material Fund Change [Text Block] |
No material changes occurred during the period ended June 30, 2026. |
|
| C000211500 |
|
|
| Shareholder Report [Line Items] |
|
|
| Fund Name |
TOPS Conservative ETF Portfolio
|
|
| Class Name |
Service Class
|
|
| Trading Symbol |
TCS
|
|
| Annual or Semi-Annual Statement [Text Block] |
This semi-annual shareholder report contains important information about TOPS Conservative ETF Portfolio for the period of January 1, 2026 to June 30, 2026.
|
|
| Additional Information [Text Block] |
You can find additional information about the Fund at https://topsfunds.com/tops-portfolios/vit/. You can also request this information by contacting us at 1-855-572-5945.
|
|
| Additional Information Phone Number |
1-855-572-5945
|
|
| Additional Information Website |
https://topsfunds.com/tops-portfolios/vit/
|
|
| Expenses [Text Block] |
What were the Fund’s costs for the last six months?(based on a hypothetical $10,000 investment) Table SummaryClass Name | Costs of a $10,000 investment | Costs paid as a percentage of a $10,000 investment |
|---|
Service Class | $27 | 0.53%Footnote Reference* |
|---|
| Footnote | Description | Footnote* | Annualized |
|
|
| Expenses Paid, Amount |
$ 27
|
|
| Expense Ratio, Percent |
0.53%
|
[11] |
| Factors Affecting Performance [Text Block] |
How did the Fund perform during the reporting period? The S&P 500 and the Bloomberg U.S. Aggregate Bond Index both fell during the 1st quarter of 2026 ( 4.3% and 0.1%, respectively), yet all the TOPS portfolios delivered positive returns for investors. As the S&P 500 rebounded +15.2% in the 2nd quarter, the TOPS portfolios had a very strong quarter as well, leading to particularly strong performance for the equity-centric TOPS models versus the S&P 500’s return of +10.2% YTD. Year-to-date, small cap (S&P Small Cap 600 Total Return Index) leads at +23.9%, followed by mid cap (S&P MidCap 400 Total Return Index) at +17.3%. Large cap growth (S&P 500 Growth Total Return Index) has gained +12.0%, while large cap value (S&P 500 Value Total Return Index) is up +8.0%. Internationally, emerging markets ex-China (MSCI Emerging Markets ex China Net Return USD Index) leads at +38.8%. Emerging markets ex-state-owned enterprises (WisdomTree Emerging Markets ex State Owned Enterprises Index) have returned +22.4%, while developed international (FTSE Developed ex US All Cap Net Tax [US RIC] Index) is up +14.3%. Broad-based emerging markets (FTSE Emerging Markets All Cap China A Inclusion Net Tax [US RIC] Index) have gained +9.3%. Among other asset classes, global real estate (FTSE EPRA Nareit Global REITs Net Tax Index) has gained +11.6%, while global natural resources (Morningstar Global Upstream Natural Resources Net Return Index) are up +8.4% On the fixed income side, high yield corporate bonds (Solactive USD High Yield Corporates Total Market Index) and emerging market local currency bonds (J.P. Morgan Government Bond Index Emerging Markets Global Core) lead at +1.8%. Short-term TIPS (Bloomberg US Treasury TIPS 0-5 Years Total Return Index Unhedged USD) have gained +1.6%, while global ex-US aggregate bonds (Bloomberg GLA xUSD Float Adjusted RIC Capped Index TR Index Value Hedged USD) are up +1.4%. Short-term corporate bonds (Bloomberg US Corporate 1-3 Yr Total Return Index Value Unhedged USD) have returned +1.2%, followed by mortgage-backed securities (Bloomberg US MBS Float Adjusted Total Return Index Value Unhedged USD) at +1.1% and corporate bonds (ICE BofA US Corporate Index) at +1.0%. Short-term Treasuries (Bloomberg U.S. Treasury: 1-3 Year Total Return Index Value Unhedged USD) are up +0.6%, while intermediate-term Treasuries (Bloomberg U.S. Treasury 3-10 Year Total Return Index Value Unhedged USD) remain slightly negative at -0.1%. |
|
| Performance Past Does Not Indicate Future [Text] |
The Fund’s past performance is not a good predictor of how the Fund will perform in the future.
|
|
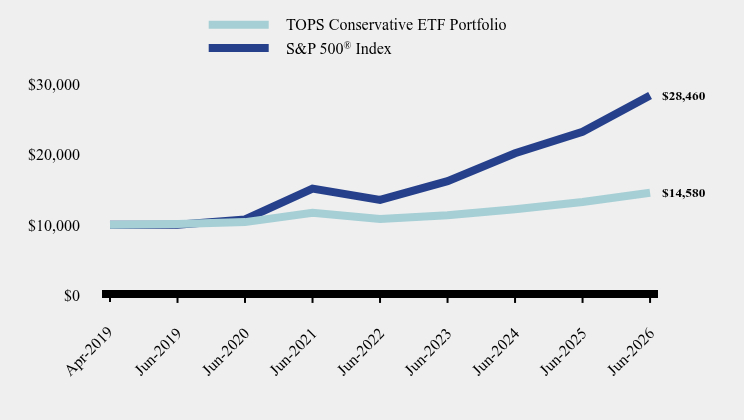
| Line Graph [Table Text Block] |
Table Summary | TOPS Conservative ETF Portfolio | S&P 500® Index |
|---|
Apr-2019 | $10,000 | $10,000 |
|---|
Jun-2019 | $10,126 | $10,024 |
|---|
Jun-2020 | $10,391 | $10,777 |
|---|
Jun-2021 | $11,734 | $15,173 |
|---|
Jun-2022 | $10,842 | $13,562 |
|---|
Jun-2023 | $11,376 | $16,220 |
|---|
Jun-2024 | $12,237 | $20,203 |
|---|
Jun-2025 | $13,259 | $23,266 |
|---|
Jun-2026 | $14,580 | $28,460 |
|---|
|
|
| Average Annual Return [Table Text Block] |
Table Summary | 6 Months | 1 Year | 5 Years | Since Inception (April 30, 2019) |
|---|
TOPS Conservative ETF Portfolio | 4.93% | 9.96% | 4.44% | 5.40% |
|---|
S&P 500® Index | 10.21% | 22.32% | 13.41% | 15.71% |
|---|
|
|
| Performance Inception Date |
Apr. 30, 2019
|
|
| No Deduction of Taxes [Text Block] |
The graph and table do not reflect the deduction of taxes that a shareholder would pay on fund distributions or redemption of fund shares.
|
|
| AssetsNet |
$ 51,688,982
|
|
| Holdings Count | Holding |
24
|
|
| Advisory Fees Paid, Amount |
$ 24,696
|
|
| InvestmentCompanyPortfolioTurnover |
11.00%
|
|
| Additional Fund Statistics [Text Block] |
- Net Assets$51,688,982
- Number of Portfolio Holdings24
- Advisory Fee $24,696
- Portfolio Turnover11%
|
|
| Holdings [Text Block] |
Asset Weighting (% of total investments)Table SummaryValue | Value |
|---|
Exchange-Traded Funds | 98.0% | Money Market Funds | 2.0% | Sector Weighting (% of net assets)Table SummaryValue | Value |
|---|
Liabilities in Excess of Other Assets | -0.1% | Money Market Funds | 2.0% | Equity | 30.2% | Fixed Income | 67.9% | • May represent asset weighting given fund’s investment approach/investments in other investment companies. |
|
| Largest Holdings [Text Block] |
Top 10 Holdings (% of net assets)Table SummaryHolding Name | % of Net Assets |
|---|
Vanguard Short-Term Inflation-Protected Securities ETF | 16.0% |
|---|
State Street SPDR Portfolio Short Term Corporate Bond ETF | 15.0% |
|---|
Vanguard Short-Term Treasury ETF | 8.0% |
|---|
iShares iBoxx $ Investment Grade Corporate Bond ETF | 7.0% |
|---|
Vanguard S&P 500 ETF | 6.1% |
|---|
Vanguard FTSE Developed Markets ETF | 6.0% |
|---|
Vanguard Intermediate-Term Treasury ETF | 6.0% |
|---|
State Street SPDR Portfolio S&P 400 Mid Cap ETF | 4.0% |
|---|
JP Morgan Ultra-Short Income ETF | 4.0% |
|---|
State Street SPDR Portfolio S&P 500 Value ETF | 4.0% |
|---|
|
|
| Material Fund Change [Text Block] |
No material changes occurred during the period ended June 30, 2026. |
|
| C000158835 |
|
|
| Shareholder Report [Line Items] |
|
|
| Fund Name |
TOPS Conservative ETF Portfolio
|
|
| Class Name |
Investor Class
|
|
| Trading Symbol |
TCI
|
|
| Annual or Semi-Annual Statement [Text Block] |
This semi-annual shareholder report contains important information about TOPS Conservative ETF Portfolio for the period of January 1, 2026 to June 30, 2026.
|
|
| Additional Information [Text Block] |
You can find additional information about the Fund at https://topsfunds.com/tops-portfolios/vit/. You can also request this information by contacting us at 1-855-572-5945.
|
|
| Additional Information Phone Number |
1-855-572-5945
|
|
| Additional Information Website |
https://topsfunds.com/tops-portfolios/vit/
|
|
| Expenses [Text Block] |
What were the Fund’s costs for the last six months?(based on a hypothetical $10,000 investment) Table SummaryClass Name | Costs of a $10,000 investment | Costs paid as a percentage of a $10,000 investment |
|---|
Investor Class | $37 | 0.72%Footnote Reference* |
|---|
| Footnote | Description | Footnote* | Annualized |
|
|
| Expenses Paid, Amount |
$ 37
|
|
| Expense Ratio, Percent |
0.72%
|
[12] |
| Factors Affecting Performance [Text Block] |
How did the Fund perform during the reporting period? The S&P 500 and the Bloomberg U.S. Aggregate Bond Index both fell during the 1st quarter of 2026 ( 4.3% and 0.1%, respectively), yet all the TOPS portfolios delivered positive returns for investors. As the S&P 500 rebounded +15.2% in the 2nd quarter, the TOPS portfolios had a very strong quarter as well, leading to particularly strong performance for the equity-centric TOPS models versus the S&P 500’s return of +10.2% YTD. Year-to-date, small cap (S&P Small Cap 600 Total Return Index) leads at +23.9%, followed by mid cap (S&P MidCap 400 Total Return Index) at +17.3%. Large cap growth (S&P 500 Growth Total Return Index) has gained +12.0%, while large cap value (S&P 500 Value Total Return Index) is up +8.0%. Internationally, emerging markets ex-China (MSCI Emerging Markets ex China Net Return USD Index) leads at +38.8%. Emerging markets ex-state-owned enterprises (WisdomTree Emerging Markets ex State Owned Enterprises Index) have returned +22.4%, while developed international (FTSE Developed ex US All Cap Net Tax [US RIC] Index) is up +14.3%. Broad-based emerging markets (FTSE Emerging Markets All Cap China A Inclusion Net Tax [US RIC] Index) have gained +9.3%. Among other asset classes, global real estate (FTSE EPRA Nareit Global REITs Net Tax Index) has gained +11.6%, while global natural resources (Morningstar Global Upstream Natural Resources Net Return Index) are up +8.4% On the fixed income side, high yield corporate bonds (Solactive USD High Yield Corporates Total Market Index) and emerging market local currency bonds (J.P. Morgan Government Bond Index Emerging Markets Global Core) lead at +1.8%. Short-term TIPS (Bloomberg US Treasury TIPS 0-5 Years Total Return Index Unhedged USD) have gained +1.6%, while global ex-US aggregate bonds (Bloomberg GLA xUSD Float Adjusted RIC Capped Index TR Index Value Hedged USD) are up +1.4%. Short-term corporate bonds (Bloomberg US Corporate 1-3 Yr Total Return Index Value Unhedged USD) have returned +1.2%, followed by mortgage-backed securities (Bloomberg US MBS Float Adjusted Total Return Index Value Unhedged USD) at +1.1% and corporate bonds (ICE BofA US Corporate Index) at +1.0%. Short-term Treasuries (Bloomberg U.S. Treasury: 1-3 Year Total Return Index Value Unhedged USD) are up +0.6%, while intermediate-term Treasuries (Bloomberg U.S. Treasury 3-10 Year Total Return Index Value Unhedged USD) remain slightly negative at -0.1%. |
|
| Performance Past Does Not Indicate Future [Text] |
The Fund’s past performance is not a good predictor of how the Fund will perform in the future.
|
|
| Line Graph [Table Text Block] |
Table Summary | TOPS Conservative ETF Portfolio | S&P 500® Index |
|---|
Jul-2015 | $10,000 | $10,000 |
|---|
Jun-2016 | $10,108 | $10,139 |
|---|
Jun-2017 | $10,609 | $11,954 |
|---|
Jun-2018 | $10,959 | $13,672 |
|---|
Jun-2019 | $11,485 | $15,096 |
|---|
Jun-2020 | $11,754 | $16,229 |
|---|
Jun-2021 | $13,251 | $22,850 |
|---|
Jun-2022 | $12,220 | $20,424 |
|---|
Jun-2023 | $12,780 | $24,426 |
|---|
Jun-2024 | $13,724 | $30,424 |
|---|
Jun-2025 | $14,829 | $35,037 |
|---|
Jun-2026 | $16,261 | $42,859 |
|---|
|
|
| Average Annual Return [Table Text Block] |
Table Summary | 6 Months | 1 Year | 5 Years | 10 Years |
|---|
TOPS Conservative ETF Portfolio | 4.87% | 9.66% | 4.18% | 4.87% |
|---|
S&P 500® Index | 10.21% | 22.32% | 13.41% | 15.51% |
|---|
|
|
| No Deduction of Taxes [Text Block] |
The graph and table do not reflect the deduction of taxes that a shareholder would pay on fund distributions or redemption of fund shares.
|
|
| AssetsNet |
$ 51,688,982
|
|
| Holdings Count | Holding |
24
|
|
| Advisory Fees Paid, Amount |
$ 24,696
|
|
| InvestmentCompanyPortfolioTurnover |
11.00%
|
|
| Additional Fund Statistics [Text Block] |
- Net Assets$51,688,982
- Number of Portfolio Holdings24
- Advisory Fee $24,696
- Portfolio Turnover11%
|
|
| Holdings [Text Block] |
Asset Weighting (% of total investments)Table SummaryValue | Value |
|---|
Exchange-Traded Funds | 98.0% | Money Market Funds | 2.0% | Sector Weighting (% of net assets)Table SummaryValue | Value |
|---|
Liabilities in Excess of Other Assets | -0.1% | Money Market Funds | 2.0% | Equity | 30.2% | Fixed Income | 67.9% | • May represent asset weighting given fund’s investment approach/investments in other investment companies. |
|
| Largest Holdings [Text Block] |
Top 10 Holdings (% of net assets)Table SummaryHolding Name | % of Net Assets |
|---|
Vanguard Short-Term Inflation-Protected Securities ETF | 16.0% |
|---|
State Street SPDR Portfolio Short Term Corporate Bond ETF | 15.0% |
|---|
Vanguard Short-Term Treasury ETF | 8.0% |
|---|
iShares iBoxx $ Investment Grade Corporate Bond ETF | 7.0% |
|---|
Vanguard S&P 500 ETF | 6.1% |
|---|
Vanguard FTSE Developed Markets ETF | 6.0% |
|---|
Vanguard Intermediate-Term Treasury ETF | 6.0% |
|---|
State Street SPDR Portfolio S&P 400 Mid Cap ETF | 4.0% |
|---|
JP Morgan Ultra-Short Income ETF | 4.0% |
|---|
State Street SPDR Portfolio S&P 500 Value ETF | 4.0% |
|---|
|
|
| Material Fund Change [Text Block] |
No material changes occurred during the period ended June 30, 2026. |
|
| C000097929 |
|
|
| Shareholder Report [Line Items] |
|
|
| Fund Name |
TOPS Moderately Aggressive ETF Portfolio
|
|
| Class Name |
Class 1
|
|
| Trading Symbol |
TG1
|
|
| Annual or Semi-Annual Statement [Text Block] |
This semi-annual shareholder report contains important information about TOPS Moderately Aggressive ETF Portfolio for the period of January 1, 2026 to June 30, 2026.
|
|
| Additional Information [Text Block] |
You can find additional information about the Fund at https://topsfunds.com/tops-portfolios/vit/. You can also request this information by contacting us at 1-855-572-5945.
|
|
| Material Fund Change Notice [Text Block] |
This report describes changes to the Fund that occurred during the reporting period.
|
|
| Additional Information Phone Number |
1-855-572-5945
|
|
| Additional Information Website |
https://topsfunds.com/tops-portfolios/vit/
|
|
| Expenses [Text Block] |
What were the Fund’s costs for the last six months?(based on a hypothetical $10,000 investment) Table SummaryClass Name | Costs of a $10,000 investment | Costs paid as a percentage of a $10,000 investment |
|---|
Class 1 | $11 | 0.21%Footnote Reference* |
|---|
| Footnote | Description | Footnote* | Annualized |
|
|
| Expenses Paid, Amount |
$ 11
|
|
| Expense Ratio, Percent |
0.21%
|
[13] |
| Factors Affecting Performance [Text Block] |
How did the Fund perform during the reporting period? The S&P 500 and the Bloomberg U.S. Aggregate Bond Index both fell during the 1st quarter of 2026 ( 4.3% and 0.1%, respectively), yet all the TOPS portfolios delivered positive returns for investors. As the S&P 500 rebounded +15.2% in the 2nd quarter, the TOPS portfolios had a very strong quarter as well, leading to particularly strong performance for the equity-centric TOPS models versus the S&P 500’s return of +10.2% YTD. Year-to-date, small cap (S&P Small Cap 600 Total Return Index) leads at +23.9%, followed by mid cap (S&P MidCap 400 Total Return Index) at +17.3%. Large cap growth (S&P 500 Growth Total Return Index) has gained +12.0%, while large cap value (S&P 500 Value Total Return Index) is up +8.0%. Internationally, emerging markets ex-China (MSCI Emerging Markets ex China Net Return USD Index) leads at +38.8%. Emerging markets ex-state-owned enterprises (WisdomTree Emerging Markets ex State Owned Enterprises Index) have returned +22.4%, while developed international (FTSE Developed ex US All Cap Net Tax [US RIC] Index) is up +14.3%. Broad-based emerging markets (FTSE Emerging Markets All Cap China A Inclusion Net Tax [US RIC] Index) have gained +9.3%. Among other asset classes, global real estate (FTSE EPRA Nareit Global REITs Net Tax Index) has gained +11.6%, while global natural resources (Morningstar Global Upstream Natural Resources Net Return Index) are up +8.4% On the fixed income side, high yield corporate bonds (Solactive USD High Yield Corporates Total Market Index) and emerging market local currency bonds (J.P. Morgan Government Bond Index Emerging Markets Global Core) lead at +1.8%. Short-term TIPS (Bloomberg US Treasury TIPS 0-5 Years Total Return Index Unhedged USD) have gained +1.6%, while global ex-US aggregate bonds (Bloomberg GLA xUSD Float Adjusted RIC Capped Index TR Index Value Hedged USD) are up +1.4%. Short-term corporate bonds (Bloomberg US Corporate 1-3 Yr Total Return Index Value Unhedged USD) have returned +1.2%, followed by mortgage-backed securities (Bloomberg US MBS Float Adjusted Total Return Index Value Unhedged USD) at +1.1% and corporate bonds (ICE BofA US Corporate Index) at +1.0%. Short-term Treasuries (Bloomberg U.S. Treasury: 1-3 Year Total Return Index Value Unhedged USD) are up +0.6%, while intermediate-term Treasuries (Bloomberg U.S. Treasury 3-10 Year Total Return Index Value Unhedged USD) remain slightly negative at -0.1%. |
|
| Performance Past Does Not Indicate Future [Text] |
The Fund’s past performance is not a good predictor of how the Fund will perform in the future.
|
|
| Line Graph [Table Text Block] |
Table Summary | TOPS Moderately Aggressive ETF Portfolio | S&P 500® Index |
|---|
Jun-2016 | $10,000 | $10,000 |
|---|
Jun-2017 | $11,529 | $11,790 |
|---|
Jun-2018 | $12,708 | $13,484 |
|---|
Jun-2019 | $13,211 | $14,889 |
|---|
Jun-2020 | $13,024 | $16,006 |
|---|
Jun-2021 | $17,810 | $22,536 |
|---|
Jun-2022 | $15,448 | $20,144 |
|---|
Jun-2023 | $17,271 | $24,091 |
|---|
Jun-2024 | $19,625 | $30,006 |
|---|
Jun-2025 | $22,060 | $34,556 |
|---|
Jun-2026 | $27,340 | $42,271 |
|---|
|
|
| Average Annual Return [Table Text Block] |
Table Summary | 6 Months | 1 Year | 5 Years | 10 Years |
|---|
TOPS Moderately Aggressive ETF Portfolio | 12.96% | 23.94% | 8.95% | 10.58% |
|---|
S&P 500® Index | 10.21% | 22.32% | 13.41% | 15.51% |
|---|
|
|
| No Deduction of Taxes [Text Block] |
The graph and table do not reflect the deduction of taxes that a shareholder would pay on fund distributions or redemption of fund shares.
|
|
| AssetsNet |
$ 394,403,316
|
|
| Holdings Count | Holding |
21
|
|
| Advisory Fees Paid, Amount |
$ 174,734
|
|
| InvestmentCompanyPortfolioTurnover |
5.00%
|
|
| Additional Fund Statistics [Text Block] |
- Net Assets$394,403,316
- Number of Portfolio Holdings21
- Advisory Fee $174,734
- Portfolio Turnover5%
|
|
| Holdings [Text Block] |
Asset Weighting (% of total investments)Table SummaryValue | Value |
|---|
Exchange-Traded Funds | 97.2% | Money Market Funds | 2.8% | Sector Weighting (% of net assets)Table SummaryValue | Value |
|---|
Liabilities in Excess of Other Assets | -0.7% | Collateral for Securities Loaned | 0.4% | Money Market Funds | 2.4% | Fixed Income | 12.9% | Equity | 85.0% | • May represent asset weighting given fund’s investment approach/investments in other investment companies. |
|
| Largest Holdings [Text Block] |
Top 10 Holdings (% of net assets)Table SummaryHolding Name | % of Net Assets |
|---|
Vanguard S&P 500 ETF | 21.1% |
|---|
Vanguard FTSE Developed Markets ETF | 17.0% |
|---|
State Street SPDR Portfolio S&P 400 Mid Cap ETF | 11.0% |
|---|
State Street SPDR Portfolio S&P 600 Small Cap ETF | 6.0% |
|---|
State Street SPDR Portfolio S&P 500 Growth ETF | 5.0% |
|---|
State Street SPDR Portfolio S&P 500 Value ETF | 5.0% |
|---|
iShares MSCI Emerging Markets ex China ETF | 4.0% |
|---|
Vanguard FTSE Emerging Markets ETF | 4.0% |
|---|
FlexShares Global Upstream Natural Resources Index Fund | 4.0% |
|---|
iShares Global REIT ETF | 3.9% |
|---|
|
|
| Material Fund Change [Text Block] |
Effective May 1, 2026, the name of the Fund changed from "TOPS Growth ETF Portfolio" to "TOPS Moderately Aggressive ETF Portfolio." |
|
| C000097928 |
|
|
| Shareholder Report [Line Items] |
|
|
| Fund Name |
TOPS Moderately Aggressive ETF Portfolio
|
|
| Class Name |
Class 2
|
|
| Trading Symbol |
TG2
|
|
| Annual or Semi-Annual Statement [Text Block] |
This semi-annual shareholder report contains important information about TOPS Moderately Aggressive ETF Portfolio for the period of January 1, 2026 to June 30, 2026.
|
|
| Additional Information [Text Block] |
You can find additional information about the Fund at https://topsfunds.com/tops-portfolios/vit/. You can also request this information by contacting us at 1-855-572-5945.
|
|
| Material Fund Change Notice [Text Block] |
This report describes changes to the Fund that occurred during the reporting period.
|
|
| Additional Information Phone Number |
1-855-572-5945
|
|
| Additional Information Website |
https://topsfunds.com/tops-portfolios/vit/
|
|
| Expenses [Text Block] |
What were the Fund’s costs for the last six months?(based on a hypothetical $10,000 investment) Table SummaryClass Name | Costs of a $10,000 investment | Costs paid as a percentage of a $10,000 investment |
|---|
Class 2 | $24 | 0.46%Footnote Reference* |
|---|
| Footnote | Description | Footnote* | Annualized |
|
|
| Expenses Paid, Amount |
$ 24
|
|
| Expense Ratio, Percent |
0.46%
|
[14] |
| Factors Affecting Performance [Text Block] |
How did the Fund perform during the reporting period? The S&P 500 and the Bloomberg U.S. Aggregate Bond Index both fell during the 1st quarter of 2026 ( 4.3% and 0.1%, respectively), yet all the TOPS portfolios delivered positive returns for investors. As the S&P 500 rebounded +15.2% in the 2nd quarter, the TOPS portfolios had a very strong quarter as well, leading to particularly strong performance for the equity-centric TOPS models versus the S&P 500’s return of +10.2% YTD. Year-to-date, small cap (S&P Small Cap 600 Total Return Index) leads at +23.9%, followed by mid cap (S&P MidCap 400 Total Return Index) at +17.3%. Large cap growth (S&P 500 Growth Total Return Index) has gained +12.0%, while large cap value (S&P 500 Value Total Return Index) is up +8.0%. Internationally, emerging markets ex-China (MSCI Emerging Markets ex China Net Return USD Index) leads at +38.8%. Emerging markets ex-state-owned enterprises (WisdomTree Emerging Markets ex State Owned Enterprises Index) have returned +22.4%, while developed international (FTSE Developed ex US All Cap Net Tax [US RIC] Index) is up +14.3%. Broad-based emerging markets (FTSE Emerging Markets All Cap China A Inclusion Net Tax [US RIC] Index) have gained +9.3%. Among other asset classes, global real estate (FTSE EPRA Nareit Global REITs Net Tax Index) has gained +11.6%, while global natural resources (Morningstar Global Upstream Natural Resources Net Return Index) are up +8.4% On the fixed income side, high yield corporate bonds (Solactive USD High Yield Corporates Total Market Index) and emerging market local currency bonds (J.P. Morgan Government Bond Index Emerging Markets Global Core) lead at +1.8%. Short-term TIPS (Bloomberg US Treasury TIPS 0-5 Years Total Return Index Unhedged USD) have gained +1.6%, while global ex-US aggregate bonds (Bloomberg GLA xUSD Float Adjusted RIC Capped Index TR Index Value Hedged USD) are up +1.4%. Short-term corporate bonds (Bloomberg US Corporate 1-3 Yr Total Return Index Value Unhedged USD) have returned +1.2%, followed by mortgage-backed securities (Bloomberg US MBS Float Adjusted Total Return Index Value Unhedged USD) at +1.1% and corporate bonds (ICE BofA US Corporate Index) at +1.0%. Short-term Treasuries (Bloomberg U.S. Treasury: 1-3 Year Total Return Index Value Unhedged USD) are up +0.6%, while intermediate-term Treasuries (Bloomberg U.S. Treasury 3-10 Year Total Return Index Value Unhedged USD) remain slightly negative at -0.1%. |
|
| Performance Past Does Not Indicate Future [Text] |
The Fund’s past performance is not a good predictor of how the Fund will perform in the future.
|
|
| Line Graph [Table Text Block] |
Table Summary | TOPS Moderately Aggressive ETF Portfolio | S&P 500® Index |
|---|
Jun-2016 | $10,000 | $10,000 |
|---|
Jun-2017 | $11,499 | $11,790 |
|---|
Jun-2018 | $12,641 | $13,484 |
|---|
Jun-2019 | $13,113 | $14,889 |
|---|
Jun-2020 | $12,890 | $16,006 |
|---|
Jun-2021 | $17,582 | $22,536 |
|---|
Jun-2022 | $15,216 | $20,144 |
|---|
Jun-2023 | $16,975 | $24,091 |
|---|
Jun-2024 | $19,234 | $30,006 |
|---|
Jun-2025 | $21,565 | $34,556 |
|---|
Jun-2026 | $26,664 | $42,271 |
|---|
|
|
| Average Annual Return [Table Text Block] |
Table Summary | 6 Months | 1 Year | 5 Years | 10 Years |
|---|
TOPS Moderately Aggressive ETF Portfolio | 12.85% | 23.64% | 8.68% | 10.30% |
|---|
S&P 500® Index | 10.21% | 22.32% | 13.41% | 15.51% |
|---|
|
|
| No Deduction of Taxes [Text Block] |
The graph and table do not reflect the deduction of taxes that a shareholder would pay on fund distributions or redemption of fund shares.
|
|
| AssetsNet |
$ 394,403,316
|
|
| Holdings Count | Holding |
21
|
|
| Advisory Fees Paid, Amount |
$ 174,734
|
|
| InvestmentCompanyPortfolioTurnover |
5.00%
|
|
| Additional Fund Statistics [Text Block] |
- Net Assets$394,403,316
- Number of Portfolio Holdings21
- Advisory Fee $174,734
- Portfolio Turnover5%
|
|
| Holdings [Text Block] |
Asset Weighting (% of total investments)Table SummaryValue | Value |
|---|
Exchange-Traded Funds | 97.2% | Money Market Funds | 2.8% | Sector Weighting (% of net assets)Table SummaryValue | Value |
|---|
Liabilities in Excess of Other Assets | -0.7% | Collateral for Securities Loaned | 0.4% | Money Market Funds | 2.4% | Fixed Income | 12.9% | Equity | 85.0% | • May represent asset weighting given fund’s investment approach/investments in other investment companies. |
|
| Largest Holdings [Text Block] |
Top 10 Holdings (% of net assets)Table SummaryHolding Name | % of Net Assets |
|---|
Vanguard S&P 500 ETF | 21.1% |
|---|
Vanguard FTSE Developed Markets ETF | 17.0% |
|---|
State Street SPDR Portfolio S&P 400 Mid Cap ETF | 11.0% |
|---|
State Street SPDR Portfolio S&P 600 Small Cap ETF | 6.0% |
|---|
State Street SPDR Portfolio S&P 500 Growth ETF | 5.0% |
|---|
State Street SPDR Portfolio S&P 500 Value ETF | 5.0% |
|---|
iShares MSCI Emerging Markets ex China ETF | 4.0% |
|---|
Vanguard FTSE Emerging Markets ETF | 4.0% |
|---|
FlexShares Global Upstream Natural Resources Index Fund | 4.0% |
|---|
iShares Global REIT ETF | 3.9% |
|---|
|
|
| Material Fund Change [Text Block] |
Effective May 1, 2026, the name of the Fund changed from "TOPS Growth ETF Portfolio" to "TOPS Moderately Aggressive ETF Portfolio." |
|
| C000211503 |
|
|
| Shareholder Report [Line Items] |
|
|
| Fund Name |
TOPS Moderately Aggressive ETF Portfolio
|
|
| Class Name |
Service Class
|
|
| Trading Symbol |
TGS
|
|
| Annual or Semi-Annual Statement [Text Block] |
This semi-annual shareholder report contains important information about TOPS Moderately Aggressive ETF Portfolio for the period of January 1, 2026 to June 30, 2026.
|
|
| Additional Information [Text Block] |
You can find additional information about the Fund at https://topsfunds.com/tops-portfolios/vit/. You can also request this information by contacting us at 1-855-572-5945.
|
|
| Material Fund Change Notice [Text Block] |
This report describes changes to the Fund that occurred during the reporting period.
|
|
| Additional Information Phone Number |
1-855-572-5945
|
|
| Additional Information Website |
https://topsfunds.com/tops-portfolios/vit/
|
|
| Expenses [Text Block] |
What were the Fund’s costs for the last six months?(based on a hypothetical $10,000 investment) Table SummaryClass Name | Costs of a $10,000 investment | Costs paid as a percentage of a $10,000 investment |
|---|
Service Class | $27 | 0.51%Footnote Reference* |
|---|
| Footnote | Description | Footnote* | Annualized |
|
|
| Expenses Paid, Amount |
$ 27
|
|
| Expense Ratio, Percent |
0.51%
|
[15] |
| Factors Affecting Performance [Text Block] |
How did the Fund perform during the reporting period? The S&P 500 and the Bloomberg U.S. Aggregate Bond Index both fell during the 1st quarter of 2026 ( 4.3% and 0.1%, respectively), yet all the TOPS portfolios delivered positive returns for investors. As the S&P 500 rebounded +15.2% in the 2nd quarter, the TOPS portfolios had a very strong quarter as well, leading to particularly strong performance for the equity-centric TOPS models versus the S&P 500’s return of +10.2% YTD. Year-to-date, small cap (S&P Small Cap 600 Total Return Index) leads at +23.9%, followed by mid cap (S&P MidCap 400 Total Return Index) at +17.3%. Large cap growth (S&P 500 Growth Total Return Index) has gained +12.0%, while large cap value (S&P 500 Value Total Return Index) is up +8.0%. Internationally, emerging markets ex-China (MSCI Emerging Markets ex China Net Return USD Index) leads at +38.8%. Emerging markets ex-state-owned enterprises (WisdomTree Emerging Markets ex State Owned Enterprises Index) have returned +22.4%, while developed international (FTSE Developed ex US All Cap Net Tax [US RIC] Index) is up +14.3%. Broad-based emerging markets (FTSE Emerging Markets All Cap China A Inclusion Net Tax [US RIC] Index) have gained +9.3%. Among other asset classes, global real estate (FTSE EPRA Nareit Global REITs Net Tax Index) has gained +11.6%, while global natural resources (Morningstar Global Upstream Natural Resources Net Return Index) are up +8.4% On the fixed income side, high yield corporate bonds (Solactive USD High Yield Corporates Total Market Index) and emerging market local currency bonds (J.P. Morgan Government Bond Index Emerging Markets Global Core) lead at +1.8%. Short-term TIPS (Bloomberg US Treasury TIPS 0-5 Years Total Return Index Unhedged USD) have gained +1.6%, while global ex-US aggregate bonds (Bloomberg GLA xUSD Float Adjusted RIC Capped Index TR Index Value Hedged USD) are up +1.4%. Short-term corporate bonds (Bloomberg US Corporate 1-3 Yr Total Return Index Value Unhedged USD) have returned +1.2%, followed by mortgage-backed securities (Bloomberg US MBS Float Adjusted Total Return Index Value Unhedged USD) at +1.1% and corporate bonds (ICE BofA US Corporate Index) at +1.0%. Short-term Treasuries (Bloomberg U.S. Treasury: 1-3 Year Total Return Index Value Unhedged USD) are up +0.6%, while intermediate-term Treasuries (Bloomberg U.S. Treasury 3-10 Year Total Return Index Value Unhedged USD) remain slightly negative at -0.1%. |
|
| Performance Past Does Not Indicate Future [Text] |
The Fund’s past performance is not a good predictor of how the Fund will perform in the future.
|
|
| Line Graph [Table Text Block] |
Table Summary | TOPS Moderately Aggressive ETF Portfolio | S&P 500® Index |
|---|
Apr-2019 | $10,000 | $10,000 |
|---|
Jun-2019 | $10,013 | $10,024 |
|---|
Jun-2020 | $9,845 | $10,777 |
|---|
Jun-2021 | $13,429 | $15,173 |
|---|
Jun-2022 | $11,621 | $13,562 |
|---|
Jun-2023 | $12,965 | $16,220 |
|---|
Jun-2024 | $14,690 | $20,203 |
|---|
Jun-2025 | $16,471 | $23,266 |
|---|
Jun-2026 | $20,365 | $28,460 |
|---|
|
|
| Average Annual Return [Table Text Block] |
Table Summary | 6 Months | 1 Year | 5 Years | Since Inception (April 30, 2019) |
|---|
TOPS Moderately Aggressive ETF Portfolio | 12.85% | 23.64% | 8.68% | 10.43% |
|---|
S&P 500® Index | 10.21% | 22.32% | 13.41% | 15.71% |
|---|
|
|
| Performance Inception Date |
Apr. 30, 2019
|
|
| No Deduction of Taxes [Text Block] |
The graph and table do not reflect the deduction of taxes that a shareholder would pay on fund distributions or redemption of fund shares.
|
|
| AssetsNet |
$ 394,403,316
|
|
| Holdings Count | Holding |
21
|
|
| Advisory Fees Paid, Amount |
$ 174,734
|
|
| InvestmentCompanyPortfolioTurnover |
5.00%
|
|
| Additional Fund Statistics [Text Block] |
- Net Assets$394,403,316
- Number of Portfolio Holdings21
- Advisory Fee $174,734
- Portfolio Turnover5%
|
|
| Holdings [Text Block] |
Asset Weighting (% of total investments)Table SummaryValue | Value |
|---|
Exchange-Traded Funds | 97.2% | Money Market Funds | 2.8% | Sector Weighting (% of net assets)Table SummaryValue | Value |
|---|
Liabilities in Excess of Other Assets | -0.7% | Collateral for Securities Loaned | 0.4% | Money Market Funds | 2.4% | Fixed Income | 12.9% | Equity | 85.0% | • May represent asset weighting given fund’s investment approach/investments in other investment companies. |
|
| Largest Holdings [Text Block] |
Top 10 Holdings (% of net assets)Table SummaryHolding Name | % of Net Assets |
|---|
Vanguard S&P 500 ETF | 21.1% |
|---|
Vanguard FTSE Developed Markets ETF | 17.0% |
|---|
State Street SPDR Portfolio S&P 400 Mid Cap ETF | 11.0% |
|---|
State Street SPDR Portfolio S&P 600 Small Cap ETF | 6.0% |
|---|
State Street SPDR Portfolio S&P 500 Growth ETF | 5.0% |
|---|
State Street SPDR Portfolio S&P 500 Value ETF | 5.0% |
|---|
iShares MSCI Emerging Markets ex China ETF | 4.0% |
|---|
Vanguard FTSE Emerging Markets ETF | 4.0% |
|---|
FlexShares Global Upstream Natural Resources Index Fund | 4.0% |
|---|
iShares Global REIT ETF | 3.9% |
|---|
|
|
| Material Fund Change [Text Block] |
Effective May 1, 2026, the name of the Fund changed from "TOPS Growth ETF Portfolio" to "TOPS Moderately Aggressive ETF Portfolio." |
|
| C000158838 |
|
|
| Shareholder Report [Line Items] |
|
|
| Fund Name |
TOPS Moderately Aggressive ETF Portfolio
|
|
| Class Name |
Investor Class
|
|
| Trading Symbol |
TGI
|
|
| Annual or Semi-Annual Statement [Text Block] |
This semi-annual shareholder report contains important information about TOPS Moderately Aggressive ETF Portfolio for the period of January 1, 2026 to June 30, 2026.
|
|
| Additional Information [Text Block] |
You can find additional information about the Fund at https://topsfunds.com/tops-portfolios/vit/. You can also request this information by contacting us at 1-855-572-5945.
|
|
| Material Fund Change Notice [Text Block] |
This report describes changes to the Fund that occurred during the reporting period.
|
|
| Additional Information Phone Number |
1-855-572-5945
|
|
| Additional Information Website |
https://topsfunds.com/tops-portfolios/vit/
|
|
| Expenses [Text Block] |
What were the Fund’s costs for the last six months?(based on a hypothetical $10,000 investment) Table SummaryClass Name | Costs of a $10,000 investment | Costs paid as a percentage of a $10,000 investment |
|---|
Investor Class | $37 | 0.71%Footnote Reference* |
|---|
| Footnote | Description | Footnote* | Annualized |
|
|
| Expenses Paid, Amount |
$ 37
|
|
| Expense Ratio, Percent |
0.71%
|
[16] |
| Factors Affecting Performance [Text Block] |
How did the Fund perform during the reporting period? The S&P 500 and the Bloomberg U.S. Aggregate Bond Index both fell during the 1st quarter of 2026 ( 4.3% and 0.1%, respectively), yet all the TOPS portfolios delivered positive returns for investors. As the S&P 500 rebounded +15.2% in the 2nd quarter, the TOPS portfolios had a very strong quarter as well, leading to particularly strong performance for the equity-centric TOPS models versus the S&P 500’s return of +10.2% YTD. Year-to-date, small cap (S&P Small Cap 600 Total Return Index) leads at +23.9%, followed by mid cap (S&P MidCap 400 Total Return Index) at +17.3%. Large cap growth (S&P 500 Growth Total Return Index) has gained +12.0%, while large cap value (S&P 500 Value Total Return Index) is up +8.0%. Internationally, emerging markets ex-China (MSCI Emerging Markets ex China Net Return USD Index) leads at +38.8%. Emerging markets ex-state-owned enterprises (WisdomTree Emerging Markets ex State Owned Enterprises Index) have returned +22.4%, while developed international (FTSE Developed ex US All Cap Net Tax [US RIC] Index) is up +14.3%. Broad-based emerging markets (FTSE Emerging Markets All Cap China A Inclusion Net Tax [US RIC] Index) have gained +9.3%. Among other asset classes, global real estate (FTSE EPRA Nareit Global REITs Net Tax Index) has gained +11.6%, while global natural resources (Morningstar Global Upstream Natural Resources Net Return Index) are up +8.4% On the fixed income side, high yield corporate bonds (Solactive USD High Yield Corporates Total Market Index) and emerging market local currency bonds (J.P. Morgan Government Bond Index Emerging Markets Global Core) lead at +1.8%. Short-term TIPS (Bloomberg US Treasury TIPS 0-5 Years Total Return Index Unhedged USD) have gained +1.6%, while global ex-US aggregate bonds (Bloomberg GLA xUSD Float Adjusted RIC Capped Index TR Index Value Hedged USD) are up +1.4%. Short-term corporate bonds (Bloomberg US Corporate 1-3 Yr Total Return Index Value Unhedged USD) have returned +1.2%, followed by mortgage-backed securities (Bloomberg US MBS Float Adjusted Total Return Index Value Unhedged USD) at +1.1% and corporate bonds (ICE BofA US Corporate Index) at +1.0%. Short-term Treasuries (Bloomberg U.S. Treasury: 1-3 Year Total Return Index Value Unhedged USD) are up +0.6%, while intermediate-term Treasuries (Bloomberg U.S. Treasury 3-10 Year Total Return Index Value Unhedged USD) remain slightly negative at -0.1%. |
|
| Performance Past Does Not Indicate Future [Text] |
The Fund’s past performance is not a good predictor of how the Fund will perform in the future.
|
|
| Line Graph [Table Text Block] |
Table Summary | TOPS Moderately Aggressive ETF Portfolio | S&P 500® Index |
|---|
Jul-2015 | $10,000 | $10,000 |
|---|
Jun-2016 | $9,800 | $10,139 |
|---|
Jun-2017 | $11,169 | $11,954 |
|---|
Jun-2018 | $12,191 | $13,672 |
|---|
Jun-2019 | $12,610 | $15,096 |
|---|
Jun-2020 | $12,371 | $16,229 |
|---|
Jun-2021 | $16,819 | $22,850 |
|---|
Jun-2022 | $14,527 | $20,424 |
|---|
Jun-2023 | $16,161 | $24,426 |
|---|
Jun-2024 | $18,266 | $30,424 |
|---|
Jun-2025 | $20,437 | $35,037 |
|---|
Jun-2026 | $25,192 | $42,859 |
|---|
|
|
| Average Annual Return [Table Text Block] |
Table Summary | 6 Months | 1 Year | 5 Years | 10 Years |
|---|
TOPS Moderately Aggressive ETF Portfolio | 12.67% | 23.26% | 8.42% | 9.90% |
|---|
S&P 500® Index | 10.21% | 22.32% | 13.41% | 15.51% |
|---|
|
|
| No Deduction of Taxes [Text Block] |
The graph and table do not reflect the deduction of taxes that a shareholder would pay on fund distributions or redemption of fund shares.
|
|
| AssetsNet |
$ 394,403,316
|
|
| Holdings Count | Holding |
21
|
|
| Advisory Fees Paid, Amount |
$ 174,734
|
|
| InvestmentCompanyPortfolioTurnover |
5.00%
|
|
| Additional Fund Statistics [Text Block] |
- Net Assets$394,403,316
- Number of Portfolio Holdings21
- Advisory Fee $174,734
- Portfolio Turnover5%
|
|
| Holdings [Text Block] |
Asset Weighting (% of total investments)Table SummaryValue | Value |
|---|
Exchange-Traded Funds | 97.2% | Money Market Funds | 2.8% | Sector Weighting (% of net assets)Table SummaryValue | Value |
|---|
Liabilities in Excess of Other Assets | -0.7% | Collateral for Securities Loaned | 0.4% | Money Market Funds | 2.4% | Fixed Income | 12.9% | Equity | 85.0% | • May represent asset weighting given fund’s investment approach/investments in other investment companies. |
|
| Largest Holdings [Text Block] |
Top 10 Holdings (% of net assets)Table SummaryHolding Name | % of Net Assets |
|---|
Vanguard S&P 500 ETF | 21.1% |
|---|
Vanguard FTSE Developed Markets ETF | 17.0% |
|---|
State Street SPDR Portfolio S&P 400 Mid Cap ETF | 11.0% |
|---|
State Street SPDR Portfolio S&P 600 Small Cap ETF | 6.0% |
|---|
State Street SPDR Portfolio S&P 500 Growth ETF | 5.0% |
|---|
State Street SPDR Portfolio S&P 500 Value ETF | 5.0% |
|---|
iShares MSCI Emerging Markets ex China ETF | 4.0% |
|---|
Vanguard FTSE Emerging Markets ETF | 4.0% |
|---|
FlexShares Global Upstream Natural Resources Index Fund | 4.0% |
|---|
iShares Global REIT ETF | 3.9% |
|---|
|
|
| Material Fund Change [Text Block] |
Effective May 1, 2026, the name of the Fund changed from "TOPS Growth ETF Portfolio" to "TOPS Moderately Aggressive ETF Portfolio." |
|
| C000097926 |
|
|
| Shareholder Report [Line Items] |
|
|
| Fund Name |
TOPS Moderate ETF Portfolio
|
|
| Class Name |
Class 1
|
|
| Trading Symbol |
TMG1
|
|
| Annual or Semi-Annual Statement [Text Block] |
This semi-annual shareholder report contains important information about TOPS Moderate ETF Portfolio for the period of January 1, 2026 to June 30, 2026.
|
|
| Additional Information [Text Block] |
You can find additional information about the Fund at https://topsfunds.com/tops-portfolios/vit/. You can also request this information by contacting us at 1-855-572-5945.
|
|
| Material Fund Change Notice [Text Block] |
This report describes changes to the Fund that occurred during the reporting period.
|
|
| Additional Information Phone Number |
1-855-572-5945
|
|
| Additional Information Website |
https://topsfunds.com/tops-portfolios/vit/
|
|
| Expenses [Text Block] |
What were the Fund’s costs for the last six months?(based on a hypothetical $10,000 investment) Table SummaryClass Name | Costs of a $10,000 investment | Costs paid as a percentage of a $10,000 investment |
|---|
Class 1 | $11 | 0.21%Footnote Reference* |
|---|
| Footnote | Description | Footnote* | Annualized |
|
|
| Expenses Paid, Amount |
$ 11
|
|
| Expense Ratio, Percent |
0.21%
|
[17] |
| Factors Affecting Performance [Text Block] |
How did the Fund perform during the reporting period? The S&P 500 and the Bloomberg U.S. Aggregate Bond Index both fell during the 1st quarter of 2026 ( 4.3% and 0.1%, respectively), yet all the TOPS portfolios delivered positive returns for investors. As the S&P 500 rebounded +15.2% in the 2nd quarter, the TOPS portfolios had a very strong quarter as well, leading to particularly strong performance for the equity-centric TOPS models versus the S&P 500’s return of +10.2% YTD. Year-to-date, small cap (S&P Small Cap 600 Total Return Index) leads at +23.9%, followed by mid cap (S&P MidCap 400 Total Return Index) at +17.3%. Large cap growth (S&P 500 Growth Total Return Index) has gained +12.0%, while large cap value (S&P 500 Value Total Return Index) is up +8.0%. Internationally, emerging markets ex-China (MSCI Emerging Markets ex China Net Return USD Index) leads at +38.8%. Emerging markets ex-state-owned enterprises (WisdomTree Emerging Markets ex State Owned Enterprises Index) have returned +22.4%, while developed international (FTSE Developed ex US All Cap Net Tax [US RIC] Index) is up +14.3%. Broad-based emerging markets (FTSE Emerging Markets All Cap China A Inclusion Net Tax [US RIC] Index) have gained +9.3%. Among other asset classes, global real estate (FTSE EPRA Nareit Global REITs Net Tax Index) has gained +11.6%, while global natural resources (Morningstar Global Upstream Natural Resources Net Return Index) are up +8.4% On the fixed income side, high yield corporate bonds (Solactive USD High Yield Corporates Total Market Index) and emerging market local currency bonds (J.P. Morgan Government Bond Index Emerging Markets Global Core) lead at +1.8%. Short-term TIPS (Bloomberg US Treasury TIPS 0-5 Years Total Return Index Unhedged USD) have gained +1.6%, while global ex-US aggregate bonds (Bloomberg GLA xUSD Float Adjusted RIC Capped Index TR Index Value Hedged USD) are up +1.4%. Short-term corporate bonds (Bloomberg US Corporate 1-3 Yr Total Return Index Value Unhedged USD) have returned +1.2%, followed by mortgage-backed securities (Bloomberg US MBS Float Adjusted Total Return Index Value Unhedged USD) at +1.1% and corporate bonds (ICE BofA US Corporate Index) at +1.0%. Short-term Treasuries (Bloomberg U.S. Treasury: 1-3 Year Total Return Index Value Unhedged USD) are up +0.6%, while intermediate-term Treasuries (Bloomberg U.S. Treasury 3-10 Year Total Return Index Value Unhedged USD) remain slightly negative at -0.1%. |
|
| Performance Past Does Not Indicate Future [Text] |
The Fund’s past performance is not a good predictor of how the Fund will perform in the future.
|
|
| Line Graph [Table Text Block] |
Table Summary | TOPS Moderate ETF Portfolio | S&P 500® Index |
|---|
Jun-2016 | $10,000 | $10,000 |
|---|
Jun-2017 | $11,163 | $11,790 |
|---|
Jun-2018 | $12,036 | $13,484 |
|---|
Jun-2019 | $12,595 | $14,889 |
|---|
Jun-2020 | $12,679 | $16,006 |
|---|
Jun-2021 | $16,230 | $22,536 |
|---|
Jun-2022 | $14,397 | $20,144 |
|---|
Jun-2023 | $15,710 | $24,091 |
|---|
Jun-2024 | $17,479 | $30,006 |
|---|
Jun-2025 | $19,431 | $34,556 |
|---|
Jun-2026 | $23,017 | $42,271 |
|---|
|
|
| Average Annual Return [Table Text Block] |
Table Summary | 6 Months | 1 Year | 5 Years | 10 Years |
|---|
TOPS Moderate ETF Portfolio | 9.72% | 18.45% | 7.24% | 8.69% |
|---|
S&P 500® Index | 10.21% | 22.32% | 13.41% | 15.51% |
|---|
|
|
| No Deduction of Taxes [Text Block] |
The graph and table do not reflect the deduction of taxes that a shareholder would pay on fund distributions or redemption of fund shares.
|
|
| AssetsNet |
$ 290,745,132
|
|
| Holdings Count | Holding |
23
|
|
| Advisory Fees Paid, Amount |
$ 130,676
|
|
| InvestmentCompanyPortfolioTurnover |
6.00%
|
|
| Additional Fund Statistics [Text Block] |
- Net Assets$290,745,132
- Number of Portfolio Holdings23
- Advisory Fee $130,676
- Portfolio Turnover6%
|
|
| Holdings [Text Block] |
Asset Weighting (% of total investments)Table SummaryValue | Value |
|---|
Exchange-Traded Funds | 92.3% | Money Market Funds | 7.7% | Sector Weighting (% of net assets)Table SummaryValue | Value |
|---|
Liabilities in Excess of Other Assets | -6.2% | Money Market Funds | 2.3% | Collateral for Securities Loaned | 5.8% | Fixed Income | 32.8% | Equity | 65.3% | • May represent asset weighting given fund’s investment approach/investments in other investment companies. |
|
| Largest Holdings [Text Block] |
Top 10 Holdings (% of net assets)Table SummaryHolding Name | % of Net Assets |
|---|
Vanguard S&P 500 ETF | 18.1% |
|---|
Vanguard FTSE Developed Markets ETF | 13.0% |
|---|
State Street SPDR Portfolio Short Term Corporate Bond ETF | 9.0% |
|---|
State Street SPDR Portfolio S&P 400 Mid Cap ETF | 8.0% |
|---|
Vanguard Short-Term Inflation-Protected Securities ETF | 6.0% |
|---|
iShares iBoxx $ Investment Grade Corporate Bond ETF | 5.0% |
|---|
Vanguard FTSE Emerging Markets ETF | 4.0% |
|---|
State Street SPDR Portfolio S&P 600 Small Cap ETF | 4.0% |
|---|
FlexShares Global Upstream Natural Resources Index Fund | 4.0% |
|---|
iShares Global REIT ETF | 3.9% |
|---|
|
|
| Material Fund Change [Text Block] |
Effective May 1, 2026, the name of the Fund changed from "TOPS Moderate Growth ETF Portfolio" to "TOPS Moderate ETF Portfolio." |
|
| C000097927 |
|
|
| Shareholder Report [Line Items] |
|
|
| Fund Name |
TOPS Moderate ETF Portfolio
|
|
| Class Name |
Class 2
|
|
| Trading Symbol |
TMG2
|
|
| Annual or Semi-Annual Statement [Text Block] |
This semi-annual shareholder report contains important information about TOPS Moderate ETF Portfolio for the period of January 1, 2026 to June 30, 2026.
|
|
| Additional Information [Text Block] |
You can find additional information about the Fund at https://topsfunds.com/tops-portfolios/vit/. You can also request this information by contacting us at 1-855-572-5945.
|
|
| Material Fund Change Notice [Text Block] |
This report describes changes to the Fund that occurred during the reporting period.
|
|
| Additional Information Phone Number |
1-855-572-5945
|
|
| Additional Information Website |
https://topsfunds.com/tops-portfolios/vit/
|
|
| Expenses [Text Block] |
What were the Fund’s costs for the last six months?(based on a hypothetical $10,000 investment) Table SummaryClass Name | Costs of a $10,000 investment | Costs paid as a percentage of a $10,000 investment |
|---|
Class 2 | $23 | 0.45%Footnote Reference* |
|---|
| Footnote | Description | Footnote* | Annualized |
|
|
| Expenses Paid, Amount |
$ 23
|
|
| Expense Ratio, Percent |
0.45%
|
[18] |
| Factors Affecting Performance [Text Block] |
How did the Fund perform during the reporting period? The S&P 500 and the Bloomberg U.S. Aggregate Bond Index both fell during the 1st quarter of 2026 ( 4.3% and 0.1%, respectively), yet all the TOPS portfolios delivered positive returns for investors. As the S&P 500 rebounded +15.2% in the 2nd quarter, the TOPS portfolios had a very strong quarter as well, leading to particularly strong performance for the equity-centric TOPS models versus the S&P 500’s return of +10.2% YTD. Year-to-date, small cap (S&P Small Cap 600 Total Return Index) leads at +23.9%, followed by mid cap (S&P MidCap 400 Total Return Index) at +17.3%. Large cap growth (S&P 500 Growth Total Return Index) has gained +12.0%, while large cap value (S&P 500 Value Total Return Index) is up +8.0%. Internationally, emerging markets ex-China (MSCI Emerging Markets ex China Net Return USD Index) leads at +38.8%. Emerging markets ex-state-owned enterprises (WisdomTree Emerging Markets ex State Owned Enterprises Index) have returned +22.4%, while developed international (FTSE Developed ex US All Cap Net Tax [US RIC] Index) is up +14.3%. Broad-based emerging markets (FTSE Emerging Markets All Cap China A Inclusion Net Tax [US RIC] Index) have gained +9.3%. Among other asset classes, global real estate (FTSE EPRA Nareit Global REITs Net Tax Index) has gained +11.6%, while global natural resources (Morningstar Global Upstream Natural Resources Net Return Index) are up +8.4% On the fixed income side, high yield corporate bonds (Solactive USD High Yield Corporates Total Market Index) and emerging market local currency bonds (J.P. Morgan Government Bond Index Emerging Markets Global Core) lead at +1.8%. Short-term TIPS (Bloomberg US Treasury TIPS 0-5 Years Total Return Index Unhedged USD) have gained +1.6%, while global ex-US aggregate bonds (Bloomberg GLA xUSD Float Adjusted RIC Capped Index TR Index Value Hedged USD) are up +1.4%. Short-term corporate bonds (Bloomberg US Corporate 1-3 Yr Total Return Index Value Unhedged USD) have returned +1.2%, followed by mortgage-backed securities (Bloomberg US MBS Float Adjusted Total Return Index Value Unhedged USD) at +1.1% and corporate bonds (ICE BofA US Corporate Index) at +1.0%. Short-term Treasuries (Bloomberg U.S. Treasury: 1-3 Year Total Return Index Value Unhedged USD) are up +0.6%, while intermediate-term Treasuries (Bloomberg U.S. Treasury 3-10 Year Total Return Index Value Unhedged USD) remain slightly negative at -0.1%. |
|
| Performance Past Does Not Indicate Future [Text] |
The Fund’s past performance is not a good predictor of how the Fund will perform in the future.
|
|
| Line Graph [Table Text Block] |
Table Summary | TOPS Moderate ETF Portfolio | S&P 500® Index |
|---|
Jun-2016 | $10,000 | $10,000 |
|---|
Jun-2017 | $11,142 | $11,790 |
|---|
Jun-2018 | $11,974 | $13,484 |
|---|
Jun-2019 | $12,501 | $14,889 |
|---|
Jun-2020 | $12,555 | $16,006 |
|---|
Jun-2021 | $16,038 | $22,536 |
|---|
Jun-2022 | $14,185 | $20,144 |
|---|
Jun-2023 | $15,449 | $24,091 |
|---|
Jun-2024 | $17,139 | $30,006 |
|---|
Jun-2025 | $19,012 | $34,556 |
|---|
Jun-2026 | $22,455 | $42,271 |
|---|
|
|
| Average Annual Return [Table Text Block] |
Table Summary | 6 Months | 1 Year | 5 Years | 10 Years |
|---|
TOPS Moderate ETF Portfolio | 9.61% | 18.11% | 6.96% | 8.43% |
|---|
S&P 500® Index | 10.21% | 22.32% | 13.41% | 15.51% |
|---|
|
|
| No Deduction of Taxes [Text Block] |
The graph and table do not reflect the deduction of taxes that a shareholder would pay on fund distributions or redemption of fund shares.
|
|
| AssetsNet |
$ 290,745,132
|
|
| Holdings Count | Holding |
23
|
|
| Advisory Fees Paid, Amount |
$ 130,676
|
|
| InvestmentCompanyPortfolioTurnover |
6.00%
|
|
| Additional Fund Statistics [Text Block] |
- Net Assets$290,745,132
- Number of Portfolio Holdings23
- Advisory Fee $130,676
- Portfolio Turnover6%
|
|
| Holdings [Text Block] |
Asset Weighting (% of total investments)Table SummaryValue | Value |
|---|
Exchange-Traded Funds | 92.3% | Money Market Funds | 7.7% | Sector Weighting (% of net assets)Table SummaryValue | Value |
|---|
Liabilities in Excess of Other Assets | -6.2% | Money Market Funds | 2.3% | Collateral for Securities Loaned | 5.8% | Fixed Income | 32.8% | Equity | 65.3% | • May represent asset weighting given fund’s investment approach/investments in other investment companies. |
|
| Largest Holdings [Text Block] |
Top 10 Holdings (% of net assets)Table SummaryHolding Name | % of Net Assets |
|---|
Vanguard S&P 500 ETF | 18.1% |
|---|
Vanguard FTSE Developed Markets ETF | 13.0% |
|---|
State Street SPDR Portfolio Short Term Corporate Bond ETF | 9.0% |
|---|
State Street SPDR Portfolio S&P 400 Mid Cap ETF | 8.0% |
|---|
Vanguard Short-Term Inflation-Protected Securities ETF | 6.0% |
|---|
iShares iBoxx $ Investment Grade Corporate Bond ETF | 5.0% |
|---|
Vanguard FTSE Emerging Markets ETF | 4.0% |
|---|
State Street SPDR Portfolio S&P 600 Small Cap ETF | 4.0% |
|---|
FlexShares Global Upstream Natural Resources Index Fund | 4.0% |
|---|
iShares Global REIT ETF | 3.9% |
|---|
|
|
| Material Fund Change [Text Block] |
Effective May 1, 2026, the name of the Fund changed from "TOPS Moderate Growth ETF Portfolio" to "TOPS Moderate ETF Portfolio." |
|
| C000211502 |
|
|
| Shareholder Report [Line Items] |
|
|
| Fund Name |
TOPS Moderate ETF Portfolio
|
|
| Class Name |
Service Class
|
|
| Trading Symbol |
TMGS
|
|
| Annual or Semi-Annual Statement [Text Block] |
This semi-annual shareholder report contains important information about TOPS Moderate ETF Portfolio for the period of January 1, 2026 to June 30, 2026.
|
|
| Additional Information [Text Block] |
You can find additional information about the Fund at https://topsfunds.com/tops-portfolios/vit/. You can also request this information by contacting us at 1-855-572-5945.
|
|
| Material Fund Change Notice [Text Block] |
This report describes changes to the Fund that occurred during the reporting period.
|
|
| Additional Information Phone Number |
1-855-572-5945
|
|
| Additional Information Website |
https://topsfunds.com/tops-portfolios/vit/
|
|
| Expenses [Text Block] |
What were the Fund’s costs for the last six months?(based on a hypothetical $10,000 investment) Table SummaryClass Name | Costs of a $10,000 investment | Costs paid as a percentage of a $10,000 investment |
|---|
Service Class | $26 | 0.51%Footnote Reference* |
|---|
| Footnote | Description | Footnote* | Annualized |
|
|
| Expenses Paid, Amount |
$ 26
|
|
| Expense Ratio, Percent |
0.51%
|
[19] |
| Factors Affecting Performance [Text Block] |
How did the Fund perform during the reporting period? The S&P 500 and the Bloomberg U.S. Aggregate Bond Index both fell during the 1st quarter of 2026 ( 4.3% and 0.1%, respectively), yet all the TOPS portfolios delivered positive returns for investors. As the S&P 500 rebounded +15.2% in the 2nd quarter, the TOPS portfolios had a very strong quarter as well, leading to particularly strong performance for the equity-centric TOPS models versus the S&P 500’s return of +10.2% YTD. Year-to-date, small cap (S&P Small Cap 600 Total Return Index) leads at +23.9%, followed by mid cap (S&P MidCap 400 Total Return Index) at +17.3%. Large cap growth (S&P 500 Growth Total Return Index) has gained +12.0%, while large cap value (S&P 500 Value Total Return Index) is up +8.0%. Internationally, emerging markets ex-China (MSCI Emerging Markets ex China Net Return USD Index) leads at +38.8%. Emerging markets ex-state-owned enterprises (WisdomTree Emerging Markets ex State Owned Enterprises Index) have returned +22.4%, while developed international (FTSE Developed ex US All Cap Net Tax [US RIC] Index) is up +14.3%. Broad-based emerging markets (FTSE Emerging Markets All Cap China A Inclusion Net Tax [US RIC] Index) have gained +9.3%. Among other asset classes, global real estate (FTSE EPRA Nareit Global REITs Net Tax Index) has gained +11.6%, while global natural resources (Morningstar Global Upstream Natural Resources Net Return Index) are up +8.4% On the fixed income side, high yield corporate bonds (Solactive USD High Yield Corporates Total Market Index) and emerging market local currency bonds (J.P. Morgan Government Bond Index Emerging Markets Global Core) lead at +1.8%. Short-term TIPS (Bloomberg US Treasury TIPS 0-5 Years Total Return Index Unhedged USD) have gained +1.6%, while global ex-US aggregate bonds (Bloomberg GLA xUSD Float Adjusted RIC Capped Index TR Index Value Hedged USD) are up +1.4%. Short-term corporate bonds (Bloomberg US Corporate 1-3 Yr Total Return Index Value Unhedged USD) have returned +1.2%, followed by mortgage-backed securities (Bloomberg US MBS Float Adjusted Total Return Index Value Unhedged USD) at +1.1% and corporate bonds (ICE BofA US Corporate Index) at +1.0%. Short-term Treasuries (Bloomberg U.S. Treasury: 1-3 Year Total Return Index Value Unhedged USD) are up +0.6%, while intermediate-term Treasuries (Bloomberg U.S. Treasury 3-10 Year Total Return Index Value Unhedged USD) remain slightly negative at -0.1%. |
|
| Performance Past Does Not Indicate Future [Text] |
The Fund’s past performance is not a good predictor of how the Fund will perform in the future.
|
|
| Line Graph [Table Text Block] |
Table Summary | TOPS Moderate ETF Portfolio | S&P 500® Index |
|---|
Apr-2019 | $10,000 | $10,000 |
|---|
Jun-2019 | $10,058 | $10,024 |
|---|
Jun-2020 | $10,094 | $10,777 |
|---|
Jun-2021 | $12,885 | $15,173 |
|---|
Jun-2022 | $11,387 | $13,562 |
|---|
Jun-2023 | $12,395 | $16,220 |
|---|
Jun-2024 | $13,748 | $20,203 |
|---|
Jun-2025 | $15,237 | $23,266 |
|---|
Jun-2026 | $17,996 | $28,460 |
|---|
|
|
| Average Annual Return [Table Text Block] |
Table Summary | 6 Months | 1 Year | 5 Years | Since Inception (April 30, 2019) |
|---|
TOPS Moderate ETF Portfolio | 9.57% | 18.11% | 6.91% | 8.54% |
|---|
S&P 500® Index | 10.21% | 22.32% | 13.41% | 15.71% |
|---|
|
|
| Performance Inception Date |
Apr. 30, 2019
|
|
| No Deduction of Taxes [Text Block] |
The graph and table do not reflect the deduction of taxes that a shareholder would pay on fund distributions or redemption of fund shares.
|
|
| AssetsNet |
$ 290,745,132
|
|
| Holdings Count | Holding |
23
|
|
| Advisory Fees Paid, Amount |
$ 130,676
|
|
| InvestmentCompanyPortfolioTurnover |
6.00%
|
|
| Additional Fund Statistics [Text Block] |
- Net Assets$290,745,132
- Number of Portfolio Holdings23
- Advisory Fee $130,676
- Portfolio Turnover6%
|
|
| Holdings [Text Block] |
Asset Weighting (% of total investments)Table SummaryValue | Value |
|---|
Exchange-Traded Funds | 92.3% | Money Market Funds | 7.7% | Sector Weighting (% of net assets)Table SummaryValue | Value |
|---|
Liabilities in Excess of Other Assets | -6.2% | Money Market Funds | 2.3% | Collateral for Securities Loaned | 5.8% | Fixed Income | 32.8% | Equity | 65.3% | • May represent asset weighting given fund’s investment approach/investments in other investment companies. |
|
| Largest Holdings [Text Block] |
Top 10 Holdings (% of net assets)Table SummaryHolding Name | % of Net Assets |
|---|
Vanguard S&P 500 ETF | 18.1% |
|---|
Vanguard FTSE Developed Markets ETF | 13.0% |
|---|
State Street SPDR Portfolio Short Term Corporate Bond ETF | 9.0% |
|---|
State Street SPDR Portfolio S&P 400 Mid Cap ETF | 8.0% |
|---|
Vanguard Short-Term Inflation-Protected Securities ETF | 6.0% |
|---|
iShares iBoxx $ Investment Grade Corporate Bond ETF | 5.0% |
|---|
Vanguard FTSE Emerging Markets ETF | 4.0% |
|---|
State Street SPDR Portfolio S&P 600 Small Cap ETF | 4.0% |
|---|
FlexShares Global Upstream Natural Resources Index Fund | 4.0% |
|---|
iShares Global REIT ETF | 3.9% |
|---|
|
|
| Material Fund Change [Text Block] |
Effective May 1, 2026, the name of the Fund changed from "TOPS Moderate Growth ETF Portfolio" to "TOPS Moderate ETF Portfolio." |
|
| C000158837 |
|
|
| Shareholder Report [Line Items] |
|
|
| Fund Name |
TOPS Moderate ETF Portfolio
|
|
| Class Name |
Investor Class
|
|
| Trading Symbol |
TMGI
|
|
| Annual or Semi-Annual Statement [Text Block] |
This semi-annual shareholder report contains important information about TOPS Moderate ETF Portfolio for the period of January 1, 2026 to June 30, 2026.
|
|
| Additional Information [Text Block] |
You can find additional information about the Fund at https://topsfunds.com/tops-portfolios/vit/. You can also request this information by contacting us at 1-855-572-5945.
|
|
| Material Fund Change Notice [Text Block] |
This report describes changes to the Fund that occurred during the reporting period.
|
|
| Additional Information Phone Number |
1-855-572-5945
|
|
| Additional Information Website |
https://topsfunds.com/tops-portfolios/vit/
|
|
| Expenses [Text Block] |
What were the Fund’s costs for the last six months?(based on a hypothetical $10,000 investment) Table SummaryClass Name | Costs of a $10,000 investment | Costs paid as a percentage of a $10,000 investment |
|---|
Investor Class | $36 | 0.70%Footnote Reference* |
|---|
| Footnote | Description | Footnote* | Annualized |
|
|
| Expenses Paid, Amount |
$ 36
|
|
| Expense Ratio, Percent |
0.70%
|
[20] |
| Factors Affecting Performance [Text Block] |
How did the Fund perform during the reporting period? The S&P 500 and the Bloomberg U.S. Aggregate Bond Index both fell during the 1st quarter of 2026 ( 4.3% and 0.1%, respectively), yet all the TOPS portfolios delivered positive returns for investors. As the S&P 500 rebounded +15.2% in the 2nd quarter, the TOPS portfolios had a very strong quarter as well, leading to particularly strong performance for the equity-centric TOPS models versus the S&P 500’s return of +10.2% YTD. Year-to-date, small cap (S&P Small Cap 600 Total Return Index) leads at +23.9%, followed by mid cap (S&P MidCap 400 Total Return Index) at +17.3%. Large cap growth (S&P 500 Growth Total Return Index) has gained +12.0%, while large cap value (S&P 500 Value Total Return Index) is up +8.0%. Internationally, emerging markets ex-China (MSCI Emerging Markets ex China Net Return USD Index) leads at +38.8%. Emerging markets ex-state-owned enterprises (WisdomTree Emerging Markets ex State Owned Enterprises Index) have returned +22.4%, while developed international (FTSE Developed ex US All Cap Net Tax [US RIC] Index) is up +14.3%. Broad-based emerging markets (FTSE Emerging Markets All Cap China A Inclusion Net Tax [US RIC] Index) have gained +9.3%. Among other asset classes, global real estate (FTSE EPRA Nareit Global REITs Net Tax Index) has gained +11.6%, while global natural resources (Morningstar Global Upstream Natural Resources Net Return Index) are up +8.4% On the fixed income side, high yield corporate bonds (Solactive USD High Yield Corporates Total Market Index) and emerging market local currency bonds (J.P. Morgan Government Bond Index Emerging Markets Global Core) lead at +1.8%. Short-term TIPS (Bloomberg US Treasury TIPS 0-5 Years Total Return Index Unhedged USD) have gained +1.6%, while global ex-US aggregate bonds (Bloomberg GLA xUSD Float Adjusted RIC Capped Index TR Index Value Hedged USD) are up +1.4%. Short-term corporate bonds (Bloomberg US Corporate 1-3 Yr Total Return Index Value Unhedged USD) have returned +1.2%, followed by mortgage-backed securities (Bloomberg US MBS Float Adjusted Total Return Index Value Unhedged USD) at +1.1% and corporate bonds (ICE BofA US Corporate Index) at +1.0%. Short-term Treasuries (Bloomberg U.S. Treasury: 1-3 Year Total Return Index Value Unhedged USD) are up +0.6%, while intermediate-term Treasuries (Bloomberg U.S. Treasury 3-10 Year Total Return Index Value Unhedged USD) remain slightly negative at -0.1%. |
|
| Performance Past Does Not Indicate Future [Text] |
The Fund’s past performance is not a good predictor of how the Fund will perform in the future.
|
|
| Line Graph [Table Text Block] |
Table Summary | TOPS Moderate ETF Portfolio | S&P 500® Index |
|---|
Jul-2015 | $10,000 | $10,000 |
|---|
Jun-2016 | $9,938 | $10,139 |
|---|
Jun-2017 | $10,971 | $11,954 |
|---|
Jun-2018 | $11,720 | $13,672 |
|---|
Jun-2019 | $12,262 | $15,096 |
|---|
Jun-2020 | $12,289 | $16,229 |
|---|
Jun-2021 | $15,645 | $22,850 |
|---|
Jun-2022 | $13,809 | $20,424 |
|---|
Jun-2023 | $14,999 | $24,426 |
|---|
Jun-2024 | $16,607 | $30,424 |
|---|
Jun-2025 | $18,365 | $35,037 |
|---|
Jun-2026 | $21,647 | $42,859 |
|---|
|
|
| Average Annual Return [Table Text Block] |
Table Summary | 6 Months | 1 Year | 5 Years | 10 Years |
|---|
TOPS Moderate ETF Portfolio | 9.52% | 17.87% | 6.71% | 8.10% |
|---|
S&P 500® Index | 10.21% | 22.32% | 13.41% | 15.51% |
|---|
|
|
| No Deduction of Taxes [Text Block] |
The graph and table do not reflect the deduction of taxes that a shareholder would pay on fund distributions or redemption of fund shares.
|
|
| AssetsNet |
$ 290,745,132
|
|
| Holdings Count | Holding |
23
|
|
| Advisory Fees Paid, Amount |
$ 130,676
|
|
| InvestmentCompanyPortfolioTurnover |
6.00%
|
|
| Additional Fund Statistics [Text Block] |
- Net Assets$290,745,132
- Number of Portfolio Holdings23
- Advisory Fee $130,676
- Portfolio Turnover6%
|
|
| Holdings [Text Block] |
Asset Weighting (% of total investments)Table SummaryValue | Value |
|---|
Exchange-Traded Funds | 92.3% | Money Market Funds | 7.7% | Sector Weighting (% of net assets)Table SummaryValue | Value |
|---|
Liabilities in Excess of Other Assets | -6.2% | Money Market Funds | 2.3% | Collateral for Securities Loaned | 5.8% | Fixed Income | 32.8% | Equity | 65.3% | • May represent asset weighting given fund’s investment approach/investments in other investment companies. |
|
| Largest Holdings [Text Block] |
Top 10 Holdings (% of net assets)Table SummaryHolding Name | % of Net Assets |
|---|
Vanguard S&P 500 ETF | 18.1% |
|---|
Vanguard FTSE Developed Markets ETF | 13.0% |
|---|
State Street SPDR Portfolio Short Term Corporate Bond ETF | 9.0% |
|---|
State Street SPDR Portfolio S&P 400 Mid Cap ETF | 8.0% |
|---|
Vanguard Short-Term Inflation-Protected Securities ETF | 6.0% |
|---|
iShares iBoxx $ Investment Grade Corporate Bond ETF | 5.0% |
|---|
Vanguard FTSE Emerging Markets ETF | 4.0% |
|---|
State Street SPDR Portfolio S&P 600 Small Cap ETF | 4.0% |
|---|
FlexShares Global Upstream Natural Resources Index Fund | 4.0% |
|---|
iShares Global REIT ETF | 3.9% |
|---|
|
|
| Material Fund Change [Text Block] |
Effective May 1, 2026, the name of the Fund changed from "TOPS Moderate Growth ETF Portfolio" to "TOPS Moderate ETF Portfolio." |
|
|
|