Shareholder Report
Jun. 30, 2026
USD ($)
Holding
This report describes material changes to the Fund that occurred during the reporting period.
What were the Fund costs for the last year?
(based on a hypothetical $10,000 investment)
| Fund (Class) | Costs of a $10,000 investment |
Costs paid as a percentage of a $10,000 investment |
| JPMorgan Equity Premium Income Fund (Class R6 Shares) |
$36 | 0.34% |
How did the Fund Perform?
The Fund's Class R6 Shares returned 7.86% for the twelve months ended June 30, 2026. The S&P 500 Index (the "Index") returned 22.32% and the ICE BofA 3-Month US Treasury Bill Index returned 3.84% for the twelve months ended June 30, 2026.
- The Fund’s security selection in the information technology and communication services sectors detracted from performance.
- An overweight in ServiceNow and an underweight in Micron Technology were among the top detractors.
- The Fund captured 34% of the Index’s positive return with 58% of its volatility.
- The Fund’s security selection in the real estate sector contributed to performance.
- An underweight in Microsoft and an overweight in Ross Stores were among the top contributors.
Fund Performance
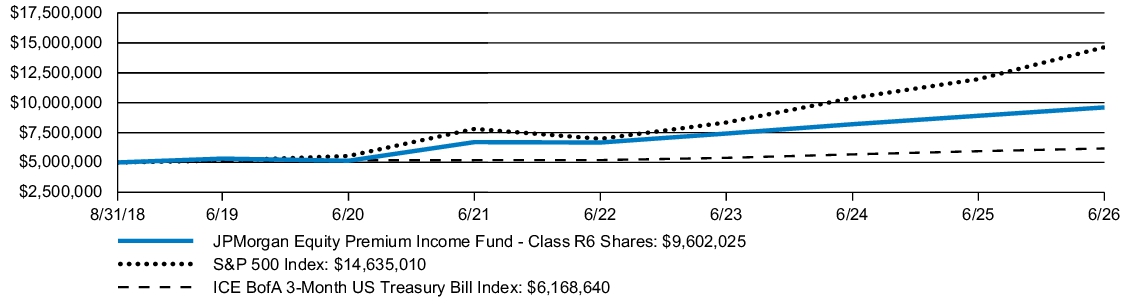
| AVERAGE ANNUAL TOTAL RETURNS | INCEPTION DATE |
1 YEAR | 5 YEAR | SINCE INCEPTION |
|||
| JPMorgan Equity Premium Income Fund (Class R6 Shares) | August 31, 2018 | 7.86 | % | 7.47 | % | 8.69 | % |
| S&P 500 Index | 22.32 | 13.41 | 14.69 | ||||
| ICE BofA 3-Month US Treasury Bill Index | 3.84 | 3.53 | 2.72 |
KEY FUND STATISTICS
| Fund net assets (000's) | $5,084,772 | |
| Total number of portfolio holdings | 129 | |
| Portfolio turnover rate | 183 | % |
| Total advisory fees paid (000's) | $14,818 |
PORTFOLIO COMPOSITION - SECTOR
(% of Total Investments)
(% of Total Investments)
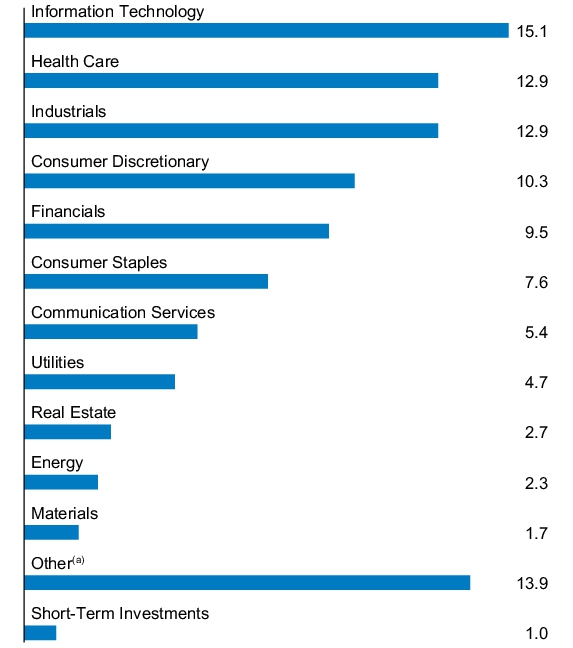
| (a) | Equity-Linked Notes that are linked to the S&P 500 Index. |
Material changes to the Fund during the period
The Fund added “Significant Holdings Risk” to its prospectus as of March 1, 2026. Although the Fund is considered “diversified” under applicable law, a relatively large portion of its portfolio at times may be invested in a relatively small number of securities, or investments (including futures) whose performance relates in part to the economic results of a relatively small number of securities, or in a combination of the foregoing.
The Fund added “Derivatives Risk” disclosure to its prospectus as of March 1, 2026. This disclosure was added in light of a larger concentration of portfolio securities invested in derivatives.
This is a summary of certain changes to the Fund since July 1, 2025. For more complete information, you may review the Fund’s prospectus at www.jpmorganfunds.com/funddocuments or upon request at 1-800-480-4111.
The Fund added “Significant Holdings Risk” to its prospectus as of March 1, 2026. Although the Fund is considered “diversified” under applicable law, a relatively large portion of its portfolio at times may be invested in a relatively small number of securities, or investments (including futures) whose performance relates in part to the economic results of a relatively small number of securities, or in a combination of the foregoing.
The Fund added “Derivatives Risk” disclosure to its prospectus as of March 1, 2026. This disclosure was added in light of a larger concentration of portfolio securities invested in derivatives.
This is a summary of certain changes to the Fund since July 1, 2025. For more complete information, you may review the Fund’s prospectus at www.jpmorganfunds.com/funddocuments or upon request at 1-800-480-4111.
This report describes material changes to the Fund that occurred during the reporting period.
What were the Fund costs for the last year?
(based on a hypothetical $10,000 investment)
| Fund (Class) | Costs of a $10,000 investment |
Costs paid as a percentage of a $10,000 investment |
| JPMorgan Equity Premium Income Fund (Class R5 Shares) |
$47 | 0.45% |
How did the Fund Perform?
The Fund's Class R5 Shares returned 7.75% for the twelve months ended June 30, 2026. The S&P 500 Index (the "Index") returned 22.32% and the ICE BofA 3-Month US Treasury Bill Index returned 3.84% for the twelve months ended June 30, 2026.
- The Fund’s security selection in the information technology and communication services sectors detracted from performance.
- An overweight in ServiceNow and an underweight in Micron Technology were among the top detractors.
- The Fund captured 34% of the Index’s positive return with 58% of its volatility.
- The Fund’s security selection in the real estate sector contributed to performance.
- An underweight in Microsoft and an overweight in Ross Stores were among the top contributors.
Fund Performance
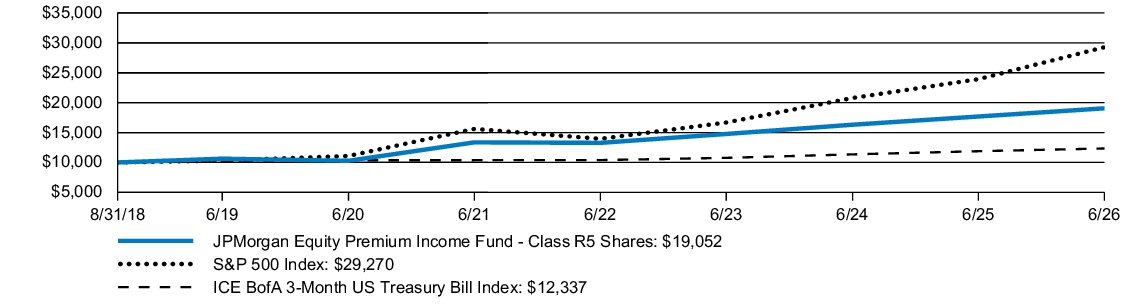
| AVERAGE ANNUAL TOTAL RETURNS | INCEPTION DATE |
1 YEAR | 5 YEAR | SINCE INCEPTION |
|||
| JPMorgan Equity Premium Income Fund (Class R5 Shares) | August 31, 2018 | 7.75 | % | 7.36 | % | 8.58 | % |
| S&P 500 Index | 22.32 | 13.41 | 14.69 | ||||
| ICE BofA 3-Month US Treasury Bill Index | 3.84 | 3.53 | 2.72 |
KEY FUND STATISTICS
| Fund net assets (000's) | $5,084,772 | |
| Total number of portfolio holdings | 129 | |
| Portfolio turnover rate | 183 | % |
| Total advisory fees paid (000's) | $14,818 |
PORTFOLIO COMPOSITION - SECTOR
(% of Total Investments)
(% of Total Investments)
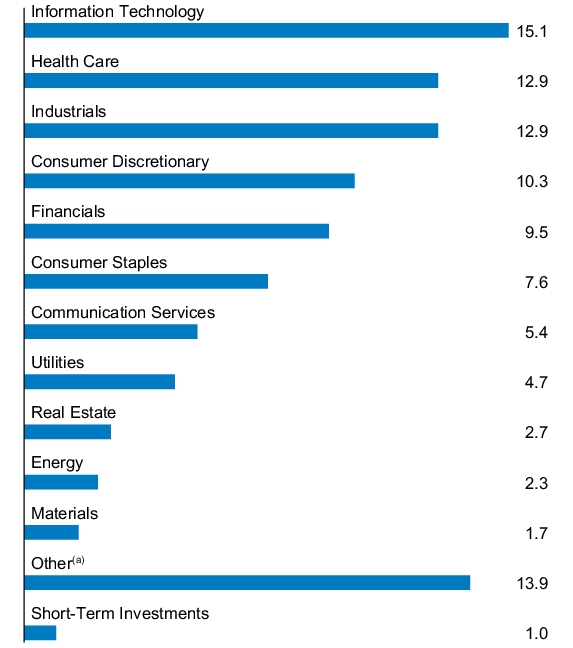
| (a) | Equity-Linked Notes that are linked to the S&P 500 Index. |
Material changes to the Fund during the period
The Fund added “Significant Holdings Risk” to its prospectus as of March 1, 2026. Although the Fund is considered “diversified” under applicable law, a relatively large portion of its portfolio at times may be invested in a relatively small number of securities, or investments (including futures) whose performance relates in part to the economic results of a relatively small number of securities, or in a combination of the foregoing.
The Fund added “Derivatives Risk” disclosure to its prospectus as of March 1, 2026. This disclosure was added in light of a larger concentration of portfolio securities invested in derivatives.
This is a summary of certain changes to the Fund since July 1, 2025. For more complete information, you may review the Fund’s prospectus at www.jpmorganfunds.com/funddocuments or upon request at 1-800-480-4111.
The Fund added “Significant Holdings Risk” to its prospectus as of March 1, 2026. Although the Fund is considered “diversified” under applicable law, a relatively large portion of its portfolio at times may be invested in a relatively small number of securities, or investments (including futures) whose performance relates in part to the economic results of a relatively small number of securities, or in a combination of the foregoing.
The Fund added “Derivatives Risk” disclosure to its prospectus as of March 1, 2026. This disclosure was added in light of a larger concentration of portfolio securities invested in derivatives.
This is a summary of certain changes to the Fund since July 1, 2025. For more complete information, you may review the Fund’s prospectus at www.jpmorganfunds.com/funddocuments or upon request at 1-800-480-4111.
This report describes material changes to the Fund that occurred during the reporting period.
What were the Fund costs for the last year?
(based on a hypothetical $10,000 investment)
| Fund (Class) | Costs of a $10,000 investment |
Costs paid as a percentage of a $10,000 investment |
| JPMorgan Equity Premium Income Fund (Class I Shares) |
$62 | 0.59% |
How did the Fund Perform?
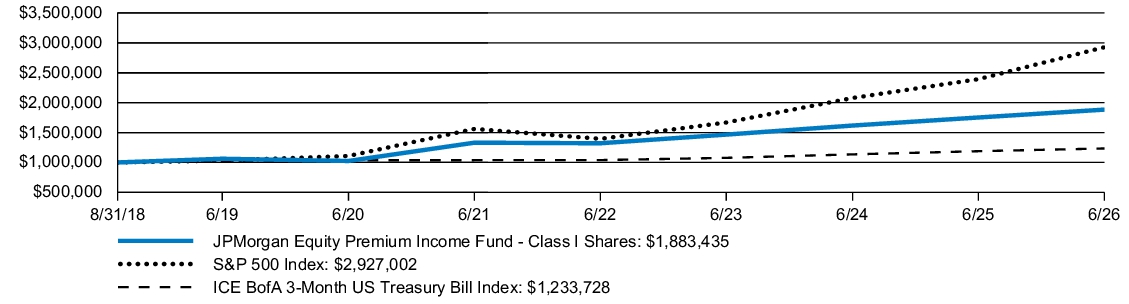
The Fund's Class I Shares returned 7.52% for the twelve months ended June 30, 2026. The S&P 500 Index (the "Index") returned 22.32% and the ICE BofA 3-Month US Treasury Bill Index returned 3.84% for the twelve months ended June 30, 2026.
- The Fund’s security selection in the information technology and communication services sectors detracted from performance.
- An overweight in ServiceNow and an underweight in Micron Technology were among the top detractors.
- The Fund captured 34% of the Index’s positive return with 58% of its volatility.
- The Fund’s security selection in the real estate sector contributed to performance.
- An underweight in Microsoft and an overweight in Ross Stores were among the top contributors.
Fund Performance
| AVERAGE ANNUAL TOTAL RETURNS | INCEPTION DATE |
1 YEAR | 5 YEAR | SINCE INCEPTION |
|||
| JPMorgan Equity Premium Income Fund (Class I Shares) | August 31, 2018 | 7.52 | % | 7.20 | % | 8.42 | % |
| S&P 500 Index | 22.32 | 13.41 | 14.69 | ||||
| ICE BofA 3-Month US Treasury Bill Index | 3.84 | 3.53 | 2.72 |
KEY FUND STATISTICS
| Fund net assets (000's) | $5,084,772 | |
| Total number of portfolio holdings | 129 | |
| Portfolio turnover rate | 183 | % |
| Total advisory fees paid (000's) | $14,818 |
PORTFOLIO COMPOSITION - SECTOR
(% of Total Investments)
(% of Total Investments)
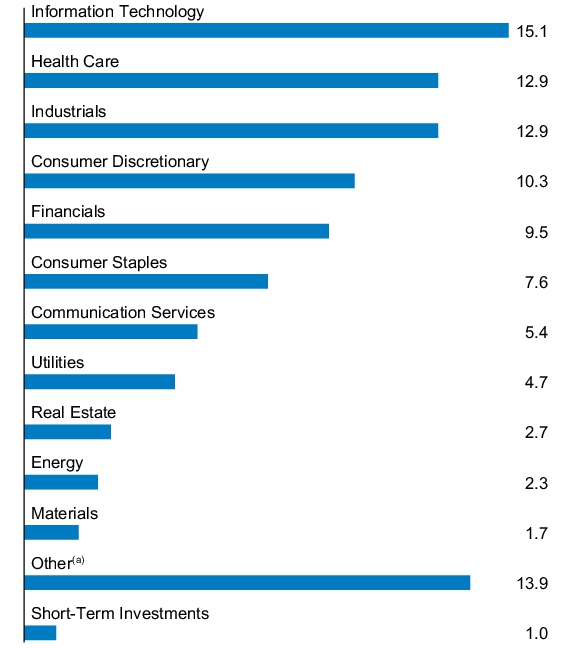
| (a) | Equity-Linked Notes that are linked to the S&P 500 Index. |
Material changes to the Fund during the period
The Fund added “Significant Holdings Risk” to its prospectus as of March 1, 2026. Although the Fund is considered “diversified” under applicable law, a relatively large portion of its portfolio at times may be invested in a relatively small number of securities, or investments (including futures) whose performance relates in part to the economic results of a relatively small number of securities, or in a combination of the foregoing.
The Fund added “Derivatives Risk” disclosure to its prospectus as of March 1, 2026. This disclosure was added in light of a larger concentration of portfolio securities invested in derivatives.
This is a summary of certain changes to the Fund since July 1, 2025. For more complete information, you may review the Fund’s prospectus at www.jpmorganfunds.com/funddocuments or upon request at 1-800-480-4111.
The Fund added “Significant Holdings Risk” to its prospectus as of March 1, 2026. Although the Fund is considered “diversified” under applicable law, a relatively large portion of its portfolio at times may be invested in a relatively small number of securities, or investments (including futures) whose performance relates in part to the economic results of a relatively small number of securities, or in a combination of the foregoing.
The Fund added “Derivatives Risk” disclosure to its prospectus as of March 1, 2026. This disclosure was added in light of a larger concentration of portfolio securities invested in derivatives.
This is a summary of certain changes to the Fund since July 1, 2025. For more complete information, you may review the Fund’s prospectus at www.jpmorganfunds.com/funddocuments or upon request at 1-800-480-4111.
This report describes material changes to the Fund that occurred during the reporting period.
What were the Fund costs for the last year?
(based on a hypothetical $10,000 investment)
| Fund (Class) | Costs of a $10,000 investment |
Costs paid as a percentage of a $10,000 investment |
| JPMorgan Equity Premium Income Fund (Class C Shares) |
$139 | 1.35% |
How did the Fund Perform?
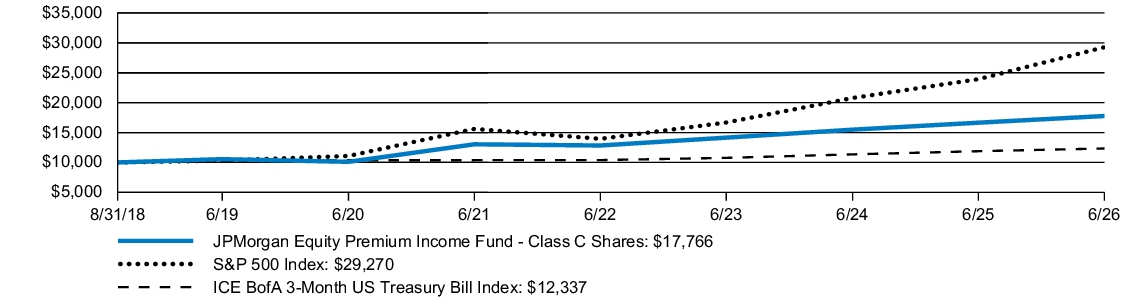
The Fund's Class C Shares, without a sales charge, returned 6.71% for the twelve months ended June 30, 2026. The S&P 500 Index (the "Index") returned 22.32% and the ICE BofA 3-Month US Treasury Bill Index returned 3.84% for the twelve months ended June 30, 2026.
- The Fund’s security selection in the information technology and communication services sectors detracted from performance.
- An overweight in ServiceNow and an underweight in Micron Technology were among the top detractors.
- The Fund captured 34% of the Index’s positive return with 58% of its volatility.
- The Fund’s security selection in the real estate sector contributed to performance.
- An underweight in Microsoft and an overweight in Ross Stores were among the top contributors.
Fund Performance
| AVERAGE ANNUAL TOTAL RETURNS | INCEPTION DATE |
1 YEAR | 5 YEAR | SINCE INCEPTION |
|||
| JPMorgan Equity Premium Income Fund (Class C Shares) | August 31, 2018 | 5.71 | % | 6.39 | % | 7.62 | % |
| JPMorgan Equity Premium Income Fund (Class C Shares) - excluding sales charge | 6.71 | 6.39 | 7.62 | ||||
| S&P 500 Index | 22.32 | 13.41 | 14.69 | ||||
| ICE BofA 3-Month US Treasury Bill Index | 3.84 | 3.53 | 2.72 |
KEY FUND STATISTICS
| Fund net assets (000's) | $5,084,772 | |
| Total number of portfolio holdings | 129 | |
| Portfolio turnover rate | 183 | % |
| Total advisory fees paid (000's) | $14,818 |
PORTFOLIO COMPOSITION - SECTOR
(% of Total Investments)
(% of Total Investments)
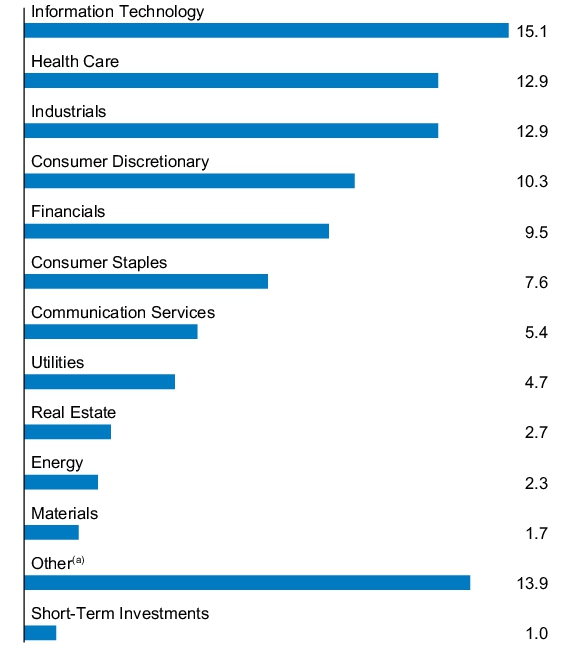
| (a) | Equity-Linked Notes that are linked to the S&P 500 Index. |
Material changes to the Fund during the period
The Fund added “Significant Holdings Risk” to its prospectus as of March 1, 2026. Although the Fund is considered “diversified” under applicable law, a relatively large portion of its portfolio at times may be invested in a relatively small number of securities, or investments (including futures) whose performance relates in part to the economic results of a relatively small number of securities, or in a combination of the foregoing.
The Fund added “Derivatives Risk” disclosure to its prospectus as of March 1, 2026. This disclosure was added in light of a larger concentration of portfolio securities invested in derivatives.
This is a summary of certain changes to the Fund since July 1, 2025. For more complete information, you may review the Fund’s prospectus at www.jpmorganfunds.com/funddocuments or upon request at 1-800-480-4111.
The Fund added “Significant Holdings Risk” to its prospectus as of March 1, 2026. Although the Fund is considered “diversified” under applicable law, a relatively large portion of its portfolio at times may be invested in a relatively small number of securities, or investments (including futures) whose performance relates in part to the economic results of a relatively small number of securities, or in a combination of the foregoing.
The Fund added “Derivatives Risk” disclosure to its prospectus as of March 1, 2026. This disclosure was added in light of a larger concentration of portfolio securities invested in derivatives.
This is a summary of certain changes to the Fund since July 1, 2025. For more complete information, you may review the Fund’s prospectus at www.jpmorganfunds.com/funddocuments or upon request at 1-800-480-4111.
This report describes material changes to the Fund that occurred during the reporting period.
What were the Fund costs for the last year?
(based on a hypothetical $10,000 investment)
| Fund (Class) | Costs of a $10,000 investment |
Costs paid as a percentage of a $10,000 investment |
| JPMorgan Equity Premium Income Fund (Class A Shares) |
$88 | 0.85% |
How did the Fund Perform?
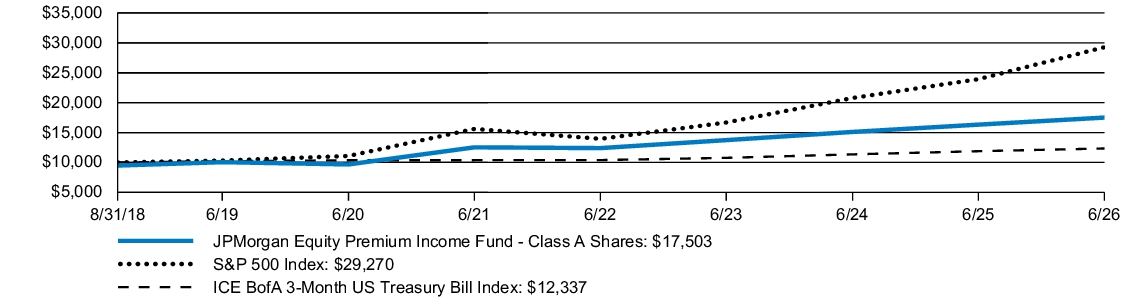
The Fund's Class A Shares, without a sales charge, returned 7.25% for the twelve months ended June 30, 2026. The S&P 500 Index (the "Index") returned 22.32% and the ICE BofA 3-Month US Treasury Bill Index returned 3.84% for the twelve months ended June 30, 2026.
- The Fund’s security selection in the information technology and communication services sectors detracted from performance.
- An overweight in ServiceNow and an underweight in Micron Technology were among the top detractors.
- The Fund captured 34% of the Index’s positive return with 58% of its volatility.
- The Fund’s security selection in the real estate sector contributed to performance.
- An underweight in Microsoft and an overweight in Ross Stores were among the top contributors.
Fund Performance
| AVERAGE ANNUAL TOTAL RETURNS | INCEPTION DATE |
1 YEAR | 5 YEAR | SINCE INCEPTION |
|||
| JPMorgan Equity Premium Income Fund (Class A Shares) | August 31, 2018 | 1.61 | % | 5.78 | % | 7.41 | % |
| JPMorgan Equity Premium Income Fund (Class A Shares) - excluding sales charge | 7.25 | 6.92 | 8.15 | ||||
| S&P 500 Index | 22.32 | 13.41 | 14.69 | ||||
| ICE BofA 3-Month US Treasury Bill Index | 3.84 | 3.53 | 2.72 |
KEY FUND STATISTICS
| Fund net assets (000's) | $5,084,772 | |
| Total number of portfolio holdings | 129 | |
| Portfolio turnover rate | 183 | % |
| Total advisory fees paid (000's) | $14,818 |
PORTFOLIO COMPOSITION - SECTOR
(% of Total Investments)
(% of Total Investments)
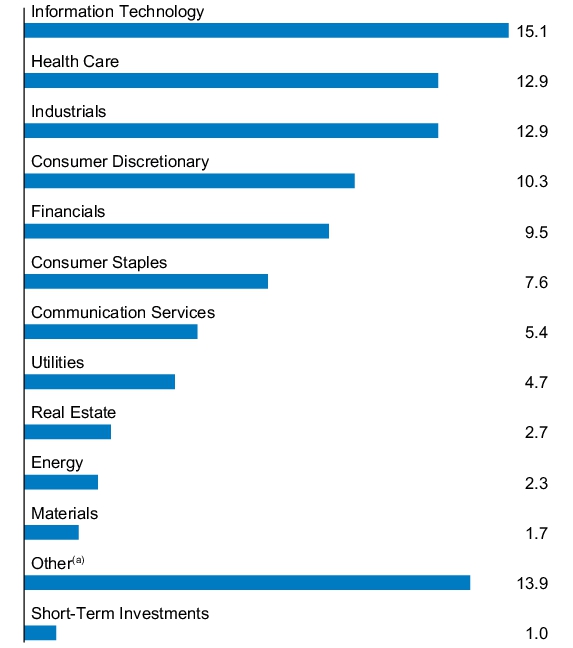
| (a) | Equity-Linked Notes that are linked to the S&P 500 Index. |
Material changes to the Fund during the period
The Fund added “Significant Holdings Risk” to its prospectus as of March 1, 2026. Although the Fund is considered “diversified” under applicable law, a relatively large portion of its portfolio at times may be invested in a relatively small number of securities, or investments (including futures) whose performance relates in part to the economic results of a relatively small number of securities, or in a combination of the foregoing.
The Fund added “Derivatives Risk” disclosure to its prospectus as of March 1, 2026. This disclosure was added in light of a larger concentration of portfolio securities invested in derivatives.
This is a summary of certain changes to the Fund since July 1, 2025. For more complete information, you may review the Fund’s prospectus at www.jpmorganfunds.com/funddocuments or upon request at 1-800-480-4111.
The Fund added “Significant Holdings Risk” to its prospectus as of March 1, 2026. Although the Fund is considered “diversified” under applicable law, a relatively large portion of its portfolio at times may be invested in a relatively small number of securities, or investments (including futures) whose performance relates in part to the economic results of a relatively small number of securities, or in a combination of the foregoing.
The Fund added “Derivatives Risk” disclosure to its prospectus as of March 1, 2026. This disclosure was added in light of a larger concentration of portfolio securities invested in derivatives.
This is a summary of certain changes to the Fund since July 1, 2025. For more complete information, you may review the Fund’s prospectus at www.jpmorganfunds.com/funddocuments or upon request at 1-800-480-4111.
This report describes material changes to the Fund that occurred during the reporting period.
What were the Fund costs for the last year?
(based on a hypothetical $10,000 investment)
| Fund (Class) | Costs of a $10,000 investment |
Costs paid as a percentage of a $10,000 investment |
| JPMorgan Hedged Equity 2 Fund (Class A Shares) |
$98 | 0.92% |
How did the Fund Perform?
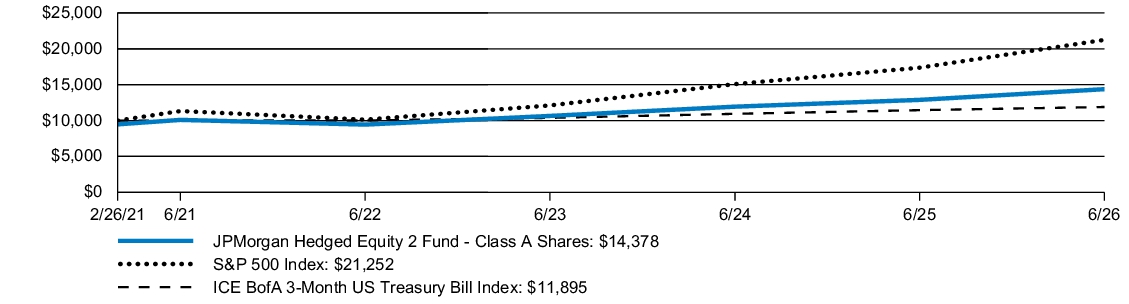
The Fund's Class A Shares, without a sales charge, returned 11.57% for the twelve months ended June 30, 2026. The S&P 500 Index (the "Index") returned 21.88% and the ICE BofA 3-Month US Treasury Bill Index returned 3.84% for the twelve months ended June 30, 2026.
- The Fund captured 53% of the Index’s positive return with 67% of its volatility.
- The Fund’s security selection in the industrial cyclical and software and services sectors detracted from relative performance.
- The Fund’s underweight allocations to Intel and Applied Materials were among the top detractors.
- The Fund’s security selection in the pharm/MedTech and financial services sectors contributed to relative performance.
- The Fund’s overweight allocations to Seagate Technology and Micron Technology were among the top contributors.
Fund Performance
| AVERAGE ANNUAL TOTAL RETURNS | INCEPTION DATE |
1 YEAR | 5 YEAR | SINCE INCEPTION |
|||
| JPMorgan Hedged Equity 2 Fund (Class A Shares) | February 26, 2021 | 5.73 | % | 6.18 | % | 7.04 | % |
| JPMorgan Hedged Equity 2 Fund (Class A Shares) - excluding sales charge | 11.57 | 7.33 | 8.12 | ||||
| S&P 500 Index | 21.88 | 12.92 | 14.67 | ||||
| ICE BofA 3-Month US Treasury Bill Index | 3.84 | 3.53 | 3.31 |
KEY FUND STATISTICS
| Fund net assets (000's) | $5,496,391 | |
| Total number of portfolio holdings | 158 | |
| Portfolio turnover rate | 48 | % |
| Total advisory fees paid (000's) | $13,404 |
PORTFOLIO COMPOSITION - SECTOR
(% of Total Investments)
(% of Total Investments)
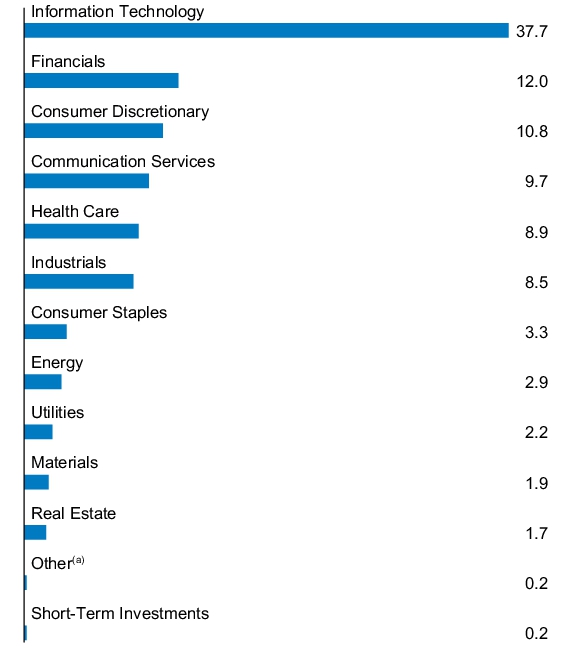
| (a) | Put Options Purchased |
Material changes to the Fund during the period
Effective January 29, 2026, the Fund began engaging in securities lending and using the cash collateral received from those activities to post margin for options on futures contracts. As a result of the cost of this financing, which excludes offsetting interest earned on the collateral posted, the Fund’s annual net expense ratio increased from 0.84% as of June 30, 2025 to 0.92% as of June 30, 2026.
The Fund added “Significant Holdings Risk” to its prospectus as of March 1, 2026. Although the Fund is considered “diversified” under applicable law, a relatively large portion of its portfolio at times may be invested in a relatively small number of securities, or investments (including futures) whose performance relates in part to the economic results of a relatively small number of securities, or in a combination of the foregoing.
This is a summary of certain changes to the Fund since July 1, 2025. For more complete information, you may review the Fund’s prospectus at www.jpmorganfunds.com/funddocuments or upon request at 1-800-480-4111.
Effective January 29, 2026, the Fund began engaging in securities lending and using the cash collateral received from those activities to post margin for options on futures contracts. As a result of the cost of this financing, which excludes offsetting interest earned on the collateral posted, the Fund’s annual net expense ratio increased from 0.84% as of June 30, 2025 to 0.92% as of June 30, 2026.
The Fund added “Significant Holdings Risk” to its prospectus as of March 1, 2026. Although the Fund is considered “diversified” under applicable law, a relatively large portion of its portfolio at times may be invested in a relatively small number of securities, or investments (including futures) whose performance relates in part to the economic results of a relatively small number of securities, or in a combination of the foregoing.
This is a summary of certain changes to the Fund since July 1, 2025. For more complete information, you may review the Fund’s prospectus at www.jpmorganfunds.com/funddocuments or upon request at 1-800-480-4111.
This report describes material changes to the Fund that occurred during the reporting period.
What were the Fund costs for the last year?
(based on a hypothetical $10,000 investment)
| Fund (Class) | Costs of a $10,000 investment |
Costs paid as a percentage of a $10,000 investment |
| JPMorgan Hedged Equity 2 Fund (Class C Shares) |
$150 | 1.42% |
How did the Fund Perform?
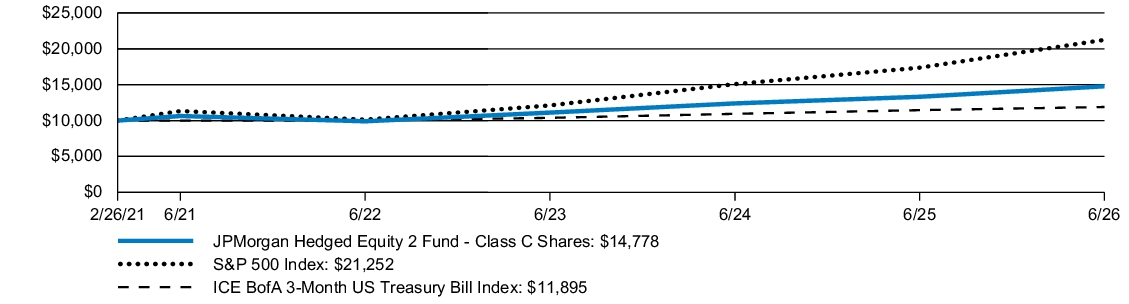
The Fund's Class C Shares, without a sales charge, returned 10.98% for the twelve months ended June 30, 2026. The S&P 500 Index (the "Index") returned 21.88% and the ICE BofA 3-Month US Treasury Bill Index returned 3.84% for the twelve months ended June 30, 2026.
- The Fund captured 53% of the Index’s positive return with 67% of its volatility.
- The Fund’s security selection in the industrial cyclical and software and services sectors detracted from relative performance.
- The Fund’s underweight allocations to Intel and Applied Materials were among the top detractors.
- The Fund’s security selection in the pharm/MedTech and financial services sectors contributed to relative performance.
- The Fund’s overweight allocations to Seagate Technology and Micron Technology were among the top contributors.
Fund Performance
| AVERAGE ANNUAL TOTAL RETURNS | INCEPTION DATE |
1 YEAR | 5 YEAR | SINCE INCEPTION |
|||
| JPMorgan Hedged Equity 2 Fund (Class C Shares) | February 26, 2021 | 9.98 | % | 6.80 | % | 7.59 | % |
| JPMorgan Hedged Equity 2 Fund (Class C Shares) - excluding sales charge | 10.98 | 6.80 | 7.59 | ||||
| S&P 500 Index | 21.88 | 12.92 | 14.67 | ||||
| ICE BofA 3-Month US Treasury Bill Index | 3.84 | 3.53 | 3.31 |
KEY FUND STATISTICS
| Fund net assets (000's) | $5,496,391 | |
| Total number of portfolio holdings | 158 | |
| Portfolio turnover rate | 48 | % |
| Total advisory fees paid (000's) | $13,404 |
PORTFOLIO COMPOSITION - SECTOR
(% of Total Investments)
(% of Total Investments)
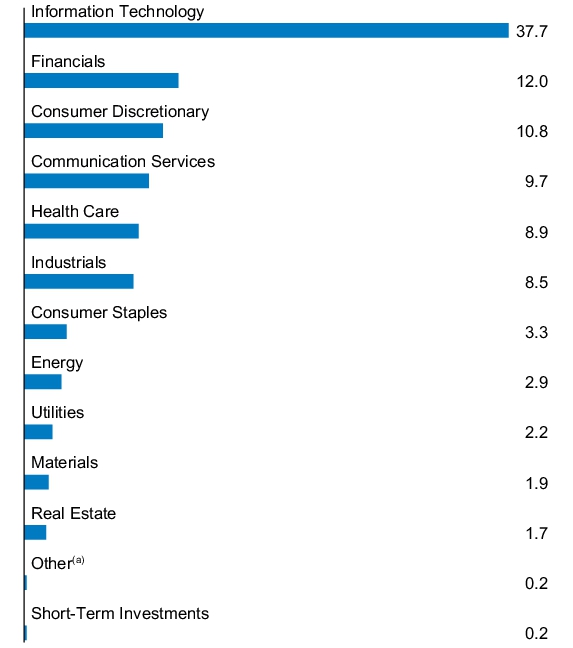
| (a) | Put Options Purchased |
Material changes to the Fund during the period
Effective January 29, 2026, the Fund began engaging in securities lending and using the cash collateral received from those activities to post margin for options on futures contracts. As a result of the cost of this financing, which excludes offsetting interest earned on the collateral posted, the Fund’s annual net expense ratio increased from 1.34% as of June 30, 2025 to 1.42% as of June 30, 2026.
The Fund added “Significant Holdings Risk” to its prospectus as of March 1, 2026. Although the Fund is considered “diversified” under applicable law, a relatively large portion of its portfolio at times may be invested in a relatively small number of securities, or investments (including futures) whose performance relates in part to the economic results of a relatively small number of securities, or in a combination of the foregoing.
This is a summary of certain changes to the Fund since July 1, 2025. For more complete information, you may review the Fund’s prospectus at www.jpmorganfunds.com/funddocuments or upon request at 1-800-480-4111.
Effective January 29, 2026, the Fund began engaging in securities lending and using the cash collateral received from those activities to post margin for options on futures contracts. As a result of the cost of this financing, which excludes offsetting interest earned on the collateral posted, the Fund’s annual net expense ratio increased from 1.34% as of June 30, 2025 to 1.42% as of June 30, 2026.
The Fund added “Significant Holdings Risk” to its prospectus as of March 1, 2026. Although the Fund is considered “diversified” under applicable law, a relatively large portion of its portfolio at times may be invested in a relatively small number of securities, or investments (including futures) whose performance relates in part to the economic results of a relatively small number of securities, or in a combination of the foregoing.
This is a summary of certain changes to the Fund since July 1, 2025. For more complete information, you may review the Fund’s prospectus at www.jpmorganfunds.com/funddocuments or upon request at 1-800-480-4111.
This report describes material changes to the Fund that occurred during the reporting period.
What were the Fund costs for the last year?
(based on a hypothetical $10,000 investment)
| Fund (Class) | Costs of a $10,000 investment |
Costs paid as a percentage of a $10,000 investment |
| JPMorgan Hedged Equity 2 Fund (Class I Shares) |
$71 | 0.67% |
How did the Fund Perform?
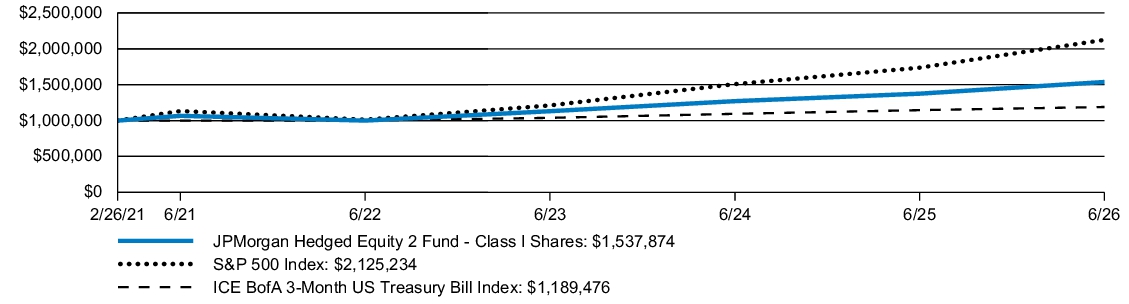
The Fund's Class I Shares returned 11.85% for the twelve months ended June 30, 2026. The S&P 500 Index (the "Index") returned 21.88% and the ICE BofA 3-Month US Treasury Bill Index returned 3.84% for the twelve months ended June 30, 2026.
- The Fund captured 53% of the Index’s positive return with 67% of its volatility.
- The Fund’s security selection in the industrial cyclical and software and services sectors detracted from relative performance.
- The Fund’s underweight allocations to Intel and Applied Materials were among the top detractors.
- The Fund’s security selection in the pharm/MedTech and financial services sectors contributed to relative performance.
- The Fund’s overweight allocations to Seagate Technology and Micron Technology were among the top contributors.
Fund Performance
| AVERAGE ANNUAL TOTAL RETURNS | INCEPTION DATE |
1 YEAR | 5 YEAR | SINCE INCEPTION |
|||
| JPMorgan Hedged Equity 2 Fund (Class I Shares) | February 26, 2021 | 11.85 | % | 7.60 | % | 8.39 | % |
| S&P 500 Index | 21.88 | 12.92 | 14.67 | ||||
| ICE BofA 3-Month US Treasury Bill Index | 3.84 | 3.53 | 3.31 |
KEY FUND STATISTICS
| Fund net assets (000's) | $5,496,391 | |
| Total number of portfolio holdings | 158 | |
| Portfolio turnover rate | 48 | % |
| Total advisory fees paid (000's) | $13,404 |
PORTFOLIO COMPOSITION - SECTOR
(% of Total Investments)
(% of Total Investments)
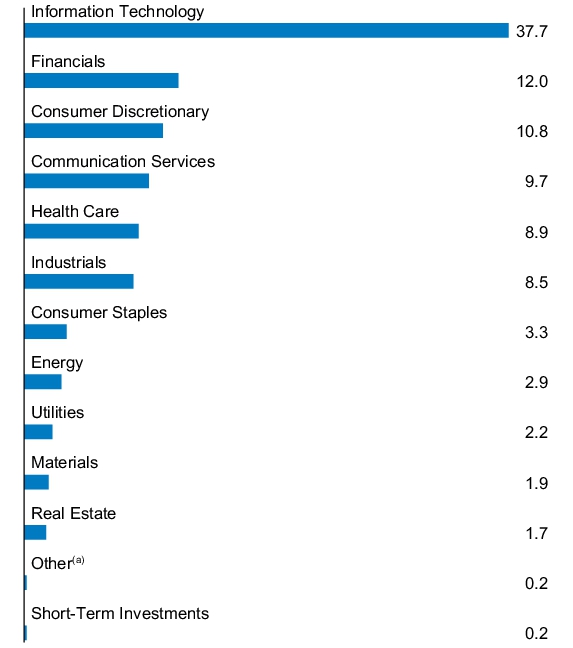
| (a) | Put Options Purchased |
Material changes to the Fund during the period
Effective January 29, 2026, the Fund began engaging in securities lending and using the cash collateral received from those activities to post margin for options on futures contracts. As a result of the cost of this financing, which excludes offsetting interest earned on the collateral posted, the Fund’s annual net expense ratio increased from 0.59% as of June 30, 2025 to 0.67% as of June 30, 2026.
The Fund added “Significant Holdings Risk” to its prospectus as of March 1, 2026. Although the Fund is considered “diversified” under applicable law, a relatively large portion of its portfolio at times may be invested in a relatively small number of securities, or investments (including futures) whose performance relates in part to the economic results of a relatively small number of securities, or in a combination of the foregoing.
This is a summary of certain changes to the Fund since July 1, 2025. For more complete information, you may review the Fund’s prospectus at www.jpmorganfunds.com/funddocuments or upon request at 1-800-480-4111.
Effective January 29, 2026, the Fund began engaging in securities lending and using the cash collateral received from those activities to post margin for options on futures contracts. As a result of the cost of this financing, which excludes offsetting interest earned on the collateral posted, the Fund’s annual net expense ratio increased from 0.59% as of June 30, 2025 to 0.67% as of June 30, 2026.
The Fund added “Significant Holdings Risk” to its prospectus as of March 1, 2026. Although the Fund is considered “diversified” under applicable law, a relatively large portion of its portfolio at times may be invested in a relatively small number of securities, or investments (including futures) whose performance relates in part to the economic results of a relatively small number of securities, or in a combination of the foregoing.
This is a summary of certain changes to the Fund since July 1, 2025. For more complete information, you may review the Fund’s prospectus at www.jpmorganfunds.com/funddocuments or upon request at 1-800-480-4111.
This report describes material changes to the Fund that occurred during the reporting period.
What were the Fund costs for the last year?
(based on a hypothetical $10,000 investment)
| Fund (Class) | Costs of a $10,000 investment |
Costs paid as a percentage of a $10,000 investment |
| JPMorgan Hedged Equity 2 Fund (Class R5 Shares) |
$56 | 0.53% |
How did the Fund Perform?
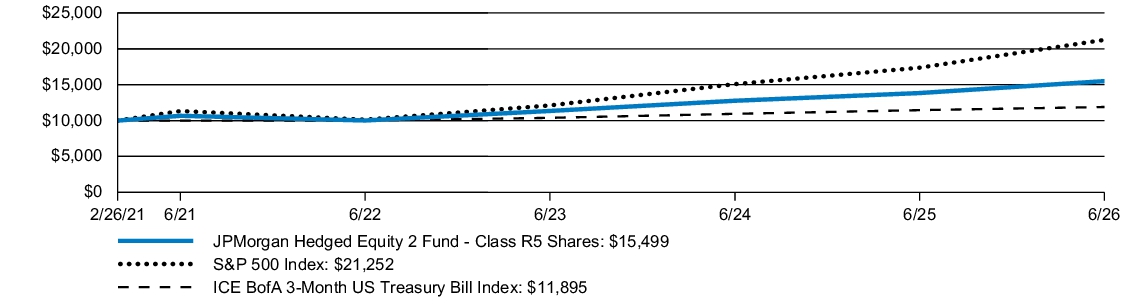
The Fund's Class R5 Shares returned 12.01% for the twelve months ended June 30, 2026. The S&P 500 Index (the "Index") returned 21.88% and the ICE BofA 3-Month US Treasury Bill Index returned 3.84% for the twelve months ended June 30, 2026.
- The Fund captured 53% of the Index’s positive return with 67% of its volatility.
- The Fund’s security selection in the industrial cyclical and software and services sectors detracted from relative performance.
- The Fund’s underweight allocations to Intel and Applied Materials were among the top detractors.
- The Fund’s security selection in the pharm/MedTech and financial services sectors contributed to relative performance.
- The Fund’s overweight allocations to Seagate Technology and Micron Technology were among the top contributors.
Fund Performance
| AVERAGE ANNUAL TOTAL RETURNS | INCEPTION DATE |
1 YEAR | 5 YEAR | SINCE INCEPTION |
|||
| JPMorgan Hedged Equity 2 Fund (Class R5 Shares) | February 26, 2021 | 12.01 | % | 7.76 | % | 8.55 | % |
| S&P 500 Index | 21.88 | 12.92 | 14.67 | ||||
| ICE BofA 3-Month US Treasury Bill Index | 3.84 | 3.53 | 3.31 |
KEY FUND STATISTICS
| Fund net assets (000's) | $5,496,391 | |
| Total number of portfolio holdings | 158 | |
| Portfolio turnover rate | 48 | % |
| Total advisory fees paid (000's) | $13,404 |
PORTFOLIO COMPOSITION - SECTOR
(% of Total Investments)
(% of Total Investments)
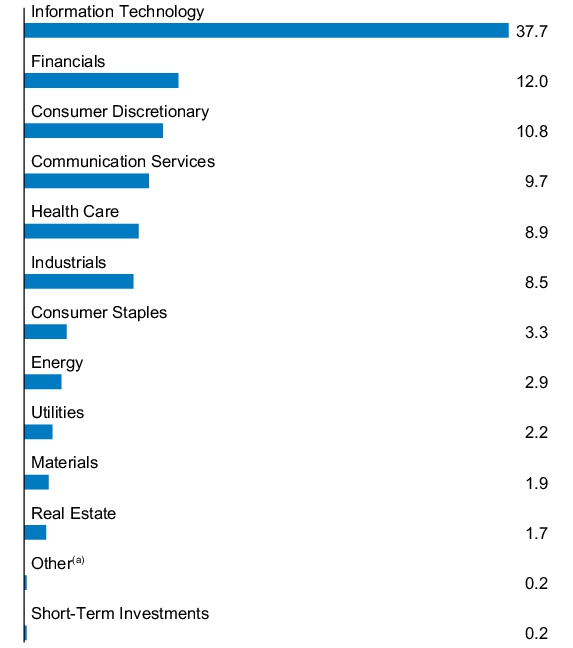
| (a) | Put Options Purchased |
Material changes to the Fund during the period
Effective January 29, 2026, the Fund began engaging in securities lending and using the cash collateral received from those activities to post margin for options on futures contracts. As a result of the cost of this financing, which excludes offsetting interest earned on the collateral posted, the Fund’s annual net expense ratio increased from 0.45% as of June 30, 2025 to 0.53% as of June 30, 2026.
The Fund added “Significant Holdings Risk” to its prospectus as of March 1, 2026. Although the Fund is considered “diversified” under applicable law, a relatively large portion of its portfolio at times may be invested in a relatively small number of securities, or investments (including futures) whose performance relates in part to the economic results of a relatively small number of securities, or in a combination of the foregoing.
This is a summary of certain changes to the Fund since July 1, 2025. For more complete information, you may review the Fund’s prospectus at www.jpmorganfunds.com/funddocuments or upon request at 1-800-480-4111.
Effective January 29, 2026, the Fund began engaging in securities lending and using the cash collateral received from those activities to post margin for options on futures contracts. As a result of the cost of this financing, which excludes offsetting interest earned on the collateral posted, the Fund’s annual net expense ratio increased from 0.45% as of June 30, 2025 to 0.53% as of June 30, 2026.
The Fund added “Significant Holdings Risk” to its prospectus as of March 1, 2026. Although the Fund is considered “diversified” under applicable law, a relatively large portion of its portfolio at times may be invested in a relatively small number of securities, or investments (including futures) whose performance relates in part to the economic results of a relatively small number of securities, or in a combination of the foregoing.
This is a summary of certain changes to the Fund since July 1, 2025. For more complete information, you may review the Fund’s prospectus at www.jpmorganfunds.com/funddocuments or upon request at 1-800-480-4111.
This report describes material changes to the Fund that occurred during the reporting period.
What were the Fund costs for the last year?
(based on a hypothetical $10,000 investment)
| Fund (Class) | Costs of a $10,000 investment |
Costs paid as a percentage of a $10,000 investment |
| JPMorgan Hedged Equity 2 Fund (Class R6 Shares) |
$45 | 0.42% |
How did the Fund Perform?
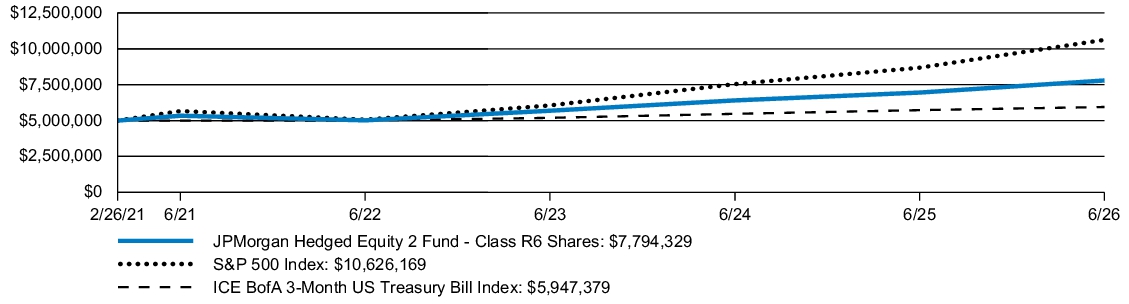
The Fund's Class R6 Shares returned 12.12% for the twelve months ended June 30, 2026. The S&P 500 Index (the "Index") returned 21.88% and the ICE BofA 3-Month US Treasury Bill Index returned 3.84% for the twelve months ended June 30, 2026.
- The Fund captured 53% of the Index’s positive return with 67% of its volatility.
- The Fund’s security selection in the industrial cyclical and software and services sectors detracted from relative performance.
- The Fund’s underweight allocations to Intel and Applied Materials were among the top detractors.
- The Fund’s security selection in the pharm/MedTech and financial services sectors contributed to relative performance.
- The Fund’s overweight allocations to Seagate Technology and Micron Technology were among the top contributors.
Fund Performance
| AVERAGE ANNUAL TOTAL RETURNS | INCEPTION DATE |
1 YEAR | 5 YEAR | SINCE INCEPTION |
|||
| JPMorgan Hedged Equity 2 Fund (Class R6 Shares) | February 26, 2021 | 12.12 | % | 7.87 | % | 8.67 | % |
| S&P 500 Index | 21.88 | 12.92 | 14.67 | ||||
| ICE BofA 3-Month US Treasury Bill Index | 3.84 | 3.53 | 3.31 |
KEY FUND STATISTICS
| Fund net assets (000's) | $5,496,391 | |
| Total number of portfolio holdings | 158 | |
| Portfolio turnover rate | 48 | % |
| Total advisory fees paid (000's) | $13,404 |
PORTFOLIO COMPOSITION - SECTOR
(% of Total Investments)
(% of Total Investments)
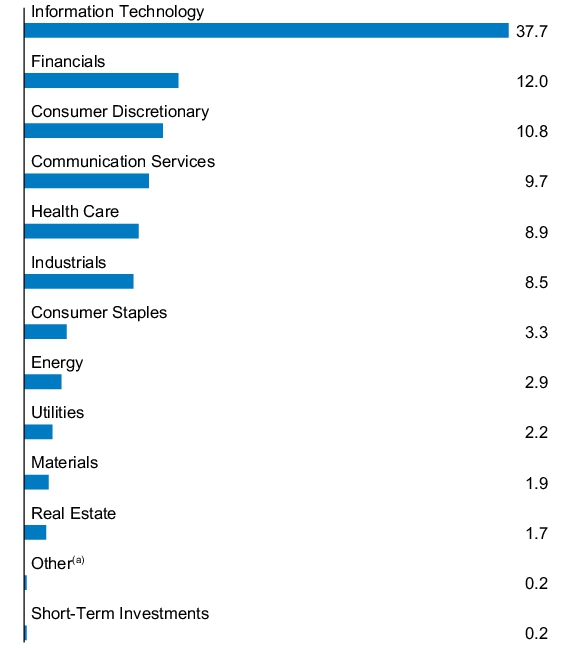
| (a) | Put Options Purchased |
Material changes to the Fund during the period
Effective January 29, 2026, the Fund began engaging in securities lending and using the cash collateral received from those activities to post margin for options on futures contracts. As a result of the cost of this financing, which excludes offsetting interest earned on the collateral posted, the Fund’s annual net expense ratio increased from 0.34% as of June 30, 2025 to 0.42% as of June 30, 2026.
The Fund added “Significant Holdings Risk” to its prospectus as of March 1, 2026. Although the Fund is considered “diversified” under applicable law, a relatively large portion of its portfolio at times may be invested in a relatively small number of securities, or investments (including futures) whose performance relates in part to the economic results of a relatively small number of securities, or in a combination of the foregoing.
This is a summary of certain changes to the Fund since July 1, 2025. For more complete information, you may review the Fund’s prospectus at www.jpmorganfunds.com/funddocuments or upon request at 1-800-480-4111.
Effective January 29, 2026, the Fund began engaging in securities lending and using the cash collateral received from those activities to post margin for options on futures contracts. As a result of the cost of this financing, which excludes offsetting interest earned on the collateral posted, the Fund’s annual net expense ratio increased from 0.34% as of June 30, 2025 to 0.42% as of June 30, 2026.
The Fund added “Significant Holdings Risk” to its prospectus as of March 1, 2026. Although the Fund is considered “diversified” under applicable law, a relatively large portion of its portfolio at times may be invested in a relatively small number of securities, or investments (including futures) whose performance relates in part to the economic results of a relatively small number of securities, or in a combination of the foregoing.
This is a summary of certain changes to the Fund since July 1, 2025. For more complete information, you may review the Fund’s prospectus at www.jpmorganfunds.com/funddocuments or upon request at 1-800-480-4111.
This report describes material changes to the Fund that occurred during the reporting period.
What were the Fund costs for the last year?
(based on a hypothetical $10,000 investment)
| Fund (Class) | Costs of a $10,000 investment |
Costs paid as a percentage of a $10,000 investment |
| JPMorgan Hedged Equity 3 Fund (Class R6 Shares) |
$44 | 0.42% |
How did the Fund Perform?
The Fund's Class R6 Shares returned 9.99% for the twelve months ended June 30, 2026. The S&P 500 Index (the "Index") returned 21.88% and the ICE BofA 3-Month US Treasury Bill Index returned 3.84% for the twelve months ended June 30, 2026.
- The Fund captured 44% of the Index’s positive return with 55% of its volatility.
- The Fund’s security selection in the financial services and consumer cyclical sectors contributed to relative performance.
- The overweight allocations to Seagate Technology and Micron Technology were among the top contributors.
- The Fund’s security selection in the industrial cyclical and software and services sectors detracted from relative performance.
- The underweight allocations to Intel and Applied Materials were among the top detractors.
Fund Performance
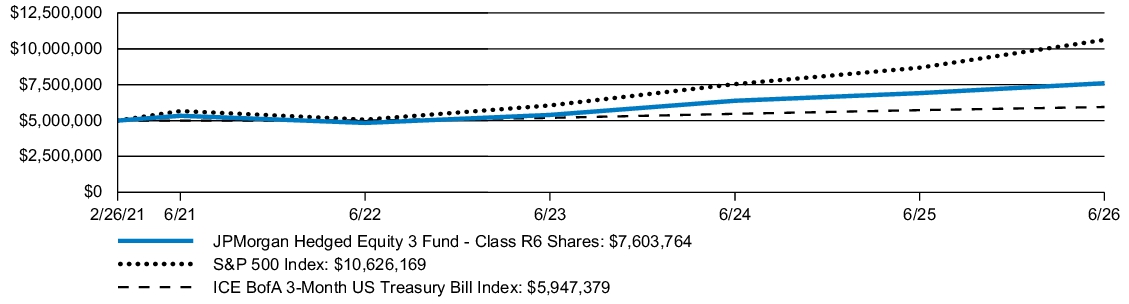
| AVERAGE ANNUAL TOTAL RETURNS | INCEPTION DATE |
1 YEAR | 5 YEAR | SINCE INCEPTION |
|||
| JPMorgan Hedged Equity 3 Fund (Class R6 Shares) | February 26, 2021 | 9.99 | % | 7.35 | % | 8.17 | % |
| S&P 500 Index | 21.88 | 12.92 | 14.67 | ||||
| ICE BofA 3-Month US Treasury Bill Index | 3.84 | 3.53 | 3.31 |
KEY FUND STATISTICS
| Fund net assets (000's) | $3,198,101 | |
| Total number of portfolio holdings | 158 | |
| Portfolio turnover rate | 35 | % |
| Total advisory fees paid (000's) | $6,973 |
PORTFOLIO COMPOSITION - SECTOR
(% of Total Investments)
(% of Total Investments)
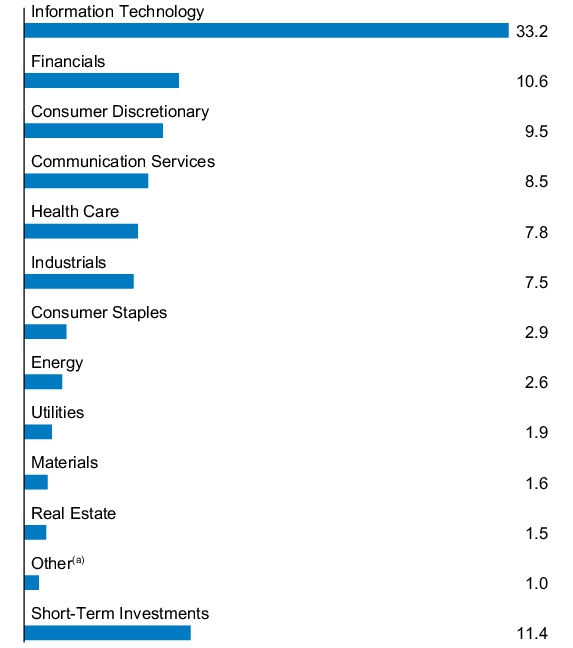
| (a) | Put Options Purchased |
Material changes to the Fund during the period
Effective February 26, 2026, the Fund began engaging in securities lending and using the cash collateral received from those activities to post margin for options on futures contracts. As a result of the cost of this financing, which excludes offsetting interest earned on the collateral posted, the Fund’s annual net expense ratio increased from 0.34% as of June 30, 2025 to 0.42% as of June 30, 2026.
The Fund added “Significant Holdings Risk” to its prospectus as of March 1, 2026. Although the Fund is considered “diversified” under applicable law, a relatively large portion of its portfolio at times may be invested in a relatively small number of securities, or investments (including futures) whose performance relates in part to the economic results of a relatively small number of securities, or in a combination of the foregoing.
This is a summary of certain changes to the Fund since July 1, 2025. For more complete information, you may review the Fund’s prospectus at www.jpmorganfunds.com/funddocuments or upon request at 1-800-480-4111.
Effective February 26, 2026, the Fund began engaging in securities lending and using the cash collateral received from those activities to post margin for options on futures contracts. As a result of the cost of this financing, which excludes offsetting interest earned on the collateral posted, the Fund’s annual net expense ratio increased from 0.34% as of June 30, 2025 to 0.42% as of June 30, 2026.
The Fund added “Significant Holdings Risk” to its prospectus as of March 1, 2026. Although the Fund is considered “diversified” under applicable law, a relatively large portion of its portfolio at times may be invested in a relatively small number of securities, or investments (including futures) whose performance relates in part to the economic results of a relatively small number of securities, or in a combination of the foregoing.
This is a summary of certain changes to the Fund since July 1, 2025. For more complete information, you may review the Fund’s prospectus at www.jpmorganfunds.com/funddocuments or upon request at 1-800-480-4111.
This report describes material changes to the Fund that occurred during the reporting period.
What were the Fund costs for the last year?
(based on a hypothetical $10,000 investment)
| Fund (Class) | Costs of a $10,000 investment |
Costs paid as a percentage of a $10,000 investment |
| JPMorgan Hedged Equity 3 Fund (Class R5 Shares) |
$54 | 0.52% |
How did the Fund Perform?
The Fund's Class R5 Shares returned 9.88% for the twelve months ended June 30, 2026. The S&P 500 Index (the "Index") returned 21.88% and the ICE BofA 3-Month US Treasury Bill Index returned 3.84% for the twelve months ended June 30, 2026.
- The Fund captured 44% of the Index’s positive return with 55% of its volatility.
- The Fund’s security selection in the financial services and consumer cyclical sectors contributed to relative performance.
- The overweight allocations to Seagate Technology and Micron Technology were among the top contributors.
- The Fund’s security selection in the industrial cyclical and software and services sectors detracted from relative performance.
- The underweight allocations to Intel and Applied Materials were among the top detractors.
Fund Performance
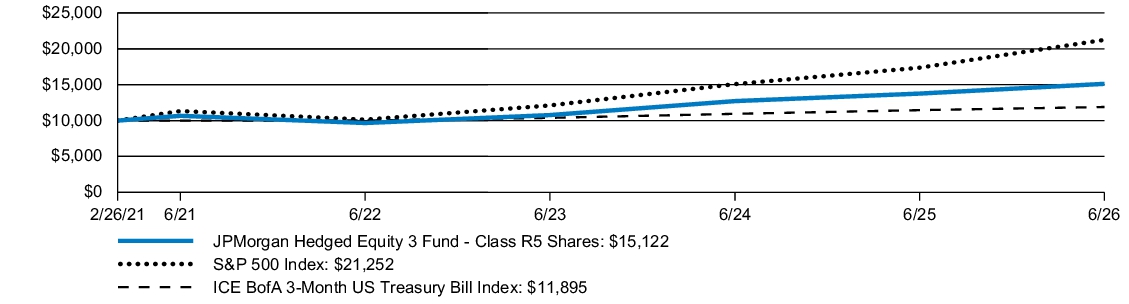
| AVERAGE ANNUAL TOTAL RETURNS | INCEPTION DATE |
1 YEAR | 5 YEAR | SINCE INCEPTION |
|||
| JPMorgan Hedged Equity 3 Fund (Class R5 Shares) | February 26, 2021 | 9.88 | % | 7.23 | % | 8.05 | % |
| S&P 500 Index | 21.88 | 12.92 | 14.67 | ||||
| ICE BofA 3-Month US Treasury Bill Index | 3.84 | 3.53 | 3.31 |
KEY FUND STATISTICS
| Fund net assets (000's) | $3,198,101 | |
| Total number of portfolio holdings | 158 | |
| Portfolio turnover rate | 35 | % |
| Total advisory fees paid (000's) | $6,973 |
PORTFOLIO COMPOSITION - SECTOR
(% of Total Investments)
(% of Total Investments)
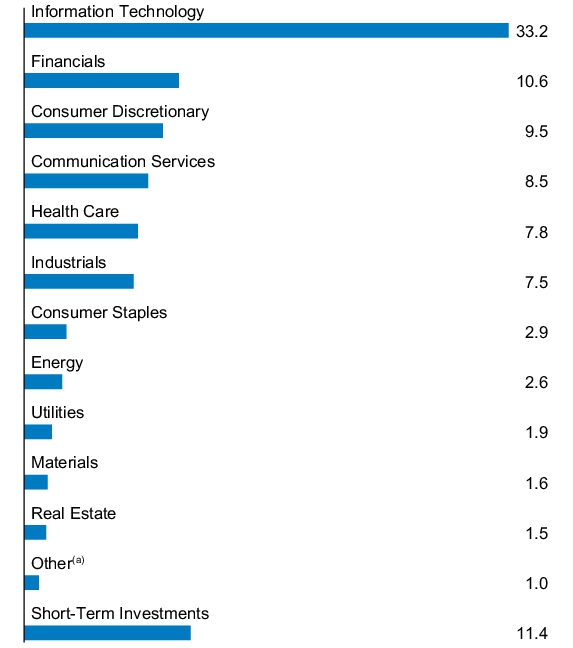
| (a) | Put Options Purchased |
Material changes to the Fund during the period
Effective February 26, 2026, the Fund began engaging in securities lending and using the cash collateral received from those activities to post margin for options on futures contracts. As a result of the cost of this financing, which excludes offsetting interest earned on the collateral posted, the Fund’s annual net expense ratio increased from 0.44% as of June 30, 2025 to 0.52% as of June 30, 2026.
The Fund added “Significant Holdings Risk” to its prospectus as of March 1, 2026. Although the Fund is considered “diversified” under applicable law, a relatively large portion of its portfolio at times may be invested in a relatively small number of securities, or investments (including futures) whose performance relates in part to the economic results of a relatively small number of securities, or in a combination of the foregoing.
This is a summary of certain changes to the Fund since July 1, 2025. For more complete information, you may review the Fund’s prospectus at www.jpmorganfunds.com/funddocuments or upon request at 1-800-480-4111.
Effective February 26, 2026, the Fund began engaging in securities lending and using the cash collateral received from those activities to post margin for options on futures contracts. As a result of the cost of this financing, which excludes offsetting interest earned on the collateral posted, the Fund’s annual net expense ratio increased from 0.44% as of June 30, 2025 to 0.52% as of June 30, 2026.
The Fund added “Significant Holdings Risk” to its prospectus as of March 1, 2026. Although the Fund is considered “diversified” under applicable law, a relatively large portion of its portfolio at times may be invested in a relatively small number of securities, or investments (including futures) whose performance relates in part to the economic results of a relatively small number of securities, or in a combination of the foregoing.
This is a summary of certain changes to the Fund since July 1, 2025. For more complete information, you may review the Fund’s prospectus at www.jpmorganfunds.com/funddocuments or upon request at 1-800-480-4111.
This report describes material changes to the Fund that occurred during the reporting period.
What were the Fund costs for the last year?
(based on a hypothetical $10,000 investment)
| Fund (Class) | Costs of a $10,000 investment |
Costs paid as a percentage of a $10,000 investment |
| JPMorgan Hedged Equity 3 Fund (Class I Shares) |
$70 | 0.67% |
How did the Fund Perform?
The Fund's Class I Shares returned 9.72% for the twelve months ended June 30, 2026. The S&P 500 Index (the "Index") returned 21.88% and the ICE BofA 3-Month US Treasury Bill Index returned 3.84% for the twelve months ended June 30, 2026.
- The Fund captured 44% of the Index’s positive return with 55% of its volatility.
- The Fund’s security selection in the financial services and consumer cyclical sectors contributed to relative performance.
- The overweight allocations to Seagate Technology and Micron Technology were among the top contributors.
- The Fund’s security selection in the industrial cyclical and software and services sectors detracted from relative performance.
- The underweight allocations to Intel and Applied Materials were among the top detractors.
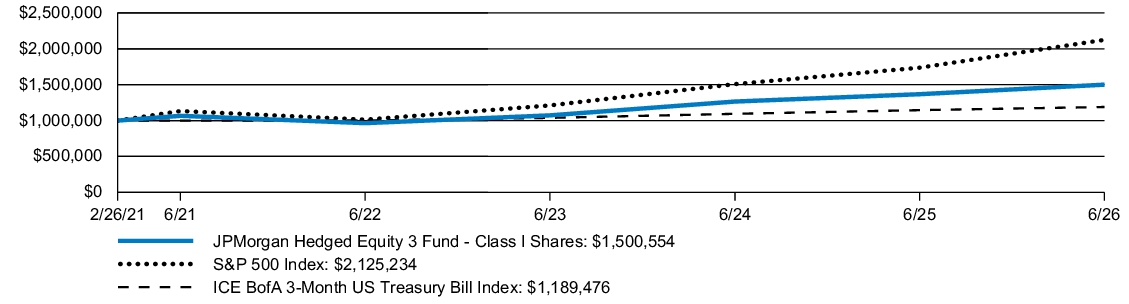
Fund Performance
| AVERAGE ANNUAL TOTAL RETURNS | INCEPTION DATE |
1 YEAR | 5 YEAR | SINCE INCEPTION |
|||
| JPMorgan Hedged Equity 3 Fund (Class I Shares) | February 26, 2021 | 9.72 | % | 7.07 | % | 7.90 | % |
| S&P 500 Index | 21.88 | 12.92 | 14.67 | ||||
| ICE BofA 3-Month US Treasury Bill Index | 3.84 | 3.53 | 3.31 |
KEY FUND STATISTICS
| Fund net assets (000's) | $3,198,101 | |
| Total number of portfolio holdings | 158 | |
| Portfolio turnover rate | 35 | % |
| Total advisory fees paid (000's) | $6,973 |
PORTFOLIO COMPOSITION - SECTOR
(% of Total Investments)
(% of Total Investments)
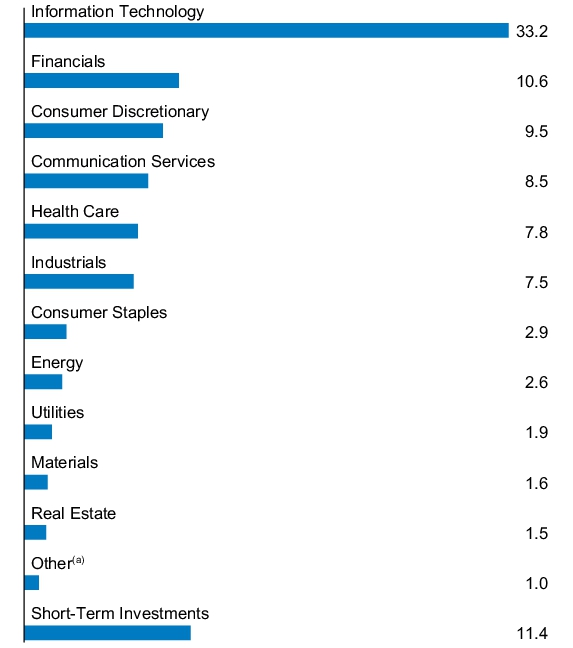
| (a) | Put Options Purchased |
Material changes to the Fund during the period
Effective February 26, 2026, the Fund began engaging in securities lending and using the cash collateral received from those activities to post margin for options on futures contracts. As a result of the cost of this financing, which excludes offsetting interest earned on the collateral posted, the Fund’s annual net expense ratio increased from 0.59% as of June 30, 2025 to 0.67% as of June 30, 2026.
The Fund added “Significant Holdings Risk” to its prospectus as of March 1, 2026. Although the Fund is considered “diversified” under applicable law, a relatively large portion of its portfolio at times may be invested in a relatively small number of securities, or investments (including futures) whose performance relates in part to the economic results of a relatively small number of securities, or in a combination of the foregoing.
This is a summary of certain changes to the Fund since July 1, 2025. For more complete information, you may review the Fund’s prospectus at www.jpmorganfunds.com/funddocuments or upon request at 1-800-480-4111.
Effective February 26, 2026, the Fund began engaging in securities lending and using the cash collateral received from those activities to post margin for options on futures contracts. As a result of the cost of this financing, which excludes offsetting interest earned on the collateral posted, the Fund’s annual net expense ratio increased from 0.59% as of June 30, 2025 to 0.67% as of June 30, 2026.
The Fund added “Significant Holdings Risk” to its prospectus as of March 1, 2026. Although the Fund is considered “diversified” under applicable law, a relatively large portion of its portfolio at times may be invested in a relatively small number of securities, or investments (including futures) whose performance relates in part to the economic results of a relatively small number of securities, or in a combination of the foregoing.
This is a summary of certain changes to the Fund since July 1, 2025. For more complete information, you may review the Fund’s prospectus at www.jpmorganfunds.com/funddocuments or upon request at 1-800-480-4111.
This report describes material changes to the Fund that occurred during the reporting period.
What were the Fund costs for the last year?
(based on a hypothetical $10,000 investment)
| Fund (Class) | Costs of a $10,000 investment |
Costs paid as a percentage of a $10,000 investment |
| JPMorgan Hedged Equity 3 Fund (Class C Shares) |
$148 | 1.42% |
How did the Fund Perform?
The Fund's Class C Shares, without a sales charge, returned 8.87% for the twelve months ended June 30, 2026. The S&P 500 Index (the "Index") returned 21.88% and the ICE BofA 3-Month US Treasury Bill Index returned 3.84% for the twelve months ended June 30, 2026.
- The Fund captured 44% of the Index’s positive return with 55% of its volatility.
- The Fund’s security selection in the financial services and consumer cyclical sectors contributed to relative performance.
- The overweight allocations to Seagate Technology and Micron Technology were among the top contributors.
- The Fund’s security selection in the industrial cyclical and software and services sectors detracted from relative performance.
- The underweight allocations to Intel and Applied Materials were among the top detractors.
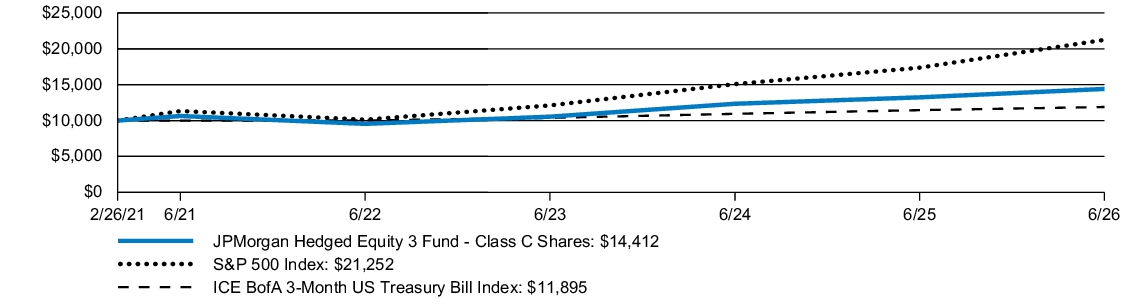
Fund Performance
| AVERAGE ANNUAL TOTAL RETURNS | INCEPTION DATE |
1 YEAR | 5 YEAR | SINCE INCEPTION |
|||
| JPMorgan Hedged Equity 3 Fund (Class C Shares) | February 26, 2021 | 7.87 | % | 6.26 | % | 7.08 | % |
| JPMorgan Hedged Equity 3 Fund (Class C Shares) - excluding sales charge | 8.87 | 6.26 | 7.08 | ||||
| S&P 500 Index | 21.88 | 12.92 | 14.67 | ||||
| ICE BofA 3-Month US Treasury Bill Index | 3.84 | 3.53 | 3.31 |
KEY FUND STATISTICS
| Fund net assets (000's) | $3,198,101 | |
| Total number of portfolio holdings | 158 | |
| Portfolio turnover rate | 35 | % |
| Total advisory fees paid (000's) | $6,973 |
PORTFOLIO COMPOSITION - SECTOR
(% of Total Investments)
(% of Total Investments)
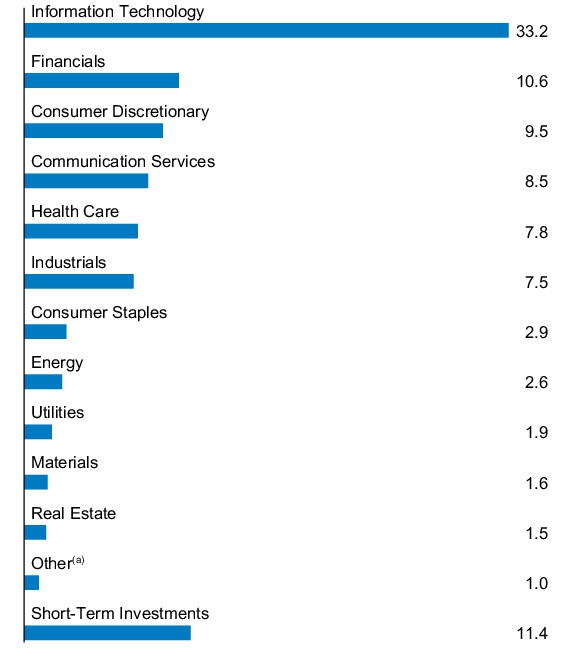
| (a) | Put Options Purchased |
Material changes to the Fund during the period
Effective February 26, 2026, the Fund began engaging in securities lending and using the cash collateral received from those activities to post margin for options on futures contracts. As a result of the cost of this financing, which excludes offsetting interest earned on the collateral posted, the Fund’s annual net expense ratio increased from 1.34% as of June 30, 2025 to 1.42% as of June 30, 2026.
The Fund added “Significant Holdings Risk” to its prospectus as of March 1, 2026. Although the Fund is considered “diversified” under applicable law, a relatively large portion of its portfolio at times may be invested in a relatively small number of securities, or investments (including futures) whose performance relates in part to the economic results of a relatively small number of securities, or in a combination of the foregoing.
This is a summary of certain changes to the Fund since July 1, 2025. For more complete information, you may review the Fund’s prospectus at www.jpmorganfunds.com/funddocuments or upon request at 1-800-480-4111.
Effective February 26, 2026, the Fund began engaging in securities lending and using the cash collateral received from those activities to post margin for options on futures contracts. As a result of the cost of this financing, which excludes offsetting interest earned on the collateral posted, the Fund’s annual net expense ratio increased from 1.34% as of June 30, 2025 to 1.42% as of June 30, 2026.
The Fund added “Significant Holdings Risk” to its prospectus as of March 1, 2026. Although the Fund is considered “diversified” under applicable law, a relatively large portion of its portfolio at times may be invested in a relatively small number of securities, or investments (including futures) whose performance relates in part to the economic results of a relatively small number of securities, or in a combination of the foregoing.
This is a summary of certain changes to the Fund since July 1, 2025. For more complete information, you may review the Fund’s prospectus at www.jpmorganfunds.com/funddocuments or upon request at 1-800-480-4111.
This report describes material changes to the Fund that occurred during the reporting period.
What were the Fund costs for the last year?
(based on a hypothetical $10,000 investment)
| Fund (Class) | Costs of a $10,000 investment |
Costs paid as a percentage of a $10,000 investment |
| JPMorgan Hedged Equity 3 Fund (Class A Shares) |
$96 | 0.92% |
How did the Fund Perform?
The Fund's Class A Shares, without a sales charge, returned 9.41% for the twelve months ended June 30, 2026. The S&P 500 Index (the "Index") returned 21.88% and the ICE BofA 3-Month US Treasury Bill Index returned 3.84% for the twelve months ended June 30, 2026.
- The Fund captured 44% of the Index’s positive return with 55% of its volatility.
- The Fund’s security selection in the financial services and consumer cyclical sectors contributed to relative performance.
- The overweight allocations to Seagate Technology and Micron Technology were among the top contributors.
- The Fund’s security selection in the industrial cyclical and software and services sectors detracted from relative performance.
- The underweight allocations to Intel and Applied Materials were among the top detractors.
Fund Performance
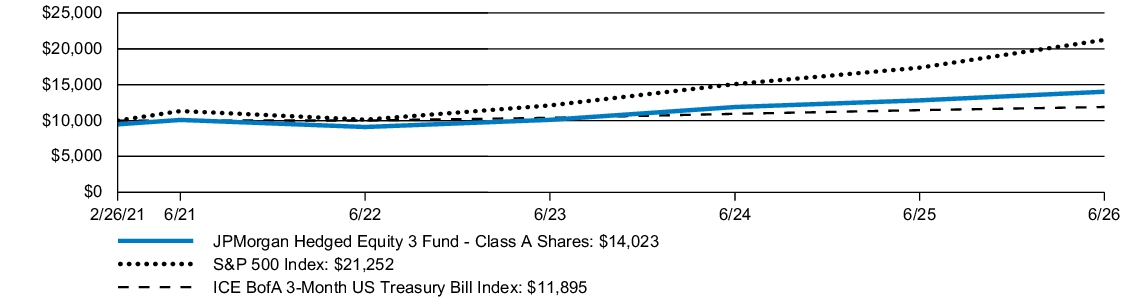
| AVERAGE ANNUAL TOTAL RETURNS | INCEPTION DATE |
1 YEAR | 5 YEAR | SINCE INCEPTION |
|||
| JPMorgan Hedged Equity 3 Fund (Class A Shares) | February 26, 2021 | 3.65 | % | 5.66 | % | 6.54 | % |
| JPMorgan Hedged Equity 3 Fund (Class A Shares) - excluding sales charge | 9.41 | 6.80 | 7.62 | ||||
| S&P 500 Index | 21.88 | 12.92 | 14.67 | ||||
| ICE BofA 3-Month US Treasury Bill Index | 3.84 | 3.53 | 3.31 |
KEY FUND STATISTICS
| Fund net assets (000's) | $3,198,101 | |
| Total number of portfolio holdings | 158 | |
| Portfolio turnover rate | 35 | % |
| Total advisory fees paid (000's) | $6,973 |
PORTFOLIO COMPOSITION - SECTOR
(% of Total Investments)
(% of Total Investments)
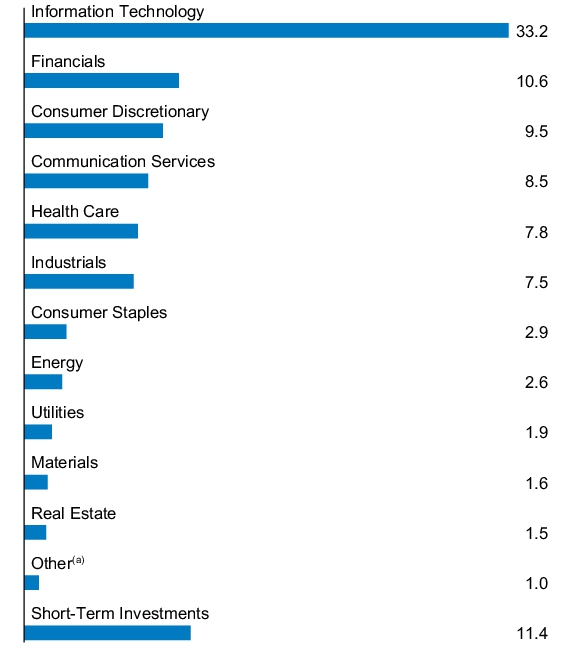
| (a) | Put Options Purchased |
Material changes to the Fund during the period
Effective February 26, 2026, the Fund began engaging in securities lending and using the cash collateral received from those activities to post margin for options on futures contracts. As a result of the cost of this financing, which excludes offsetting interest earned on the collateral posted, the Fund’s annual net expense ratio increased from 0.84% as of June 30, 2025 to 0.92% as of June 30, 2026.
The Fund added “Significant Holdings Risk” to its prospectus as of March 1, 2026. Although the Fund is considered “diversified” under applicable law, a relatively large portion of its portfolio at times may be invested in a relatively small number of securities, or investments (including futures) whose performance relates in part to the economic results of a relatively small number of securities, or in a combination of the foregoing.
This is a summary of certain changes to the Fund since July 1, 2025. For more complete information, you may review the Fund’s prospectus at www.jpmorganfunds.com/funddocuments or upon request at 1-800-480-4111.
Effective February 26, 2026, the Fund began engaging in securities lending and using the cash collateral received from those activities to post margin for options on futures contracts. As a result of the cost of this financing, which excludes offsetting interest earned on the collateral posted, the Fund’s annual net expense ratio increased from 0.84% as of June 30, 2025 to 0.92% as of June 30, 2026.
The Fund added “Significant Holdings Risk” to its prospectus as of March 1, 2026. Although the Fund is considered “diversified” under applicable law, a relatively large portion of its portfolio at times may be invested in a relatively small number of securities, or investments (including futures) whose performance relates in part to the economic results of a relatively small number of securities, or in a combination of the foregoing.
This is a summary of certain changes to the Fund since July 1, 2025. For more complete information, you may review the Fund’s prospectus at www.jpmorganfunds.com/funddocuments or upon request at 1-800-480-4111.
This report describes material changes to the Fund that occurred during the reporting period.
What were the Fund costs for the last year?
(based on a hypothetical $10,000 investment)
| Fund (Class) | Costs of a $10,000 investment |
Costs paid as a percentage of a $10,000 investment |
| JPMorgan Preferred and Income Securities Fund (Class A Shares) |
$78 | 0.75% |
How did the Fund Perform?
The Fund's Class A Shares, without a sales charge, returned 6.27% for the twelve months ended June 30, 2026. The Bloomberg US Aggregate Index returned 3.79%, the ICE BofA US All Capital Securities Index ("the Index") returned 5.89% and the Preferred and Income Securities Composite Benchmark returned 6.57% for the twelve months ended June 30, 2026.
- The Fund’s security selection within the contingent convertible bond allocation detracted from relative performance.
- The Fund’s underweight to $25 par securities, which typically have greater sensitivity to movements in interest rates, contributed to relative performance as interest rates rose over the period.
Fund Performance
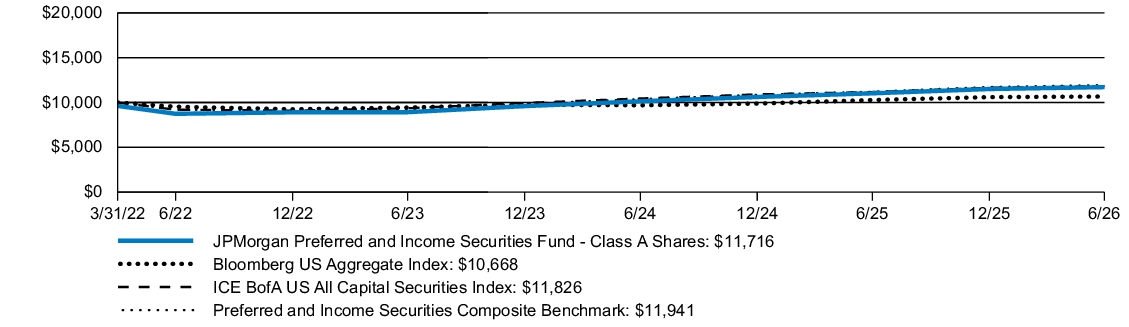
| AVERAGE ANNUAL TOTAL RETURNS | INCEPTION DATE |
1 YEAR | SINCE INCEPTION |
||
| JPMorgan Preferred and Income Securities Fund (Class A Shares) | March 31, 2022 | 2.28 | % | 3.80 | % |
| JPMorgan Preferred and Income Securities Fund (Class A Shares) - excluding sales charge | 6.27 | 4.74 | |||
| Bloomberg US Aggregate Index | 3.79 | 1.53 | |||
| ICE BofA US All Capital Securities Index | 5.89 | 4.03 | |||
| Preferred and Income Securities Composite Benchmark | 6.57 | 4.26 |
KEY FUND STATISTICS
| Fund net assets (000's) | $2,235,860 | |
| Total number of portfolio holdings | 194 | |
| Portfolio turnover rate | 18 | % |
| Total advisory fees paid (000's) | $8,561 |
PORTFOLIO COMPOSITION - ASSET CLASS
(% of Total Investments)
(% of Total Investments)
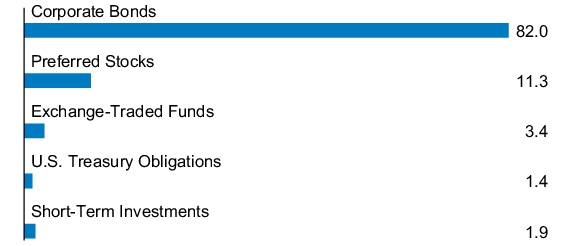
Material changes to the Fund during the period
At a meeting held on February 10-12, 2026, Board of Trustees of JPMorgan Trust IV approved the reorganization (the “Reorganization”) of the Fund into a newly created exchange-traded fund, JPMorgan Preferred and Income Securities ETF (“Preferred and Income Securities ETF”). The Reorganization occurred as of the close of business on July 10, 2026.
Following the Reorganization, the Fund’s performance and financial history was adopted by Preferred and Income Securities ETF. Preferred and Income Securities ETF is managed in a substantially similar manner as the Fund. Effective as of the close of business on July 10, 2026, the Fund ceased operations in connection with the consummation of the Reorganization.
Effective March 1, 2026, the Fund’s Class A Shares were publicly offered only on a limited basis. Investors were not eligible to purchase Class A Shares of the Fund unless they met certain requirements.
Effective March 1, 2026, no sales charge was imposed on purchases of Class A Shares of the Fund, no contingent deferred sales charge was imposed on redemptions of Class A Shares and the Fund’s principal underwriter voluntarily waived all of its distribution fees.
This is a summary of certain changes to the Fund since July 1, 2025. For more complete information, you may review the Fund’s prospectus at www.jpmorganfunds.com/funddocuments or upon request at 1-800-480-4111.
This is a summary of certain changes to the Fund since July 1, 2025. For more complete information, you may review the Fund’s prospectus at www.jpmorganfunds.com/funddocuments or upon request at 1-800-480-4111.
This report describes material changes to the Fund that occurred during the reporting period.
What were the Fund costs for the last year?
(based on a hypothetical $10,000 investment)
| Fund (Class) | Costs of a $10,000 investment |
Costs paid as a percentage of a $10,000 investment |
| JPMorgan Preferred and Income Securities Fund (Class C Shares) |
$107 | 1.04% |
How did the Fund Perform?
The Fund's Class C Shares, without a sales charge, returned 5.96% for the twelve months ended June 30, 2026. The Bloomberg US Aggregate Index returned 3.79%, the ICE BofA US All Capital Securities Index ("the Index") returned 5.89% and the Preferred and Income Securities Composite Benchmark returned 6.57% for the twelve months ended June 30, 2026.
- The Fund’s security selection within the contingent convertible bond allocation detracted from relative performance.
- The Fund’s underweight to $25 par securities, which typically have greater sensitivity to movements in interest rates, contributed to relative performance as interest rates rose over the period.
Fund Performance
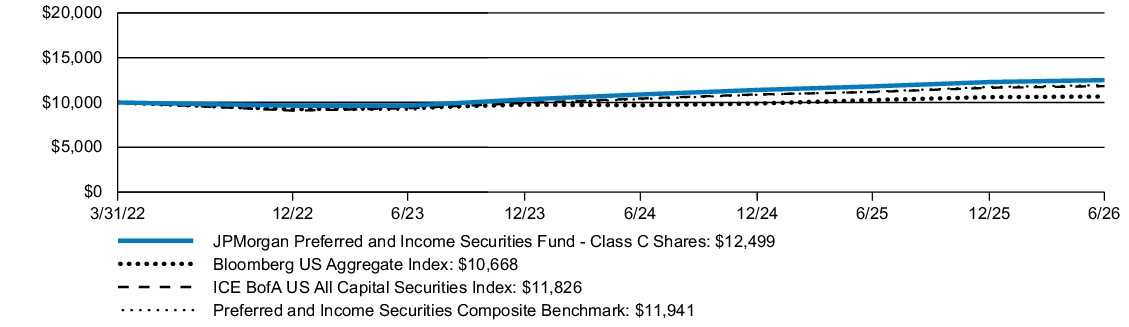
| AVERAGE ANNUAL TOTAL RETURNS | INCEPTION DATE |
1 YEAR | SINCE INCEPTION |
||
| JPMorgan Preferred and Income Securities Fund (Class C Shares) | August 1, 2022 | 4.96 | % | 4.24 | % |
| JPMorgan Preferred and Income Securities Fund (Class C Shares) - excluding sales charge | 5.96 | 4.24 | |||
| Bloomberg US Aggregate Index | 3.79 | 1.53 | |||
| ICE BofA US All Capital Securities Index | 5.89 | 4.03 | |||
| Preferred and Income Securities Composite Benchmark | 6.57 | 4.26 |
KEY FUND STATISTICS
| Fund net assets (000's) | $2,235,860 | |
| Total number of portfolio holdings | 194 | |
| Portfolio turnover rate | 18 | % |
| Total advisory fees paid (000's) | $8,561 |
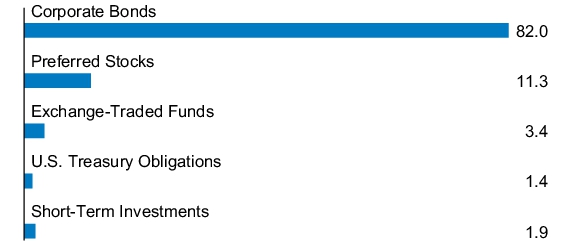
PORTFOLIO COMPOSITION - ASSET CLASS
(% of Total Investments)
(% of Total Investments)
Material changes to the Fund during the period
At a meeting held on February 10-12, 2026, Board of Trustees of JPMorgan Trust IV approved the reorganization (the “Reorganization”) of the Fund into a newly created exchange-traded fund, JPMorgan Preferred and Income Securities ETF (“Preferred and Income Securities ETF”). The Reorganization occurred as of the close of business on July 10, 2026.
Following the Reorganization, the Fund’s performance and financial history was adopted by Preferred and Income Securities ETF. Preferred and Income Securities ETF is managed in a substantially similar manner as the Fund. Effective as of the close of business on July 10, 2026, the Fund ceased operations in connection with the consummation of the Reorganization.
Effective March 1, 2026, the Fund’s Class C Shares were publicly offered only on a limited basis. Investors were not eligible to purchase Class C Shares of the Fund unless they met certain requirements.
Effective March 1, 2026, no contingent deferred sales charge was imposed on redemptions of Class C Shares of the Fund and the Fund’s principal underwriter voluntarily waived all of its distribution fees.
This is a summary of certain changes to the Fund since July 1, 2025. For more complete information, you may review the Fund’s prospectus at www.jpmorganfunds.com/funddocuments or upon request at 1-800-480-4111.
This is a summary of certain changes to the Fund since July 1, 2025. For more complete information, you may review the Fund’s prospectus at www.jpmorganfunds.com/funddocuments or upon request at 1-800-480-4111.
This report describes material changes to the Fund that occurred during the reporting period.
What were the Fund costs for the last year?
(based on a hypothetical $10,000 investment)
| Fund (Class) | Costs of a $10,000 investment |
Costs paid as a percentage of a $10,000 investment |
| JPMorgan Preferred and Income Securities Fund (Class I Shares) |
$62 | 0.60% |
How did the Fund Perform?
The Fund's Class I Shares returned 6.54% for the twelve months ended June 30, 2026. The Bloomberg US Aggregate Index returned 3.79%, the ICE BofA US All Capital Securities Index ("the Index") returned 5.89% and the Preferred and Income Securities Composite Benchmark returned 6.57% for the twelve months ended June 30, 2026.
- The Fund’s security selection within the contingent convertible bond allocation detracted from relative performance.
- The Fund’s underweight to $25 par securities, which typically have greater sensitivity to movements in interest rates, contributed to relative performance as interest rates rose over the period.
Fund Performance
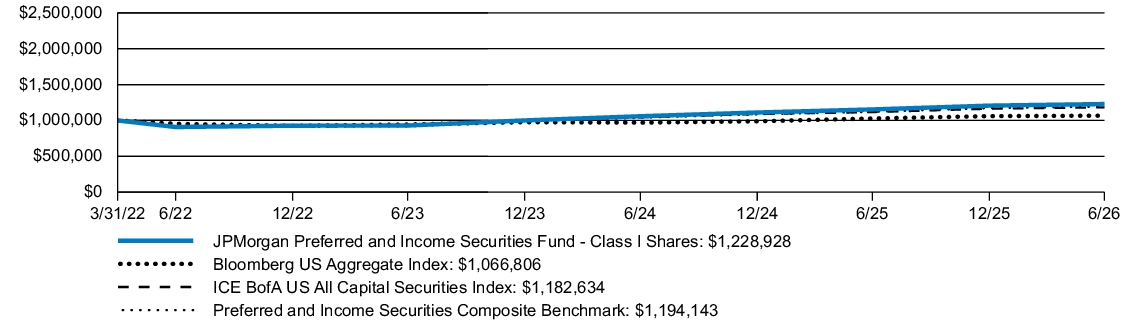
| AVERAGE ANNUAL TOTAL RETURNS | INCEPTION DATE |
1 YEAR | SINCE INCEPTION |
||
| JPMorgan Preferred and Income Securities Fund (Class I Shares) | March 31, 2022 | 6.54 | % | 4.97 | % |
| Bloomberg US Aggregate Index | 3.79 | 1.53 | |||
| ICE BofA US All Capital Securities Index | 5.89 | 4.03 | |||
| Preferred and Income Securities Composite Benchmark | 6.57 | 4.26 |
KEY FUND STATISTICS
| Fund net assets (000's) | $2,235,860 | |
| Total number of portfolio holdings | 194 | |
| Portfolio turnover rate | 18 | % |
| Total advisory fees paid (000's) | $8,561 |
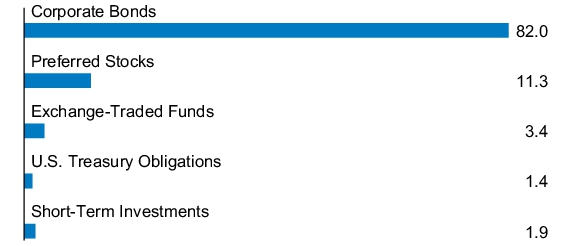
PORTFOLIO COMPOSITION - ASSET CLASS
(% of Total Investments)
(% of Total Investments)
Material changes to the Fund during the period
At a meeting held on February 10-12, 2026, Board of Trustees of JPMorgan Trust IV approved the reorganization (the “Reorganization”) of the Fund into a newly created exchange-traded fund, JPMorgan Preferred and Income Securities ETF (“Preferred and Income Securities ETF”). The Reorganization occurred as of the close of business on July 10, 2026.
Following the Reorganization, the Fund’s performance and financial history was adopted by Preferred and Income Securities ETF. Preferred and Income Securities ETF is managed in a substantially similar manner as the Fund. Effective as of the close of business on July 10, 2026, the Fund ceased operations in connection with the consummation of the Reorganization.
This is a summary of certain changes to the Fund since July 1, 2025. For more complete information, you may review the Fund’s prospectus at www.jpmorganfunds.com/funddocuments or upon request at 1-800-480-4111.
This is a summary of certain changes to the Fund since July 1, 2025. For more complete information, you may review the Fund’s prospectus at www.jpmorganfunds.com/funddocuments or upon request at 1-800-480-4111.
This report describes material changes to the Fund that occurred during the reporting period.
What were the Fund costs for the last year?
(based on a hypothetical $10,000 investment)
| Fund (Class) | Costs of a $10,000 investment |
Costs paid as a percentage of a $10,000 investment |
| JPMorgan Preferred and Income Securities Fund (Class R6 Shares) |
$56 | 0.55% |
How did the Fund Perform?
The Fund's Class R6 Shares returned 6.49% for the twelve months ended June 30, 2026. The Bloomberg US Aggregate Index returned 3.79%, the ICE BofA US All Capital Securities Index ("the Index") returned 5.89% and the Preferred and Income Securities Composite Benchmark returned 6.57% for the twelve months ended June 30, 2026.
- The Fund’s security selection within the contingent convertible bond allocation detracted from relative performance.
- The Fund’s underweight to $25 par securities, which typically have greater sensitivity to movements in interest rates, contributed to relative performance as interest rates rose over the period.
Fund Performance
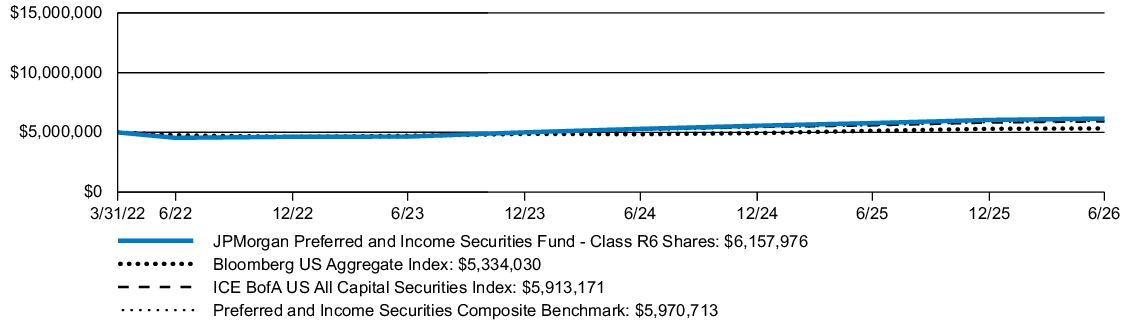
| AVERAGE ANNUAL TOTAL RETURNS | INCEPTION DATE |
1 YEAR | SINCE INCEPTION |
||
| JPMorgan Preferred and Income Securities Fund (Class R6 Shares) | March 31, 2022 | 6.49 | % | 5.02 | % |
| Bloomberg US Aggregate Index | 3.79 | 1.53 | |||
| ICE BofA US All Capital Securities Index | 5.89 | 4.03 | |||
| Preferred and Income Securities Composite Benchmark | 6.57 | 4.26 |
KEY FUND STATISTICS
| Fund net assets (000's) | $2,235,860 | |
| Total number of portfolio holdings | 194 | |
| Portfolio turnover rate | 18 | % |
| Total advisory fees paid (000's) | $8,561 |
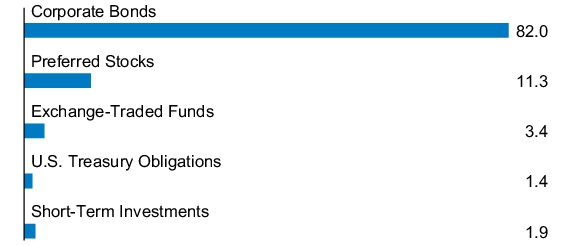
PORTFOLIO COMPOSITION - ASSET CLASS
(% of Total Investments)
(% of Total Investments)
Material changes to the Fund during the period
At a meeting held on February 10-12, 2026, Board of Trustees of JPMorgan Trust IV approved the reorganization (the “Reorganization”) of the Fund into a newly created exchange-traded fund, JPMorgan Preferred and Income Securities ETF (“Preferred and Income Securities ETF”). The Reorganization occurred as of the close of business on July 10, 2026.
Following the Reorganization, the Fund’s performance and financial history was adopted by Preferred and Income Securities ETF. Preferred and Income Securities ETF is managed in a substantially similar manner as the Fund. Effective as of the close of business on July 10, 2026, the Fund ceased operations in connection with the consummation of the Reorganization.
This is a summary of certain changes to the Fund since July 1, 2025. For more complete information, you may review the Fund’s prospectus at www.jpmorganfunds.com/funddocuments or upon request at 1-800-480-4111.
This is a summary of certain changes to the Fund since July 1, 2025. For more complete information, you may review the Fund’s prospectus at www.jpmorganfunds.com/funddocuments or upon request at 1-800-480-4111.
What were the Fund costs for the last year?
(based on a hypothetical $10,000 investment)
| Fund (Class) | Costs of a $10,000 investment |
Costs paid as a percentage of a $10,000 investment |
| JPMorgan SmartRetirement® 2065 Fund (Class R6 Shares) |
$0 | 0.00% |
How did the Fund Perform?
The Fund's Class R6 Shares returned 19.15% for the twelve months ended June 30, 2026. The MSCI ACWI Index (net total return) returned 21.34%, the S&P Target Date 2065+ Index (the "Index") returned 22.71% and the JPM SmartRetirement 2065 Composite Benchmark returned 22.71% for the twelve months ended June 30, 2026.
- Manager selection detracted for the twelve months ended June 30, 2026. The emerging markets equity platform and the JPMorgan Core Plus Bond Fund added value. Conversely, the U.S. large cap platform and the JPMorgan Value Advantage Fund detracted.
- Relative to the Index, holding more emerging markets equities was additive. Conversely, holding more fixed income relative to the Index detracted, as equities broadly outperformed fixed income for the twelve months ended June 30, 2026.
- Active asset allocation was additive for the twelve months ended June 30, 2026. Our global equity overweight was additive, as global equities performed well across the board.
Fund Performance
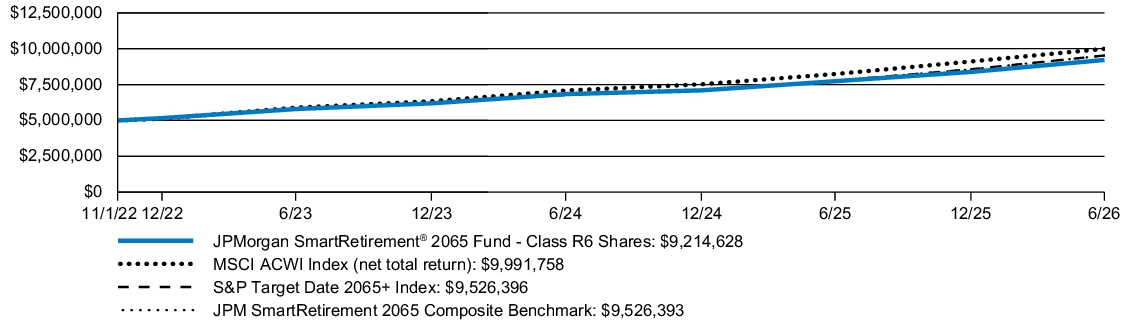
| AVERAGE ANNUAL TOTAL RETURNS | INCEPTION DATE |
1 YEAR | SINCE INCEPTION |
||
| JPMorgan SmartRetirement® 2065 Fund (Class R6 Shares) | November 1, 2022 | 19.15 | % | 18.18 | % |
| MSCI ACWI Index (net total return) | 21.34 | 20.78 | |||
| S&P Target Date 2065+ Index | 22.71 | 19.22 | |||
| JPM SmartRetirement 2065 Composite Benchmark | 22.71 | 19.22 |
KEY FUND STATISTICS
| Fund net assets (000's) | $176,516 | |
| Total number of portfolio holdings | 24 | |
| Portfolio turnover rate | 19 | % |
| Total advisory fees paid (000's) | $0 |
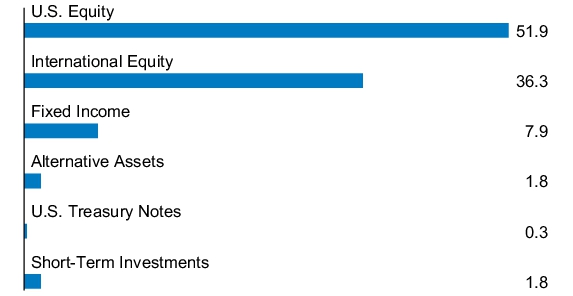
PORTFOLIO COMPOSITION - ASSET CLASS
(% of Total Investments)
(% of Total Investments)
What were the Fund costs for the last year?
(based on a hypothetical $10,000 investment)
| Fund (Class) | Costs of a $10,000 investment |
Costs paid as a percentage of a $10,000 investment |
| JPMorgan SmartRetirement® 2065 Fund (Class R5 Shares) |
$11 | 0.10% |
How did the Fund Perform?
The Fund's Class R5 Shares returned 18.99% for the twelve months ended June 30, 2026. The MSCI ACWI Index (net total return) returned 21.34%, the S&P Target Date 2065+ Index (the "Index") returned 22.71% and the JPM SmartRetirement 2065 Composite Benchmark returned 22.71% for the twelve months ended June 30, 2026.
- Manager selection detracted for the twelve months ended June 30, 2026. The emerging markets equity platform and the JPMorgan Core Plus Bond Fund added value. Conversely, the U.S. large cap platform and the JPMorgan Value Advantage Fund detracted.
- Relative to the Index, holding more emerging markets equities was additive. Conversely, holding more fixed income relative to the Index detracted, as equities broadly outperformed fixed income for the twelve months ended June 30, 2026.
- Active asset allocation was additive for the twelve months ended June 30, 2026. Our global equity overweight was additive, as global equities performed well across the board.
Fund Performance
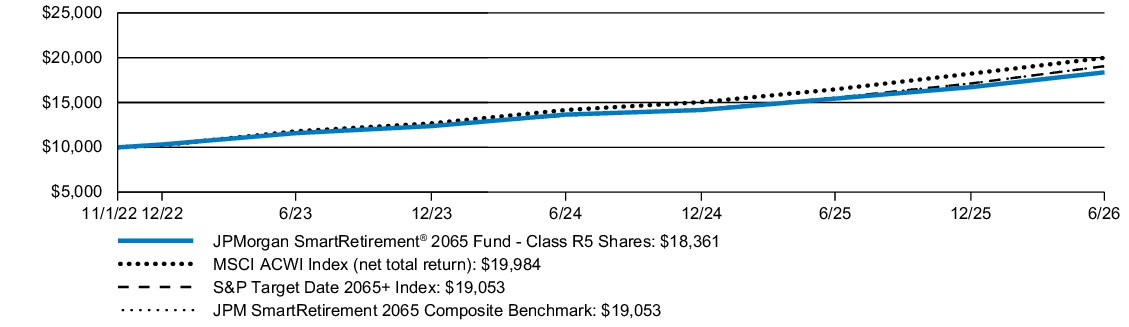
| AVERAGE ANNUAL TOTAL RETURNS | INCEPTION DATE |
1 YEAR | SINCE INCEPTION |
||
| JPMorgan SmartRetirement® 2065 Fund (Class R5 Shares) | November 1, 2022 | 18.99 | % | 18.06 | % |
| MSCI ACWI Index (net total return) | 21.34 | 20.78 | |||
| S&P Target Date 2065+ Index | 22.71 | 19.22 | |||
| JPM SmartRetirement 2065 Composite Benchmark | 22.71 | 19.22 |
KEY FUND STATISTICS
| Fund net assets (000's) | $176,516 | |
| Total number of portfolio holdings | 24 | |
| Portfolio turnover rate | 19 | % |
| Total advisory fees paid (000's) | $0 |
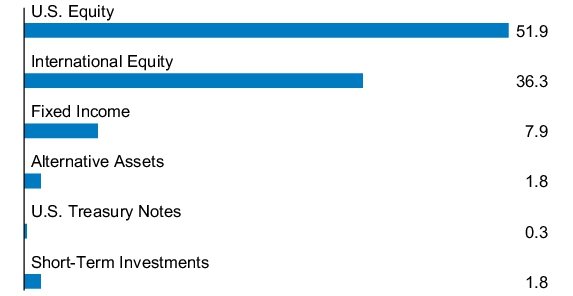
PORTFOLIO COMPOSITION - ASSET CLASS
(% of Total Investments)
(% of Total Investments)
What were the Fund costs for the last year?
(based on a hypothetical $10,000 investment)
| Fund (Class) | Costs of a $10,000 investment |
Costs paid as a percentage of a $10,000 investment |
| JPMorgan SmartRetirement® 2065 Fund (Class R4 Shares) |
$27 | 0.25% |
How did the Fund Perform?
The Fund's Class R4 Shares returned 18.83% for the twelve months ended June 30, 2026. The MSCI ACWI Index (net total return) returned 21.34%, the S&P Target Date 2065+ Index (the "Index") returned 22.71% and the JPM SmartRetirement 2065 Composite Benchmark returned 22.71% for the twelve months ended June 30, 2026.
- Manager selection detracted for the twelve months ended June 30, 2026. The emerging markets equity platform and the JPMorgan Core Plus Bond Fund added value. Conversely, the U.S. large cap platform and the JPMorgan Value Advantage Fund detracted.
- Relative to the Index, holding more emerging markets equities was additive. Conversely, holding more fixed income relative to the Index detracted, as equities broadly outperformed fixed income for the twelve months ended June 30, 2026.
- Active asset allocation was additive for the twelve months ended June 30, 2026. Our global equity overweight was additive, as global equities performed well across the board.
Fund Performance
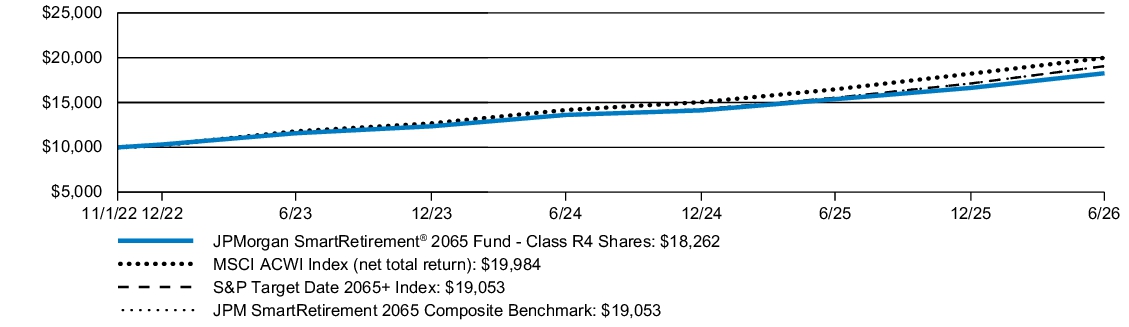
| AVERAGE ANNUAL TOTAL RETURNS | INCEPTION DATE |
1 YEAR | SINCE INCEPTION |
||
| JPMorgan SmartRetirement® 2065 Fund (Class R4 Shares) | November 1, 2022 | 18.83 | % | 17.88 | % |
| MSCI ACWI Index (net total return) | 21.34 | 20.78 | |||
| S&P Target Date 2065+ Index | 22.71 | 19.22 | |||
| JPM SmartRetirement 2065 Composite Benchmark | 22.71 | 19.22 |
KEY FUND STATISTICS
| Fund net assets (000's) | $176,516 | |
| Total number of portfolio holdings | 24 | |
| Portfolio turnover rate | 19 | % |
| Total advisory fees paid (000's) | $0 |
PORTFOLIO COMPOSITION - ASSET CLASS
(% of Total Investments)
(% of Total Investments)
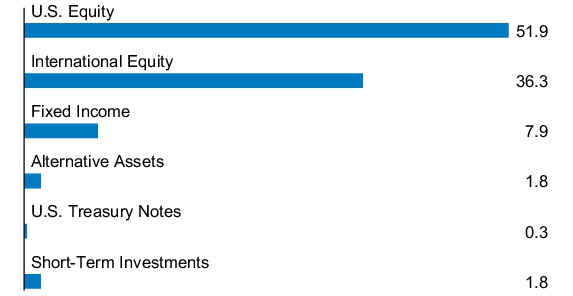
What were the Fund costs for the last year?
(based on a hypothetical $10,000 investment)
| Fund (Class) | Costs of a $10,000 investment |
Costs paid as a percentage of a $10,000 investment |
| JPMorgan SmartRetirement® 2065 Fund (Class R3 Shares) |
$55 | 0.50% |
How did the Fund Perform?
The Fund's Class R3 Shares returned 18.55% for the twelve months ended June 30, 2026. The MSCI ACWI Index (net total return) returned 21.34%, the S&P Target Date 2065+ Index (the "Index") returned 22.71% and the JPM SmartRetirement 2065 Composite Benchmark returned 22.71% for the twelve months ended June 30, 2026.
- Manager selection detracted for the twelve months ended June 30, 2026. The emerging markets equity platform and the JPMorgan Core Plus Bond Fund added value. Conversely, the U.S. large cap platform and the JPMorgan Value Advantage Fund detracted.
- Relative to the Index, holding more emerging markets equities was additive. Conversely, holding more fixed income relative to the Index detracted, as equities broadly outperformed fixed income for the twelve months ended June 30, 2026.
- Active asset allocation was additive for the twelve months ended June 30, 2026. Our global equity overweight was additive, as global equities performed well across the board.
Fund Performance
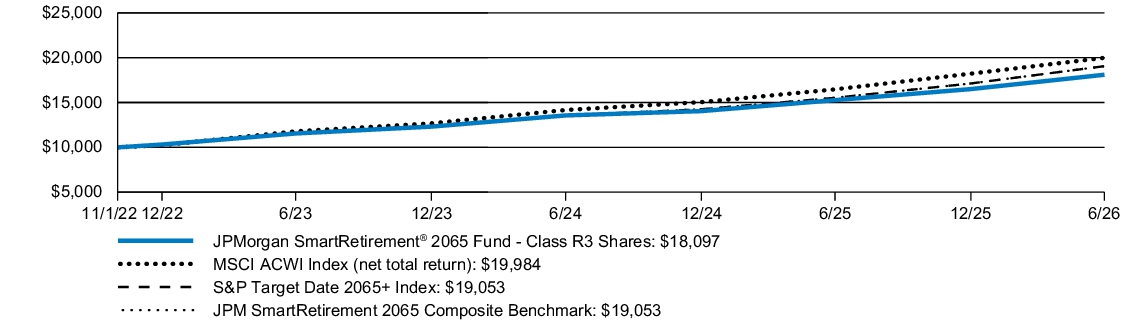
| AVERAGE ANNUAL TOTAL RETURNS | INCEPTION DATE |
1 YEAR | SINCE INCEPTION |
||
| JPMorgan SmartRetirement® 2065 Fund (Class R3 Shares) | November 1, 2022 | 18.55 | % | 17.59 | % |
| MSCI ACWI Index (net total return) | 21.34 | 20.78 | |||
| S&P Target Date 2065+ Index | 22.71 | 19.22 | |||
| JPM SmartRetirement 2065 Composite Benchmark | 22.71 | 19.22 |
KEY FUND STATISTICS
| Fund net assets (000's) | $176,516 | |
| Total number of portfolio holdings | 24 | |
| Portfolio turnover rate | 19 | % |
| Total advisory fees paid (000's) | $0 |
PORTFOLIO COMPOSITION - ASSET CLASS
(% of Total Investments)
(% of Total Investments)
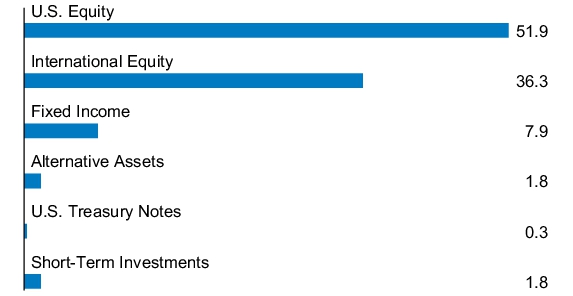
What were the Fund costs for the last year?
(based on a hypothetical $10,000 investment)
| Fund (Class) | Costs of a $10,000 investment |
Costs paid as a percentage of a $10,000 investment |
| JPMorgan SmartRetirement® 2065 Fund (Class R2 Shares) |
$82 | 0.75% |
How did the Fund Perform?
The Fund's Class R2 Shares returned 18.22% for the twelve months ended June 30, 2026. The MSCI ACWI Index (net total return) returned 21.34%, the S&P Target Date 2065+ Index (the "Index") returned 22.71% and the JPM SmartRetirement 2065 Composite Benchmark returned 22.71% for the twelve months ended June 30, 2026.
- Manager selection detracted for the twelve months ended June 30, 2026. The emerging markets equity platform and the JPMorgan Core Plus Bond Fund added value. Conversely, the U.S. large cap platform and the JPMorgan Value Advantage Fund detracted.
- Relative to the Index, holding more emerging markets equities was additive. Conversely, holding more fixed income relative to the Index detracted, as equities broadly outperformed fixed income for the twelve months ended June 30, 2026.
- Active asset allocation was additive for the twelve months ended June 30, 2026. Our global equity overweight was additive, as global equities performed well across the board.
Fund Performance
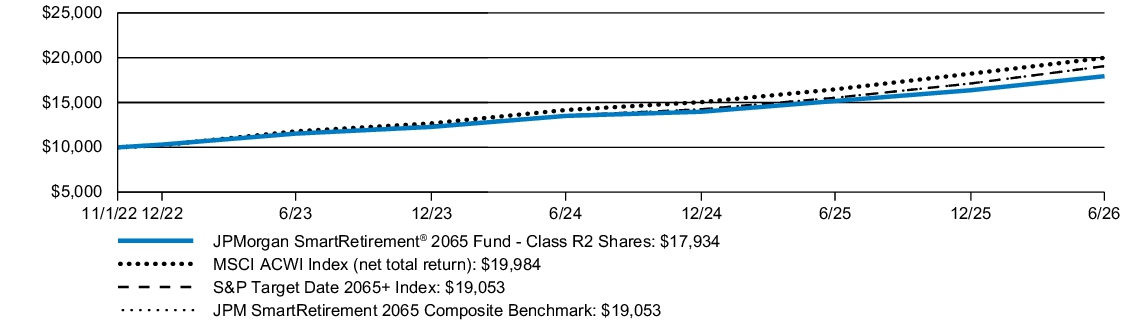
| AVERAGE ANNUAL TOTAL RETURNS | INCEPTION DATE |
1 YEAR | SINCE INCEPTION |
||
| JPMorgan SmartRetirement® 2065 Fund (Class R2 Shares) | November 1, 2022 | 18.22 | % | 17.30 | % |
| MSCI ACWI Index (net total return) | 21.34 | 20.78 | |||
| S&P Target Date 2065+ Index | 22.71 | 19.22 | |||
| JPM SmartRetirement 2065 Composite Benchmark | 22.71 | 19.22 |
KEY FUND STATISTICS
| Fund net assets (000's) | $176,516 | |
| Total number of portfolio holdings | 24 | |
| Portfolio turnover rate | 19 | % |
| Total advisory fees paid (000's) | $0 |
PORTFOLIO COMPOSITION - ASSET CLASS
(% of Total Investments)
(% of Total Investments)
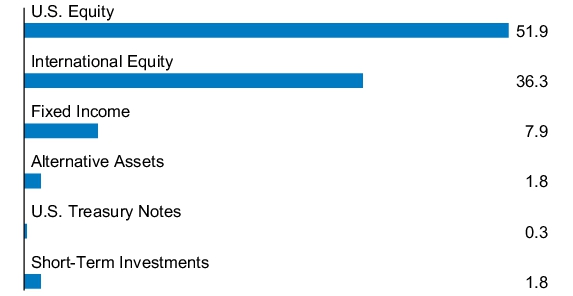
What were the Fund costs for the last year?
(based on a hypothetical $10,000 investment)
| Fund (Class) | Costs of a $10,000 investment |
Costs paid as a percentage of a $10,000 investment |
| JPMorgan SmartRetirement® 2065 Fund (Class I Shares) |
$27 | 0.25% |
How did the Fund Perform?
The Fund's Class I Shares returned 18.81% for the twelve months ended June 30, 2026. The MSCI ACWI Index (net total return) returned 21.34%, the S&P Target Date 2065+ Index (the "Index") returned 22.71% and the JPM SmartRetirement 2065 Composite Benchmark returned 22.71% for the twelve months ended June 30, 2026.
- Manager selection detracted for the twelve months ended June 30, 2026. The emerging markets equity platform and the JPMorgan Core Plus Bond Fund added value. Conversely, the U.S. large cap platform and the JPMorgan Value Advantage Fund detracted.
- Relative to the Index, holding more emerging markets equities was additive. Conversely, holding more fixed income relative to the Index detracted, as equities broadly outperformed fixed income for the twelve months ended June 30, 2026.
- Active asset allocation was additive for the twelve months ended June 30, 2026. Our global equity overweight was additive, as global equities performed well across the board.
Fund Performance
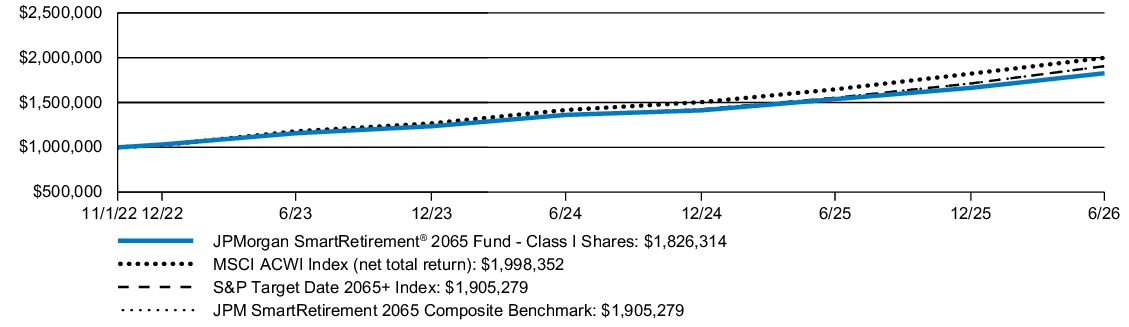
| AVERAGE ANNUAL TOTAL RETURNS | INCEPTION DATE |
1 YEAR | SINCE INCEPTION |
||
| JPMorgan SmartRetirement® 2065 Fund (Class I Shares) | November 1, 2022 | 18.81 | % | 17.89 | % |
| MSCI ACWI Index (net total return) | 21.34 | 20.78 | |||
| S&P Target Date 2065+ Index | 22.71 | 19.22 | |||
| JPM SmartRetirement 2065 Composite Benchmark | 22.71 | 19.22 |
KEY FUND STATISTICS
| Fund net assets (000's) | $176,516 | |
| Total number of portfolio holdings | 24 | |
| Portfolio turnover rate | 19 | % |
| Total advisory fees paid (000's) | $0 |
PORTFOLIO COMPOSITION - ASSET CLASS
(% of Total Investments)
(% of Total Investments)
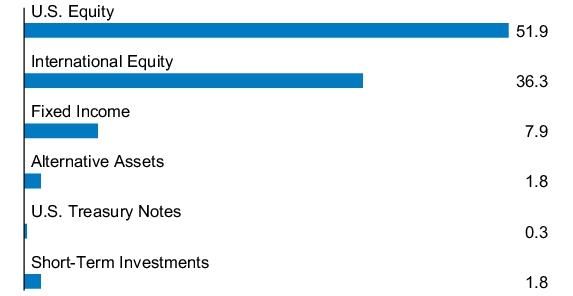
What were the Fund costs for the last year?
(based on a hypothetical $10,000 investment)
| Fund (Class) | Costs of a $10,000 investment |
Costs paid as a percentage of a $10,000 investment |
| JPMorgan SmartRetirement® 2065 Fund (Class C Shares) |
$109 | 1.00% |
How did the Fund Perform?
The Fund's Class C Shares, without a sales charge, returned 17.93% for the twelve months ended June 30, 2026. The MSCI ACWI Index (net total return) returned 21.34%, the S&P Target Date 2065+ Index (the "Index") returned 22.71% and the JPM SmartRetirement 2065 Composite Benchmark returned 22.71% for the twelve months ended June 30, 2026.
- Manager selection detracted for the twelve months ended June 30, 2026. The emerging markets equity platform and the JPMorgan Core Plus Bond Fund added value. Conversely, the U.S. large cap platform and the JPMorgan Value Advantage Fund detracted.
- Relative to the Index, holding more emerging markets equities was additive. Conversely, holding more fixed income relative to the Index detracted, as equities broadly outperformed fixed income for the twelve months ended June 30, 2026.
- Active asset allocation was additive for the twelve months ended June 30, 2026. Our global equity overweight was additive, as global equities performed well across the board.
Fund Performance
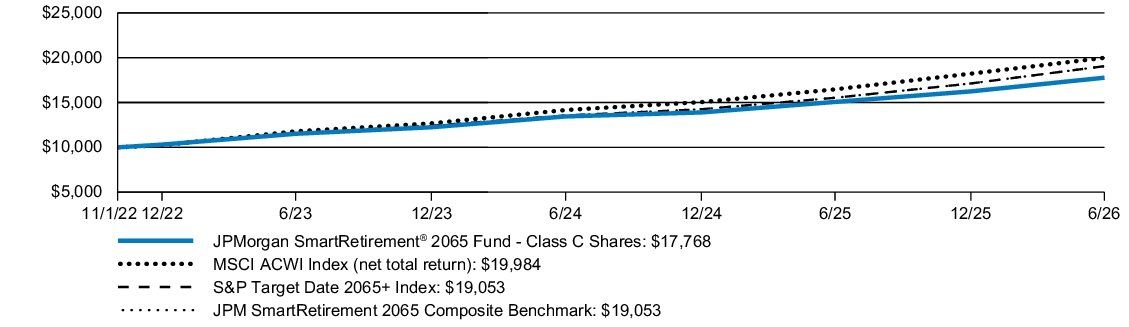
| AVERAGE ANNUAL TOTAL RETURNS | INCEPTION DATE |
1 YEAR | SINCE INCEPTION |
||
| JPMorgan SmartRetirement® 2065 Fund (Class C Shares) | November 1, 2022 | 16.93 | % | 17.00 | % |
| JPMorgan SmartRetirement® 2065 Fund (Class C Shares) - excluding sales charge | 17.93 | 17.00 | |||
| MSCI ACWI Index (net total return) | 21.34 | 20.78 | |||
| S&P Target Date 2065+ Index | 22.71 | 19.22 | |||
| JPM SmartRetirement 2065 Composite Benchmark | 22.71 | 19.22 |
KEY FUND STATISTICS
| Fund net assets (000's) | $176,516 | |
| Total number of portfolio holdings | 24 | |
| Portfolio turnover rate | 19 | % |
| Total advisory fees paid (000's) | $0 |
PORTFOLIO COMPOSITION - ASSET CLASS
(% of Total Investments)
(% of Total Investments)
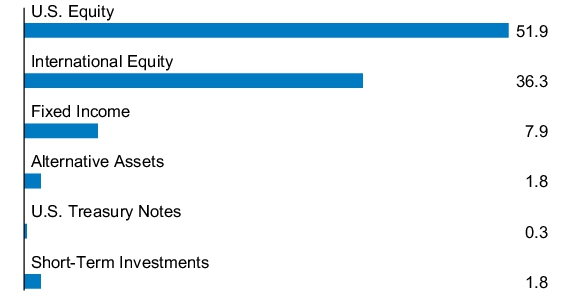
What were the Fund costs for the last year?
(based on a hypothetical $10,000 investment)
| Fund (Class) | Costs of a $10,000 investment |
Costs paid as a percentage of a $10,000 investment |
| JPMorgan SmartRetirement® 2065 Fund (Class A Shares) |
$48 | 0.44% |
How did the Fund Perform?
The Fund's Class A Shares, without a sales charge, returned 18.58% for the twelve months ended June 30, 2026. The MSCI ACWI Index (net total return) returned 21.34%, the S&P Target Date 2065+ Index (the "Index") returned 22.71% and the JPM SmartRetirement 2065 Composite Benchmark returned 22.71% for the twelve months ended June 30, 2026.
- Manager selection detracted for the twelve months ended June 30, 2026. The emerging markets equity platform and the JPMorgan Core Plus Bond Fund added value. Conversely, the U.S. large cap platform and the JPMorgan Value Advantage Fund detracted.
- Relative to the Index, holding more emerging markets equities was additive. Conversely, holding more fixed income relative to the Index detracted, as equities broadly outperformed fixed income for the twelve months ended June 30, 2026.
- Active asset allocation was additive for the twelve months ended June 30, 2026. Our global equity overweight was additive, as global equities performed well across the board.
Fund Performance
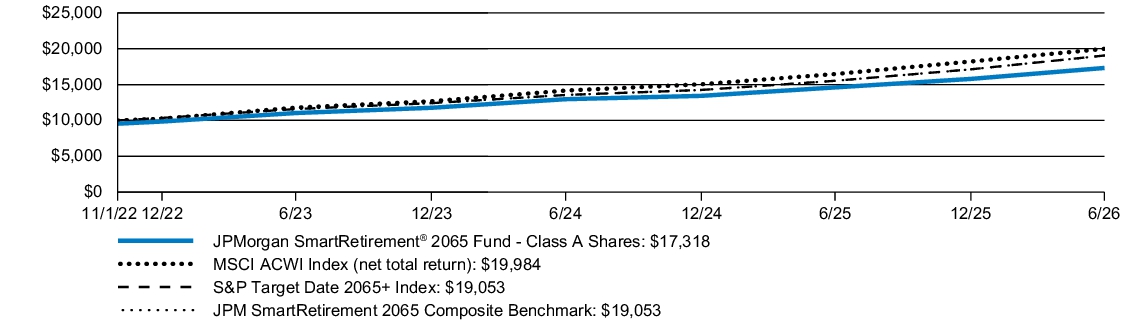
| AVERAGE ANNUAL TOTAL RETURNS | INCEPTION DATE |
1 YEAR | SINCE INCEPTION |
||
| JPMorgan SmartRetirement® 2065 Fund (Class A Shares) | November 1, 2022 | 13.25 | % | 16.19 | % |
| JPMorgan SmartRetirement® 2065 Fund (Class A Shares) - excluding sales charge | 18.58 | 17.66 | |||
| MSCI ACWI Index (net total return) | 21.34 | 20.78 | |||
| S&P Target Date 2065+ Index | 22.71 | 19.22 | |||
| JPM SmartRetirement 2065 Composite Benchmark | 22.71 | 19.22 |
KEY FUND STATISTICS
| Fund net assets (000's) | $176,516 | |
| Total number of portfolio holdings | 24 | |
| Portfolio turnover rate | 19 | % |
| Total advisory fees paid (000's) | $0 |
PORTFOLIO COMPOSITION - ASSET CLASS
(% of Total Investments)
(% of Total Investments)
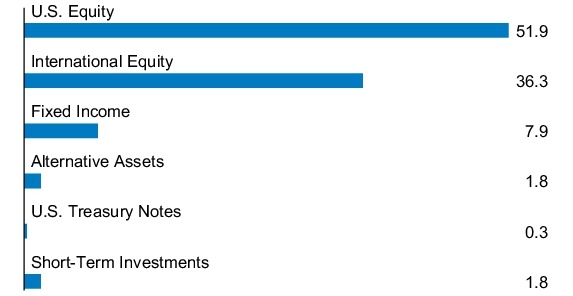
What were the Fund costs for the last year?
(based on a hypothetical $10,000 investment)
| Fund (Class) | Costs of a $10,000 investment |
Costs paid as a percentage of a $10,000 investment |
| JPMorgan SmartRetirement® Blend 2065 Fund (Class I Shares) |
$35 | 0.31% |
How did the Fund Perform?
The Fund's Class I Shares returned 23.08% for the twelve months ended June 30, 2026. The MSCI ACWI Index (net total return) returned 21.34%, the S&P Target Date 2065+ Index (the "Index") returned 22.71% and the JPM SmartRetirement Blend 2065 Composite Benchmark returned 23.06% for the twelve months ended June 30, 2026.
- Relative to the Index, holding more emerging markets equities was additive. Conversely, holding more fixed income relative to the Index detracted, as equities broadly outperformed fixed income for the twelve months ended June 30, 2026.
- Manager selection was additive for the twelve months ended June 30, 2026. The JPMorgan Core Plus Bond Fund added value. Conversely, the JPMorgan BetaBuilders International Equity ETF detracted from relative performance.
- Active asset allocation was additive for the twelve months ended June 30, 2026. Our global equity overweight was additive, as global equities performed well across the board.
Fund Performance
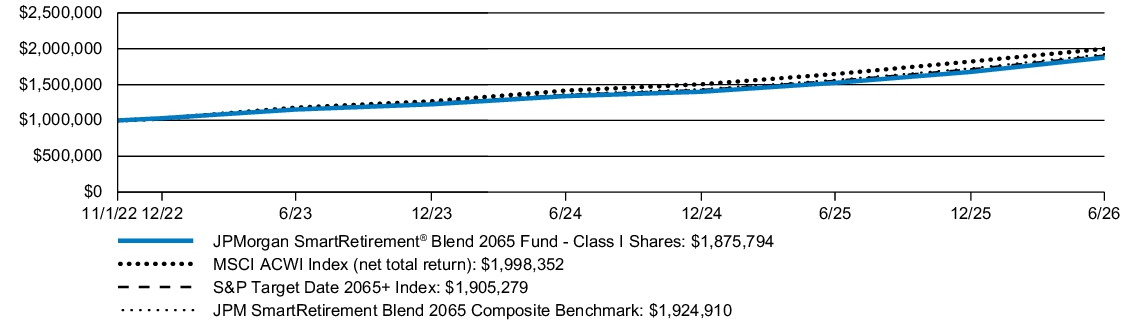
| AVERAGE ANNUAL TOTAL RETURNS | INCEPTION DATE |
1 YEAR | SINCE INCEPTION |
||
| JPMorgan SmartRetirement® Blend 2065 Fund (Class I Shares) | November 1, 2022 | 23.08 | % | 18.75 | % |
| MSCI ACWI Index (net total return) | 21.34 | 20.78 | |||
| S&P Target Date 2065+ Index | 22.71 | 19.22 | |||
| JPM SmartRetirement Blend 2065 Composite Benchmark | 23.06 | 19.55 |
KEY FUND STATISTICS
| Fund net assets (000's) | $181,802 | |
| Total number of portfolio holdings | 16 | |
| Portfolio turnover rate | 22 | % |
| Total advisory fees paid (000's) | $0 |
PORTFOLIO COMPOSITION - ASSET CLASS
(% of Total Investments)
(% of Total Investments)
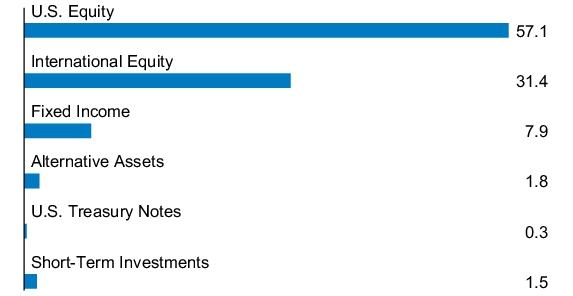
What were the Fund costs for the last year?
(based on a hypothetical $10,000 investment)
| Fund (Class) | Costs of a $10,000 investment |
Costs paid as a percentage of a $10,000 investment |
| JPMorgan SmartRetirement® Blend 2065 Fund (Class R2 Shares) |
$90 | 0.81% |
How did the Fund Perform?
The Fund's Class R2 Shares returned 22.46% for the twelve months ended June 30, 2026. The MSCI ACWI Index (net total return) returned 21.34%, the S&P Target Date 2065+ Index (the "Index") returned 22.71% and the JPM SmartRetirement Blend 2065 Composite Benchmark returned 23.06% for the twelve months ended June 30, 2026.
- Relative to the Index, holding more emerging markets equities was additive. Conversely, holding more fixed income relative to the Index detracted, as equities broadly outperformed fixed income for the twelve months ended June 30, 2026.
- Manager selection was additive for the twelve months ended June 30, 2026. The JPMorgan Core Plus Bond Fund added value. Conversely, the JPMorgan BetaBuilders International Equity ETF detracted from relative performance.
- Active asset allocation was additive for the twelve months ended June 30, 2026. Our global equity overweight was additive, as global equities performed well across the board.
Fund Performance
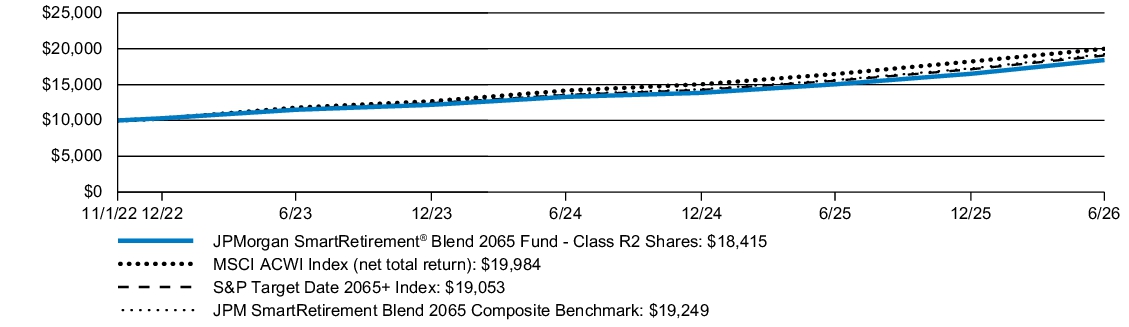
| AVERAGE ANNUAL TOTAL RETURNS | INCEPTION DATE |
1 YEAR | SINCE INCEPTION |
||
| JPMorgan SmartRetirement® Blend 2065 Fund (Class R2 Shares) | November 1, 2022 | 22.46 | % | 18.15 | % |
| MSCI ACWI Index (net total return) | 21.34 | 20.78 | |||
| S&P Target Date 2065+ Index | 22.71 | 19.22 | |||
| JPM SmartRetirement Blend 2065 Composite Benchmark | 23.06 | 19.55 |
KEY FUND STATISTICS
| Fund net assets (000's) | $181,802 | |
| Total number of portfolio holdings | 16 | |
| Portfolio turnover rate | 22 | % |
| Total advisory fees paid (000's) | $0 |
PORTFOLIO COMPOSITION - ASSET CLASS
(% of Total Investments)
(% of Total Investments)
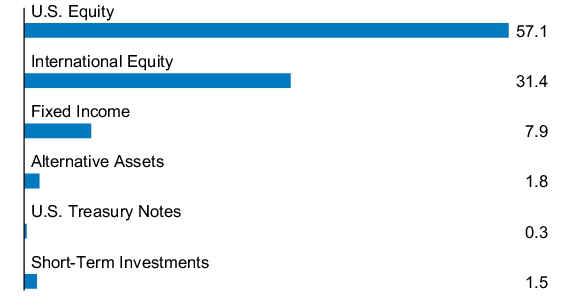
What were the Fund costs for the last year?
(based on a hypothetical $10,000 investment)
| Fund (Class) | Costs of a $10,000 investment |
Costs paid as a percentage of a $10,000 investment |
| JPMorgan SmartRetirement® Blend 2065 Fund (Class R3 Shares) |
$63 | 0.56% |
How did the Fund Perform?
The Fund's Class R3 Shares returned 22.79% for the twelve months ended June 30, 2026. The MSCI ACWI Index (net total return) returned 21.34%, the S&P Target Date 2065+ Index (the "Index") returned 22.71% and the JPM SmartRetirement Blend 2065 Composite Benchmark returned 23.06% for the twelve months ended June 30, 2026.
- Relative to the Index, holding more emerging markets equities was additive. Conversely, holding more fixed income relative to the Index detracted, as equities broadly outperformed fixed income for the twelve months ended June 30, 2026.
- Manager selection was additive for the twelve months ended June 30, 2026. The JPMorgan Core Plus Bond Fund added value. Conversely, the JPMorgan BetaBuilders International Equity ETF detracted from relative performance.
- Active asset allocation was additive for the twelve months ended June 30, 2026. Our global equity overweight was additive, as global equities performed well across the board.
Fund Performance
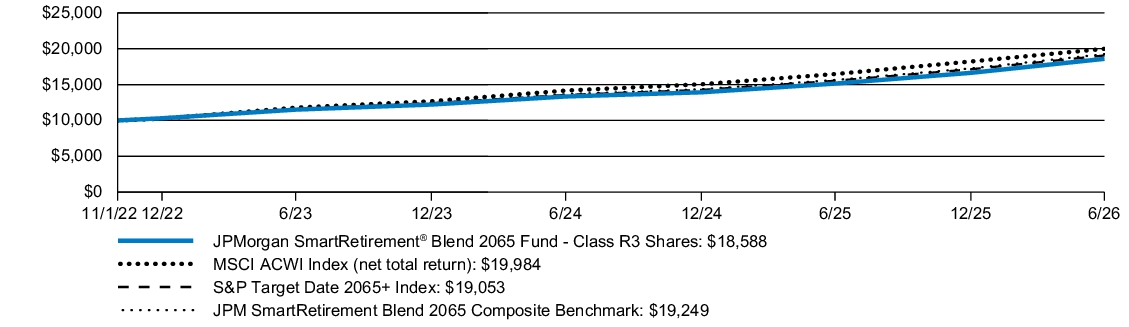
| AVERAGE ANNUAL TOTAL RETURNS | INCEPTION DATE |
1 YEAR | SINCE INCEPTION |
||
| JPMorgan SmartRetirement® Blend 2065 Fund (Class R3 Shares) | November 1, 2022 | 22.79 | % | 18.46 | % |
| MSCI ACWI Index (net total return) | 21.34 | 20.78 | |||
| S&P Target Date 2065+ Index | 22.71 | 19.22 | |||
| JPM SmartRetirement Blend 2065 Composite Benchmark | 23.06 | 19.55 |
KEY FUND STATISTICS
| Fund net assets (000's) | $181,802 | |
| Total number of portfolio holdings | 16 | |
| Portfolio turnover rate | 22 | % |
| Total advisory fees paid (000's) | $0 |
PORTFOLIO COMPOSITION - ASSET CLASS
(% of Total Investments)
(% of Total Investments)
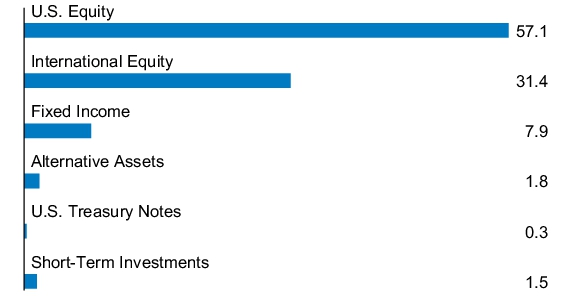
What were the Fund costs for the last year?
(based on a hypothetical $10,000 investment)
| Fund (Class) | Costs of a $10,000 investment |
Costs paid as a percentage of a $10,000 investment |
| JPMorgan SmartRetirement® Blend 2065 Fund (Class R4 Shares) |
$35 | 0.32% |
How did the Fund Perform?
The Fund's Class R4 Shares returned 23.07% for the twelve months ended June 30, 2026. The MSCI ACWI Index (net total return) returned 21.34%, the S&P Target Date 2065+ Index (the "Index") returned 22.71% and the JPM SmartRetirement Blend 2065 Composite Benchmark returned 23.06% for the twelve months ended June 30, 2026.
- Relative to the Index, holding more emerging markets equities was additive. Conversely, holding more fixed income relative to the Index detracted, as equities broadly outperformed fixed income for the twelve months ended June 30, 2026.
- Manager selection was additive for the twelve months ended June 30, 2026. The JPMorgan Core Plus Bond Fund added value. Conversely, the JPMorgan BetaBuilders International Equity ETF detracted from relative performance.
- Active asset allocation was additive for the twelve months ended June 30, 2026. Our global equity overweight was additive, as global equities performed well across the board.
Fund Performance
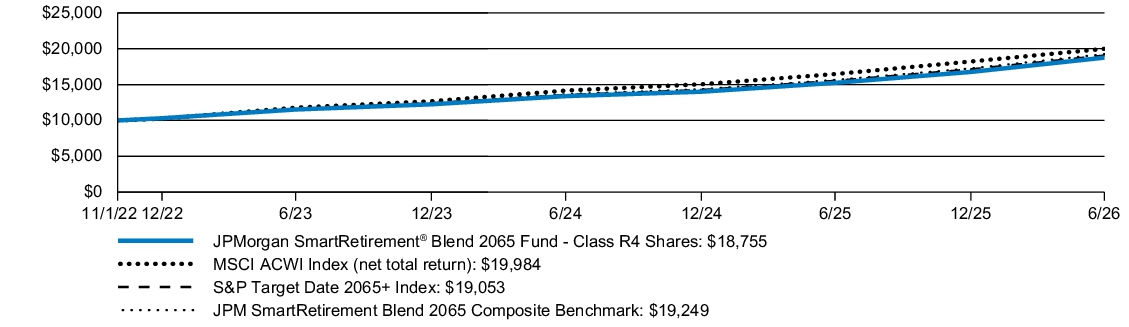
| AVERAGE ANNUAL TOTAL RETURNS | INCEPTION DATE |
1 YEAR | SINCE INCEPTION |
||
| JPMorgan SmartRetirement® Blend 2065 Fund (Class R4 Shares) | November 1, 2022 | 23.07 | % | 18.75 | % |
| MSCI ACWI Index (net total return) | 21.34 | 20.78 | |||
| S&P Target Date 2065+ Index | 22.71 | 19.22 | |||
| JPM SmartRetirement Blend 2065 Composite Benchmark | 23.06 | 19.55 |
KEY FUND STATISTICS
| Fund net assets (000's) | $181,802 | |
| Total number of portfolio holdings | 16 | |
| Portfolio turnover rate | 22 | % |
| Total advisory fees paid (000's) | $0 |
PORTFOLIO COMPOSITION - ASSET CLASS
(% of Total Investments)
(% of Total Investments)
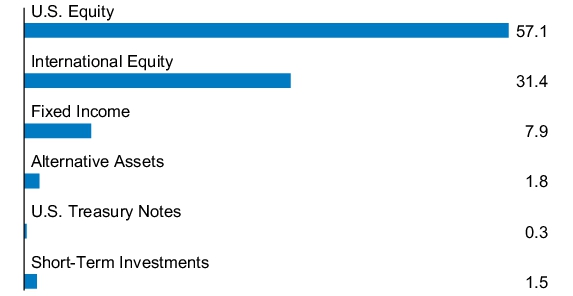
What were the Fund costs for the last year?
(based on a hypothetical $10,000 investment)
| Fund (Class) | Costs of a $10,000 investment |
Costs paid as a percentage of a $10,000 investment |
| JPMorgan SmartRetirement® Blend 2065 Fund (Class R5 Shares) |
$19 | 0.17% |
How did the Fund Perform?
The Fund's Class R5 Shares returned 23.24% for the twelve months ended June 30, 2026. The MSCI ACWI Index (net total return) returned 21.34%, the S&P Target Date 2065+ Index (the "Index") returned 22.71% and the JPM SmartRetirement Blend 2065 Composite Benchmark returned 23.06% for the twelve months ended June 30, 2026.
- Relative to the Index, holding more emerging markets equities was additive. Conversely, holding more fixed income relative to the Index detracted, as equities broadly outperformed fixed income for the twelve months ended June 30, 2026.
- Manager selection was additive for the twelve months ended June 30, 2026. The JPMorgan Core Plus Bond Fund added value. Conversely, the JPMorgan BetaBuilders International Equity ETF detracted from relative performance.
- Active asset allocation was additive for the twelve months ended June 30, 2026. Our global equity overweight was additive, as global equities performed well across the board.
Fund Performance
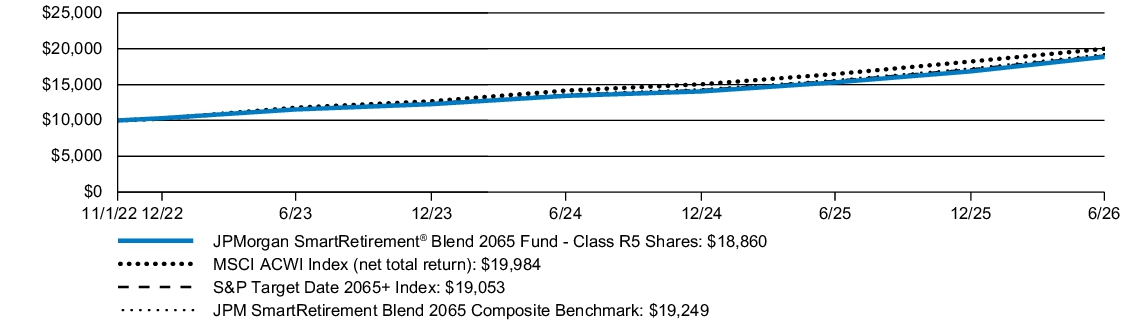
| AVERAGE ANNUAL TOTAL RETURNS | INCEPTION DATE |
1 YEAR | SINCE INCEPTION |
||
| JPMorgan SmartRetirement® Blend 2065 Fund (Class R5 Shares) | November 1, 2022 | 23.24 | % | 18.93 | % |
| MSCI ACWI Index (net total return) | 21.34 | 20.78 | |||
| S&P Target Date 2065+ Index | 22.71 | 19.22 | |||
| JPM SmartRetirement Blend 2065 Composite Benchmark | 23.06 | 19.55 |
KEY FUND STATISTICS
| Fund net assets (000's) | $181,802 | |
| Total number of portfolio holdings | 16 | |
| Portfolio turnover rate | 22 | % |
| Total advisory fees paid (000's) | $0 |
PORTFOLIO COMPOSITION - ASSET CLASS
(% of Total Investments)
(% of Total Investments)
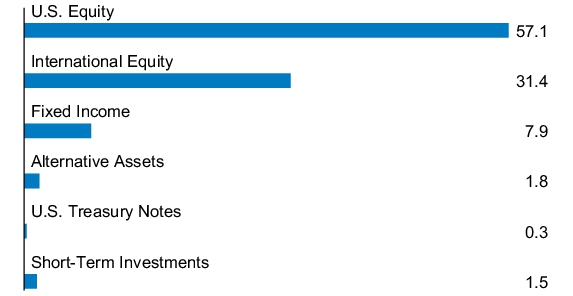
What were the Fund costs for the last year?
(based on a hypothetical $10,000 investment)
| Fund (Class) | Costs of a $10,000 investment |
Costs paid as a percentage of a $10,000 investment |
| JPMorgan SmartRetirement® Blend 2065 Fund (Class R6 Shares) |
$7 | 0.06% |
How did the Fund Perform?
The Fund's Class R6 Shares returned 23.38% for the twelve months ended June 30, 2026. The MSCI ACWI Index (net total return) returned 21.34%, the S&P Target Date 2065+ Index (the "Index") returned 22.71% and the JPM SmartRetirement Blend 2065 Composite Benchmark returned 23.06% for the twelve months ended June 30, 2026.
- Relative to the Index, holding more emerging markets equities was additive. Conversely, holding more fixed income relative to the Index detracted, as equities broadly outperformed fixed income for the twelve months ended June 30, 2026.
- Manager selection was additive for the twelve months ended June 30, 2026. The JPMorgan Core Plus Bond Fund added value. Conversely, the JPMorgan BetaBuilders International Equity ETF detracted from relative performance.
- Active asset allocation was additive for the twelve months ended June 30, 2026. Our global equity overweight was additive, as global equities performed well across the board.
Fund Performance
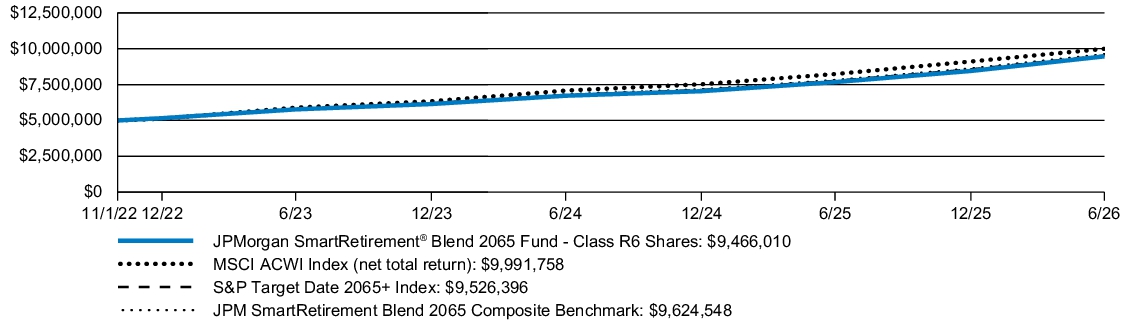
| AVERAGE ANNUAL TOTAL RETURNS | INCEPTION DATE |
1 YEAR | SINCE INCEPTION |
||
| JPMorgan SmartRetirement® Blend 2065 Fund (Class R6 Shares) | November 1, 2022 | 23.38 | % | 19.05 | % |
| MSCI ACWI Index (net total return) | 21.34 | 20.78 | |||
| S&P Target Date 2065+ Index | 22.71 | 19.22 | |||
| JPM SmartRetirement Blend 2065 Composite Benchmark | 23.06 | 19.55 |
KEY FUND STATISTICS
| Fund net assets (000's) | $181,802 | |
| Total number of portfolio holdings | 16 | |
| Portfolio turnover rate | 22 | % |
| Total advisory fees paid (000's) | $0 |
PORTFOLIO COMPOSITION - ASSET CLASS
(% of Total Investments)
(% of Total Investments)
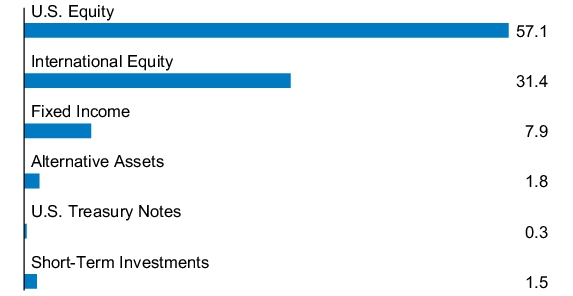
What were the Fund costs for the last year?
(based on a hypothetical $10,000 investment)
| Fund (Class) | Costs of a $10,000 investment |
Costs paid as a percentage of a $10,000 investment* |
| JPMorgan SmartRetirement® 2070 Fund (Class R6 Shares) |
$0 | 0.00% |
| * | This charge is annualized. |
How did the Fund Perform?
The Fund's Class R6 Shares returned 5.47% for the period since inception, February 27, 2026, to June 30, 2026. The MSCI ACWI Index (net total return) returned 6.43%, the S&P Target Date 2065+ Index (the "Index") returned 6.07% and the JPM SmartRetirement 2070 Composite Benchmark returned 6.05% for the same period ended June 30, 2026.
- Relative to the Index, holding more emerging markets equities was additive for the four months ended June 30, 2026. Conversely, holding more fixed income relative to the Index detracted, as equities broadly outperformed fixed income for the four months ended June 30, 2026.
- Manager selection detracted from relative performance for the four months ended June 30, 2026. The JPMorgan Core Plus Bond Fund and the JPMorgan Emerging Markets Equity Fund added value. Conversely, the JPMorgan Global Select Equity ETF and the JPMorgan Value Advantage Fund detracted.
- Active asset allocation was additive for the four months ended June 30, 2026. A global equity overweight, initiated at the end of the first quarter to benefit from attractive valuations and a strong fundamental picture, was additive, as global equities performed well.
Fund Performance
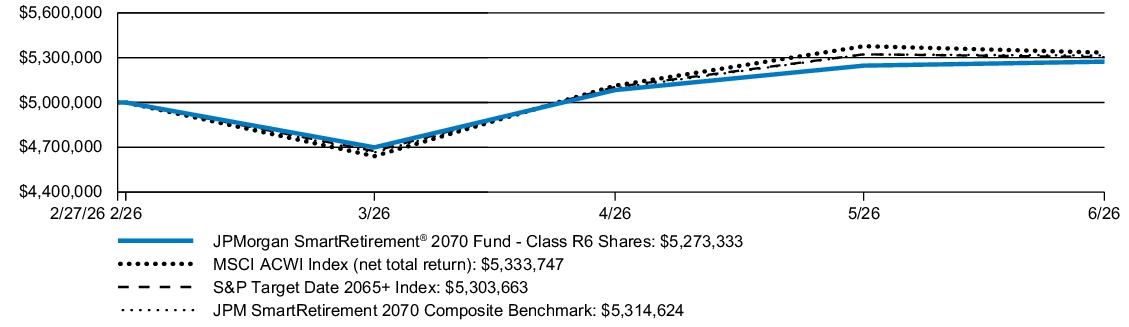
| AVERAGE ANNUAL TOTAL RETURNS | INCEPTION DATE |
SINCE INCEPTION* |
|
| JPMorgan SmartRetirement® 2070 Fund (Class R6 Shares) | February 27, 2026 | 5.47 | % |
| MSCI ACWI Index (net total return) | 6.43 | ||
| S&P Target Date 2065+ Index | 6.07 | ||
| JPM SmartRetirement 2070 Composite Benchmark | 6.05 |
| * |
Not annualized. |
KEY FUND STATISTICS
| Fund net assets (000's) | $3,089 | |
| Total number of portfolio holdings | 23 | |
| Portfolio turnover rate | 12 | % |
| Total advisory fees paid (000's) | $0 |
PORTFOLIO COMPOSITION - ASSET CLASS
(% of Total Investments)
(% of Total Investments)
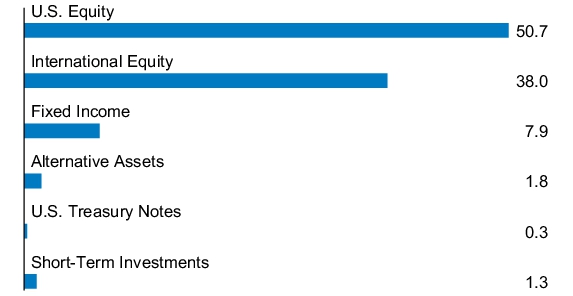
What were the Fund costs for the last year?
(based on a hypothetical $10,000 investment)
| Fund (Class) | Costs of a $10,000 investment |
Costs paid as a percentage of a $10,000 investment* |
| JPMorgan SmartRetirement® 2070 Fund (Class R5 Shares) |
$3 | 0.10% |
| * | This charge is annualized. |
How did the Fund Perform?
The Fund's Class R5 Shares returned 5.47% for the period since inception, February 27, 2026, to June 30, 2026. The MSCI ACWI Index (net total return) returned 6.43%, the S&P Target Date 2065+ Index (the "Index") returned 6.07% and the JPM SmartRetirement 2070 Composite Benchmark returned 6.05% for the same period ended June 30, 2026.
- Relative to the Index, holding more emerging markets equities was additive for the four months ended June 30, 2026. Conversely, holding more fixed income relative to the Index detracted, as equities broadly outperformed fixed income for the four months ended June 30, 2026.
- Manager selection detracted from relative performance for the four months ended June 30, 2026. The JPMorgan Core Plus Bond Fund and the JPMorgan Emerging Markets Equity Fund added value. Conversely, the JPMorgan Global Select Equity ETF and the JPMorgan Value Advantage Fund detracted.
- Active asset allocation was additive for the four months ended June 30, 2026. A global equity overweight, initiated at the end of the first quarter to benefit from attractive valuations and a strong fundamental picture, was additive, as global equities performed well.
Fund Performance
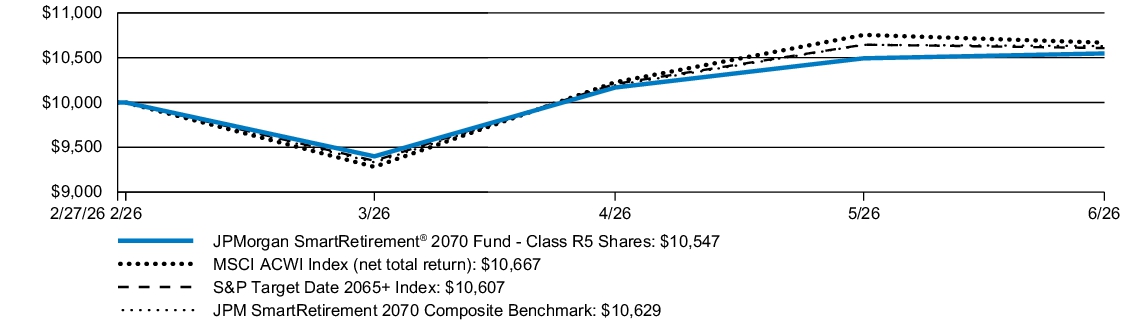
| AVERAGE ANNUAL TOTAL RETURNS | INCEPTION DATE |
SINCE INCEPTION* |
|
| JPMorgan SmartRetirement® 2070 Fund (Class R5 Shares) | February 27, 2026 | 5.47 | % |
| MSCI ACWI Index (net total return) | 6.43 | ||
| S&P Target Date 2065+ Index | 6.07 | ||
| JPM SmartRetirement 2070 Composite Benchmark | 6.05 |
| * |
Not annualized. |
KEY FUND STATISTICS
| Fund net assets (000's) | $3,089 | |
| Total number of portfolio holdings | 23 | |
| Portfolio turnover rate | 12 | % |
| Total advisory fees paid (000's) | $0 |
PORTFOLIO COMPOSITION - ASSET CLASS
(% of Total Investments)
(% of Total Investments)
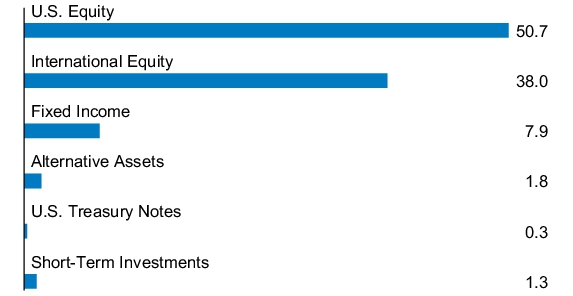
What were the Fund costs for the last year?
(based on a hypothetical $10,000 investment)
| Fund (Class) | Costs of a $10,000 investment |
Costs paid as a percentage of a $10,000 investment* |
| JPMorgan SmartRetirement® 2070 Fund (Class R4 Shares) |
$9 | 0.25% |
| * | This charge is annualized. |
How did the Fund Perform?
The Fund's Class R4 Shares returned 5.40% for the period since inception, February 27, 2026, to June 30, 2026. The MSCI ACWI Index (net total return) returned 6.43%, the S&P Target Date 2065+ Index (the "Index") returned 6.07% and the JPM SmartRetirement 2070 Composite Benchmark returned 6.05% for the same period ended June 30, 2026.
- Relative to the Index, holding more emerging markets equities was additive for the four months ended June 30, 2026. Conversely, holding more fixed income relative to the Index detracted, as equities broadly outperformed fixed income for the four months ended June 30, 2026.
- Manager selection detracted from relative performance for the four months ended June 30, 2026. The JPMorgan Core Plus Bond Fund and the JPMorgan Emerging Markets Equity Fund added value. Conversely, the JPMorgan Global Select Equity ETF and the JPMorgan Value Advantage Fund detracted.
- Active asset allocation was additive for the four months ended June 30, 2026. A global equity overweight, initiated at the end of the first quarter to benefit from attractive valuations and a strong fundamental picture, was additive, as global equities performed well.
Fund Performance
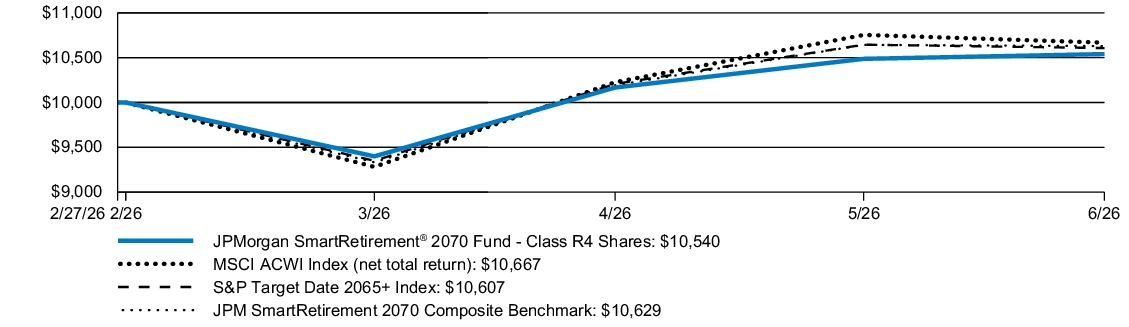
| AVERAGE ANNUAL TOTAL RETURNS | INCEPTION DATE |
SINCE INCEPTION* |
|
| JPMorgan SmartRetirement® 2070 Fund (Class R4 Shares) | February 27, 2026 | 5.40 | % |
| MSCI ACWI Index (net total return) | 6.43 | ||
| S&P Target Date 2065+ Index | 6.07 | ||
| JPM SmartRetirement 2070 Composite Benchmark | 6.05 |
| * |
Not annualized. |
KEY FUND STATISTICS
| Fund net assets (000's) | $3,089 | |
| Total number of portfolio holdings | 23 | |
| Portfolio turnover rate | 12 | % |
| Total advisory fees paid (000's) | $0 |
PORTFOLIO COMPOSITION - ASSET CLASS
(% of Total Investments)
(% of Total Investments)
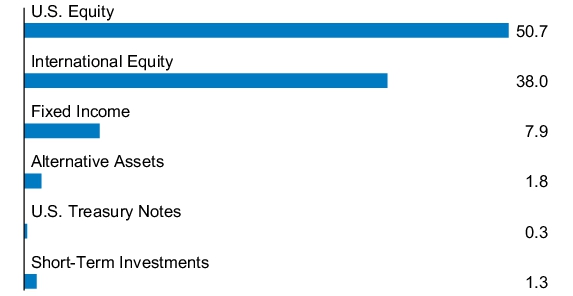
What were the Fund costs for the last year?
(based on a hypothetical $10,000 investment)
| Fund (Class) | Costs of a $10,000 investment |
Costs paid as a percentage of a $10,000 investment* |
| JPMorgan SmartRetirement® 2070 Fund (Class R3 Shares) |
$17 | 0.50% |
| * | This charge is annualized. |
How did the Fund Perform?
The Fund's Class R3 Shares returned 5.33% for the period since inception, February 27, 2026, to June 30, 2026. The MSCI ACWI Index (net total return) returned 6.43%, the S&P Target Date 2065+ Index (the "Index") returned 6.07% and the JPM SmartRetirement 2070 Composite Benchmark returned 6.05% for the same period ended June 30, 2026.
- Relative to the Index, holding more emerging markets equities was additive for the four months ended June 30, 2026. Conversely, holding more fixed income relative to the Index detracted, as equities broadly outperformed fixed income for the four months ended June 30, 2026.
- Manager selection detracted from relative performance for the four months ended June 30, 2026. The JPMorgan Core Plus Bond Fund and the JPMorgan Emerging Markets Equity Fund added value. Conversely, the JPMorgan Global Select Equity ETF and the JPMorgan Value Advantage Fund detracted.
- Active asset allocation was additive for the four months ended June 30, 2026. A global equity overweight, initiated at the end of the first quarter to benefit from attractive valuations and a strong fundamental picture, was additive, as global equities performed well.
Fund Performance
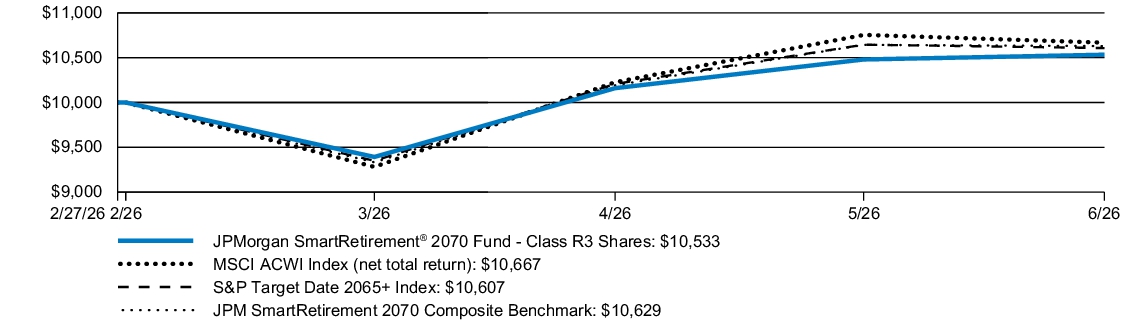
| AVERAGE ANNUAL TOTAL RETURNS | INCEPTION DATE |
SINCE INCEPTION* |
|
| JPMorgan SmartRetirement® 2070 Fund (Class R3 Shares) | February 27, 2026 | 5.33 | % |
| MSCI ACWI Index (net total return) | 6.43 | ||
| S&P Target Date 2065+ Index | 6.07 | ||
| JPM SmartRetirement 2070 Composite Benchmark | 6.05 |
| * |
Not annualized. |
KEY FUND STATISTICS
| Fund net assets (000's) | $3,089 | |
| Total number of portfolio holdings | 23 | |
| Portfolio turnover rate | 12 | % |
| Total advisory fees paid (000's) | $0 |
PORTFOLIO COMPOSITION - ASSET CLASS
(% of Total Investments)
(% of Total Investments)
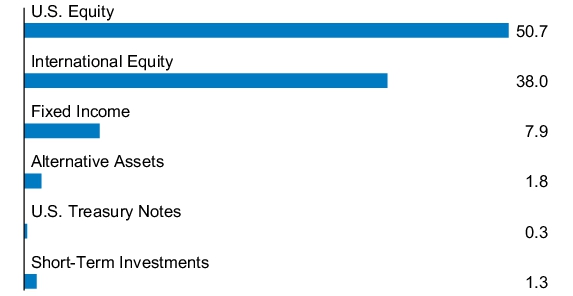
What were the Fund costs for the last year?
(based on a hypothetical $10,000 investment)
| Fund (Class) | Costs of a $10,000 investment |
Costs paid as a percentage of a $10,000 investment* |
| JPMorgan SmartRetirement® 2070 Fund (Class R2 Shares) |
$25 | 0.75% |
| * | This charge is annualized. |
How did the Fund Perform?
The Fund's Class R2 Shares returned 5.27% for the period since inception, February 27, 2026, to June 30, 2026. The MSCI ACWI Index (net total return) returned 6.43%, the S&P Target Date 2065+ Index (the "Index") returned 6.07% and the JPM SmartRetirement 2070 Composite Benchmark returned 6.05% for the same period ended June 30, 2026.
- Relative to the Index, holding more emerging markets equities was additive for the four months ended June 30, 2026. Conversely, holding more fixed income relative to the Index detracted, as equities broadly outperformed fixed income for the four months ended June 30, 2026.
- Manager selection detracted from relative performance for the four months ended June 30, 2026. The JPMorgan Core Plus Bond Fund and the JPMorgan Emerging Markets Equity Fund added value. Conversely, the JPMorgan Global Select Equity ETF and the JPMorgan Value Advantage Fund detracted.
- Active asset allocation was additive for the four months ended June 30, 2026. A global equity overweight, initiated at the end of the first quarter to benefit from attractive valuations and a strong fundamental picture, was additive, as global equities performed well.
Fund Performance
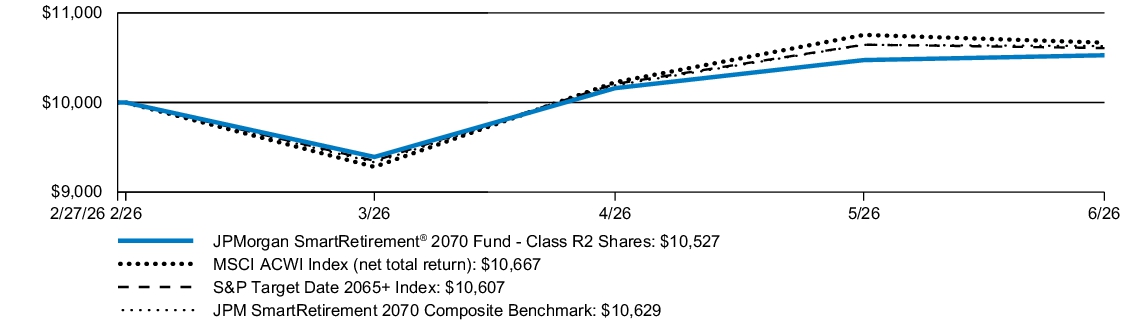
| AVERAGE ANNUAL TOTAL RETURNS | INCEPTION DATE |
SINCE INCEPTION* |
|
| JPMorgan SmartRetirement® 2070 Fund (Class R2 Shares) | February 27, 2026 | 5.27 | % |
| MSCI ACWI Index (net total return) | 6.43 | ||
| S&P Target Date 2065+ Index | 6.07 | ||
| JPM SmartRetirement 2070 Composite Benchmark | 6.05 |
| * |
Not annualized. |
KEY FUND STATISTICS
| Fund net assets (000's) | $3,089 | |
| Total number of portfolio holdings | 23 | |
| Portfolio turnover rate | 12 | % |
| Total advisory fees paid (000's) | $0 |
PORTFOLIO COMPOSITION - ASSET CLASS
(% of Total Investments)
(% of Total Investments)
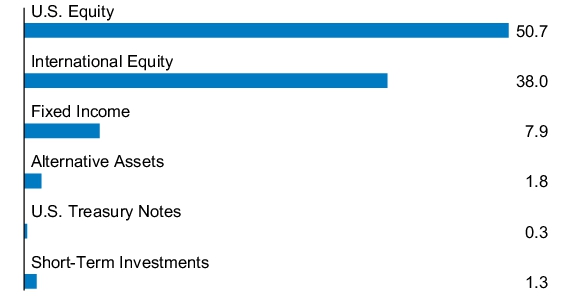
What were the Fund costs for the last year?
(based on a hypothetical $10,000 investment)
| Fund (Class) | Costs of a $10,000 investment |
Costs paid as a percentage of a $10,000 investment* |
| JPMorgan SmartRetirement® 2070 Fund (Class I Shares) |
$8 | 0.25% |
| * | This charge is annualized. |
How did the Fund Perform?
The Fund's Class I Shares returned 5.40% for the period since inception, February 27, 2026, to June 30, 2026. The MSCI ACWI Index (net total return) returned 6.43%, the S&P Target Date 2065+ Index (the "Index") returned 6.07% and the JPM SmartRetirement 2070 Composite Benchmark returned 6.05% for the same period ended June 30, 2026.
- Relative to the Index, holding more emerging markets equities was additive for the four months ended June 30, 2026. Conversely, holding more fixed income relative to the Index detracted, as equities broadly outperformed fixed income for the four months ended June 30, 2026.
- Manager selection detracted from relative performance for the four months ended June 30, 2026. The JPMorgan Core Plus Bond Fund and the JPMorgan Emerging Markets Equity Fund added value. Conversely, the JPMorgan Global Select Equity ETF and the JPMorgan Value Advantage Fund detracted.
- Active asset allocation was additive for the four months ended June 30, 2026. A global equity overweight, initiated at the end of the first quarter to benefit from attractive valuations and a strong fundamental picture, was additive, as global equities performed well.
Fund Performance
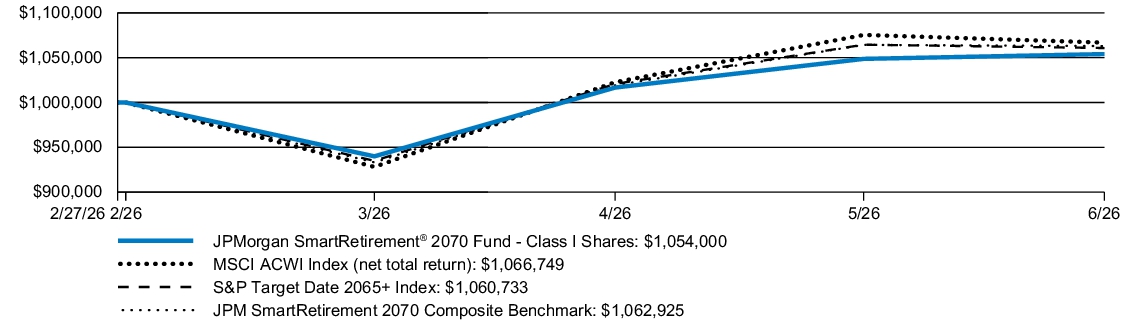
| AVERAGE ANNUAL TOTAL RETURNS | INCEPTION DATE |
SINCE INCEPTION* |
|
| JPMorgan SmartRetirement® 2070 Fund (Class I Shares) | February 27, 2026 | 5.40 | % |
| MSCI ACWI Index (net total return) | 6.43 | ||
| S&P Target Date 2065+ Index | 6.07 | ||
| JPM SmartRetirement 2070 Composite Benchmark | 6.05 |
| * |
Not annualized. |
KEY FUND STATISTICS
| Fund net assets (000's) | $3,089 | |
| Total number of portfolio holdings | 23 | |
| Portfolio turnover rate | 12 | % |
| Total advisory fees paid (000's) | $0 |
PORTFOLIO COMPOSITION - ASSET CLASS
(% of Total Investments)
(% of Total Investments)
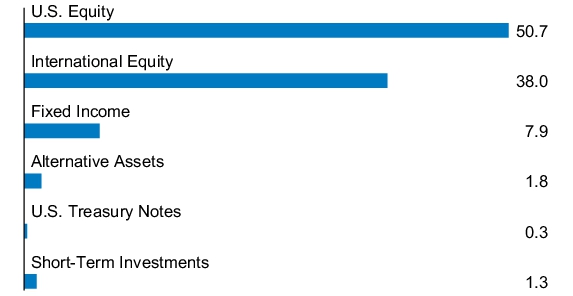
What were the Fund costs for the last year?
(based on a hypothetical $10,000 investment)
| Fund (Class) | Costs of a $10,000 investment |
Costs paid as a percentage of a $10,000 investment* |
| JPMorgan SmartRetirement® 2070 Fund (Class C Shares) |
$34 | 1.00% |
| * | This charge is annualized. |
How did the Fund Perform?
The Fund's Class C Shares, without a sales charge, returned 5.13% for the period since inception, February 27, 2026, to June 30, 2026. The MSCI ACWI Index (net total return) returned 6.43%, the S&P Target Date 2065+ Index (the "Index") returned 6.07% and the JPM SmartRetirement 2070 Composite Benchmark returned 6.05% for the same period ended June 30, 2026.
- Relative to the Index, holding more emerging markets equities was additive for the four months ended June 30, 2026. Conversely, holding more fixed income relative to the Index detracted, as equities broadly outperformed fixed income for the four months ended June 30, 2026.
- Manager selection detracted from relative performance for the four months ended June 30, 2026. The JPMorgan Core Plus Bond Fund and the JPMorgan Emerging Markets Equity Fund added value. Conversely, the JPMorgan Global Select Equity ETF and the JPMorgan Value Advantage Fund detracted.
- Active asset allocation was additive for the four months ended June 30, 2026. A global equity overweight, initiated at the end of the first quarter to benefit from attractive valuations and a strong fundamental picture, was additive, as global equities performed well.
Fund Performance
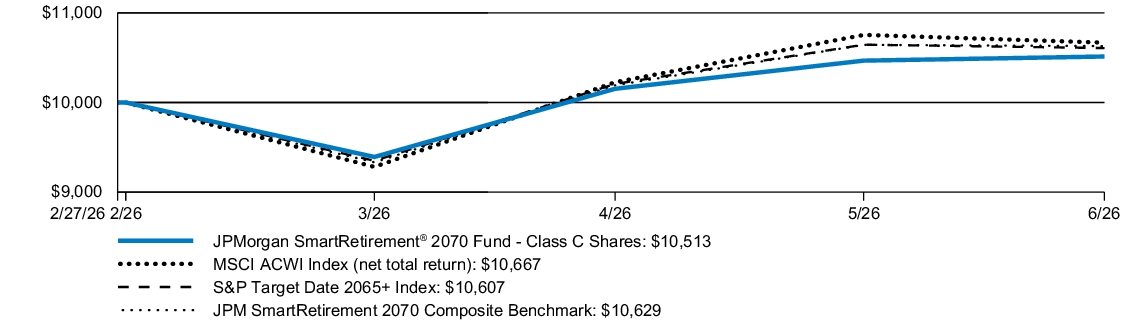
| AVERAGE ANNUAL TOTAL RETURNS | INCEPTION DATE |
SINCE INCEPTION* |
|
| JPMorgan SmartRetirement® 2070 Fund (Class C Shares) | February 27, 2026 | 4.13 | % |
| JPMorgan SmartRetirement® 2070 Fund (Class C Shares) - excluding sales charge | 5.13 | ||
| MSCI ACWI Index (net total return) | 6.43 | ||
| S&P Target Date 2065+ Index | 6.07 | ||
| JPM SmartRetirement 2070 Composite Benchmark | 6.05 |
| * |
Not annualized. |
KEY FUND STATISTICS
| Fund net assets (000's) | $3,089 | |
| Total number of portfolio holdings | 23 | |
| Portfolio turnover rate | 12 | % |
| Total advisory fees paid (000's) | $0 |
PORTFOLIO COMPOSITION - ASSET CLASS
(% of Total Investments)
(% of Total Investments)
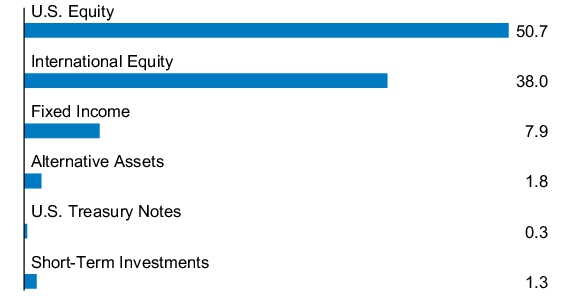
What were the Fund costs for the last year?
(based on a hypothetical $10,000 investment)
| Fund (Class) | Costs of a $10,000 investment |
Costs paid as a percentage of a $10,000 investment* |
| JPMorgan SmartRetirement® 2070 Fund (Class A Shares) |
$15 | 0.44% |
| * | This charge is annualized. |
How did the Fund Perform?
The Fund's Class A Shares, without a sales charge, returned 5.33% for the period since inception, February 27, 2026, to June 30, 2026. The MSCI ACWI Index (net total return) returned 6.43%, the S&P Target Date 2065+ Index (the "Index") returned 6.07% and the JPM SmartRetirement 2070 Composite Benchmark returned 6.05% for the same period ended June 30, 2026.
- Relative to the Index, holding more emerging markets equities was additive for the four months ended June 30, 2026. Conversely, holding more fixed income relative to the Index detracted, as equities broadly outperformed fixed income for the four months ended June 30, 2026.
- Manager selection detracted from relative performance for the four months ended June 30, 2026. The JPMorgan Core Plus Bond Fund and the JPMorgan Emerging Markets Equity Fund added value. Conversely, the JPMorgan Global Select Equity ETF and the JPMorgan Value Advantage Fund detracted.
- Active asset allocation was additive for the four months ended June 30, 2026. A global equity overweight, initiated at the end of the first quarter to benefit from attractive valuations and a strong fundamental picture, was additive, as global equities performed well.
Fund Performance
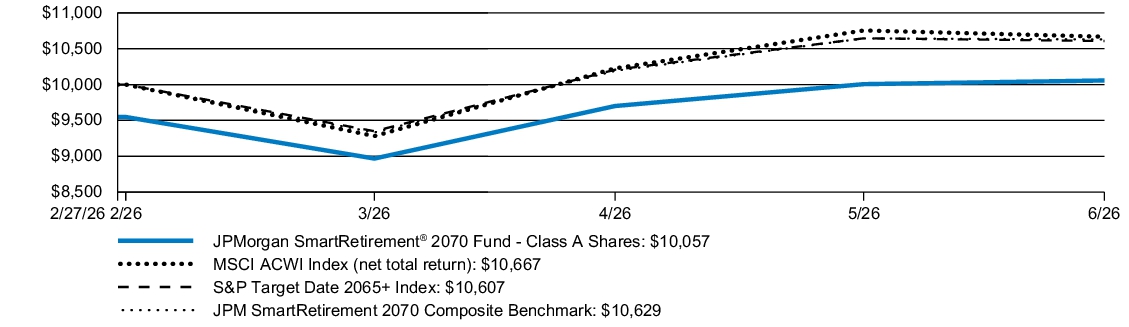
| AVERAGE ANNUAL TOTAL RETURNS | INCEPTION DATE |
SINCE INCEPTION* |
|
| JPMorgan SmartRetirement® 2070 Fund (Class A Shares) | February 27, 2026 | 0.57 | % |
| JPMorgan SmartRetirement® 2070 Fund (Class A Shares) - excluding sales charge | 5.33 | ||
| MSCI ACWI Index (net total return) | 6.43 | ||
| S&P Target Date 2065+ Index | 6.07 | ||
| JPM SmartRetirement 2070 Composite Benchmark | 6.05 |
| * |
Not annualized. |
KEY FUND STATISTICS
| Fund net assets (000's) | $3,089 | |
| Total number of portfolio holdings | 23 | |
| Portfolio turnover rate | 12 | % |
| Total advisory fees paid (000's) | $0 |
PORTFOLIO COMPOSITION - ASSET CLASS
(% of Total Investments)
(% of Total Investments)
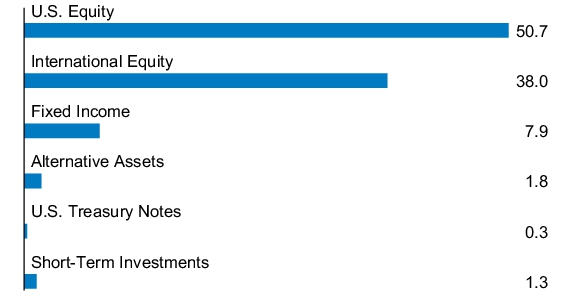
What were the Fund costs for the last year?
(based on a hypothetical $10,000 investment)
| Fund (Class) | Costs of a $10,000 investment |
Costs paid as a percentage of a $10,000 investment* |
| JPMorgan SmartRetirement® Blend 2070 Fund (Class I Shares) |
$11 | 0.32% |
| * | This charge is annualized. |
How did the Fund Perform?
The Fund's Class I Shares returned 6.53% for the period since inception, February 27, 2026, to June 30, 2026. The MSCI ACWI Index (net total return) returned 6.43%, the S&P Target Date 2065+ Index (the "Index") returned 6.07% and the JPM SmartRetirement Blend 2070 Composite Benchmark returned 6.05% for the period ended June 30, 2026.
- Relative to the Index, holding more emerging markets equities was additive for the four months ended June 30, 2026. Conversely, holding more fixed income relative to the Index detracted, as equities broadly outperformed fixed income for the four months ended June 30, 2026.
- Active asset allocation was additive for the four months ended June 30, 2026. A global equity overweight, initiated at the end of first quarter to benefit from attractive valuations and a strong fundamental picture, was additive, as global equities performed well.
- Manager selection detracted for the four months ended June 30, 2026. The JPMorgan Core Plus Bond Fund added value. Conversely, the JPMorgan Emerging Markets Research Enhanced Equity Fund detracted.
Fund Performance
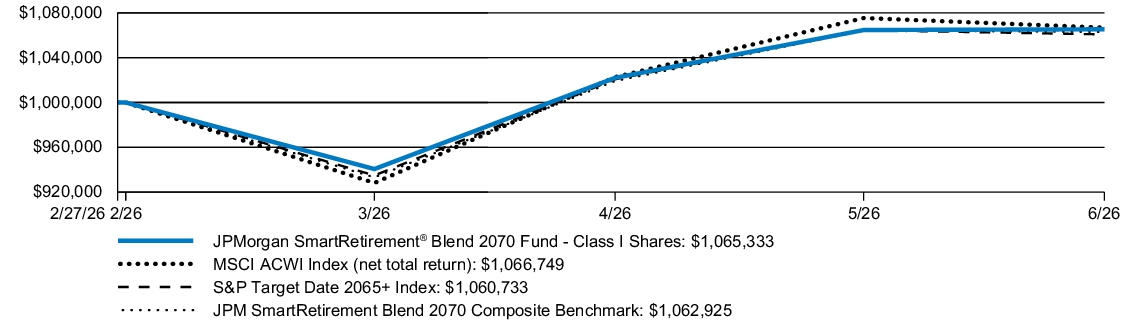
| AVERAGE ANNUAL TOTAL RETURNS | INCEPTION DATE |
SINCE INCEPTION* |
|
| JPMorgan SmartRetirement® Blend 2070 Fund (Class I Shares) | February 27, 2026 | 6.53 | % |
| MSCI ACWI Index (net total return) | 6.43 | ||
| S&P Target Date 2065+ Index | 6.07 | ||
| JPM SmartRetirement Blend 2070 Composite Benchmark | 6.05 |
| * |
Not annualized. |
KEY FUND STATISTICS
| Fund net assets (000's) | $2,132 | |
| Total number of portfolio holdings | 14 | |
| Portfolio turnover rate | 11 | % |
| Total advisory fees paid (000's) | $0 |
PORTFOLIO COMPOSITION - ASSET CLASS
(% of Total Investments)
(% of Total Investments)
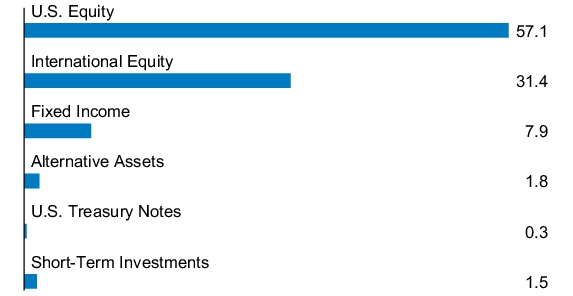
What were the Fund costs for the last year?
(based on a hypothetical $10,000 investment)
| Fund (Class) | Costs of a $10,000 investment |
Costs paid as a percentage of a $10,000 investment* |
| JPMorgan SmartRetirement® Blend 2070 Fund (Class R2 Shares) |
$28 | 0.82% |
| * | This charge is annualized. |
How did the Fund Perform?
The Fund's Class R2 Shares returned 6.33% for the period since inception, February 27, 2026, to June 30, 2026. The MSCI ACWI Index (net total return) returned 6.43%, the S&P Target Date 2065+ Index (the "Index") returned 6.07% and the JPM SmartRetirement Blend 2070 Composite Benchmark returned 6.05% for the period ended June 30, 2026.
- Relative to the Index, holding more emerging markets equities was additive for the four months ended June 30, 2026. Conversely, holding more fixed income relative to the Index detracted, as equities broadly outperformed fixed income for the four months ended June 30, 2026.
- Active asset allocation was additive for the four months ended June 30, 2026. A global equity overweight, initiated at the end of first quarter to benefit from attractive valuations and a strong fundamental picture, was additive, as global equities performed well.
- Manager selection detracted for the four months ended June 30, 2026. The JPMorgan Core Plus Bond Fund added value. Conversely, the JPMorgan Emerging Markets Research Enhanced Equity Fund detracted.
Fund Performance
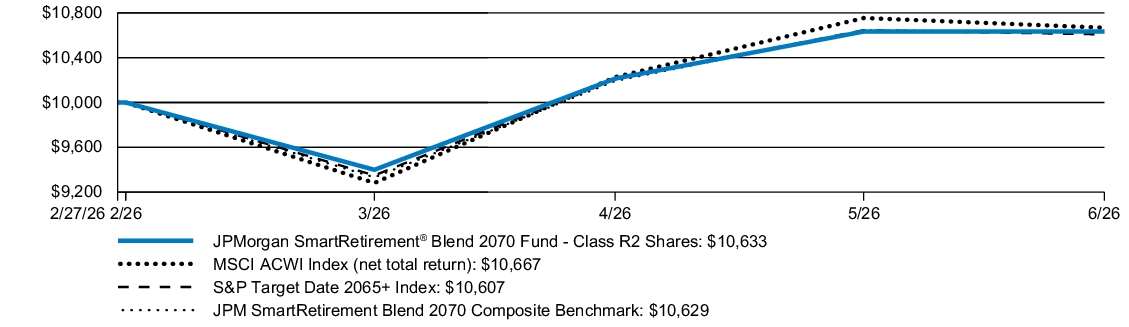
| AVERAGE ANNUAL TOTAL RETURNS | INCEPTION DATE |
SINCE INCEPTION* |
|
| JPMorgan SmartRetirement® Blend 2070 Fund (Class R2 Shares) | February 27, 2026 | 6.33 | % |
| MSCI ACWI Index (net total return) | 6.43 | ||
| S&P Target Date 2065+ Index | 6.07 | ||
| JPM SmartRetirement Blend 2070 Composite Benchmark | 6.05 |
| * |
Not annualized. |
KEY FUND STATISTICS
| Fund net assets (000's) | $2,132 | |
| Total number of portfolio holdings | 14 | |
| Portfolio turnover rate | 11 | % |
| Total advisory fees paid (000's) | $0 |
PORTFOLIO COMPOSITION - ASSET CLASS
(% of Total Investments)
(% of Total Investments)
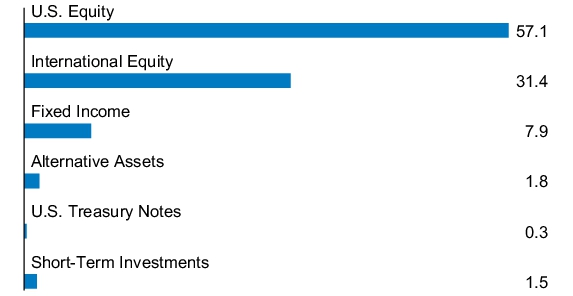
What were the Fund costs for the last year?
(based on a hypothetical $10,000 investment)
| Fund (Class) | Costs of a $10,000 investment |
Costs paid as a percentage of a $10,000 investment* |
| JPMorgan SmartRetirement® Blend 2070 Fund (Class R3 Shares) |
$20 | 0.57% |
| * | This charge is annualized. |
How did the Fund Perform?
The Fund's Class R3 Shares returned 6.40% for the period since inception, February 27, 2026, to June 30, 2026. The MSCI ACWI Index (net total return) returned 6.43%, the S&P Target Date 2065+ Index (the "Index") returned 6.07% and the JPM SmartRetirement Blend 2070 Composite Benchmark returned 6.05% for the period ended June 30, 2026.
- Relative to the Index, holding more emerging markets equities was additive for the four months ended June 30, 2026. Conversely, holding more fixed income relative to the Index detracted, as equities broadly outperformed fixed income for the four months ended June 30, 2026.
- Active asset allocation was additive for the four months ended June 30, 2026. A global equity overweight, initiated at the end of first quarter to benefit from attractive valuations and a strong fundamental picture, was additive, as global equities performed well.
- Manager selection detracted for the four months ended June 30, 2026. The JPMorgan Core Plus Bond Fund added value. Conversely, the JPMorgan Emerging Markets Research Enhanced Equity Fund detracted.
Fund Performance
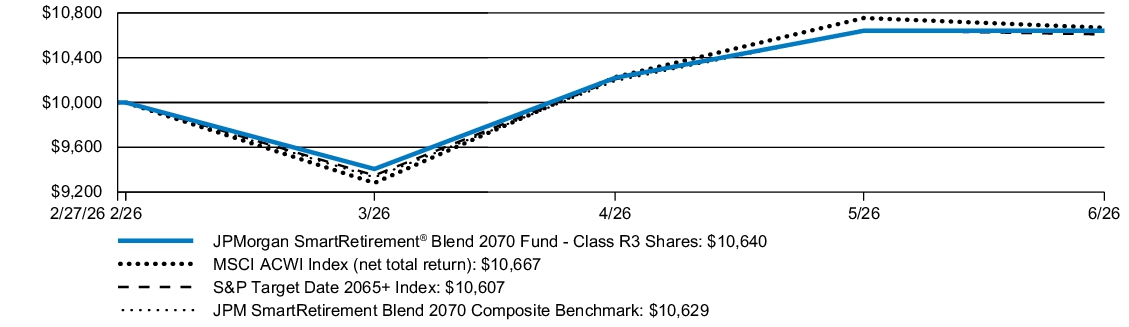
| AVERAGE ANNUAL TOTAL RETURNS | INCEPTION DATE |
SINCE INCEPTION* |
|
| JPMorgan SmartRetirement® Blend 2070 Fund (Class R3 Shares) | February 27, 2026 | 6.40 | % |
| MSCI ACWI Index (net total return) | 6.43 | ||
| S&P Target Date 2065+ Index | 6.07 | ||
| JPM SmartRetirement Blend 2070 Composite Benchmark | 6.05 |
| * |
Not annualized. |
KEY FUND STATISTICS
| Fund net assets (000's) | $2,132 | |
| Total number of portfolio holdings | 14 | |
| Portfolio turnover rate | 11 | % |
| Total advisory fees paid (000's) | $0 |
PORTFOLIO COMPOSITION - ASSET CLASS
(% of Total Investments)
(% of Total Investments)
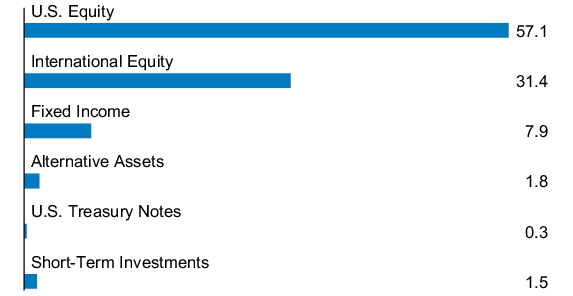
What were the Fund costs for the last year?
(based on a hypothetical $10,000 investment)
| Fund (Class) | Costs of a $10,000 investment |
Costs paid as a percentage of a $10,000 investment* |
| JPMorgan SmartRetirement® Blend 2070 Fund (Class R4 Shares) |
$11 | 0.32% |
| * | This charge is annualized. |
How did the Fund Perform?
The Fund's Class R4 Shares returned 6.53% for the period since inception, February 27, 2026, to June 30, 2026. The MSCI ACWI Index (net total return) returned 6.43%, the S&P Target Date 2065+ Index (the "Index") returned 6.07% and the JPM SmartRetirement Blend 2070 Composite Benchmark returned 6.05% for the period ended June 30, 2026.
- Relative to the Index, holding more emerging markets equities was additive for the four months ended June 30, 2026. Conversely, holding more fixed income relative to the Index detracted, as equities broadly outperformed fixed income for the four months ended June 30, 2026.
- Active asset allocation was additive for the four months ended June 30, 2026. A global equity overweight, initiated at the end of first quarter to benefit from attractive valuations and a strong fundamental picture, was additive, as global equities performed well.
- Manager selection detracted for the four months ended June 30, 2026. The JPMorgan Core Plus Bond Fund added value. Conversely, the JPMorgan Emerging Markets Research Enhanced Equity Fund detracted.
Fund Performance
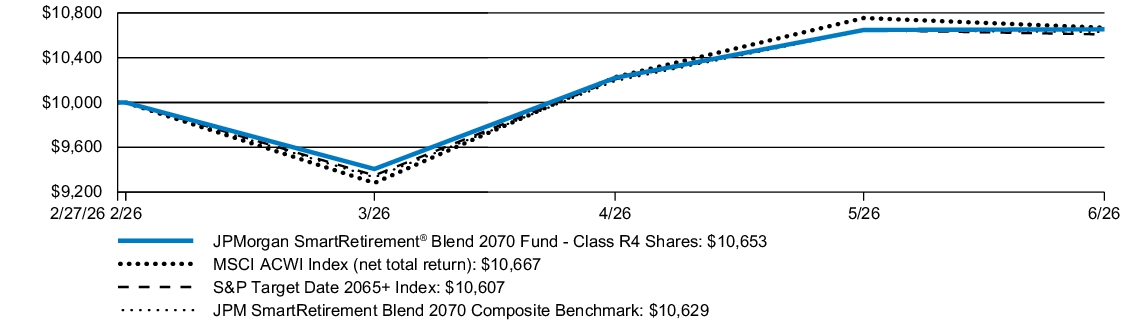
| AVERAGE ANNUAL TOTAL RETURNS | INCEPTION DATE |
SINCE INCEPTION* |
|
| JPMorgan SmartRetirement® Blend 2070 Fund (Class R4 Shares) | February 27, 2026 | 6.53 | % |
| MSCI ACWI Index (net total return) | 6.43 | ||
| S&P Target Date 2065+ Index | 6.07 | ||
| JPM SmartRetirement Blend 2070 Composite Benchmark | 6.05 |
| * |
Not annualized. |
KEY FUND STATISTICS
| Fund net assets (000's) | $2,132 | |
| Total number of portfolio holdings | 14 | |
| Portfolio turnover rate | 11 | % |
| Total advisory fees paid (000's) | $0 |
PORTFOLIO COMPOSITION - ASSET CLASS
(% of Total Investments)
(% of Total Investments)
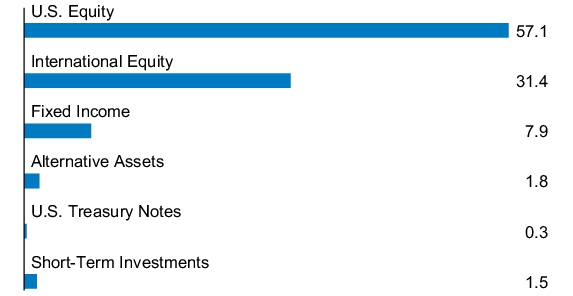
What were the Fund costs for the last year?
(based on a hypothetical $10,000 investment)
| Fund (Class) | Costs of a $10,000 investment |
Costs paid as a percentage of a $10,000 investment* |
| JPMorgan SmartRetirement® Blend 2070 Fund (Class R5 Shares) |
$6 | 0.17% |
| * | This charge is annualized. |
How did the Fund Perform?
The Fund's Class R5 Shares returned 6.60% for the period since inception, February 27, 2026, to June 30, 2026. The MSCI ACWI Index (net total return) returned 6.43%, the S&P Target Date 2065+ Index (the "Index") returned 6.07% and the JPM SmartRetirement Blend 2070 Composite Benchmark returned 6.05% for the period ended June 30, 2026.
- Relative to the Index, holding more emerging markets equities was additive for the four months ended June 30, 2026. Conversely, holding more fixed income relative to the Index detracted, as equities broadly outperformed fixed income for the four months ended June 30, 2026.
- Active asset allocation was additive for the four months ended June 30, 2026. A global equity overweight, initiated at the end of first quarter to benefit from attractive valuations and a strong fundamental picture, was additive, as global equities performed well.
- Manager selection detracted for the four months ended June 30, 2026. The JPMorgan Core Plus Bond Fund added value. Conversely, the JPMorgan Emerging Markets Research Enhanced Equity Fund detracted.
Fund Performance
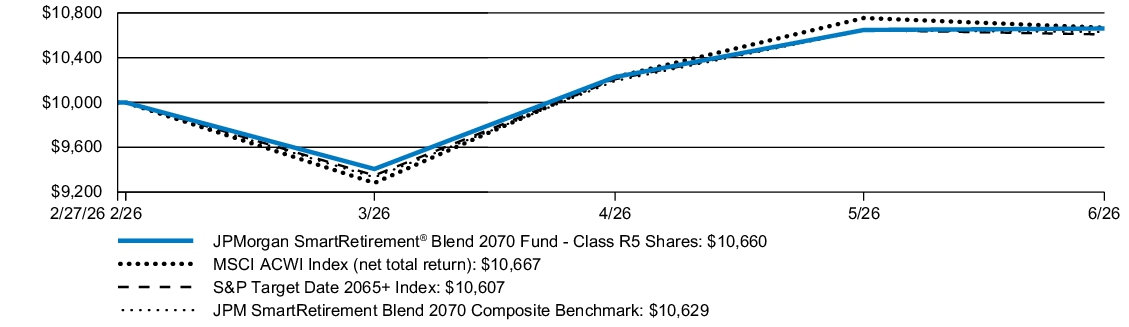
| AVERAGE ANNUAL TOTAL RETURNS | INCEPTION DATE |
SINCE INCEPTION* |
|
| JPMorgan SmartRetirement® Blend 2070 Fund (Class R5 Shares) | February 27, 2026 | 6.60 | % |
| MSCI ACWI Index (net total return) | 6.43 | ||
| S&P Target Date 2065+ Index | 6.07 | ||
| JPM SmartRetirement Blend 2070 Composite Benchmark | 6.05 |
| * |
Not annualized. |
KEY FUND STATISTICS
| Fund net assets (000's) | $2,132 | |
| Total number of portfolio holdings | 14 | |
| Portfolio turnover rate | 11 | % |
| Total advisory fees paid (000's) | $0 |
PORTFOLIO COMPOSITION - ASSET CLASS
(% of Total Investments)
(% of Total Investments)
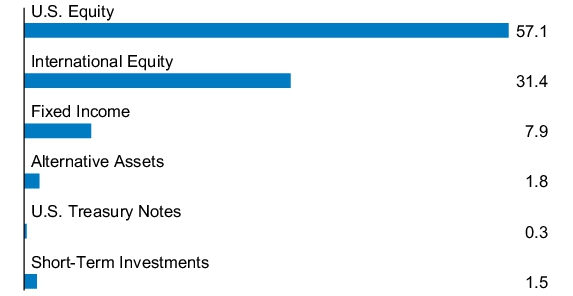
What were the Fund costs for the last year?
(based on a hypothetical $10,000 investment)
| Fund (Class) | Costs of a $10,000 investment |
Costs paid as a percentage of a $10,000 investment* |
| JPMorgan SmartRetirement® Blend 2070 Fund (Class R6 Shares) |
$3 | 0.07% |
| * | This charge is annualized. |
How did the Fund Perform?
The Fund's Class R6 Shares returned 6.60% for the period since inception, February 27, 2026, to June 30, 2026. The MSCI ACWI Index (net total return) returned 6.43%, the S&P Target Date 2065+ Index (the "Index") returned 6.07% and the JPM SmartRetirement Blend 2070 Composite Benchmark returned 6.05% for the period ended June 30, 2026.
- Relative to the Index, holding more emerging markets equities was additive for the four months ended June 30, 2026. Conversely, holding more fixed income relative to the Index detracted, as equities broadly outperformed fixed income for the four months ended June 30, 2026.
- Active asset allocation was additive for the four months ended June 30, 2026. A global equity overweight, initiated at the end of first quarter to benefit from attractive valuations and a strong fundamental picture, was additive, as global equities performed well.
- Manager selection detracted for the four months ended June 30, 2026. The JPMorgan Core Plus Bond Fund added value. Conversely, the JPMorgan Emerging Markets Research Enhanced Equity Fund detracted.
Fund Performance
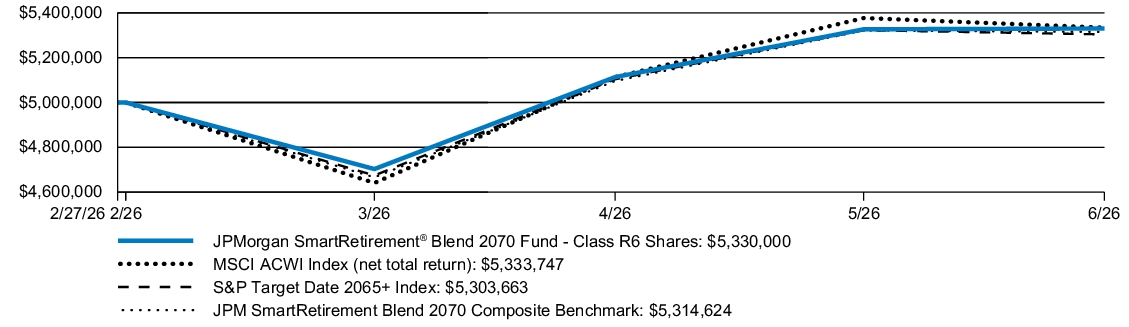
| AVERAGE ANNUAL TOTAL RETURNS | INCEPTION DATE |
SINCE INCEPTION* |
|
| JPMorgan SmartRetirement® Blend 2070 Fund (Class R6 Shares) | February 27, 2026 | 6.60 | % |
| MSCI ACWI Index (net total return) | 6.43 | ||
| S&P Target Date 2065+ Index | 6.07 | ||
| JPM SmartRetirement Blend 2070 Composite Benchmark | 6.05 |
| * |
Not annualized. |
KEY FUND STATISTICS
| Fund net assets (000's) | $2,132 | |
| Total number of portfolio holdings | 14 | |
| Portfolio turnover rate | 11 | % |
| Total advisory fees paid (000's) | $0 |
PORTFOLIO COMPOSITION - ASSET CLASS
(% of Total Investments)
(% of Total Investments)
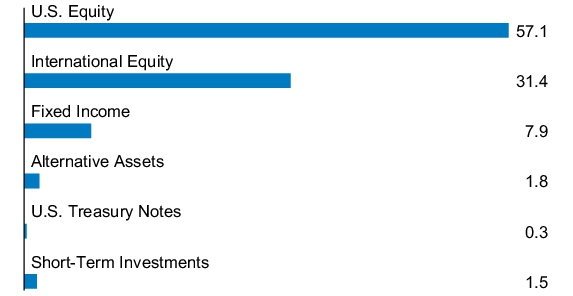
| [1] | This charge is annualized. |
| [2] | This charge is annualized. |
| [3] | This charge is annualized. |
| [4] | This charge is annualized. |
| [5] | This charge is annualized. |
| [6] | This charge is annualized. |
| [7] | This charge is annualized. |
| [8] | This charge is annualized. |
| [9] | This charge is annualized. |
| [10] | This charge is annualized. |
| [11] | This charge is annualized. |
| [12] | This charge is annualized. |
| [13] | This charge is annualized. |
| [14] | This charge is annualized. |