Shareholder Report
Jun. 30, 2026
USD ($)
Holding
What were the Fund costs for the last year?
(Based on a hypothetical $10,000 investment)
| Fund | Costs of a $10,000 investment | Costs paid as a percentage of a $10,000 investment |
| Meridian Hedged Equity Fund (Investor Class) |
$129 | 1.25% |
What drove fund performance during the past 12 months?
- The S&P 500 Index returned 22% over the trailing twelve months, while the covered call index (CBOE S&P 500 BuyWrite Index) returned 17% over the same period.
- Equity gains were driven by resilient earnings, continued AI-related capital spending, and improving confidence that the Iran-related energy shock would not derail the AI expansion. Still, June's volatility underscored how sensitive crowded AI beneficiaries have become to valuation, guidance, interest rates, and capital-markets supply.
- At period end, approximately 31% of the portfolio was unhedged, reflecting the Fund's primary objective of long-term capital growth.
- The balance of the Fund is invested in companies with covered call options written against them — a strategy designed to balance the capital growth potential of the underlying holdings with the downside protection provided by option premium income.
- This approach allows our fundamental thesis on individual holdings to play out while generating income and providing a measure of downside protection.
- Positive contributors to performance included select names in the consumer discretionary, healthcare, and financial sectors.
- Conversely, select holdings in information technology and communication services detracted from relative performance.
How has the Fund historically performed?
GROWTH OF $10,000
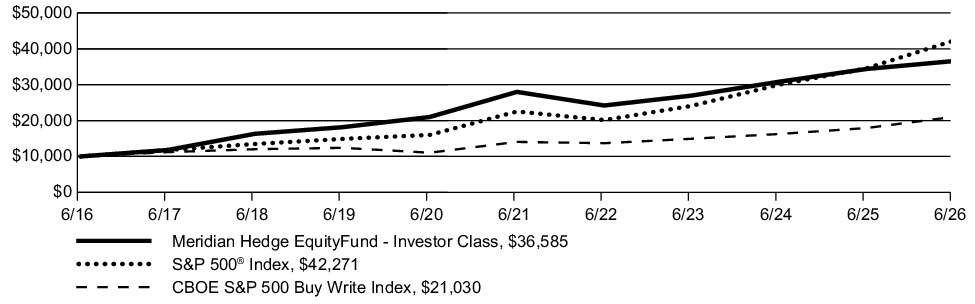
| AVERAGE ANNUAL TOTAL RETURN | 1 Year | 5 Years | 10 Years |
| Meridian Hedged Equity Fund (Investor Class/(MRIEX)) | 6.41% | 5.50% | 13.85% |
| S&P 500® Index | 22.33% | 13.41% | 15.51% |
| CBOE S&P 500 Buy Write Index | 17.34% | 8.39% | 7.72% |
Key Fund Statistics
| Fund net assets | $33,734,189 |
| Total number of portfolio holdings | 87 |
| Total advisory fees paid | $318,783 |
| Portfolio turnover rate as of the end of the reporting period | 36% |
Top Ten Holdings (1)
| Crowdstrike Holdings, Inc. Class A | 8.6% |
| DraftKings, Inc. Class A | 5.0% |
| Aurora Innovation, Inc. | 4.8% |
| Clear Secure, Inc. Class A | 4.7% |
| Electronic Arts, Inc. | 4.3% |
| Brookfield Asset Management Ltd. Class A(Canada) | 3.7% |
| FedEx Corp. | 3.5% |
| D.R. Horton, Inc. | 3.4% |
| Fiserv, Inc. | 3.1% |
| Amazon.com, Inc. | 2.9% |
Sector Allocation (1)
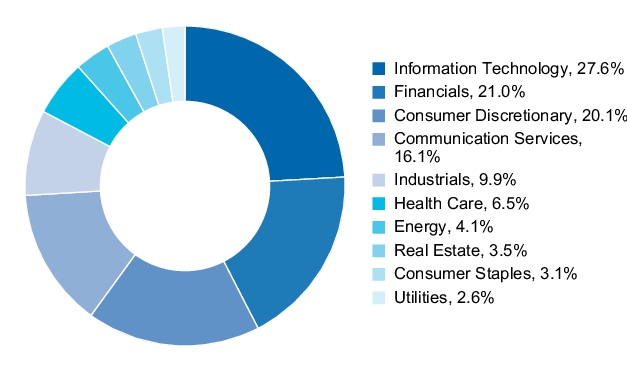
(1) Figures are reported as a percentage of net assets.
Top Ten Holdings (1)
| Crowdstrike Holdings, Inc. Class A | 8.6% |
| DraftKings, Inc. Class A | 5.0% |
| Aurora Innovation, Inc. | 4.8% |
| Clear Secure, Inc. Class A | 4.7% |
| Electronic Arts, Inc. | 4.3% |
| Brookfield Asset Management Ltd. Class A(Canada) | 3.7% |
| FedEx Corp. | 3.5% |
| D.R. Horton, Inc. | 3.4% |
| Fiserv, Inc. | 3.1% |
| Amazon.com, Inc. | 2.9% |
(1) Figures are reported as a percentage of net assets.
What were the Fund costs for the last year?
(Based on a hypothetical $10,000 investment)
| Fund | Costs of a $10,000 investment | Costs paid as a percentage of a $10,000 investment |
| Meridian Hedged Equity Fund (Class C) |
$231 | 2.25% |
What drove fund performance during the past 12 months?
- The S&P 500 Index returned 22% over the trailing twelve months, while the covered call index (CBOE S&P 500 BuyWrite Index) returned 17% over the same period.
- Equity gains were driven by resilient earnings, continued AI-related capital spending, and improving confidence that the Iran-related energy shock would not derail the AI expansion. Still, June's volatility underscored how sensitive crowded AI beneficiaries have become to valuation, guidance, interest rates, and capital-markets supply.
- At period end, approximately 31% of the portfolio was unhedged, reflecting the Fund's primary objective of long-term capital growth.
- The balance of the Fund is invested in companies with covered call options written against them — a strategy designed to balance the capital growth potential of the underlying holdings with the downside protection provided by option premium income.
- This approach allows our fundamental thesis on individual holdings to play out while generating income and providing a measure of downside protection.
- Positive contributors to performance included select names in the consumer discretionary, healthcare, and financial sectors.
- Conversely, select holdings in information technology and communication services detracted from relative performance.
How has the Fund historically performed?
GROWTH OF $10,000
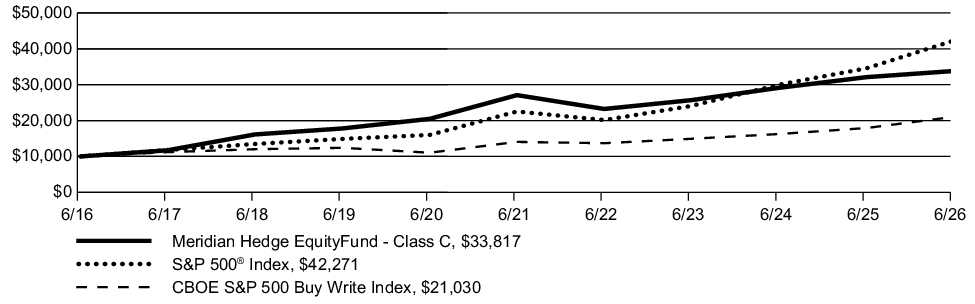
| AVERAGE ANNUAL TOTAL RETURN | 1 Year | 5 Years | 10 Years |
| Meridian Hedged Equity Fund (Class C/(MRCEX)) | 5.35% | 4.53% | 12.96% |
| S&P 500® Index | 22.33% | 13.41% | 15.51% |
| CBOE S&P 500 Buy Write Index | 17.34% | 8.39% | 7.72% |
Key Fund Statistics
| Fund net assets | $33,734,189 |
| Total number of portfolio holdings | 87 |
| Total advisory fees paid | $318,783 |
| Portfolio turnover rate as of the end of the reporting period | 36% |
Top Ten Holdings (1)
| Crowdstrike Holdings, Inc. Class A | 8.6% |
| DraftKings, Inc. Class A | 5.0% |
| Aurora Innovation, Inc. | 4.8% |
| Clear Secure, Inc. Class A | 4.7% |
| Electronic Arts, Inc. | 4.3% |
| Brookfield Asset Management Ltd. Class A(Canada) | 3.7% |
| FedEx Corp. | 3.5% |
| D.R. Horton, Inc. | 3.4% |
| Fiserv, Inc. | 3.1% |
| Amazon.com, Inc. | 2.9% |
Sector Allocation (1)
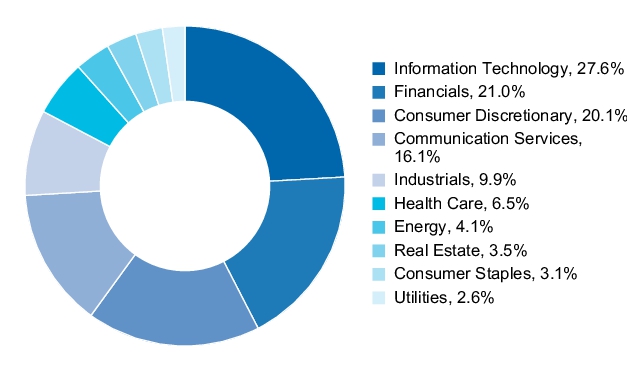
(1) Figures are reported as a percentage of net assets.
Top Ten Holdings (1)
| Crowdstrike Holdings, Inc. Class A | 8.6% |
| DraftKings, Inc. Class A | 5.0% |
| Aurora Innovation, Inc. | 4.8% |
| Clear Secure, Inc. Class A | 4.7% |
| Electronic Arts, Inc. | 4.3% |
| Brookfield Asset Management Ltd. Class A(Canada) | 3.7% |
| FedEx Corp. | 3.5% |
| D.R. Horton, Inc. | 3.4% |
| Fiserv, Inc. | 3.1% |
| Amazon.com, Inc. | 2.9% |
(1) Figures are reported as a percentage of net assets.
What were the Fund costs for the last year?
(Based on a hypothetical $10,000 investment)
| Fund | Costs of a $10,000 investment | Costs paid as a percentage of a $10,000 investment |
| Meridian Hedged Equity Fund (Class A) |
$155 | 1.50% |
What drove fund performance during the past 12 months?
- The S&P 500 Index returned 22% over the trailing twelve months, while the covered call index (CBOE S&P 500 BuyWrite Index) returned 17% over the same period.
- Equity gains were driven by resilient earnings, continued AI-related capital spending, and improving confidence that the Iran-related energy shock would not derail the AI expansion. Still, June's volatility underscored how sensitive crowded AI beneficiaries have become to valuation, guidance, interest rates, and capital-markets supply.
- At period end, approximately 31% of the portfolio was unhedged, reflecting the Fund's primary objective of long-term capital growth.
- The balance of the Fund is invested in companies with covered call options written against them — a strategy designed to balance the capital growth potential of the underlying holdings with the downside protection provided by option premium income.
- This approach allows our fundamental thesis on individual holdings to play out while generating income and providing a measure of downside protection.
- Positive contributors to performance included select names in the consumer discretionary, healthcare, and financial sectors.
- Conversely, select holdings in information technology and communication services detracted from relative performance.
How has the Fund historically performed?
GROWTH OF $10,000
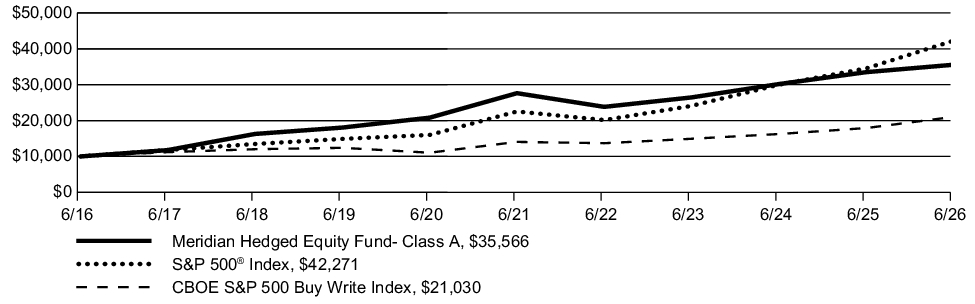
| AVERAGE ANNUAL TOTAL RETURN | 1 Year | 5 Years | 10 Years |
| Meridian Hedged Equity Fund (Class A/(MRAEX)) | 6.16% | 5.17% | 13.53% |
| Meridian Hedged Equity Fund (Class A/(MRAEX)) (1) | 0.06% | 3.93% | 12.86% |
| S&P 500® Index | 22.33% | 13.41% | 15.51% |
| CBOE S&P 500 Buy Write Index | 17.34% | 8.39% | 7.72% |
Key Fund Statistics
| Fund net assets | $33,734,189 |
| Total number of portfolio holdings | 87 |
| Total advisory fees paid | $318,783 |
| Portfolio turnover rate as of the end of the reporting period | 36% |
Top Ten Holdings (1)
| Crowdstrike Holdings, Inc. Class A | 8.6% |
| DraftKings, Inc. Class A | 5.0% |
| Aurora Innovation, Inc. | 4.8% |
| Clear Secure, Inc. Class A | 4.7% |
| Electronic Arts, Inc. | 4.3% |
| Brookfield Asset Management Ltd. Class A(Canada) | 3.7% |
| FedEx Corp. | 3.5% |
| D.R. Horton, Inc. | 3.4% |
| Fiserv, Inc. | 3.1% |
| Amazon.com, Inc. | 2.9% |
Sector Allocation (1)
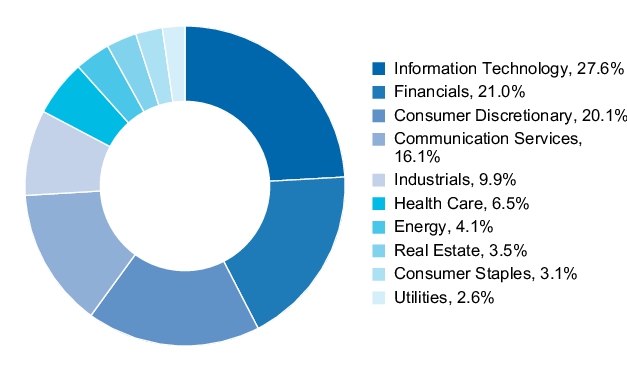
(1) Figures are reported as a percentage of net assets.
Top Ten Holdings (1)
| Crowdstrike Holdings, Inc. Class A | 8.6% |
| DraftKings, Inc. Class A | 5.0% |
| Aurora Innovation, Inc. | 4.8% |
| Clear Secure, Inc. Class A | 4.7% |
| Electronic Arts, Inc. | 4.3% |
| Brookfield Asset Management Ltd. Class A(Canada) | 3.7% |
| FedEx Corp. | 3.5% |
| D.R. Horton, Inc. | 3.4% |
| Fiserv, Inc. | 3.1% |
| Amazon.com, Inc. | 2.9% |
(1) Figures are reported as a percentage of net assets.
What were the Fund costs for the last year?
(Based on a hypothetical $10,000 investment)
| Fund | Costs of a $10,000 investment | Costs paid as a percentage of a $10,000 investment |
| Meridian Hedged Equity Fund (Legacy Class) |
$129 | 1.25% |
What drove fund performance during the past 12 months?
- The S&P 500 Index returned 22% over the trailing twelve months, while the covered call index (CBOE S&P 500 BuyWrite Index) returned 17% over the same period.
- Equity gains were driven by resilient earnings, continued AI-related capital spending, and improving confidence that the Iran-related energy shock would not derail the AI expansion. Still, June's volatility underscored how sensitive crowded AI beneficiaries have become to valuation, guidance, interest rates, and capital-markets supply.
- At period end, approximately 31% of the portfolio was unhedged, reflecting the Fund's primary objective of long-term capital growth.
- The balance of the Fund is invested in companies with covered call options written against them — a strategy designed to balance the capital growth potential of the underlying holdings with the downside protection provided by option premium income.
- This approach allows our fundamental thesis on individual holdings to play out while generating income and providing a measure of downside protection.
- Positive contributors to performance included select names in the consumer discretionary, healthcare, and financial sectors.
- Conversely, select holdings in information technology and communication services detracted from relative performance.
How has the Fund historically performed?
GROWTH OF $10,000
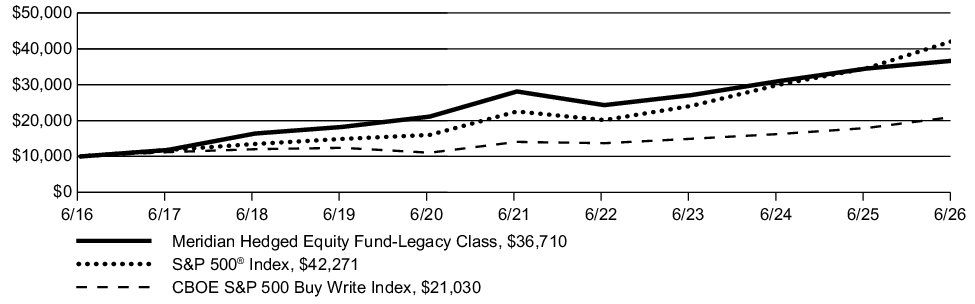
| AVERAGE ANNUAL TOTAL RETURN | 1 Year | 5 Years | 10 Years |
| Meridian Hedged Equity Fund (Legacy Class/(MEIFX)) | 6.41% | 5.48% | 13.89% |
| S&P 500® Index | 22.33% | 13.41% | 15.51% |
| CBOE S&P 500 Buy Write Index | 17.34% | 8.39% | 7.72% |
Key Fund Statistics
| Fund net assets | $33,734,189 |
| Total number of portfolio holdings | 87 |
| Total advisory fees paid | $318,783 |
| Portfolio turnover rate as of the end of the reporting period | 36% |
Top Ten Holdings (1)
| Crowdstrike Holdings, Inc. Class A | 8.6% |
| DraftKings, Inc. Class A | 5.0% |
| Aurora Innovation, Inc. | 4.8% |
| Clear Secure, Inc. Class A | 4.7% |
| Electronic Arts, Inc. | 4.3% |
| Brookfield Asset Management Ltd. Class A(Canada) | 3.7% |
| FedEx Corp. | 3.5% |
| D.R. Horton, Inc. | 3.4% |
| Fiserv, Inc. | 3.1% |
| Amazon.com, Inc. | 2.9% |
Sector Allocation (1)
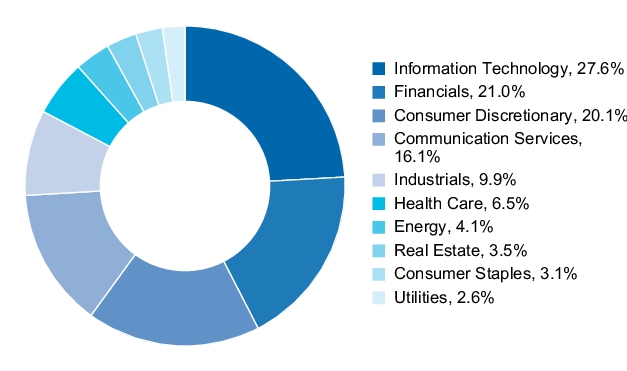
(1) Figures are reported as a percentage of net assets.
Top Ten Holdings (1)
| Crowdstrike Holdings, Inc. Class A | 8.6% |
| DraftKings, Inc. Class A | 5.0% |
| Aurora Innovation, Inc. | 4.8% |
| Clear Secure, Inc. Class A | 4.7% |
| Electronic Arts, Inc. | 4.3% |
| Brookfield Asset Management Ltd. Class A(Canada) | 3.7% |
| FedEx Corp. | 3.5% |
| D.R. Horton, Inc. | 3.4% |
| Fiserv, Inc. | 3.1% |
| Amazon.com, Inc. | 2.9% |
(1) Figures are reported as a percentage of net assets.
What were the Fund costs for the last year?
(Based on a hypothetical $10,000 investment)
| Fund | Costs of a $10,000 investment | Costs paid as a percentage of a $10,000 investment |
| Meridian Growth Fund (Legacy Class) |
$100 | 0.96% |
What drove fund performance during the past 12 months?
- U.S. equity markets navigated a twelve-month period shaped by competing forces: optimism surrounding monetary easing and enthusiasm for AI-related investment on one hand, and escalating trade policy uncertainty and the outbreak—and subsequent de-escalation—of military conflict with Iran on the other.
- SMID cap growth stocks delivered a 33% return over the period, outperforming large cap growth stocks, which returned 18%.
- The investment strategy's emphasis on durability was evident during the period, as the strategy outperformed on 12 of the 15 days on which the index declined 2% or more.
- Our investment process seeks to focus on high quality companies with recurring revenue and what we believe to be sustainable competitive advantages.
- The period saw pronounced relative outperformance by lower-quality stocks—the highest-beta quintile of the index outperformed the lowest by more than 70 percentage points, and companies with no earnings, and in many cases no revenue, meaningfully outpaced the broader index—which ran counter to the Fund's quality bias and created a significant headwind to relative results.
- From a sector perspective, stock selection was positive in the health care, communication services, and energy sectors.
- Conversely, negative stock selection in the information technology, consumer discretionary, and industrials sectors detracted from relative returns.
How has the Fund historically performed?
GROWTH OF $10,000
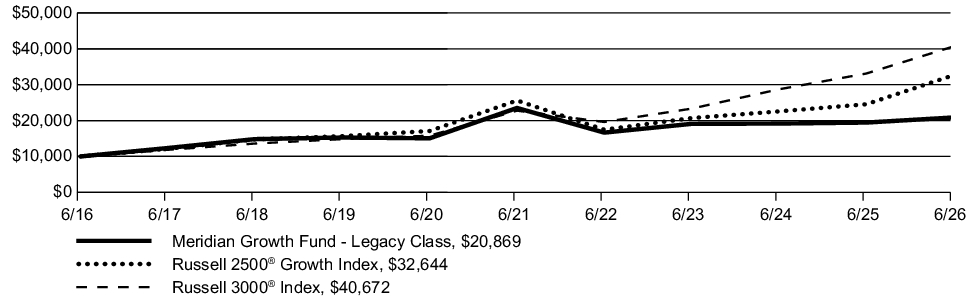
| AVERAGE ANNUAL TOTAL RETURN | 1 Year | 5 Years | 10 Years |
| Meridian Growth Fund (Legacy Class/(MERDX)) | 7.32% | (2.36)% | 7.63% |
| Russell 2500® Growth Index | 32.94% | 4.98% | 12.56% |
| Russell 3000® Index | 22.82% | 12.31% | 15.06% |
Key Fund Statistics
| Fund net assets | $530,880,448 |
| Total number of portfolio holdings | 92 |
| Total advisory fees paid | $4,786,924 |
| Portfolio turnover rate as of the end of the reporting period | 49% |
Top Ten Holdings (1)
| RB Global, Inc. (Canada) | 2.6% |
| Curtiss-Wright Corp. | 2.5% |
| Axogen, Inc. | 2.5% |
| Federal Signal Corp. | 2.4% |
| Hinge Health, Inc. Class A | 2.3% |
| Definium Therapeutics, Inc. | 2.3% |
| Veracyte, Inc. | 2.2% |
| StandardAero, Inc. | 2.1% |
| Turning Point Brands, Inc. | 2.1% |
| Generac Holdings, Inc. | 2.1% |
Sector Allocation (1)
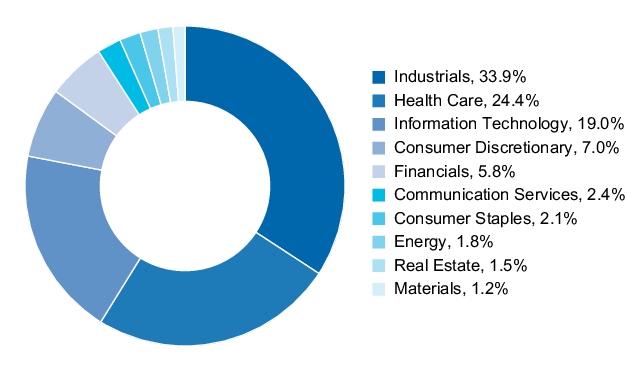
(1) Figures are reported as a percentage of net assets.
Top Ten Holdings (1)
| RB Global, Inc. (Canada) | 2.6% |
| Curtiss-Wright Corp. | 2.5% |
| Axogen, Inc. | 2.5% |
| Federal Signal Corp. | 2.4% |
| Hinge Health, Inc. Class A | 2.3% |
| Definium Therapeutics, Inc. | 2.3% |
| Veracyte, Inc. | 2.2% |
| StandardAero, Inc. | 2.1% |
| Turning Point Brands, Inc. | 2.1% |
| Generac Holdings, Inc. | 2.1% |
(1) Figures are reported as a percentage of net assets.
What were the Fund costs for the last year?
(Based on a hypothetical $10,000 investment)
| Fund | Costs of a $10,000 investment | Costs paid as a percentage of a $10,000 investment |
| Meridian Growth Fund (Institutional Class) |
$93 | 0.90% |
What drove fund performance during the past 12 months?
- U.S. equity markets navigated a twelve-month period shaped by competing forces: optimism surrounding monetary easing and enthusiasm for AI-related investment on one hand, and escalating trade policy uncertainty and the outbreak—and subsequent de-escalation—of military conflict with Iran on the other.
- SMID cap growth stocks delivered a 33% return over the period, outperforming large cap growth stocks, which returned 18%.
- The investment strategy's emphasis on durability was evident during the period, as the strategy outperformed on 12 of the 15 days on which the index declined 2% or more.
- Our investment process seeks to focus on high quality companies with recurring revenue and what we believe to be sustainable competitive advantages.
- The period saw pronounced relative outperformance by lower-quality stocks—the highest-beta quintile of the index outperformed the lowest by more than 70 percentage points, and companies with no earnings, and in many cases no revenue, meaningfully outpaced the broader index—which ran counter to the Fund's quality bias and created a significant headwind to relative results.
- From a sector perspective, stock selection was positive in the health care, communication services, and energy sectors.
- Conversely, negative stock selection in the information technology, consumer discretionary, and industrials sectors detracted from relative returns.
How has the Fund historically performed?
GROWTH OF $1,000,000
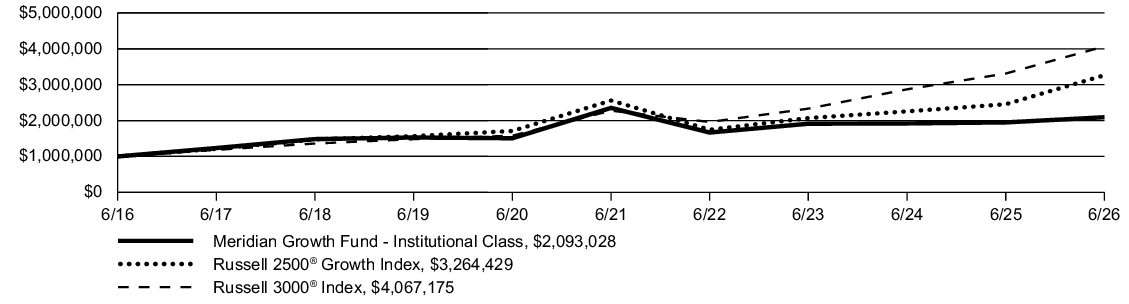
| AVERAGE ANNUAL TOTAL RETURN | 1 Year | 5 Years | 10 Years |
| Meridian Growth Fund (Institutional Class/(MRRGX)) | 7.40% | (2.32)% | 7.67% |
| Russell 2500® Growth Index | 32.94% | 4.98% | 12.56% |
| Russell 3000® Index | 22.82% | 12.31% | 15.06% |
Key Fund Statistics
| Fund net assets | $530,880,448 |
| Total number of portfolio holdings | 92 |
| Total advisory fees paid | $4,786,924 |
| Portfolio turnover rate as of the end of the reporting period | 49% |
Top Ten Holdings (1)
| RB Global, Inc. (Canada) | 2.6% |
| Curtiss-Wright Corp. | 2.5% |
| Axogen, Inc. | 2.5% |
| Federal Signal Corp. | 2.4% |
| Hinge Health, Inc. Class A | 2.3% |
| Definium Therapeutics, Inc. | 2.3% |
| Veracyte, Inc. | 2.2% |
| StandardAero, Inc. | 2.1% |
| Turning Point Brands, Inc. | 2.1% |
| Generac Holdings, Inc. | 2.1% |
Sector Allocation (1)
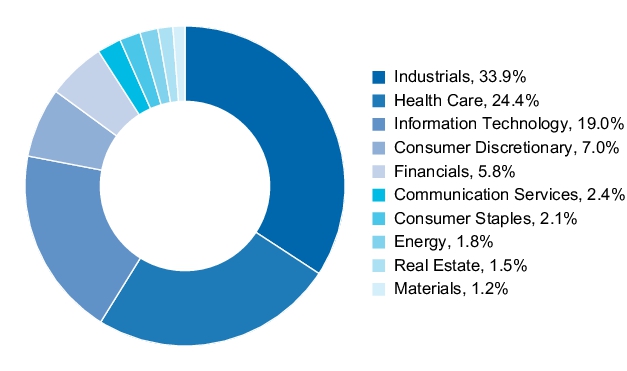
(1) Figures are reported as a percentage of net assets.
Top Ten Holdings (1)
| RB Global, Inc. (Canada) | 2.6% |
| Curtiss-Wright Corp. | 2.5% |
| Axogen, Inc. | 2.5% |
| Federal Signal Corp. | 2.4% |
| Hinge Health, Inc. Class A | 2.3% |
| Definium Therapeutics, Inc. | 2.3% |
| Veracyte, Inc. | 2.2% |
| StandardAero, Inc. | 2.1% |
| Turning Point Brands, Inc. | 2.1% |
| Generac Holdings, Inc. | 2.1% |
(1) Figures are reported as a percentage of net assets.
What were the Fund costs for the last year?
(Based on a hypothetical $10,000 investment)
| Fund | Costs of a $10,000 investment | Costs paid as a percentage of a $10,000 investment |
| Meridian Growth Fund (Class A) |
$129 | 1.25% |
What drove fund performance during the past 12 months?
- U.S. equity markets navigated a twelve-month period shaped by competing forces: optimism surrounding monetary easing and enthusiasm for AI-related investment on one hand, and escalating trade policy uncertainty and the outbreak—and subsequent de-escalation—of military conflict with Iran on the other.
- SMID cap growth stocks delivered a 33% return over the period, outperforming large cap growth stocks, which returned 18%.
- The investment strategy's emphasis on durability was evident during the period, as the strategy outperformed on 12 of the 15 days on which the index declined 2% or more.
- Our investment process seeks to focus on high quality companies with recurring revenue and what we believe to be sustainable competitive advantages.
- The period saw pronounced relative outperformance by lower-quality stocks—the highest-beta quintile of the index outperformed the lowest by more than 70 percentage points, and companies with no earnings, and in many cases no revenue, meaningfully outpaced the broader index—which ran counter to the Fund's quality bias and created a significant headwind to relative results.
- From a sector perspective, stock selection was positive in the health care, communication services, and energy sectors.
- Conversely, negative stock selection in the information technology, consumer discretionary, and industrials sectors detracted from relative returns.
How has the Fund historically performed?
GROWTH OF $10,000
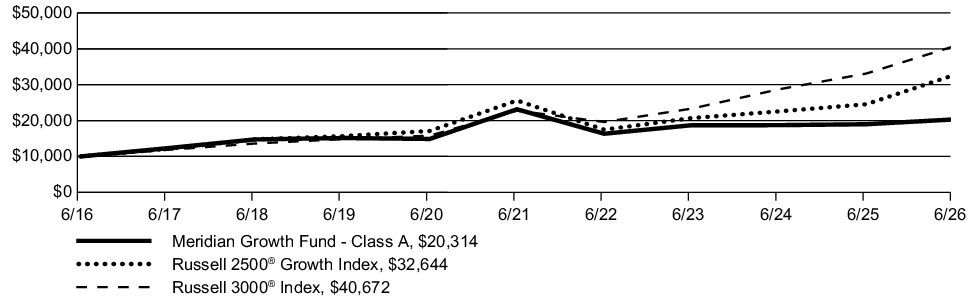
| AVERAGE ANNUAL TOTAL RETURN | 1 Year | 5 Years | 10 Years |
| Meridian Growth Fund (Class A/(MRAGX)) | 7.01% | (2.58)% | 7.34% |
| Meridian Growth Fund (Class A/(MRAGX)) (1) | 0.87% | (3.73)% | 6.71% |
| Russell 2500® Growth Index | 32.94% | 4.98% | 12.56% |
| Russell 3000® Index | 22.82% | 12.31% | 15.06% |
| (1) |
Assuming maximum sales charge, if any. Class A Shares are subject to a maximum initial sales charge of 5.75% |
Key Fund Statistics
| Fund net assets | $530,880,448 |
| Total number of portfolio holdings | 92 |
| Total advisory fees paid | $4,786,924 |
| Portfolio turnover rate as of the end of the reporting period | 49% |
Top Ten Holdings (1)
| RB Global, Inc. (Canada) | 2.6% |
| Curtiss-Wright Corp. | 2.5% |
| Axogen, Inc. | 2.5% |
| Federal Signal Corp. | 2.4% |
| Hinge Health, Inc. Class A | 2.3% |
| Definium Therapeutics, Inc. | 2.3% |
| Veracyte, Inc. | 2.2% |
| StandardAero, Inc. | 2.1% |
| Turning Point Brands, Inc. | 2.1% |
| Generac Holdings, Inc. | 2.1% |
Sector Allocation (1)
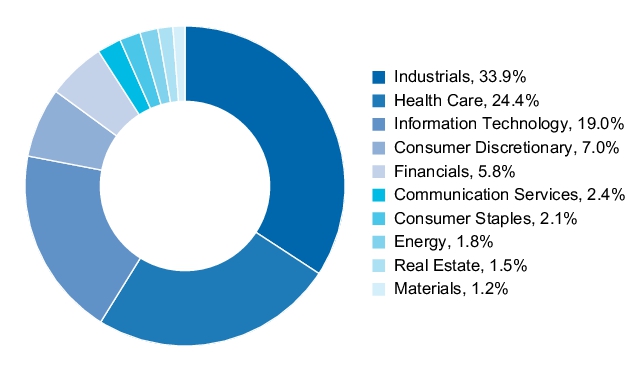
(1) Figures are reported as a percentage of net assets.
Top Ten Holdings (1)
| RB Global, Inc. (Canada) | 2.6% |
| Curtiss-Wright Corp. | 2.5% |
| Axogen, Inc. | 2.5% |
| Federal Signal Corp. | 2.4% |
| Hinge Health, Inc. Class A | 2.3% |
| Definium Therapeutics, Inc. | 2.3% |
| Veracyte, Inc. | 2.2% |
| StandardAero, Inc. | 2.1% |
| Turning Point Brands, Inc. | 2.1% |
| Generac Holdings, Inc. | 2.1% |
(1) Figures are reported as a percentage of net assets.
What were the Fund costs for the last year?
(Based on a hypothetical $10,000 investment)
| Fund | Costs of a $10,000 investment | Costs paid as a percentage of a $10,000 investment |
| Meridian Growth Fund (Class C) |
$202 | 1.96% |
What drove fund performance during the past 12 months?
- U.S. equity markets navigated a twelve-month period shaped by competing forces: optimism surrounding monetary easing and enthusiasm for AI-related investment on one hand, and escalating trade policy uncertainty and the outbreak—and subsequent de-escalation—of military conflict with Iran on the other.
- SMID cap growth stocks delivered a 33% return over the period, outperforming large cap growth stocks, which returned 18%.
- The investment strategy's emphasis on durability was evident during the period, as the strategy outperformed on 12 of the 15 days on which the index declined 2% or more.
- Our investment process seeks to focus on high quality companies with recurring revenue and what we believe to be sustainable competitive advantages.
- The period saw pronounced relative outperformance by lower-quality stocks—the highest-beta quintile of the index outperformed the lowest by more than 70 percentage points, and companies with no earnings, and in many cases no revenue, meaningfully outpaced the broader index—which ran counter to the Fund's quality bias and created a significant headwind to relative results.
- From a sector perspective, stock selection was positive in the health care, communication services, and energy sectors.
- Conversely, negative stock selection in the information technology, consumer discretionary, and industrials sectors detracted from relative returns.
How has the Fund historically performed?
GROWTH OF $10,000
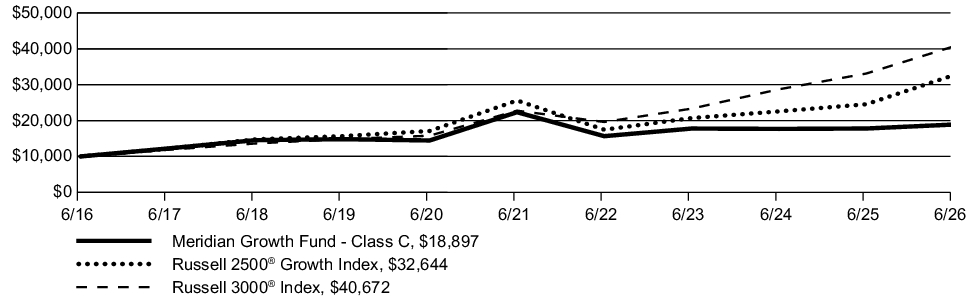
| AVERAGE ANNUAL TOTAL RETURN | 1 Year | 5 Years | 10 Years |
| Meridian Growth Fund (Class C/(MRCGX)) | 6.23% | (3.29)% | 6.57% |
| Russell 2500® Growth Index | 32.94% | 4.98% | 12.56% |
| Russell 3000® Index | 22.82% | 12.31% | 15.06% |
Key Fund Statistics
| Fund net assets | $530,880,448 |
| Total number of portfolio holdings | 92 |
| Total advisory fees paid | $4,786,924 |
| Portfolio turnover rate as of the end of the reporting period | 49% |
Top Ten Holdings (1)
| RB Global, Inc. (Canada) | 2.6% |
| Curtiss-Wright Corp. | 2.5% |
| Axogen, Inc. | 2.5% |
| Federal Signal Corp. | 2.4% |
| Hinge Health, Inc. Class A | 2.3% |
| Definium Therapeutics, Inc. | 2.3% |
| Veracyte, Inc. | 2.2% |
| StandardAero, Inc. | 2.1% |
| Turning Point Brands, Inc. | 2.1% |
| Generac Holdings, Inc. | 2.1% |
Sector Allocation (1)
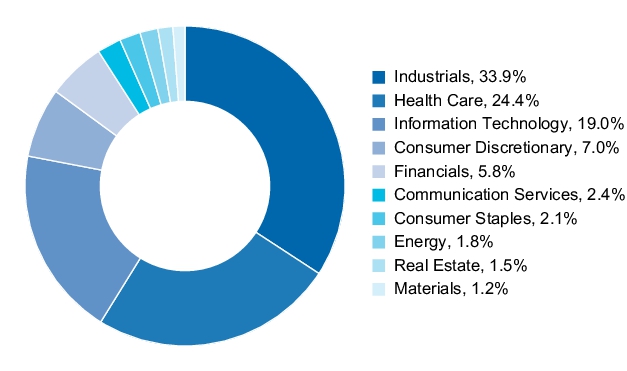
(1) Figures are reported as a percentage of net assets.
Top Ten Holdings (1)
| RB Global, Inc. (Canada) | 2.6% |
| Curtiss-Wright Corp. | 2.5% |
| Axogen, Inc. | 2.5% |
| Federal Signal Corp. | 2.4% |
| Hinge Health, Inc. Class A | 2.3% |
| Definium Therapeutics, Inc. | 2.3% |
| Veracyte, Inc. | 2.2% |
| StandardAero, Inc. | 2.1% |
| Turning Point Brands, Inc. | 2.1% |
| Generac Holdings, Inc. | 2.1% |
(1) Figures are reported as a percentage of net assets.
What were the Fund costs for the last year?
(Based on a hypothetical $10,000 investment)
| Fund | Costs of a $10,000 investment | Costs paid as a percentage of a $10,000 investment |
| Meridian Growth Fund (Investor Class) |
$107 | 1.03% |
What drove fund performance during the past 12 months?
- U.S. equity markets navigated a twelve-month period shaped by competing forces: optimism surrounding monetary easing and enthusiasm for AI-related investment on one hand, and escalating trade policy uncertainty and the outbreak—and subsequent de-escalation—of military conflict with Iran on the other.
- SMID cap growth stocks delivered a 33% return over the period, outperforming large cap growth stocks, which returned 18%.
- The investment strategy's emphasis on durability was evident during the period, as the strategy outperformed on 12 of the 15 days on which the index declined 2% or more.
- Our investment process seeks to focus on high quality companies with recurring revenue and what we believe to be sustainable competitive advantages.
- The period saw pronounced relative outperformance by lower-quality stocks—the highest-beta quintile of the index outperformed the lowest by more than 70 percentage points, and companies with no earnings, and in many cases no revenue, meaningfully outpaced the broader index—which ran counter to the Fund's quality bias and created a significant headwind to relative results.
- From a sector perspective, stock selection was positive in the health care, communication services, and energy sectors.
- Conversely, negative stock selection in the information technology, consumer discretionary, and industrials sectors detracted from relative returns.
How has the Fund historically performed?
GROWTH OF $10,000
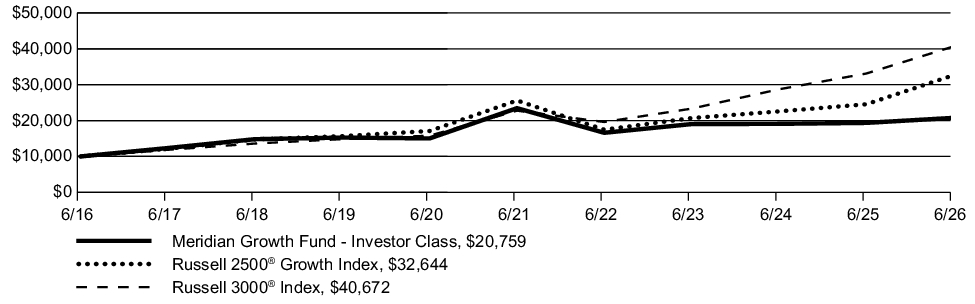
| AVERAGE ANNUAL TOTAL RETURN | 1 Year | 5 Years | 10 Years |
| Meridian Growth Fund (Investor Class/(MRIGX)) | 7.24% | (2.42)% | 7.58% |
| Russell 2500® Growth Index | 32.94% | 4.98% | 12.56% |
| Russell 3000® Index | 22.82% | 12.31% | 15.06% |
Key Fund Statistics
| Fund net assets | $530,880,448 |
| Total number of portfolio holdings | 92 |
| Total advisory fees paid | $4,786,924 |
| Portfolio turnover rate as of the end of the reporting period | 49% |
Top Ten Holdings (1)
| RB Global, Inc. (Canada) | 2.6% |
| Curtiss-Wright Corp. | 2.5% |
| Axogen, Inc. | 2.5% |
| Federal Signal Corp. | 2.4% |
| Hinge Health, Inc. Class A | 2.3% |
| Definium Therapeutics, Inc. | 2.3% |
| Veracyte, Inc. | 2.2% |
| StandardAero, Inc. | 2.1% |
| Turning Point Brands, Inc. | 2.1% |
| Generac Holdings, Inc. | 2.1% |
Sector Allocation (1)
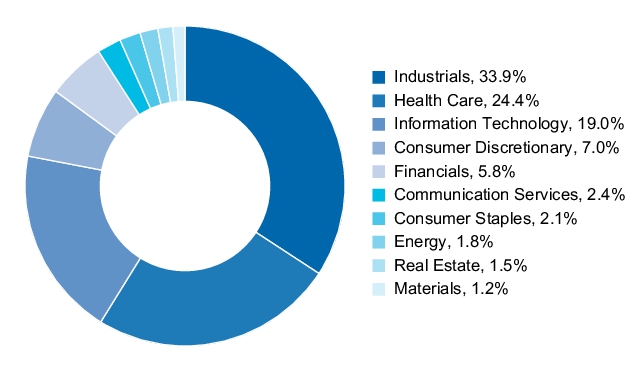
(1) Figures are reported as a percentage of net assets.
Top Ten Holdings (1)
| RB Global, Inc. (Canada) | 2.6% |
| Curtiss-Wright Corp. | 2.5% |
| Axogen, Inc. | 2.5% |
| Federal Signal Corp. | 2.4% |
| Hinge Health, Inc. Class A | 2.3% |
| Definium Therapeutics, Inc. | 2.3% |
| Veracyte, Inc. | 2.2% |
| StandardAero, Inc. | 2.1% |
| Turning Point Brands, Inc. | 2.1% |
| Generac Holdings, Inc. | 2.1% |
(1) Figures are reported as a percentage of net assets.
What were the Fund costs for the last year?
(Based on a hypothetical $10,000 investment)
| Fund | Costs of a $10,000 investment | Costs paid as a percentage of a $10,000 investment |
| Meridian Contrarian Fund (Investor Class) |
$141 | 1.23% |
What drove fund performance during the past 12 months?
- U.S. equity markets navigated a period shaped by competing forces over the 12-month period ended June 30, 2026: optimism surrounding a resilient economy along with the AI boom and caution driven by geopolitical conflict, the specter of renewed inflation and valuation concerns.
- Small cap core stocks delivered a strong 36.7% return over the period, while small cap value stocks returned a remarkable 38.5%.
- As such, during the period we continued to employ a fundamental research-driven process that includes screening for companies that have multiple quarters of year-over-year earnings declines; exploring the reason for the declines; and singling out the companies we believe are poised for an earnings rebound via a cohesive turnaround plan, a new management team, or through improvements or changes to the business.
- From a sector perspective, positive stock selection in the materials and technology sectors aided returns.
- Conversely, negative stock selection in the healthcare and industrials sectors were headwinds to relative performance.
How has the Fund historically performed?
GROWTH OF $10,000
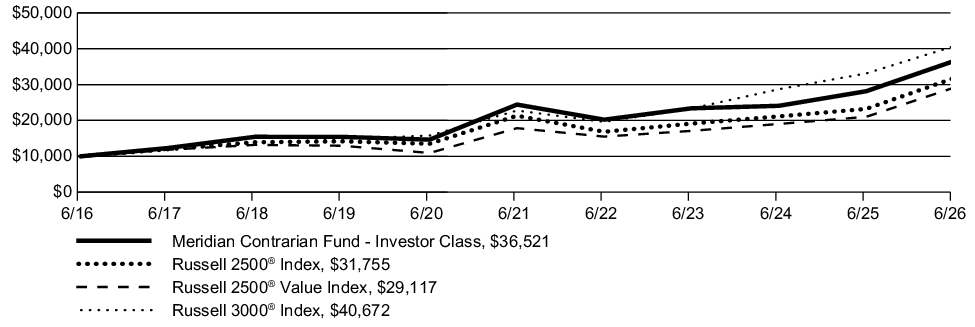
| AVERAGE ANNUAL TOTAL RETURN | 1 Year | 5 Years | 10 Years |
| Meridian Contrarian Fund (Investor Class/(MFCIX)) | 29.73% | 8.38% | 13.83% |
| Russell 2500® Index | 36.72% | 8.30% | 12.25% |
| Russell 2500® Value Index | 38.54% | 10.28% | 11.28% |
| Russell 3000® Index | 22.82% | 12.31% | 15.06% |
Key Fund Statistics
| Fund net assets | $679,391,632 |
| Total number of portfolio holdings | 79 |
| Total advisory fees paid | $6,117,518 |
| Portfolio turnover rate as of the end of the reporting period | 53% |
Top Ten Holdings (1)
| Texas Capital Bancshares, Inc. | 2.6% |
| Envista Holdings Corp. | 2.6% |
| Regal Rexnord Corp. | 2.4% |
| First Citizens BancShares, Inc. Class A | 2.4% |
| VSE Corp. | 2.1% |
| PDF Solutions, Inc. | 2.1% |
| BlackBerry Ltd. (Canada) | 2.1% |
| Dollar Tree, Inc. | 2.0% |
| Adeia, Inc. | 1.9% |
| Caesars Entertainment, Inc. | 1.9% |
Sector Allocation (1)
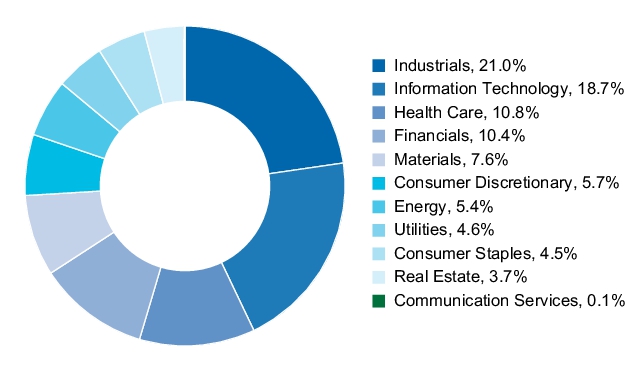
(1) Figures are reported as a percentage of net assets.
Top Ten Holdings (1)
| Texas Capital Bancshares, Inc. | 2.6% |
| Envista Holdings Corp. | 2.6% |
| Regal Rexnord Corp. | 2.4% |
| First Citizens BancShares, Inc. Class A | 2.4% |
| VSE Corp. | 2.1% |
| PDF Solutions, Inc. | 2.1% |
| BlackBerry Ltd. (Canada) | 2.1% |
| Dollar Tree, Inc. | 2.0% |
| Adeia, Inc. | 1.9% |
| Caesars Entertainment, Inc. | 1.9% |
(1) Figures are reported as a percentage of net assets.
What were the Fund costs for the last year?
(Based on a hypothetical $10,000 investment)
| Fund | Costs of a $10,000 investment | Costs paid as a percentage of a $10,000 investment |
| Meridian Contrarian Fund (Class C) |
$255 | 2.23% |
What drove fund performance during the past 12 months?
- U.S. equity markets navigated a period shaped by competing forces over the 12-month period ended June 30, 2026: optimism surrounding a resilient economy along with the AI boom and caution driven by geopolitical conflict, the specter of renewed inflation and valuation concerns.
- Small cap core stocks delivered a strong 36.7% return over the period, while small cap value stocks returned a remarkable 38.5%.
- As such, during the period we continued to employ a fundamental research-driven process that includes screening for companies that have multiple quarters of year-over-year earnings declines; exploring the reason for the declines; and singling out the companies we believe are poised for an earnings rebound via a cohesive turnaround plan, a new management team, or through improvements or changes to the business.
- From a sector perspective, positive stock selection in the materials and technology sectors aided returns.
- Conversely, negative stock selection in the healthcare and industrials sectors were headwinds to relative performance.
How has the Fund historically performed?
GROWTH OF $10,000
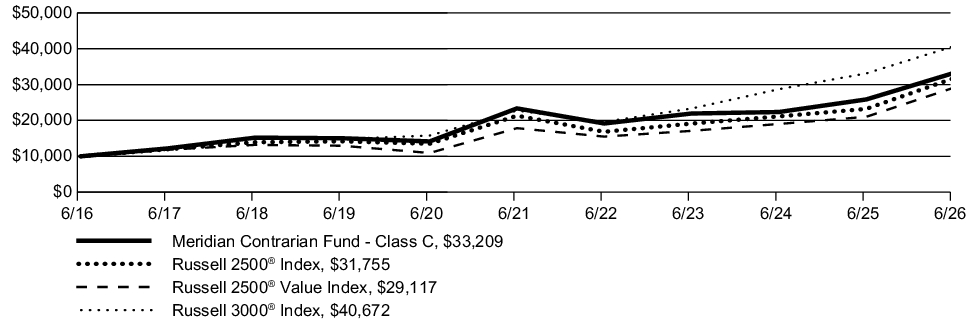
| AVERAGE ANNUAL TOTAL RETURN | 1 Year | 5 Years | 10 Years |
| Meridian Contrarian Fund (Class C/(MFCCX)) | 28.43% | 7.29% | 12.75% |
| Russell 2500® Index | 36.72% | 8.30% | 12.25% |
| Russell 2500® Value Index | 38.54% | 10.28% | 11.28% |
| Russell 3000® Index | 22.82% | 12.31% | 15.06% |
Key Fund Statistics
| Fund net assets | $679,391,632 |
| Total number of portfolio holdings | 79 |
| Total advisory fees paid | $6,117,518 |
| Portfolio turnover rate as of the end of the reporting period | 53% |
Top Ten Holdings (1)
| Texas Capital Bancshares, Inc. | 2.6% |
| Envista Holdings Corp. | 2.6% |
| Regal Rexnord Corp. | 2.4% |
| First Citizens BancShares, Inc. Class A | 2.4% |
| VSE Corp. | 2.1% |
| PDF Solutions, Inc. | 2.1% |
| BlackBerry Ltd. (Canada) | 2.1% |
| Dollar Tree, Inc. | 2.0% |
| Adeia, Inc. | 1.9% |
| Caesars Entertainment, Inc. | 1.9% |
Sector Allocation (1)
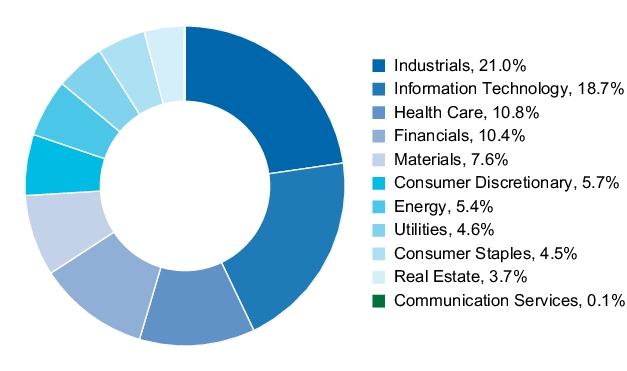
(1) Figures are reported as a percentage of net assets.
Top Ten Holdings (1)
| Texas Capital Bancshares, Inc. | 2.6% |
| Envista Holdings Corp. | 2.6% |
| Regal Rexnord Corp. | 2.4% |
| First Citizens BancShares, Inc. Class A | 2.4% |
| VSE Corp. | 2.1% |
| PDF Solutions, Inc. | 2.1% |
| BlackBerry Ltd. (Canada) | 2.1% |
| Dollar Tree, Inc. | 2.0% |
| Adeia, Inc. | 1.9% |
| Caesars Entertainment, Inc. | 1.9% |
(1) Figures are reported as a percentage of net assets.
What were the Fund costs for the last year?
(Based on a hypothetical $10,000 investment)
| Fund | Costs of a $10,000 investment | Costs paid as a percentage of a $10,000 investment |
| Meridian Contrarian Fund (Class A) |
$170 | 1.48% |
What drove fund performance during the past 12 months?
- U.S. equity markets navigated a period shaped by competing forces over the 12-month period ended June 30, 2026: optimism surrounding a resilient economy along with the AI boom and caution driven by geopolitical conflict, the specter of renewed inflation and valuation concerns.
- Small cap core stocks delivered a strong 36.7% return over the period, while small cap value stocks returned a remarkable 38.5%.
- As such, during the period we continued to employ a fundamental research-driven process that includes screening for companies that have multiple quarters of year-over-year earnings declines; exploring the reason for the declines; and singling out the companies we believe are poised for an earnings rebound via a cohesive turnaround plan, a new management team, or through improvements or changes to the business.
- From a sector perspective, positive stock selection in the materials and technology sectors aided returns.
- Conversely, negative stock selection in the healthcare and industrials sectors were headwinds to relative performance.
How has the Fund historically performed?
GROWTH OF $10,000
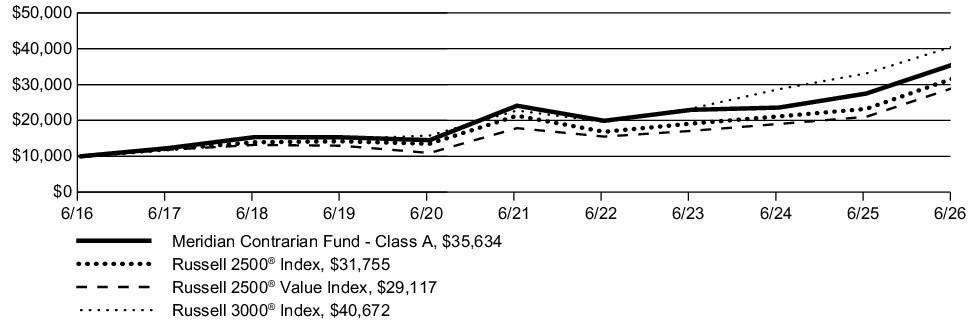
| AVERAGE ANNUAL TOTAL RETURN | 1 Year | 5 Years | 10 Years |
| Meridian Contrarian Fund (Class A/(MFCAX)) | 29.57% | 8.13% | 13.55% |
| Meridian Contrarian Fund (Class A/(MFCAX)) (1) | 22.11% | 6.86% | 12.88% |
| Russell 2500® Index | 36.72% | 8.30% | 12.25% |
| Russell 2500® Value Index | 38.54% | 10.28% | 11.28% |
| Russell 3000® Index | 22.82% | 12.31% | 15.06% |
| (1) |
Assuming maximum sales charge, if any. Class A Shares are subject to a maximum initial sales charge of 5.75% |
Key Fund Statistics
| Fund net assets | $679,391,632 |
| Total number of portfolio holdings | 79 |
| Total advisory fees paid | $6,117,518 |
| Portfolio turnover rate as of the end of the reporting period | 53% |
Top Ten Holdings (1)
| Texas Capital Bancshares, Inc. | 2.6% |
| Envista Holdings Corp. | 2.6% |
| Regal Rexnord Corp. | 2.4% |
| First Citizens BancShares, Inc. Class A | 2.4% |
| VSE Corp. | 2.1% |
| PDF Solutions, Inc. | 2.1% |
| BlackBerry Ltd. (Canada) | 2.1% |
| Dollar Tree, Inc. | 2.0% |
| Adeia, Inc. | 1.9% |
| Caesars Entertainment, Inc. | 1.9% |
Sector Allocation (1)
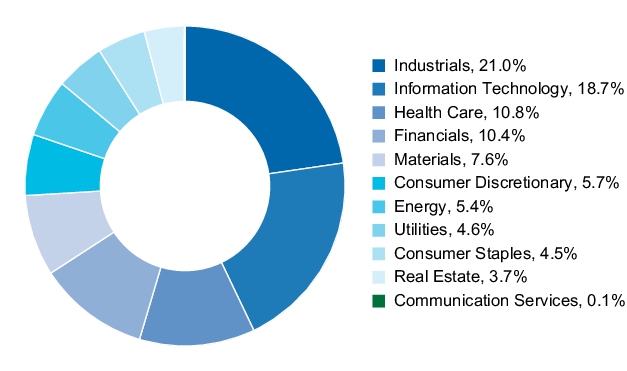
(1) Figures are reported as a percentage of net assets.
Top Ten Holdings (1)
| Texas Capital Bancshares, Inc. | 2.6% |
| Envista Holdings Corp. | 2.6% |
| Regal Rexnord Corp. | 2.4% |
| First Citizens BancShares, Inc. Class A | 2.4% |
| VSE Corp. | 2.1% |
| PDF Solutions, Inc. | 2.1% |
| BlackBerry Ltd. (Canada) | 2.1% |
| Dollar Tree, Inc. | 2.0% |
| Adeia, Inc. | 1.9% |
| Caesars Entertainment, Inc. | 1.9% |
(1) Figures are reported as a percentage of net assets.
What were the Fund costs for the last year?
(Based on a hypothetical $10,000 investment)
| Fund | Costs of a $10,000 investment | Costs paid as a percentage of a $10,000 investment |
| Meridian Contrarian Fund (Legacy Class) |
$134 | 1.17% |
What drove fund performance during the past 12 months?
- U.S. equity markets navigated a period shaped by competing forces over the 12-month period ended June 30, 2026: optimism surrounding a resilient economy along with the AI boom and caution driven by geopolitical conflict, the specter of renewed inflation and valuation concerns.
- Small cap core stocks delivered a strong 36.7% return over the period, while small cap value stocks returned a remarkable 38.5%.
- As such, during the period we continued to employ a fundamental research-driven process that includes screening for companies that have multiple quarters of year-over-year earnings declines; exploring the reason for the declines; and singling out the companies we believe are poised for an earnings rebound via a cohesive turnaround plan, a new management team, or through improvements or changes to the business.
- From a sector perspective, positive stock selection in the materials and technology sectors aided returns.
- Conversely, negative stock selection in the healthcare and industrials sectors were headwinds to relative performance.
How has the Fund historically performed?
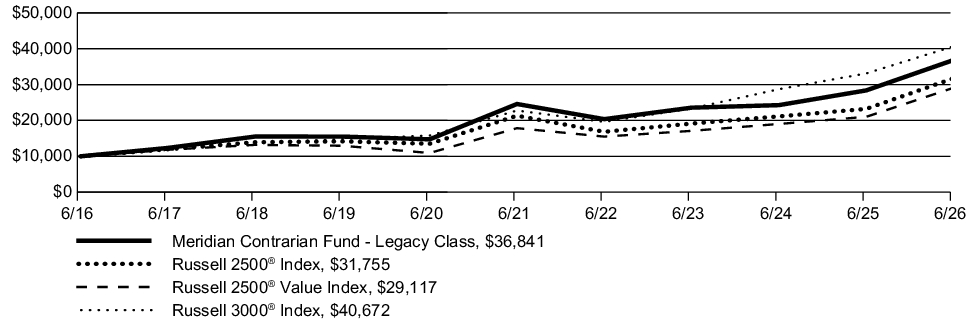
GROWTH OF $10,000
| AVERAGE ANNUAL TOTAL RETURN | 1 Year | 5 Years | 10 Years |
| Meridian Contrarian Fund (Legacy Class/(MVALX)) | 29.81% | 8.42% | 13.93% |
| Russell 2500® Index | 36.72% | 8.30% | 12.25% |
| Russell 2500® Value Index | 38.54% | 10.28% | 11.28% |
| Russell 3000® Index | 22.82% | 12.31% | 15.06% |
Key Fund Statistics
| Fund net assets | $679,391,632 |
| Total number of portfolio holdings | 79 |
| Total advisory fees paid | $6,117,518 |
| Portfolio turnover rate as of the end of the reporting period | 53% |
Top Ten Holdings (1)
| Texas Capital Bancshares, Inc. | 2.6% |
| Envista Holdings Corp. | 2.6% |
| Regal Rexnord Corp. | 2.4% |
| First Citizens BancShares, Inc. Class A | 2.4% |
| VSE Corp. | 2.1% |
| PDF Solutions, Inc. | 2.1% |
| BlackBerry Ltd. (Canada) | 2.1% |
| Dollar Tree, Inc. | 2.0% |
| Adeia, Inc. | 1.9% |
| Caesars Entertainment, Inc. | 1.9% |
Sector Allocation (1)
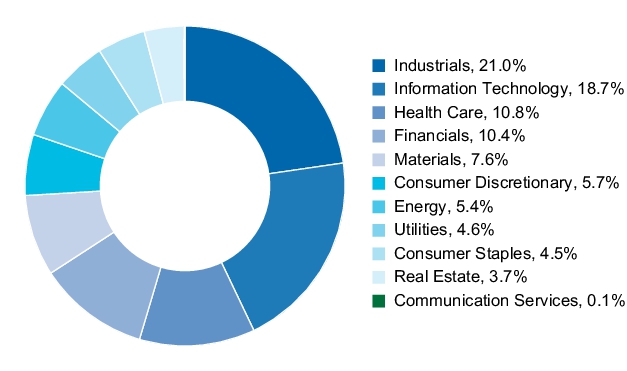
(1) Figures are reported as a percentage of net assets.
Top Ten Holdings (1)
| Texas Capital Bancshares, Inc. | 2.6% |
| Envista Holdings Corp. | 2.6% |
| Regal Rexnord Corp. | 2.4% |
| First Citizens BancShares, Inc. Class A | 2.4% |
| VSE Corp. | 2.1% |
| PDF Solutions, Inc. | 2.1% |
| BlackBerry Ltd. (Canada) | 2.1% |
| Dollar Tree, Inc. | 2.0% |
| Adeia, Inc. | 1.9% |
| Caesars Entertainment, Inc. | 1.9% |
(1) Figures are reported as a percentage of net assets.
What were the Fund costs for the last year?
(Based on a hypothetical $10,000 investment)
| Fund | Costs of a $10,000 investment | Costs paid as a percentage of a $10,000 investment |
| Meridian Small Cap Growth Fund (Legacy Class) |
$136 | 1.25% |
What drove fund performance during the past 12 months?
- U.S. equity markets navigated a twelve-month period shaped by competing forces: optimism surrounding monetary easing and enthusiasm for AI-related investment on one hand, and escalating trade policy uncertainty and the outbreak—and subsequent de-escalation—of military conflict with Iran on the other.
- Small cap growth stocks delivered a 39% return over the period, significantly outperforming large cap growth stocks, which returned 18%.
- The investment strategy's emphasis on durability was evident during the period, as the strategy outperformed on 12 of the 15 days on which the index declined 2% or more.
- Our investment process seeks to focus on high quality companies with recurring revenue and what we believe to be sustainable competitive advantages, which during the period we continued to find lower on the capitalization spectrum.
- The period saw pronounced relative outperformance by lower-quality stocks—the highest-beta quintile of the index outperformed the lowest by more than 60 percentage points, and companies with no earnings, and in many cases no revenue, meaningfully outpaced the broader index—which ran counter to the Fund's quality bias and created a significant headwind to relative results.
- From a sector perspective, stock selection was positive in the health care, financials, materials, and energy sectors.
- Conversely, negative stock selection in the information technology, industrials, and consumer discretionary sectors detracted from relative returns.
How has the Fund historically performed?
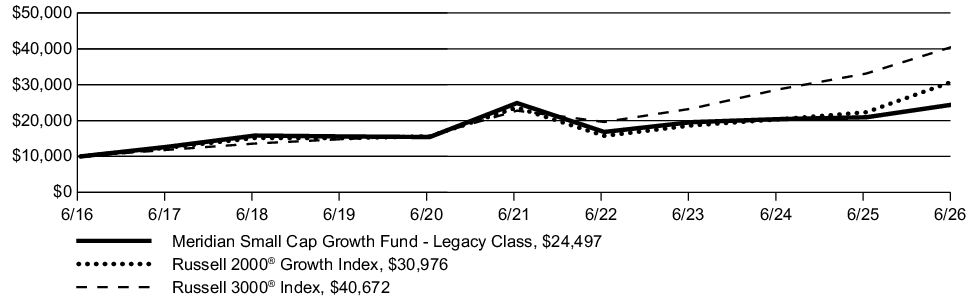
GROWTH OF $10,000
| AVERAGE ANNUAL TOTAL RETURN | 1 Year | 5 Years | 10 Years |
| Meridian Small Cap Growth Fund (Legacy Class/(MSGGX)) | 17.09% | (0.32)% | 9.37% |
| Russell 2000® Growth Index | 38.74% | 5.57% | 11.97% |
| Russell 3000® Index | 22.82% | 12.31% | 15.06% |
Key Fund Statistics
| Fund net assets | $272,755,578 |
| Total number of portfolio holdings | 101 |
| Total advisory fees paid | $3,117,264 |
| Portfolio turnover rate as of the end of the reporting period | 62% |
Top Ten Holdings (1)
| Axogen, Inc. | 3.2% |
| Federal Signal Corp. | 2.3% |
| Hinge Health, Inc. Class A | 2.2% |
| Veracyte, Inc. | 2.1% |
| Consensus Cloud Solutions, Inc. | 2.1% |
| Apartment List, Inc. Series D | 2.0% |
| Definium Therapeutics, Inc. | 2.0% |
| SPX Technologies, Inc. | 2.0% |
| Turning Point Brands, Inc. | 2.0% |
| Kadant, Inc. | 2.0% |
Sector Allocation (1)
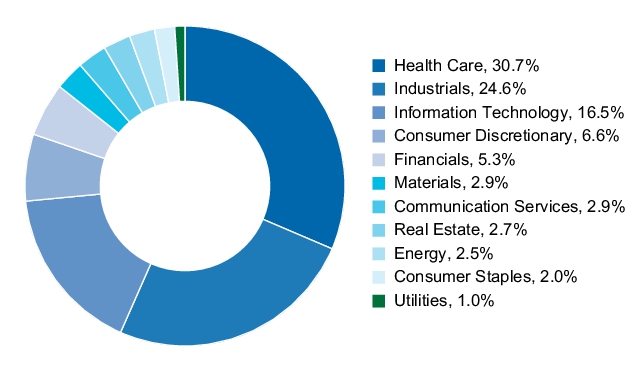
(1) Figures are reported as a percentage of net assets.
Top Ten Holdings (1)
| Axogen, Inc. | 3.2% |
| Federal Signal Corp. | 2.3% |
| Hinge Health, Inc. Class A | 2.2% |
| Veracyte, Inc. | 2.1% |
| Consensus Cloud Solutions, Inc. | 2.1% |
| Apartment List, Inc. Series D | 2.0% |
| Definium Therapeutics, Inc. | 2.0% |
| SPX Technologies, Inc. | 2.0% |
| Turning Point Brands, Inc. | 2.0% |
| Kadant, Inc. | 2.0% |
(1) Figures are reported as a percentage of net assets.
What were the Fund costs for the last year?
(Based on a hypothetical $10,000 investment)
| Fund | Costs of a $10,000 investment | Costs paid as a percentage of a $10,000 investment |
| Meridian Small Cap Growth Fund (Institutional Class) |
$119 | 1.10% |
What drove fund performance during the past 12 months?
- U.S. equity markets navigated a twelve-month period shaped by competing forces: optimism surrounding monetary easing and enthusiasm for AI-related investment on one hand, and escalating trade policy uncertainty and the outbreak—and subsequent de-escalation—of military conflict with Iran on the other.
- Small cap growth stocks delivered a 39% return over the period, significantly outperforming large cap growth stocks, which returned 18%.
- The investment strategy's emphasis on durability was evident during the period, as the strategy outperformed on 12 of the 15 days on which the index declined 2% or more.
- Our investment process seeks to focus on high quality companies with recurring revenue and what we believe to be sustainable competitive advantages, which during the period we continued to find lower on the capitalization spectrum.
- The period saw pronounced relative outperformance by lower-quality stocks—the highest-beta quintile of the index outperformed the lowest by more than 60 percentage points, and companies with no earnings, and in many cases no revenue, meaningfully outpaced the broader index—which ran counter to the Fund's quality bias and created a significant headwind to relative results.
- From a sector perspective, stock selection was positive in the health care, financials, materials, and energy sectors.
- Conversely, negative stock selection in the information technology, industrials, and consumer discretionary sectors detracted from relative returns.
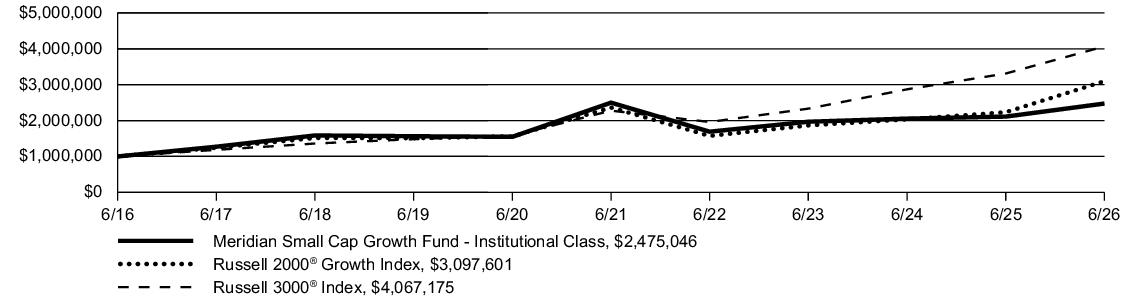
How has the Fund historically performed?
GROWTH OF $1,000,000
| AVERAGE ANNUAL TOTAL RETURN | 1 Year | 5 Years | 10 Years |
| Meridian Small Cap Growth Fund (Institutional Class/(MSGRX)) | 17.25% | (0.20)% | 9.49% |
| Russell 2000® Growth Index | 38.74% | 5.57% | 11.97% |
| Russell 3000® Index | 22.82% | 12.31% | 15.06% |
Key Fund Statistics
| Fund net assets | $272,755,578 |
| Total number of portfolio holdings | 101 |
| Total advisory fees paid | $3,117,264 |
| Portfolio turnover rate as of the end of the reporting period | 62% |
Top Ten Holdings (1)
| Axogen, Inc. | 3.2% |
| Federal Signal Corp. | 2.3% |
| Hinge Health, Inc. Class A | 2.2% |
| Veracyte, Inc. | 2.1% |
| Consensus Cloud Solutions, Inc. | 2.1% |
| Apartment List, Inc. Series D | 2.0% |
| Definium Therapeutics, Inc. | 2.0% |
| SPX Technologies, Inc. | 2.0% |
| Turning Point Brands, Inc. | 2.0% |
| Kadant, Inc. | 2.0% |
Sector Allocation (1)
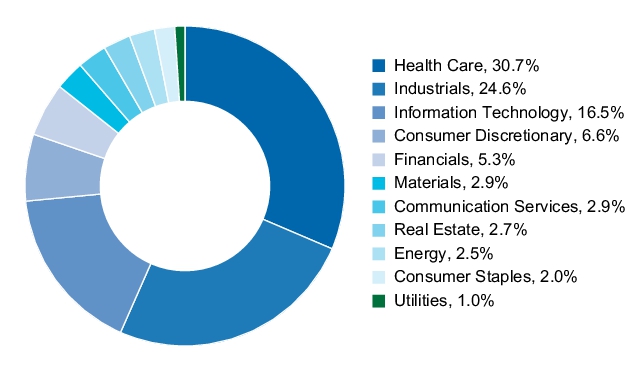
(1) Figures are reported as a percentage of net assets.
Top Ten Holdings (1)
| Axogen, Inc. | 3.2% |
| Federal Signal Corp. | 2.3% |
| Hinge Health, Inc. Class A | 2.2% |
| Veracyte, Inc. | 2.1% |
| Consensus Cloud Solutions, Inc. | 2.1% |
| Apartment List, Inc. Series D | 2.0% |
| Definium Therapeutics, Inc. | 2.0% |
| SPX Technologies, Inc. | 2.0% |
| Turning Point Brands, Inc. | 2.0% |
| Kadant, Inc. | 2.0% |
(1) Figures are reported as a percentage of net assets.
What were the Fund costs for the last year?
(Based on a hypothetical $10,000 investment)
| Fund | Costs of a $10,000 investment | Costs paid as a percentage of a $10,000 investment |
| Meridian Small Cap Growth Fund (Class A) |
$163 | 1.50% |
What drove fund performance during the past 12 months?
- U.S. equity markets navigated a twelve-month period shaped by competing forces: optimism surrounding monetary easing and enthusiasm for AI-related investment on one hand, and escalating trade policy uncertainty and the outbreak—and subsequent de-escalation—of military conflict with Iran on the other.
- Small cap growth stocks delivered a 39% return over the period, significantly outperforming large cap growth stocks, which returned 18%.
- The investment strategy's emphasis on durability was evident during the period, as the strategy outperformed on 12 of the 15 days on which the index declined 2% or more.
- Our investment process seeks to focus on high quality companies with recurring revenue and what we believe to be sustainable competitive advantages, which during the period we continued to find lower on the capitalization spectrum.
- The period saw pronounced relative outperformance by lower-quality stocks—the highest-beta quintile of the index outperformed the lowest by more than 60 percentage points, and companies with no earnings, and in many cases no revenue, meaningfully outpaced the broader index—which ran counter to the Fund's quality bias and created a significant headwind to relative results.
- From a sector perspective, stock selection was positive in the health care, financials, materials, and energy sectors.
- Conversely, negative stock selection in the information technology, industrials, and consumer discretionary sectors detracted from relative returns.
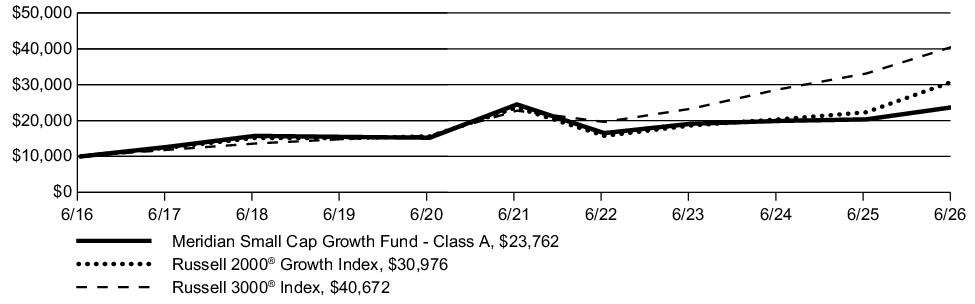
How has the Fund historically performed?
GROWTH OF $10,000
| AVERAGE ANNUAL TOTAL RETURN | 1 Year | 5 Years | 10 Years |
| Meridian Small Cap Growth Fund (Class A/(MSGAX)) | 16.80% | (0.61)% | 9.04% |
| Meridian Small Cap Growth Fund (Class A/(MSGAX)) (1) | 10.12% | (1.78)% | 8.39% |
| Russell 2000® Growth Index | 38.74% | 5.57% | 11.97% |
| Russell 3000® Index | 22.82% | 12.31% | 15.06% |
| (1) |
Assuming maximum sales charge, if any. Class A Shares are subject to a maximum initial sales charge of 5.75% |
Key Fund Statistics
| Fund net assets | $272,755,578 |
| Total number of portfolio holdings | 101 |
| Total advisory fees paid | $3,117,264 |
| Portfolio turnover rate as of the end of the reporting period | 62% |
Top Ten Holdings (1)
| Axogen, Inc. | 3.2% |
| Federal Signal Corp. | 2.3% |
| Hinge Health, Inc. Class A | 2.2% |
| Veracyte, Inc. | 2.1% |
| Consensus Cloud Solutions, Inc. | 2.1% |
| Apartment List, Inc. Series D | 2.0% |
| Definium Therapeutics, Inc. | 2.0% |
| SPX Technologies, Inc. | 2.0% |
| Turning Point Brands, Inc. | 2.0% |
| Kadant, Inc. | 2.0% |
Sector Allocation (1)
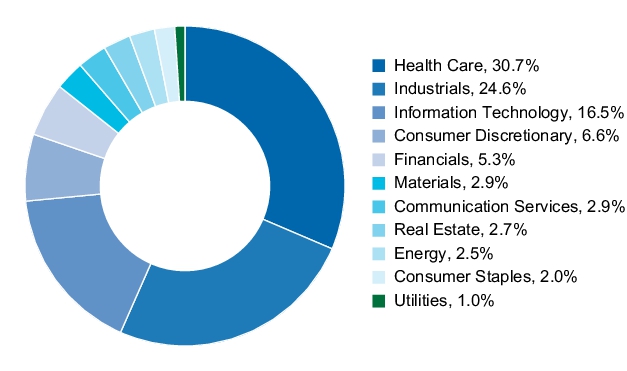
(1) Figures are reported as a percentage of net assets.
Top Ten Holdings (1)
| Axogen, Inc. | 3.2% |
| Federal Signal Corp. | 2.3% |
| Hinge Health, Inc. Class A | 2.2% |
| Veracyte, Inc. | 2.1% |
| Consensus Cloud Solutions, Inc. | 2.1% |
| Apartment List, Inc. Series D | 2.0% |
| Definium Therapeutics, Inc. | 2.0% |
| SPX Technologies, Inc. | 2.0% |
| Turning Point Brands, Inc. | 2.0% |
| Kadant, Inc. | 2.0% |
(1) Figures are reported as a percentage of net assets.
What were the Fund costs for the last year?
(Based on a hypothetical $10,000 investment)
| Fund | Costs of a $10,000 investment | Costs paid as a percentage of a $10,000 investment |
| Meridian Small Cap Growth Fund (Class C) |
$243 | 2.25% |
What drove fund performance during the past 12 months?
- U.S. equity markets navigated a twelve-month period shaped by competing forces: optimism surrounding monetary easing and enthusiasm for AI-related investment on one hand, and escalating trade policy uncertainty and the outbreak—and subsequent de-escalation—of military conflict with Iran on the other.
- Small cap growth stocks delivered a 39% return over the period, significantly outperforming large cap growth stocks, which returned 18%.
- The investment strategy's emphasis on durability was evident during the period, as the strategy outperformed on 12 of the 15 days on which the index declined 2% or more.
- Our investment process seeks to focus on high quality companies with recurring revenue and what we believe to be sustainable competitive advantages, which during the period we continued to find lower on the capitalization spectrum.
- The period saw pronounced relative outperformance by lower-quality stocks—the highest-beta quintile of the index outperformed the lowest by more than 60 percentage points, and companies with no earnings, and in many cases no revenue, meaningfully outpaced the broader index—which ran counter to the Fund's quality bias and created a significant headwind to relative results.
- From a sector perspective, stock selection was positive in the health care, financials, materials, and energy sectors.
- Conversely, negative stock selection in the information technology, industrials, and consumer discretionary sectors detracted from relative returns.
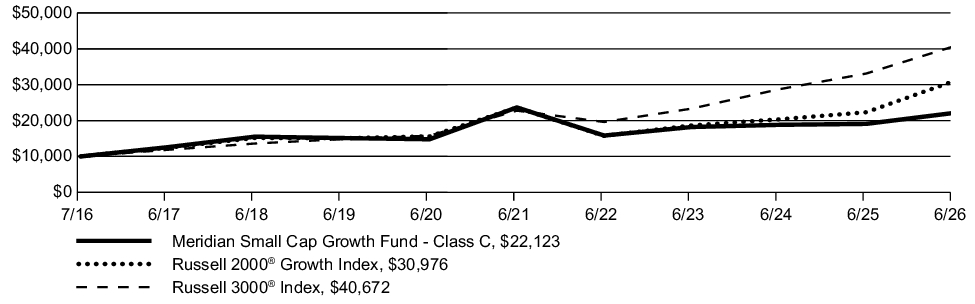
How has the Fund historically performed?
GROWTH OF $10,000
| AVERAGE ANNUAL TOTAL RETURN | 1 Year | 5 Years | 10 Years |
| Meridian Small Cap Growth Fund (Class C/(MSGCX)) | 15.94% | (1.33)% | 8.26% |
| Russell 2000® Growth Index | 38.74% | 5.57% | 11.97% |
| Russell 3000® Index | 22.82% | 12.31% | 15.06% |
Key Fund Statistics
| Fund net assets | $272,755,578 |
| Total number of portfolio holdings | 101 |
| Total advisory fees paid | $3,117,264 |
| Portfolio turnover rate as of the end of the reporting period | 62% |
Top Ten Holdings (1)
| Axogen, Inc. | 3.2% |
| Federal Signal Corp. | 2.3% |
| Hinge Health, Inc. Class A | 2.2% |
| Veracyte, Inc. | 2.1% |
| Consensus Cloud Solutions, Inc. | 2.1% |
| Apartment List, Inc. Series D | 2.0% |
| Definium Therapeutics, Inc. | 2.0% |
| SPX Technologies, Inc. | 2.0% |
| Turning Point Brands, Inc. | 2.0% |
| Kadant, Inc. | 2.0% |
Sector Allocation (1)
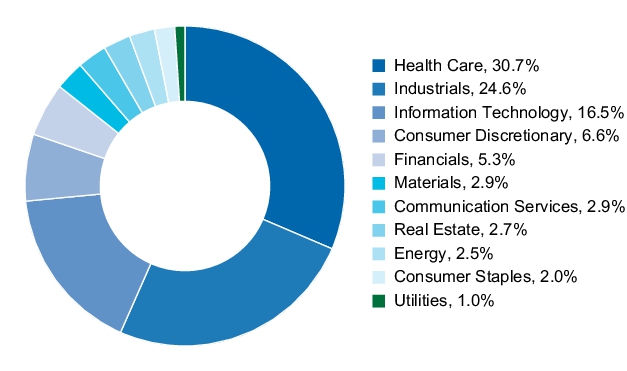
(1) Figures are reported as a percentage of net assets.
Top Ten Holdings (1)
| Axogen, Inc. | 3.2% |
| Federal Signal Corp. | 2.3% |
| Hinge Health, Inc. Class A | 2.2% |
| Veracyte, Inc. | 2.1% |
| Consensus Cloud Solutions, Inc. | 2.1% |
| Apartment List, Inc. Series D | 2.0% |
| Definium Therapeutics, Inc. | 2.0% |
| SPX Technologies, Inc. | 2.0% |
| Turning Point Brands, Inc. | 2.0% |
| Kadant, Inc. | 2.0% |
(1) Figures are reported as a percentage of net assets.
What were the Fund costs for the last year?
(Based on a hypothetical $10,000 investment)
| Fund | Costs of a $10,000 investment | Costs paid as a percentage of a $10,000 investment |
| Meridian Small Cap Growth Fund (Investor Class) |
$136 | 1.25% |
What drove fund performance during the past 12 months?
- U.S. equity markets navigated a twelve-month period shaped by competing forces: optimism surrounding monetary easing and enthusiasm for AI-related investment on one hand, and escalating trade policy uncertainty and the outbreak—and subsequent de-escalation—of military conflict with Iran on the other.
- Small cap growth stocks delivered a 39% return over the period, significantly outperforming large cap growth stocks, which returned 18%.
- The investment strategy's emphasis on durability was evident during the period, as the strategy outperformed on 12 of the 15 days on which the index declined 2% or more.
- Our investment process seeks to focus on high quality companies with recurring revenue and what we believe to be sustainable competitive advantages, which during the period we continued to find lower on the capitalization spectrum.
- The period saw pronounced relative outperformance by lower-quality stocks—the highest-beta quintile of the index outperformed the lowest by more than 60 percentage points, and companies with no earnings, and in many cases no revenue, meaningfully outpaced the broader index—which ran counter to the Fund's quality bias and created a significant headwind to relative results.
- From a sector perspective, stock selection was positive in the health care, financials, materials, and energy sectors.
- Conversely, negative stock selection in the information technology, industrials, and consumer discretionary sectors detracted from relative returns.
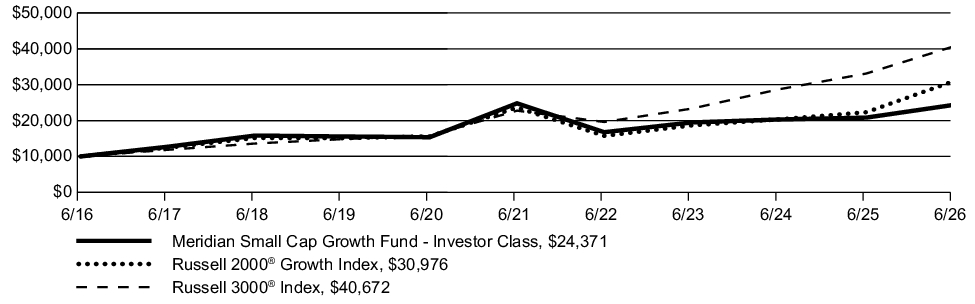
How has the Fund historically performed?
GROWTH OF $10,000
| AVERAGE ANNUAL TOTAL RETURN | 1 Year | 5 Years | 10 Years |
| Meridian Small Cap Growth Fund (Investor Class/(MISGX)) | 17.03% | (0.35)% | 9.32% |
| Russell 2000® Growth Index | 38.74% | 5.57% | 11.97% |
| Russell 3000® Index | 22.82% | 12.31% | 15.06% |
Key Fund Statistics
| Fund net assets | $272,755,578 |
| Total number of portfolio holdings | 101 |
| Total advisory fees paid | $3,117,264 |
| Portfolio turnover rate as of the end of the reporting period | 62% |
Top Ten Holdings (1)
| Axogen, Inc. | 3.2% |
| Federal Signal Corp. | 2.3% |
| Hinge Health, Inc. Class A | 2.2% |
| Veracyte, Inc. | 2.1% |
| Consensus Cloud Solutions, Inc. | 2.1% |
| Apartment List, Inc. Series D | 2.0% |
| Definium Therapeutics, Inc. | 2.0% |
| SPX Technologies, Inc. | 2.0% |
| Turning Point Brands, Inc. | 2.0% |
| Kadant, Inc. | 2.0% |
Sector Allocation (1)
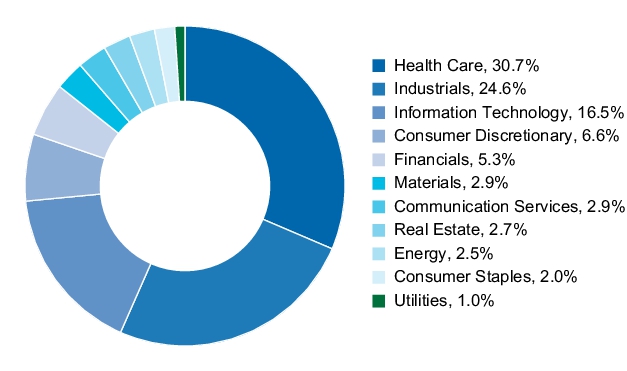
(1) Figures are reported as a percentage of net assets.
Top Ten Holdings (1)
| Axogen, Inc. | 3.2% |
| Federal Signal Corp. | 2.3% |
| Hinge Health, Inc. Class A | 2.2% |
| Veracyte, Inc. | 2.1% |
| Consensus Cloud Solutions, Inc. | 2.1% |
| Apartment List, Inc. Series D | 2.0% |
| Definium Therapeutics, Inc. | 2.0% |
| SPX Technologies, Inc. | 2.0% |
| Turning Point Brands, Inc. | 2.0% |
| Kadant, Inc. | 2.0% |
(1) Figures are reported as a percentage of net assets.