Shareholder Report
Jun. 30, 2026
USD ($)
Holding
This report describes material changes to the Fund that occurred during the reporting period.
What were the Fund costs for the last year?
(based on a hypothetical $10,000 investment)
| Fund (Class) | Costs of a $10,000 investment |
Costs paid as a percentage of a $10,000 investment |
| JPMorgan Mid Cap Growth Fund (Class R6 Shares) |
$69 | 0.65% |
How did the Fund Perform?
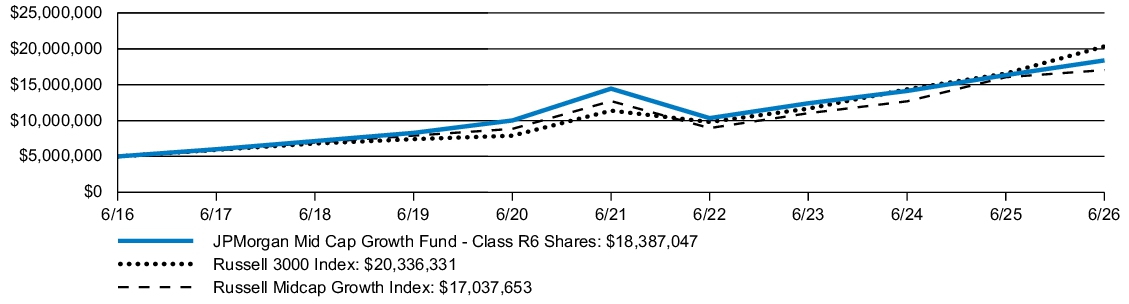
The Fund's Class R6 Shares returned 12.54% for the twelve months ended June 30, 2026. The Russell 3000 Index (the "Index") returned 22.82% and the Russell Midcap Growth Index returned 6.17% for the twelve months ended June 30, 2026.
- The Fund’s security selection in the technology and industrials sectors contributed to relative performance.
- The Fund’s overweight allocations to Ciena and Teradyne contributed to relative performance.
- The Fund’s security selection in the consumer discretionary sector and underweight allocation to the basic materials sector detracted from relative performance.
- The Fund’s underweight allocation to Astera Labs and not owning Targa Resources detracted from relative performance.
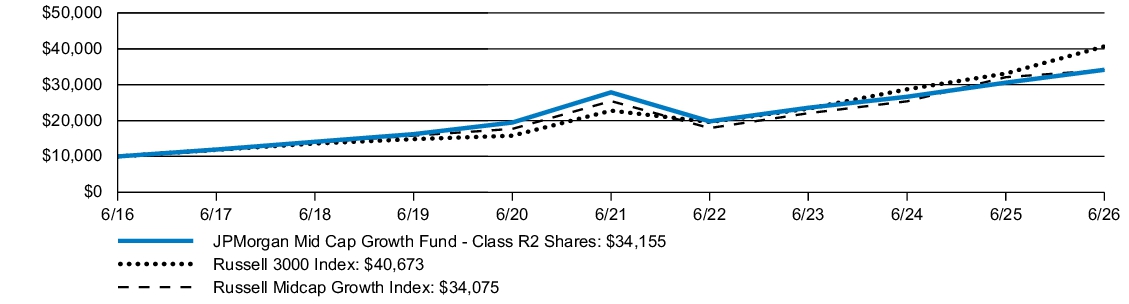
Fund Performance
| AVERAGE ANNUAL TOTAL RETURNS | INCEPTION DATE |
1 YEAR | 5 YEAR | 10 YEAR | |||
| JPMorgan Mid Cap Growth Fund (Class R6 Shares) | November 1, 2011 | 12.54 | % | 4.93 | % | 13.91 | % |
| Russell 3000 Index | 22.82 | 12.31 | 15.06 | ||||
| Russell Midcap Growth Index | 6.17 | 6.03 | 13.04 |
KEY FUND STATISTICS
| Fund net assets (000's) | $13,213,733 | |
| Total number of portfolio holdings | 118 | |
| Portfolio turnover rate | 78 | % |
| Total advisory fees paid (000's) | $72,076 |
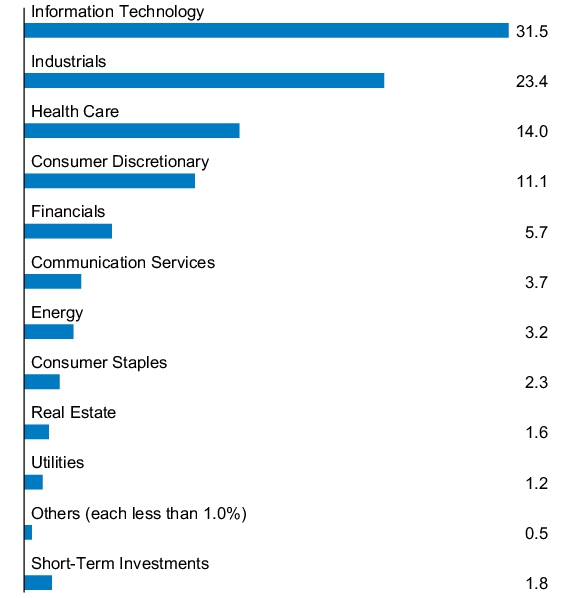
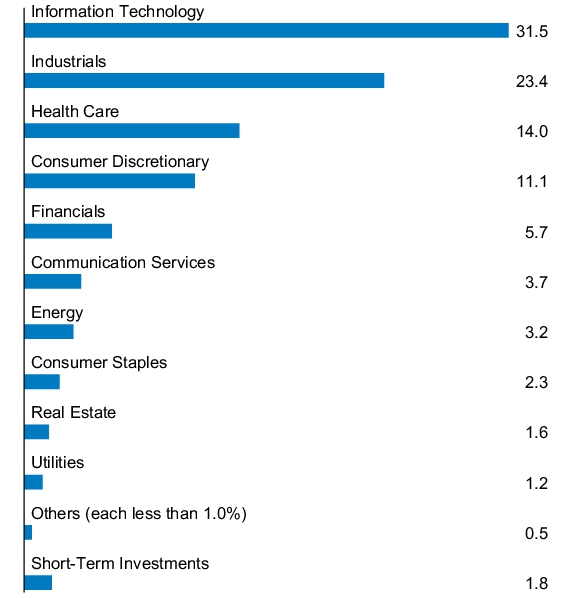
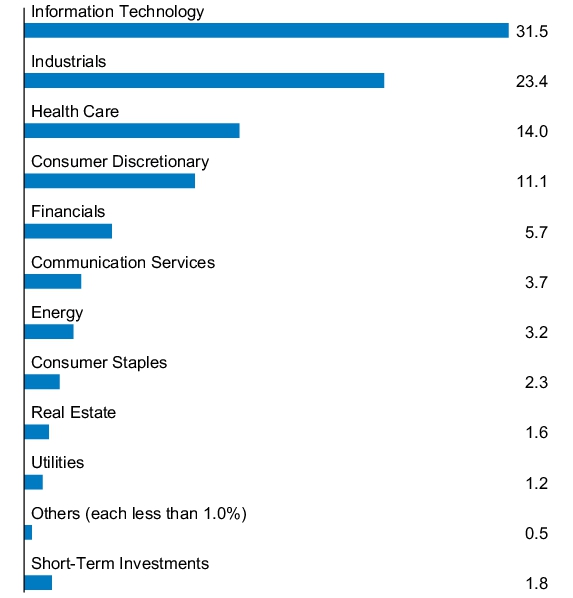
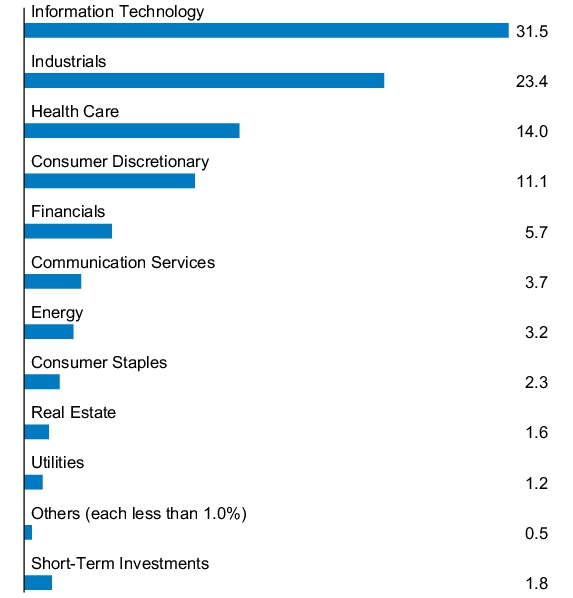
PORTFOLIO COMPOSITION - SECTOR
(% of Total Investments)
(% of Total Investments)
Material changes to the Fund during the period
The Fund added “Consumer Discretionary Sector Risk” disclosure to its summary prospectus as of November 1, 2025. This disclosure was added in light of a larger concentration of portfolio securities in this sector.
This is a summary of certain changes to the Fund since July 1, 2025. For more complete information, you may review the Fund’s prospectus at www.jpmorganfunds.com/funddocuments or upon request at 1-844-457-6383.
The Fund added “Consumer Discretionary Sector Risk” disclosure to its summary prospectus as of November 1, 2025. This disclosure was added in light of a larger concentration of portfolio securities in this sector.
This is a summary of certain changes to the Fund since July 1, 2025. For more complete information, you may review the Fund’s prospectus at www.jpmorganfunds.com/funddocuments or upon request at 1-844-457-6383.
This report describes material changes to the Fund that occurred during the reporting period.
What were the Fund costs for the last year?
(based on a hypothetical $10,000 investment)
| Fund (Class) | Costs of a $10,000 investment |
Costs paid as a percentage of a $10,000 investment |
| JPMorgan Mid Cap Growth Fund (Class R5 Shares) |
$78 | 0.74% |
How did the Fund Perform?
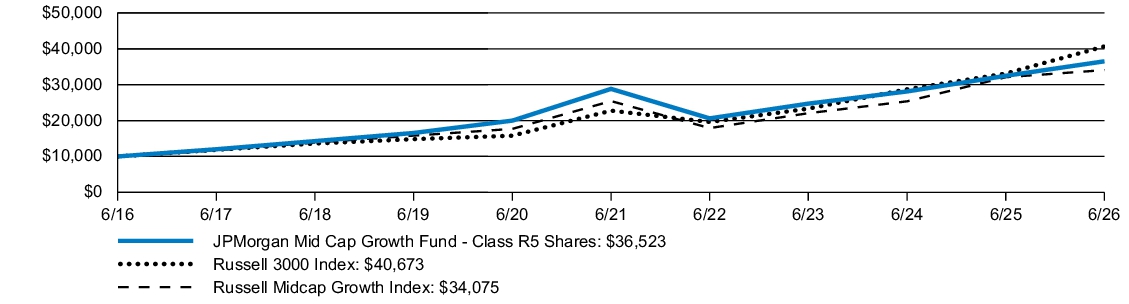
The Fund's Class R5 Shares returned 12.44% for the twelve months ended June 30, 2026. The Russell 3000 Index (the "Index") returned 22.82% and the Russell Midcap Growth Index returned 6.17% for the twelve months ended June 30, 2026.
- The Fund’s security selection in the technology and industrials sectors contributed to relative performance.
- The Fund’s overweight allocations to Ciena and Teradyne contributed to relative performance.
- The Fund’s security selection in the consumer discretionary sector and underweight allocation to the basic materials sector detracted from relative performance.
- The Fund’s underweight allocation to Astera Labs and not owning Targa Resources detracted from relative performance.
Fund Performance
| AVERAGE ANNUAL TOTAL RETURNS | INCEPTION DATE |
1 YEAR | 5 YEAR | 10 YEAR | |||
| JPMorgan Mid Cap Growth Fund (Class R5 Shares) | November 1, 2011 | 12.44 | % | 4.84 | % | 13.83 | % |
| Russell 3000 Index | 22.82 | 12.31 | 15.06 | ||||
| Russell Midcap Growth Index | 6.17 | 6.03 | 13.04 |
KEY FUND STATISTICS
| Fund net assets (000's) | $13,213,733 | |
| Total number of portfolio holdings | 118 | |
| Portfolio turnover rate | 78 | % |
| Total advisory fees paid (000's) | $72,076 |
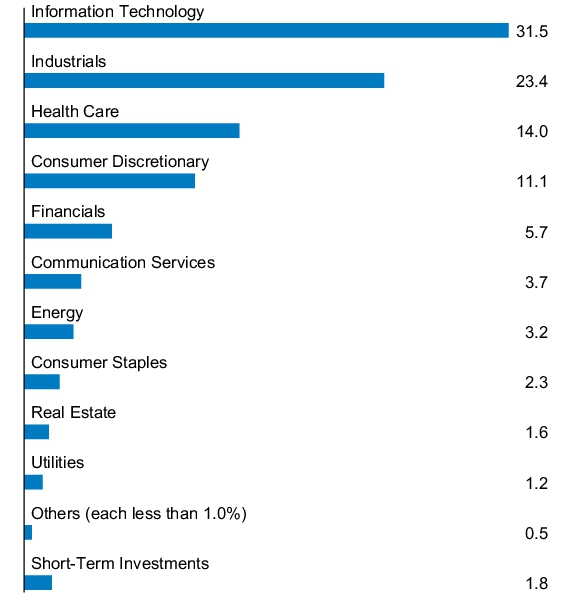
PORTFOLIO COMPOSITION - SECTOR
(% of Total Investments)
(% of Total Investments)
Material changes to the Fund during the period
The Fund added “Consumer Discretionary Sector Risk” disclosure to its summary prospectus as of November 1, 2025. This disclosure was added in light of a larger concentration of portfolio securities in this sector.
This is a summary of certain changes to the Fund since July 1, 2025. For more complete information, you may review the Fund’s prospectus at www.jpmorganfunds.com/funddocuments or upon request at 1-844-457-6383.
The Fund added “Consumer Discretionary Sector Risk” disclosure to its summary prospectus as of November 1, 2025. This disclosure was added in light of a larger concentration of portfolio securities in this sector.
This is a summary of certain changes to the Fund since July 1, 2025. For more complete information, you may review the Fund’s prospectus at www.jpmorganfunds.com/funddocuments or upon request at 1-844-457-6383.
This report describes material changes to the Fund that occurred during the reporting period.
What were the Fund costs for the last year?
(based on a hypothetical $10,000 investment)
| Fund (Class) | Costs of a $10,000 investment |
Costs paid as a percentage of a $10,000 investment |
| JPMorgan Mid Cap Growth Fund (Class R4 Shares) |
$95 | 0.90% |
How did the Fund Perform?
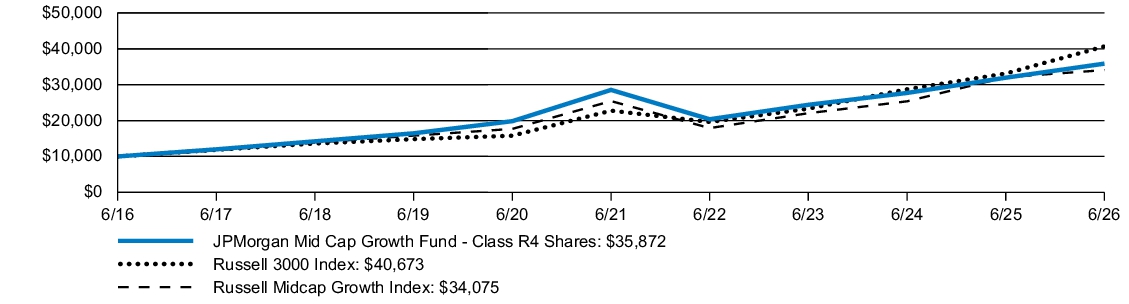
The Fund's Class R4 Shares returned 12.25% for the twelve months ended June 30, 2026. The Russell 3000 Index (the "Index") returned 22.82% and the Russell Midcap Growth Index returned 6.17% for the twelve months ended June 30, 2026.
- The Fund’s security selection in the technology and industrials sectors contributed to relative performance.
- The Fund’s overweight allocations to Ciena and Teradyne contributed to relative performance.
- The Fund’s security selection in the consumer discretionary sector and underweight allocation to the basic materials sector detracted from relative performance.
- The Fund’s underweight allocation to Astera Labs and not owning Targa Resources detracted from relative performance.
Fund Performance
| AVERAGE ANNUAL TOTAL RETURNS | INCEPTION DATE |
1 YEAR | 5 YEAR | 10 YEAR | |||
| JPMorgan Mid Cap Growth Fund (Class R4 Shares) | September 9, 2016 | 12.25 | % | 4.67 | % | 13.63 | % |
| Russell 3000 Index | 22.82 | 12.31 | 15.06 | ||||
| Russell Midcap Growth Index | 6.17 | 6.03 | 13.04 |
KEY FUND STATISTICS
| Fund net assets (000's) | $13,213,733 | |
| Total number of portfolio holdings | 118 | |
| Portfolio turnover rate | 78 | % |
| Total advisory fees paid (000's) | $72,076 |
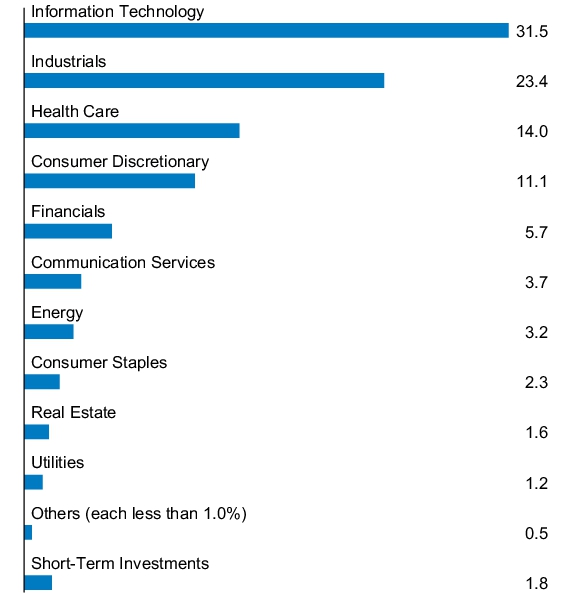
PORTFOLIO COMPOSITION - SECTOR
(% of Total Investments)
(% of Total Investments)
Material changes to the Fund during the period
The Fund added “Consumer Discretionary Sector Risk” disclosure to its summary prospectus as of November 1, 2025. This disclosure was added in light of a larger concentration of portfolio securities in this sector.
This is a summary of certain changes to the Fund since July 1, 2025. For more complete information, you may review the Fund’s prospectus at www.jpmorganfunds.com/funddocuments or upon request at 1-844-457-6383.
The Fund added “Consumer Discretionary Sector Risk” disclosure to its summary prospectus as of November 1, 2025. This disclosure was added in light of a larger concentration of portfolio securities in this sector.
This is a summary of certain changes to the Fund since July 1, 2025. For more complete information, you may review the Fund’s prospectus at www.jpmorganfunds.com/funddocuments or upon request at 1-844-457-6383.
This report describes material changes to the Fund that occurred during the reporting period.
What were the Fund costs for the last year?
(based on a hypothetical $10,000 investment)
| Fund (Class) | Costs of a $10,000 investment |
Costs paid as a percentage of a $10,000 investment |
| JPMorgan Mid Cap Growth Fund (Class R3 Shares) |
$122 | 1.15% |
How did the Fund Perform?
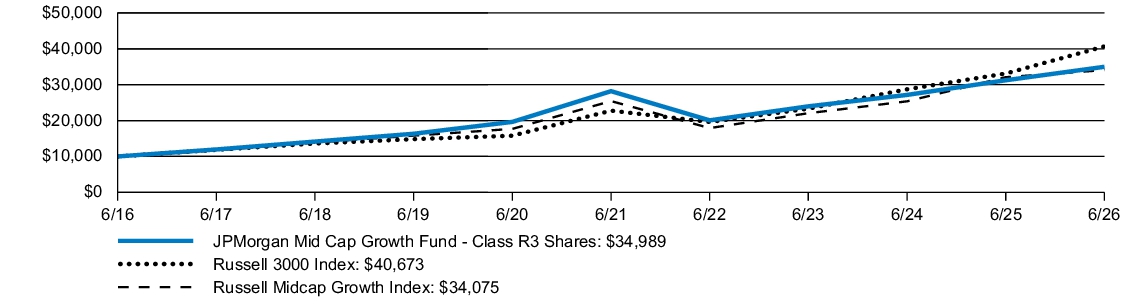
The Fund's Class R3 Shares returned 12.00% for the twelve months ended June 30, 2026. The Russell 3000 Index (the "Index") returned 22.82% and the Russell Midcap Growth Index returned 6.17% for the twelve months ended June 30, 2026.
- The Fund’s security selection in the technology and industrials sectors contributed to relative performance.
- The Fund’s overweight allocations to Ciena and Teradyne contributed to relative performance.
- The Fund’s security selection in the consumer discretionary sector and underweight allocation to the basic materials sector detracted from relative performance.
- The Fund’s underweight allocation to Astera Labs and not owning Targa Resources detracted from relative performance.
Fund Performance
| AVERAGE ANNUAL TOTAL RETURNS | INCEPTION DATE |
1 YEAR | 5 YEAR | 10 YEAR | |||
| JPMorgan Mid Cap Growth Fund (Class R3 Shares) | September 9, 2016 | 12.00 | % | 4.41 | % | 13.34 | % |
| Russell 3000 Index | 22.82 | 12.31 | 15.06 | ||||
| Russell Midcap Growth Index | 6.17 | 6.03 | 13.04 |
KEY FUND STATISTICS
| Fund net assets (000's) | $13,213,733 | |
| Total number of portfolio holdings | 118 | |
| Portfolio turnover rate | 78 | % |
| Total advisory fees paid (000's) | $72,076 |
PORTFOLIO COMPOSITION - SECTOR
(% of Total Investments)
(% of Total Investments)
Material changes to the Fund during the period
The Fund added “Consumer Discretionary Sector Risk” disclosure to its summary prospectus as of November 1, 2025. This disclosure was added in light of a larger concentration of portfolio securities in this sector.
This is a summary of certain changes to the Fund since July 1, 2025. For more complete information, you may review the Fund’s prospectus at www.jpmorganfunds.com/funddocuments or upon request at 1-844-457-6383.
The Fund added “Consumer Discretionary Sector Risk” disclosure to its summary prospectus as of November 1, 2025. This disclosure was added in light of a larger concentration of portfolio securities in this sector.
This is a summary of certain changes to the Fund since July 1, 2025. For more complete information, you may review the Fund’s prospectus at www.jpmorganfunds.com/funddocuments or upon request at 1-844-457-6383.
This report describes material changes to the Fund that occurred during the reporting period.
What were the Fund costs for the last year?
(based on a hypothetical $10,000 investment)
| Fund (Class) | Costs of a $10,000 investment |
Costs paid as a percentage of a $10,000 investment |
| JPMorgan Mid Cap Growth Fund (Class R2 Shares) |
$148 | 1.40% |
How did the Fund Perform?
The Fund's Class R2 Shares returned 11.71% for the twelve months ended June 30, 2026. The Russell 3000 Index (the "Index") returned 22.82% and the Russell Midcap Growth Index returned 6.17% for the twelve months ended June 30, 2026.
- The Fund’s security selection in the technology and industrials sectors contributed to relative performance.
- The Fund’s overweight allocations to Ciena and Teradyne contributed to relative performance.
- The Fund’s security selection in the consumer discretionary sector and underweight allocation to the basic materials sector detracted from relative performance.
- The Fund’s underweight allocation to Astera Labs and not owning Targa Resources detracted from relative performance.
Fund Performance
| AVERAGE ANNUAL TOTAL RETURNS | INCEPTION DATE |
1 YEAR | 5 YEAR | 10 YEAR | |||
| JPMorgan Mid Cap Growth Fund (Class R2 Shares) | June 19, 2009 | 11.71 | % | 4.15 | % | 13.07 | % |
| Russell 3000 Index | 22.82 | 12.31 | 15.06 | ||||
| Russell Midcap Growth Index | 6.17 | 6.03 | 13.04 |
KEY FUND STATISTICS
| Fund net assets (000's) | $13,213,733 | |
| Total number of portfolio holdings | 118 | |
| Portfolio turnover rate | 78 | % |
| Total advisory fees paid (000's) | $72,076 |
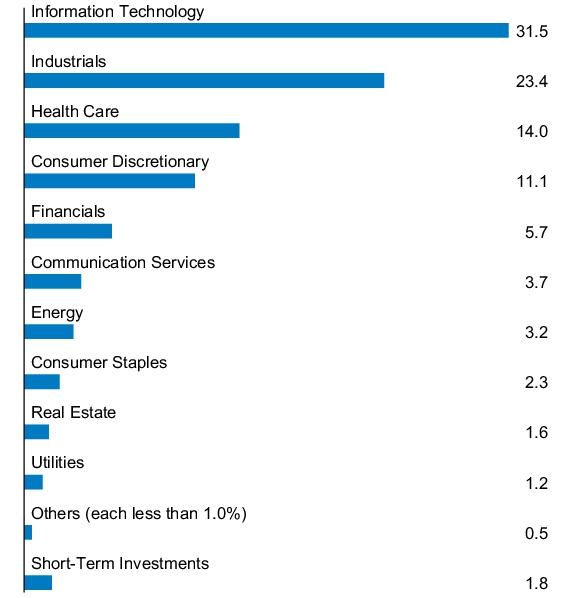
PORTFOLIO COMPOSITION - SECTOR
(% of Total Investments)
(% of Total Investments)
Material changes to the Fund during the period
The Fund added “Consumer Discretionary Sector Risk” disclosure to its summary prospectus as of November 1, 2025. This disclosure was added in light of a larger concentration of portfolio securities in this sector.
This is a summary of certain changes to the Fund since July 1, 2025. For more complete information, you may review the Fund’s prospectus at www.jpmorganfunds.com/funddocuments or upon request at 1-844-457-6383.
The Fund added “Consumer Discretionary Sector Risk” disclosure to its summary prospectus as of November 1, 2025. This disclosure was added in light of a larger concentration of portfolio securities in this sector.
This is a summary of certain changes to the Fund since July 1, 2025. For more complete information, you may review the Fund’s prospectus at www.jpmorganfunds.com/funddocuments or upon request at 1-844-457-6383.
This report describes material changes to the Fund that occurred during the reporting period.
What were the Fund costs for the last year?
(based on a hypothetical $10,000 investment)
| Fund (Class) | Costs of a $10,000 investment |
Costs paid as a percentage of a $10,000 investment |
| JPMorgan Mid Cap Growth Fund (Class I Shares) |
$89 | 0.84% |
How did the Fund Perform?
The Fund's Class I Shares returned 12.34% for the twelve months ended June 30, 2026. The Russell 3000 Index (the "Index") returned 22.82% and the Russell Midcap Growth Index returned 6.17% for the twelve months ended June 30, 2026.
- The Fund’s security selection in the technology and industrials sectors contributed to relative performance.
- The Fund’s overweight allocations to Ciena and Teradyne contributed to relative performance.
- The Fund’s security selection in the consumer discretionary sector and underweight allocation to the basic materials sector detracted from relative performance.
- The Fund’s underweight allocation to Astera Labs and not owning Targa Resources detracted from relative performance.
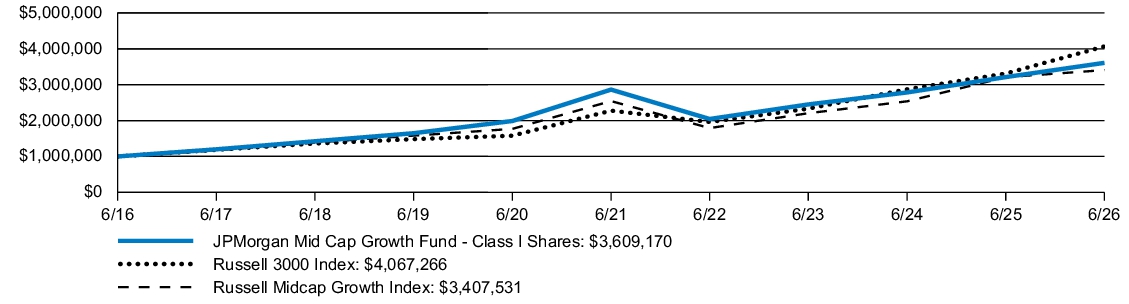
Fund Performance
| AVERAGE ANNUAL TOTAL RETURNS | INCEPTION DATE |
1 YEAR | 5 YEAR | 10 YEAR | |||
| JPMorgan Mid Cap Growth Fund (Class I Shares) | March 2, 1989 | 12.34 | % | 4.74 | % | 13.69 | % |
| Russell 3000 Index | 22.82 | 12.31 | 15.06 | ||||
| Russell Midcap Growth Index | 6.17 | 6.03 | 13.04 |
KEY FUND STATISTICS
| Fund net assets (000's) | $13,213,733 | |
| Total number of portfolio holdings | 118 | |
| Portfolio turnover rate | 78 | % |
| Total advisory fees paid (000's) | $72,076 |
PORTFOLIO COMPOSITION - SECTOR
(% of Total Investments)
(% of Total Investments)
Material changes to the Fund during the period
The Fund added “Consumer Discretionary Sector Risk” disclosure to its summary prospectus as of November 1, 2025. This disclosure was added in light of a larger concentration of portfolio securities in this sector.
This is a summary of certain changes to the Fund since July 1, 2025. For more complete information, you may review the Fund’s prospectus at www.jpmorganfunds.com/funddocuments or upon request at 1-844-457-6383.
The Fund added “Consumer Discretionary Sector Risk” disclosure to its summary prospectus as of November 1, 2025. This disclosure was added in light of a larger concentration of portfolio securities in this sector.
This is a summary of certain changes to the Fund since July 1, 2025. For more complete information, you may review the Fund’s prospectus at www.jpmorganfunds.com/funddocuments or upon request at 1-844-457-6383.
This report describes material changes to the Fund that occurred during the reporting period.
What were the Fund costs for the last year?
(based on a hypothetical $10,000 investment)
| Fund (Class) | Costs of a $10,000 investment |
Costs paid as a percentage of a $10,000 investment |
| JPMorgan Mid Cap Growth Fund (Class C Shares) |
$168 | 1.59% |
How did the Fund Perform?
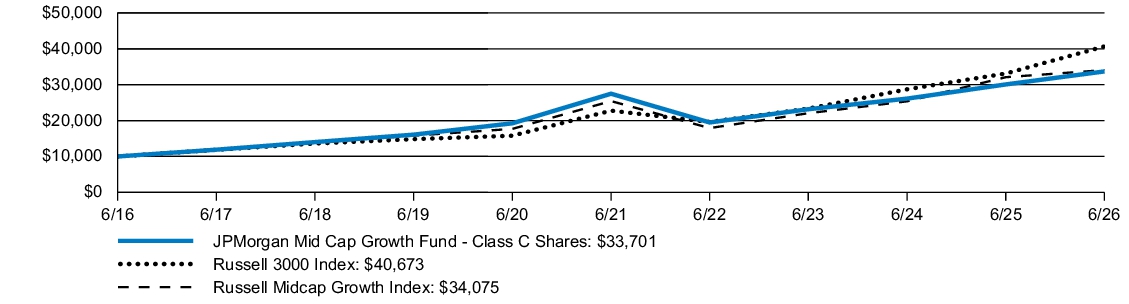
The Fund's Class C Shares, without a sales charge, returned 11.48% for the twelve months ended June 30, 2026. The Russell 3000 Index (the "Index") returned 22.82% and the Russell Midcap Growth Index returned 6.17% for the twelve months ended June 30, 2026.
- The Fund’s security selection in the technology and industrials sectors contributed to relative performance.
- The Fund’s overweight allocations to Ciena and Teradyne contributed to relative performance.
- The Fund’s security selection in the consumer discretionary sector and underweight allocation to the basic materials sector detracted from relative performance.
- The Fund’s underweight allocation to Astera Labs and not owning Targa Resources detracted from relative performance.
Fund Performance
| AVERAGE ANNUAL TOTAL RETURNS | INCEPTION DATE |
1 YEAR | 5 YEAR | 10 YEAR | |||
| JPMorgan Mid Cap Growth Fund (Class C Shares) | November 4, 1997 | 10.48 | % | 3.94 | % | 12.92 | % |
| JPMorgan Mid Cap Growth Fund (Class C Shares) - excluding sales charge | 11.48 | 3.94 | 12.92 | ||||
| Russell 3000 Index | 22.82 | 12.31 | 15.06 | ||||
| Russell Midcap Growth Index | 6.17 | 6.03 | 13.04 |
KEY FUND STATISTICS
| Fund net assets (000's) | $13,213,733 | |
| Total number of portfolio holdings | 118 | |
| Portfolio turnover rate | 78 | % |
| Total advisory fees paid (000's) | $72,076 |
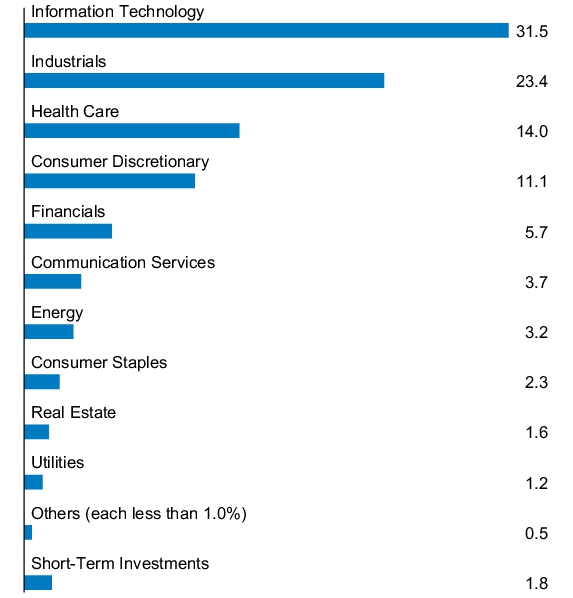
PORTFOLIO COMPOSITION - SECTOR
(% of Total Investments)
(% of Total Investments)
Material changes to the Fund during the period
The Fund added “Consumer Discretionary Sector Risk” disclosure to its summary prospectus as of November 1, 2025. This disclosure was added in light of a larger concentration of portfolio securities in this sector.
This is a summary of certain changes to the Fund since July 1, 2025. For more complete information, you may review the Fund’s prospectus at www.jpmorganfunds.com/funddocuments or upon request at 1-844-457-6383.
The Fund added “Consumer Discretionary Sector Risk” disclosure to its summary prospectus as of November 1, 2025. This disclosure was added in light of a larger concentration of portfolio securities in this sector.
This is a summary of certain changes to the Fund since July 1, 2025. For more complete information, you may review the Fund’s prospectus at www.jpmorganfunds.com/funddocuments or upon request at 1-844-457-6383.
This report describes material changes to the Fund that occurred during the reporting period.
What were the Fund costs for the last year?
(based on a hypothetical $10,000 investment)
| Fund (Class) | Costs of a $10,000 investment |
Costs paid as a percentage of a $10,000 investment |
| JPMorgan Mid Cap Growth Fund (Class A Shares) |
$115 | 1.09% |
How did the Fund Perform?
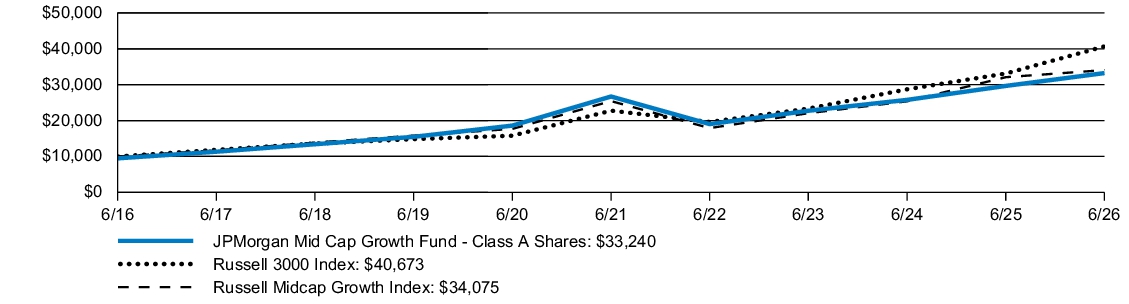
The Fund's Class A Shares, without a sales charge, returned 12.06% for the twelve months ended June 30, 2026. The Russell 3000 Index (the "Index") returned 22.82% and the Russell Midcap Growth Index returned 6.17% for the twelve months ended June 30, 2026.
- The Fund’s security selection in the technology and industrials sectors contributed to relative performance.
- The Fund’s overweight allocations to Ciena and Teradyne contributed to relative performance.
- The Fund’s security selection in the consumer discretionary sector and underweight allocation to the basic materials sector detracted from relative performance.
- The Fund’s underweight allocation to Astera Labs and not owning Targa Resources detracted from relative performance.
Fund Performance
| AVERAGE ANNUAL TOTAL RETURNS | INCEPTION DATE |
1 YEAR | 5 YEAR | 10 YEAR | |||
| JPMorgan Mid Cap Growth Fund (Class A Shares) | February 18, 1992 | 6.17 | % | 3.35 | % | 12.76 | % |
| JPMorgan Mid Cap Growth Fund (Class A Shares) - excluding sales charge | 12.06 | 4.47 | 13.37 | ||||
| Russell 3000 Index | 22.82 | 12.31 | 15.06 | ||||
| Russell Midcap Growth Index | 6.17 | 6.03 | 13.04 |
KEY FUND STATISTICS
| Fund net assets (000's) | $13,213,733 | |
| Total number of portfolio holdings | 118 | |
| Portfolio turnover rate | 78 | % |
| Total advisory fees paid (000's) | $72,076 |
PORTFOLIO COMPOSITION - SECTOR
(% of Total Investments)
(% of Total Investments)
Material changes to the Fund during the period
The Fund added “Consumer Discretionary Sector Risk” disclosure to its summary prospectus as of November 1, 2025. This disclosure was added in light of a larger concentration of portfolio securities in this sector.
This is a summary of certain changes to the Fund since July 1, 2025. For more complete information, you may review the Fund’s prospectus at www.jpmorganfunds.com/funddocuments or upon request at 1-844-457-6383.
The Fund added “Consumer Discretionary Sector Risk” disclosure to its summary prospectus as of November 1, 2025. This disclosure was added in light of a larger concentration of portfolio securities in this sector.
This is a summary of certain changes to the Fund since July 1, 2025. For more complete information, you may review the Fund’s prospectus at www.jpmorganfunds.com/funddocuments or upon request at 1-844-457-6383.
This report describes material changes to the Fund that occurred during the reporting period.
What were the Fund costs for the last year?
(based on a hypothetical $10,000 investment)
| Fund (Class) | Costs of a $10,000 investment |
Costs paid as a percentage of a $10,000 investment |
| JPMorgan Equity Income Fund (Class A Shares) |
$105 | 0.95% |
How did the Fund Perform?
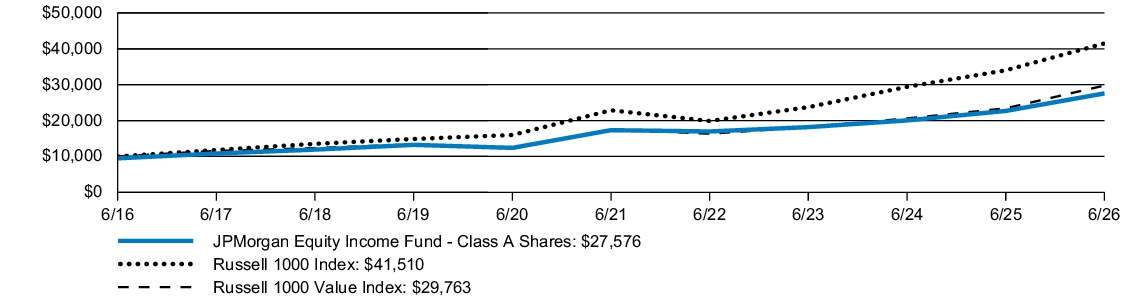
The Fund's Class A Shares, without a sales charge, returned 21.53% for the twelve months ended June 30, 2026. The Russell 1000 Index (the "Index") returned 22.02% and the Russell 1000 Value Index returned 27.12% for the twelve months ended June 30, 2026.
- The Fund's security selection in the information technology and communication services sectors detracted from relative performance.
- The Fund's underweight allocation to Micron Technology and Intel detracted from relative performance.
- The Fund's security selection in the health care and utilities sectors contributed to relative performance.
- The Fund's overweight allocation to Seagate Technology and Corning contributed to relative performance.
Fund Performance
| AVERAGE ANNUAL TOTAL RETURNS | INCEPTION DATE |
1 YEAR | 5 YEAR | 10 YEAR | |||
| JPMorgan Equity Income Fund (Class A Shares) | February 18, 1992 | 15.13 | % | 8.55 | % | 10.68 | % |
| JPMorgan Equity Income Fund (Class A Shares) - excluding sales charge | 21.53 | 9.73 | 11.28 | ||||
| Russell 1000 Index | 22.02 | 12.66 | 15.30 | ||||
| Russell 1000 Value Index | 27.12 | 11.17 | 11.52 |
KEY FUND STATISTICS
| Fund net assets (000's) | $43,500,830 | |
| Total number of portfolio holdings | 83 | |
| Portfolio turnover rate | 38 | % |
| Total advisory fees paid (000's) | $173,069 |
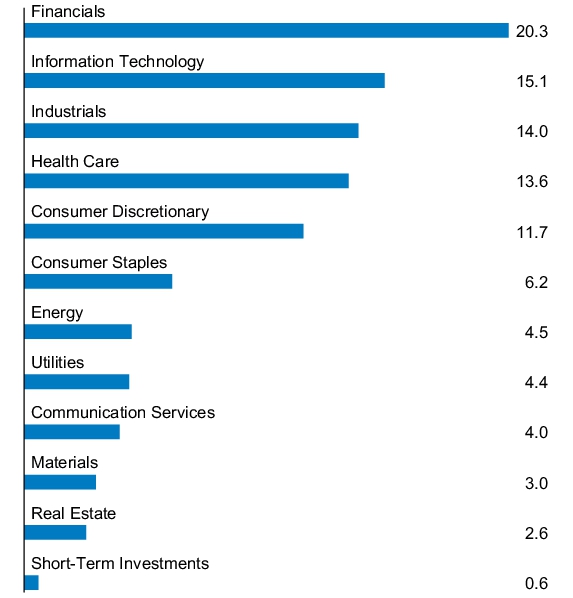
PORTFOLIO COMPOSITION - SECTOR
(% of Total Investments)
(% of Total Investments)
Material changes to the Fund during the period
The Fund added “Industrial Sector Risk” disclosure to its summary prospectus as of November 1, 2025. This disclosure was added in light of a larger concentration of portfolio securities in this sector.
This is a summary of certain changes to the Fund since July 1, 2025. For more complete information, you may review the Fund’s prospectus at www.jpmorganfunds.com/funddocuments or upon request at 1-844-457-6383.
The Fund added “Industrial Sector Risk” disclosure to its summary prospectus as of November 1, 2025. This disclosure was added in light of a larger concentration of portfolio securities in this sector.
This is a summary of certain changes to the Fund since July 1, 2025. For more complete information, you may review the Fund’s prospectus at www.jpmorganfunds.com/funddocuments or upon request at 1-844-457-6383.
This report describes material changes to the Fund that occurred during the reporting period.
What were the Fund costs for the last year?
(based on a hypothetical $10,000 investment)
| Fund (Class) | Costs of a $10,000 investment |
Costs paid as a percentage of a $10,000 investment |
| JPMorgan Equity Income Fund (Class C Shares) |
$160 | 1.45% |
How did the Fund Perform?
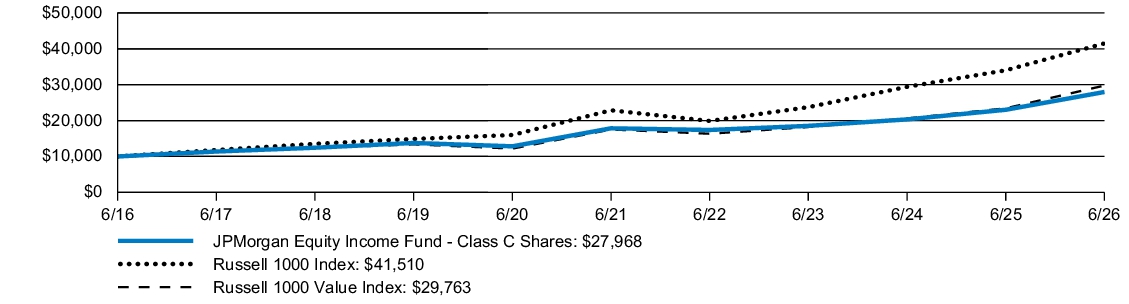
The Fund's Class C Shares, without a sales charge, returned 20.91% for the twelve months ended June 30, 2026. The Russell 1000 Index (the "Index") returned 22.02% and the Russell 1000 Value Index returned 27.12% for the twelve months ended June 30, 2026.
- The Fund's security selection in the information technology and communication services sectors detracted from relative performance.
- The Fund's underweight allocation to Micron Technology and Intel detracted from relative performance.
- The Fund's security selection in the health care and utilities sectors contributed to relative performance.
- The Fund's overweight allocation to Seagate Technology and Corning contributed to relative performance.
Fund Performance
| AVERAGE ANNUAL TOTAL RETURNS | INCEPTION DATE |
1 YEAR | 5 YEAR | 10 YEAR | |||
| JPMorgan Equity Income Fund (Class C Shares) | November 4, 1997 | 19.91 | % | 9.17 | % | 10.83 | % |
| JPMorgan Equity Income Fund (Class C Shares) - excluding sales charge | 20.91 | 9.17 | 10.83 | ||||
| Russell 1000 Index | 22.02 | 12.66 | 15.30 | ||||
| Russell 1000 Value Index | 27.12 | 11.17 | 11.52 |
KEY FUND STATISTICS
| Fund net assets (000's) | $43,500,830 | |
| Total number of portfolio holdings | 83 | |
| Portfolio turnover rate | 38 | % |
| Total advisory fees paid (000's) | $173,069 |
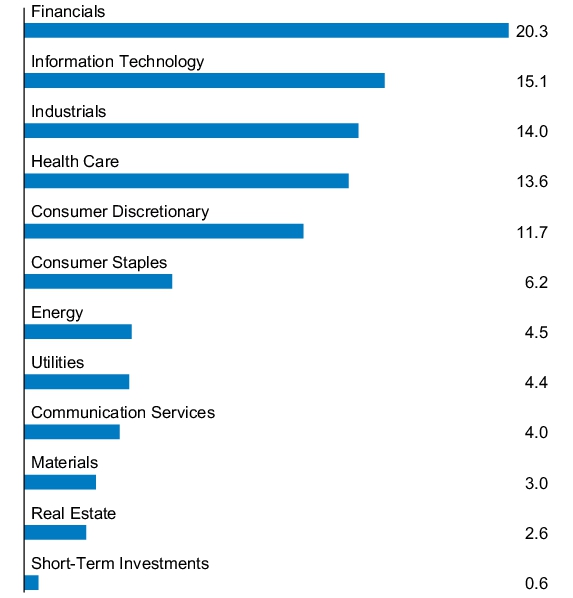
PORTFOLIO COMPOSITION - SECTOR
(% of Total Investments)
(% of Total Investments)
Material changes to the Fund during the period
The Fund added “Industrial Sector Risk” disclosure to its summary prospectus as of November 1, 2025. This disclosure was added in light of a larger concentration of portfolio securities in this sector.
This is a summary of certain changes to the Fund since July 1, 2025. For more complete information, you may review the Fund’s prospectus at www.jpmorganfunds.com/funddocuments or upon request at 1-844-457-6383.
The Fund added “Industrial Sector Risk” disclosure to its summary prospectus as of November 1, 2025. This disclosure was added in light of a larger concentration of portfolio securities in this sector.
This is a summary of certain changes to the Fund since July 1, 2025. For more complete information, you may review the Fund’s prospectus at www.jpmorganfunds.com/funddocuments or upon request at 1-844-457-6383.
This report describes material changes to the Fund that occurred during the reporting period.
What were the Fund costs for the last year?
(based on a hypothetical $10,000 investment)
| Fund (Class) | Costs of a $10,000 investment |
Costs paid as a percentage of a $10,000 investment |
| JPMorgan Equity Income Fund (Class I Shares) |
$77 | 0.69% |
How did the Fund Perform?
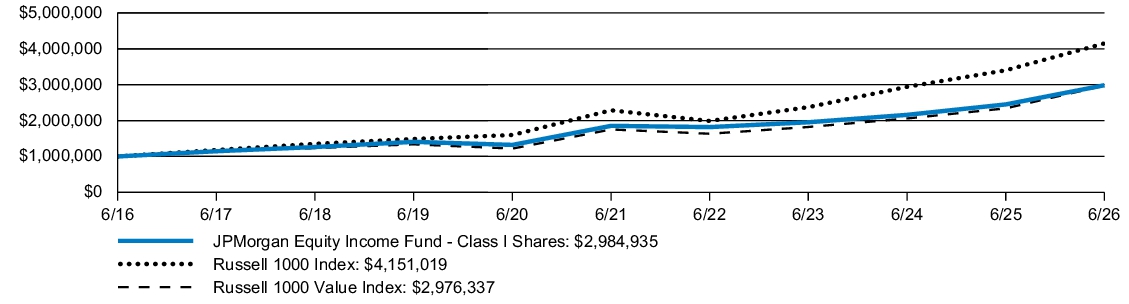
The Fund's Class I Shares returned 21.82% for the twelve months ended June 30, 2026. The Russell 1000 Index (the "Index") returned 22.02% and the Russell 1000 Value Index returned 27.12% for the twelve months ended June 30, 2026.
- The Fund's security selection in the information technology and communication services sectors detracted from relative performance.
- The Fund's underweight allocation to Micron Technology and Intel detracted from relative performance.
- The Fund's security selection in the health care and utilities sectors contributed to relative performance.
- The Fund's overweight allocation to Seagate Technology and Corning contributed to relative performance.
Fund Performance
| AVERAGE ANNUAL TOTAL RETURNS | INCEPTION DATE |
1 YEAR | 5 YEAR | 10 YEAR | |||
| JPMorgan Equity Income Fund (Class I Shares) | July 2, 1987 | 21.82 | % | 10.01 | % | 11.56 | % |
| Russell 1000 Index | 22.02 | 12.66 | 15.30 | ||||
| Russell 1000 Value Index | 27.12 | 11.17 | 11.52 |
KEY FUND STATISTICS
| Fund net assets (000's) | $43,500,830 | |
| Total number of portfolio holdings | 83 | |
| Portfolio turnover rate | 38 | % |
| Total advisory fees paid (000's) | $173,069 |
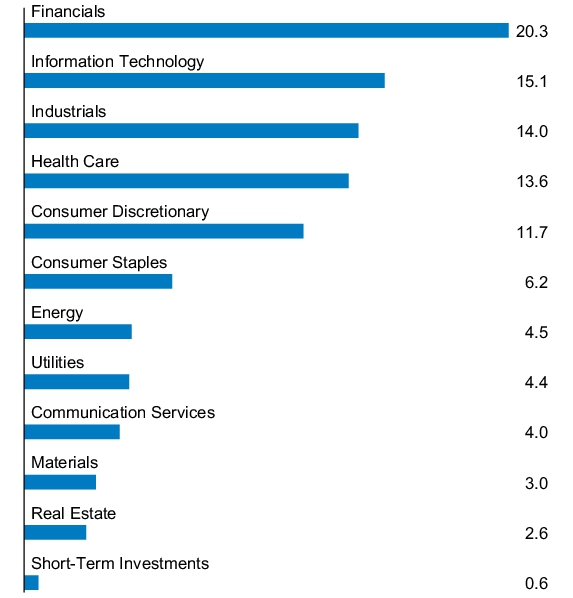
PORTFOLIO COMPOSITION - SECTOR
(% of Total Investments)
(% of Total Investments)
Material changes to the Fund during the period
The Fund added “Industrial Sector Risk” disclosure to its summary prospectus as of November 1, 2025. This disclosure was added in light of a larger concentration of portfolio securities in this sector.
This is a summary of certain changes to the Fund since July 1, 2025. For more complete information, you may review the Fund’s prospectus at www.jpmorganfunds.com/funddocuments or upon request at 1-844-457-6383.
The Fund added “Industrial Sector Risk” disclosure to its summary prospectus as of November 1, 2025. This disclosure was added in light of a larger concentration of portfolio securities in this sector.
This is a summary of certain changes to the Fund since July 1, 2025. For more complete information, you may review the Fund’s prospectus at www.jpmorganfunds.com/funddocuments or upon request at 1-844-457-6383.
This report describes material changes to the Fund that occurred during the reporting period.
What were the Fund costs for the last year?
(based on a hypothetical $10,000 investment)
| Fund (Class) | Costs of a $10,000 investment |
Costs paid as a percentage of a $10,000 investment |
| JPMorgan Equity Income Fund (Class R2 Shares) |
$133 | 1.20% |
How did the Fund Perform?
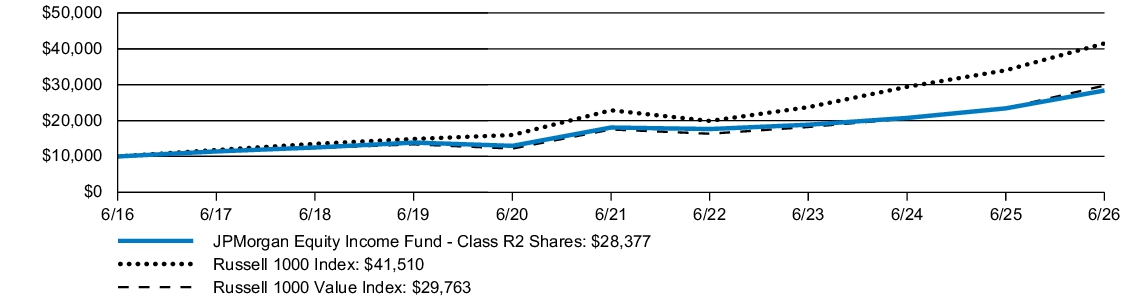
The Fund's Class R2 Shares returned 21.23% for the twelve months ended June 30, 2026. The Russell 1000 Index (the "Index") returned 22.02% and the Russell 1000 Value Index returned 27.12% for the twelve months ended June 30, 2026.
- The Fund's security selection in the information technology and communication services sectors detracted from relative performance.
- The Fund's underweight allocation to Micron Technology and Intel detracted from relative performance.
- The Fund's security selection in the health care and utilities sectors contributed to relative performance.
- The Fund's overweight allocation to Seagate Technology and Corning contributed to relative performance.
Fund Performance
| AVERAGE ANNUAL TOTAL RETURNS | INCEPTION DATE |
1 YEAR | 5 YEAR | 10 YEAR | |||
| JPMorgan Equity Income Fund (Class R2 Shares) | February 28, 2011 | 21.23 | % | 9.45 | % | 10.99 | % |
| Russell 1000 Index | 22.02 | 12.66 | 15.30 | ||||
| Russell 1000 Value Index | 27.12 | 11.17 | 11.52 |
KEY FUND STATISTICS
| Fund net assets (000's) | $43,500,830 | |
| Total number of portfolio holdings | 83 | |
| Portfolio turnover rate | 38 | % |
| Total advisory fees paid (000's) | $173,069 |
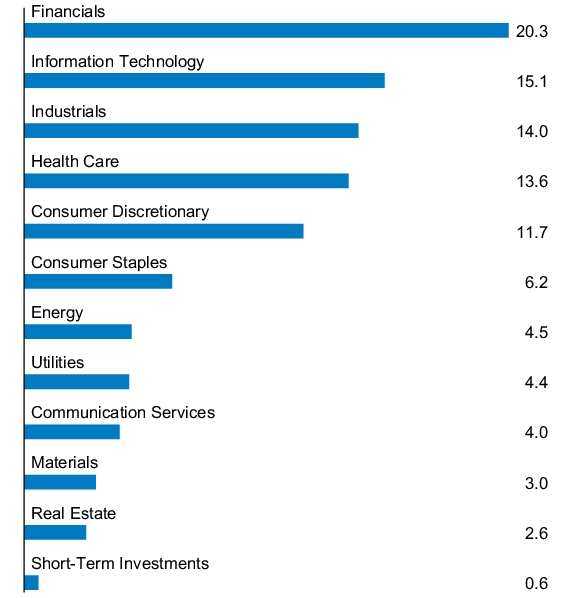
PORTFOLIO COMPOSITION - SECTOR
(% of Total Investments)
(% of Total Investments)
Material changes to the Fund during the period
The Fund added “Industrial Sector Risk” disclosure to its summary prospectus as of November 1, 2025. This disclosure was added in light of a larger concentration of portfolio securities in this sector.
This is a summary of certain changes to the Fund since July 1, 2025. For more complete information, you may review the Fund’s prospectus at www.jpmorganfunds.com/funddocuments or upon request at 1-844-457-6383.
The Fund added “Industrial Sector Risk” disclosure to its summary prospectus as of November 1, 2025. This disclosure was added in light of a larger concentration of portfolio securities in this sector.
This is a summary of certain changes to the Fund since July 1, 2025. For more complete information, you may review the Fund’s prospectus at www.jpmorganfunds.com/funddocuments or upon request at 1-844-457-6383.
This report describes material changes to the Fund that occurred during the reporting period.
What were the Fund costs for the last year?
(based on a hypothetical $10,000 investment)
| Fund (Class) | Costs of a $10,000 investment |
Costs paid as a percentage of a $10,000 investment |
| JPMorgan Equity Income Fund (Class R3 Shares) |
$105 | 0.95% |
How did the Fund Perform?
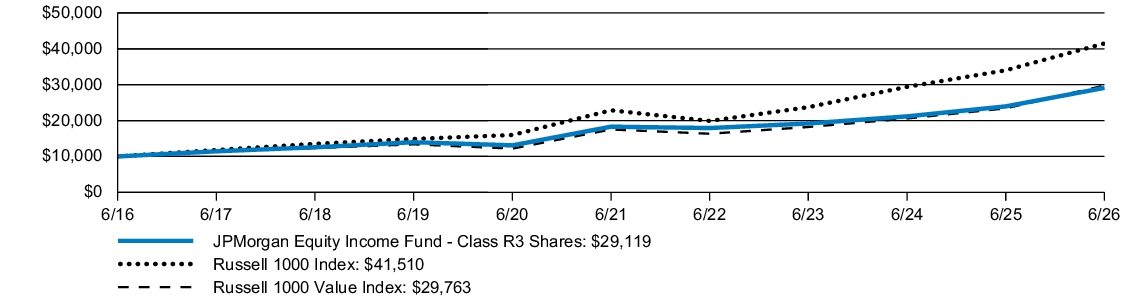
The Fund's Class R3 Shares returned 21.55% for the twelve months ended June 30, 2026. The Russell 1000 Index (the "Index") returned 22.02% and the Russell 1000 Value Index returned 27.12% for the twelve months ended June 30, 2026.
- The Fund's security selection in the information technology and communication services sectors detracted from relative performance.
- The Fund's underweight allocation to Micron Technology and Intel detracted from relative performance.
- The Fund's security selection in the health care and utilities sectors contributed to relative performance.
- The Fund's overweight allocation to Seagate Technology and Corning contributed to relative performance.
Fund Performance
| AVERAGE ANNUAL TOTAL RETURNS | INCEPTION DATE |
1 YEAR | 5 YEAR | 10 YEAR | |||
| JPMorgan Equity Income Fund (Class R3 Shares) | September 9, 2016 | 21.55 | % | 9.73 | % | 11.28 | % |
| Russell 1000 Index | 22.02 | 12.66 | 15.30 | ||||
| Russell 1000 Value Index | 27.12 | 11.17 | 11.52 |
KEY FUND STATISTICS
| Fund net assets (000's) | $43,500,830 | |
| Total number of portfolio holdings | 83 | |
| Portfolio turnover rate | 38 | % |
| Total advisory fees paid (000's) | $173,069 |
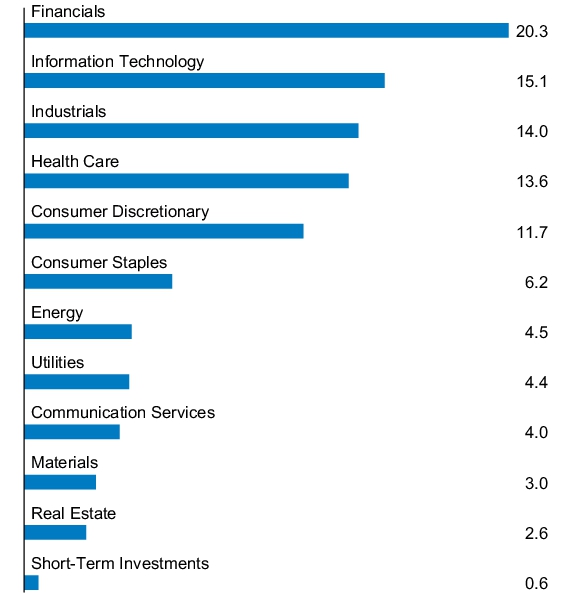
PORTFOLIO COMPOSITION - SECTOR
(% of Total Investments)
(% of Total Investments)
Material changes to the Fund during the period
The Fund added “Industrial Sector Risk” disclosure to its summary prospectus as of November 1, 2025. This disclosure was added in light of a larger concentration of portfolio securities in this sector.
This is a summary of certain changes to the Fund since July 1, 2025. For more complete information, you may review the Fund’s prospectus at www.jpmorganfunds.com/funddocuments or upon request at 1-844-457-6383.
The Fund added “Industrial Sector Risk” disclosure to its summary prospectus as of November 1, 2025. This disclosure was added in light of a larger concentration of portfolio securities in this sector.
This is a summary of certain changes to the Fund since July 1, 2025. For more complete information, you may review the Fund’s prospectus at www.jpmorganfunds.com/funddocuments or upon request at 1-844-457-6383.
This report describes material changes to the Fund that occurred during the reporting period.
What were the Fund costs for the last year?
(based on a hypothetical $10,000 investment)
| Fund (Class) | Costs of a $10,000 investment |
Costs paid as a percentage of a $10,000 investment |
| JPMorgan Equity Income Fund (Class R4 Shares) |
$77 | 0.70% |
How did the Fund Perform?
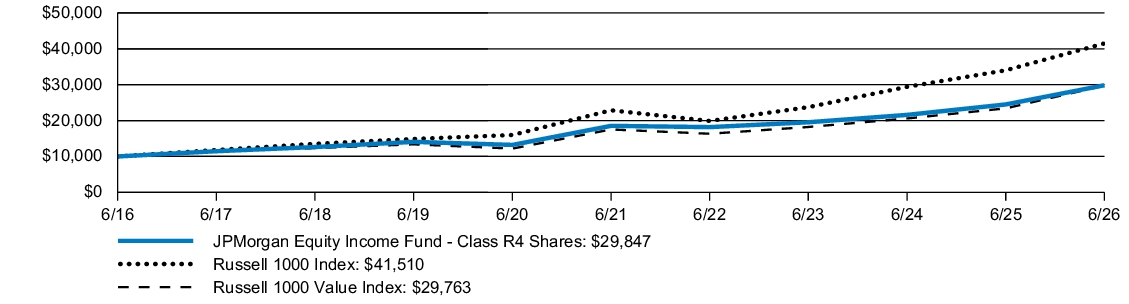
The Fund's Class R4 Shares returned 21.83% for the twelve months ended June 30, 2026. The Russell 1000 Index (the "Index") returned 22.02% and the Russell 1000 Value Index returned 27.12% for the twelve months ended June 30, 2026.
- The Fund's security selection in the information technology and communication services sectors detracted from relative performance.
- The Fund's underweight allocation to Micron Technology and Intel detracted from relative performance.
- The Fund's security selection in the health care and utilities sectors contributed to relative performance.
- The Fund's overweight allocation to Seagate Technology and Corning contributed to relative performance.
Fund Performance
| AVERAGE ANNUAL TOTAL RETURNS | INCEPTION DATE |
1 YEAR | 5 YEAR | 10 YEAR | |||
| JPMorgan Equity Income Fund (Class R4 Shares) | September 9, 2016 | 21.83 | % | 10.00 | % | 11.56 | % |
| Russell 1000 Index | 22.02 | 12.66 | 15.30 | ||||
| Russell 1000 Value Index | 27.12 | 11.17 | 11.52 |
KEY FUND STATISTICS
| Fund net assets (000's) | $43,500,830 | |
| Total number of portfolio holdings | 83 | |
| Portfolio turnover rate | 38 | % |
| Total advisory fees paid (000's) | $173,069 |
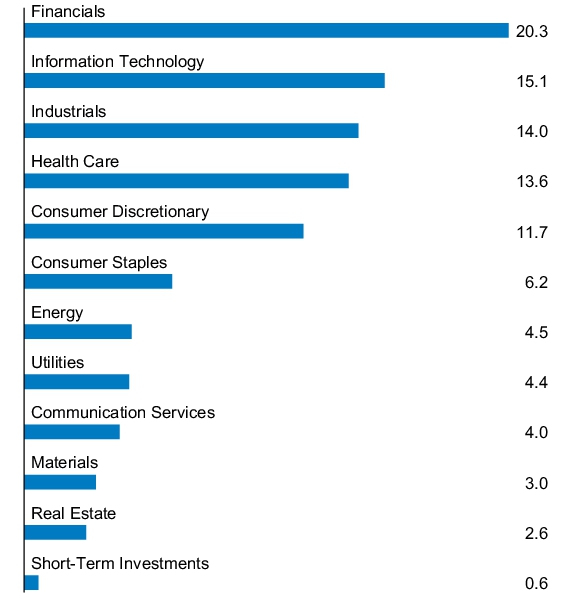
PORTFOLIO COMPOSITION - SECTOR
(% of Total Investments)
(% of Total Investments)
Material changes to the Fund during the period
The Fund added “Industrial Sector Risk” disclosure to its summary prospectus as of November 1, 2025. This disclosure was added in light of a larger concentration of portfolio securities in this sector.
This is a summary of certain changes to the Fund since July 1, 2025. For more complete information, you may review the Fund’s prospectus at www.jpmorganfunds.com/funddocuments or upon request at 1-844-457-6383.
The Fund added “Industrial Sector Risk” disclosure to its summary prospectus as of November 1, 2025. This disclosure was added in light of a larger concentration of portfolio securities in this sector.
This is a summary of certain changes to the Fund since July 1, 2025. For more complete information, you may review the Fund’s prospectus at www.jpmorganfunds.com/funddocuments or upon request at 1-844-457-6383.
This report describes material changes to the Fund that occurred during the reporting period.
What were the Fund costs for the last year?
(based on a hypothetical $10,000 investment)
| Fund (Class) | Costs of a $10,000 investment |
Costs paid as a percentage of a $10,000 investment |
| JPMorgan Equity Income Fund (Class R5 Shares) |
$61 | 0.55% |
How did the Fund Perform?
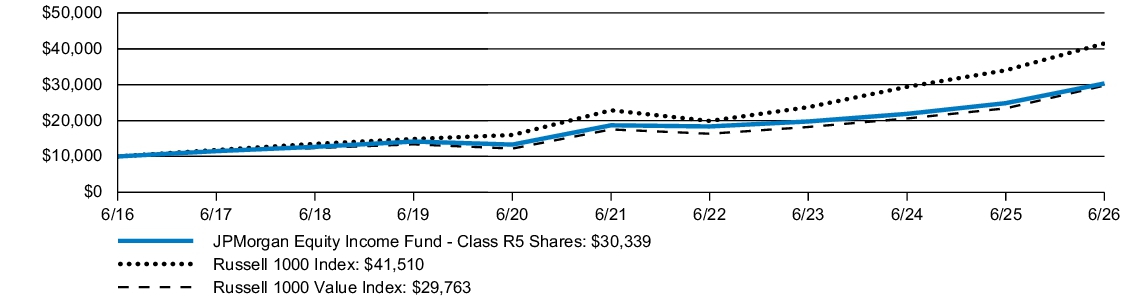
The Fund's Class R5 Shares returned 22.06% for the twelve months ended June 30, 2026. The Russell 1000 Index (the "Index") returned 22.02% and the Russell 1000 Value Index returned 27.12% for the twelve months ended June 30, 2026.
- The Fund's security selection in the information technology and communication services sectors detracted from relative performance.
- The Fund's underweight allocation to Micron Technology and Intel detracted from relative performance.
- The Fund's security selection in the health care and utilities sectors contributed to relative performance.
- The Fund's overweight allocation to Seagate Technology and Corning contributed to relative performance.
Fund Performance
| AVERAGE ANNUAL TOTAL RETURNS | INCEPTION DATE |
1 YEAR | 5 YEAR | 10 YEAR | |||
| JPMorgan Equity Income Fund (Class R5 Shares) | February 28, 2011 | 22.06 | % | 10.18 | % | 11.74 | % |
| Russell 1000 Index | 22.02 | 12.66 | 15.30 | ||||
| Russell 1000 Value Index | 27.12 | 11.17 | 11.52 |
KEY FUND STATISTICS
| Fund net assets (000's) | $43,500,830 | |
| Total number of portfolio holdings | 83 | |
| Portfolio turnover rate | 38 | % |
| Total advisory fees paid (000's) | $173,069 |
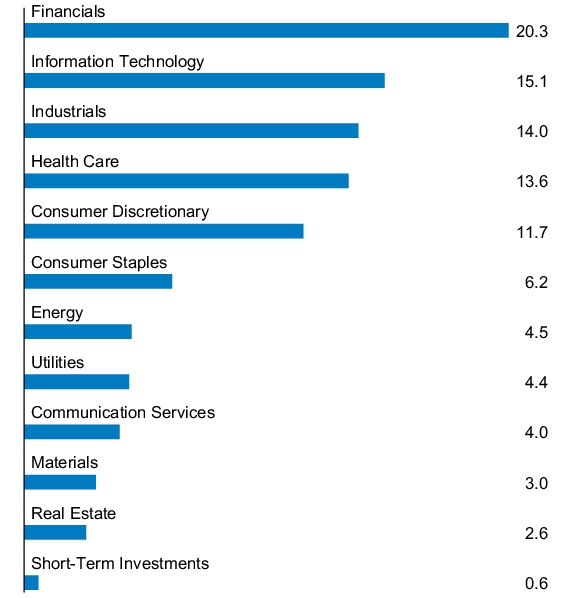
PORTFOLIO COMPOSITION - SECTOR
(% of Total Investments)
(% of Total Investments)
Material changes to the Fund during the period
The Fund added “Industrial Sector Risk” disclosure to its summary prospectus as of November 1, 2025. This disclosure was added in light of a larger concentration of portfolio securities in this sector.
This is a summary of certain changes to the Fund since July 1, 2025. For more complete information, you may review the Fund’s prospectus at www.jpmorganfunds.com/funddocuments or upon request at 1-844-457-6383.
The Fund added “Industrial Sector Risk” disclosure to its summary prospectus as of November 1, 2025. This disclosure was added in light of a larger concentration of portfolio securities in this sector.
This is a summary of certain changes to the Fund since July 1, 2025. For more complete information, you may review the Fund’s prospectus at www.jpmorganfunds.com/funddocuments or upon request at 1-844-457-6383.
This report describes material changes to the Fund that occurred during the reporting period.
What were the Fund costs for the last year?
(based on a hypothetical $10,000 investment)
| Fund (Class) | Costs of a $10,000 investment |
Costs paid as a percentage of a $10,000 investment |
| JPMorgan Equity Income Fund (Class R6 Shares) |
$50 | 0.45% |
How did the Fund Perform?
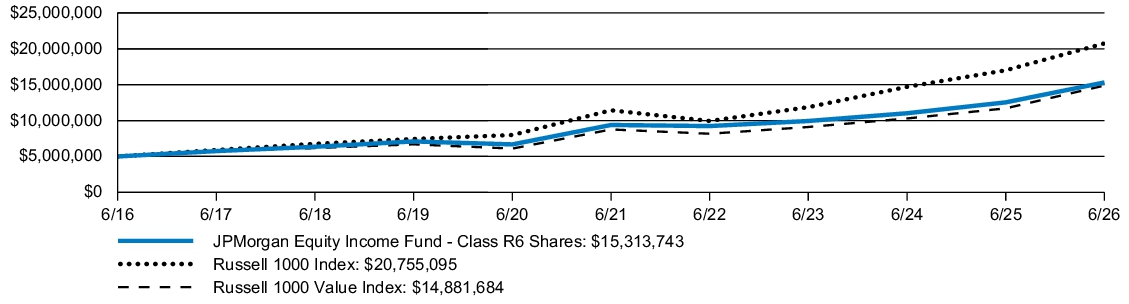
The Fund's Class R6 Shares returned 22.12% for the twelve months ended June 30, 2026. The Russell 1000 Index (the "Index") returned 22.02% and the Russell 1000 Value Index returned 27.12% for the twelve months ended June 30, 2026.
- The Fund's security selection in the information technology and communication services sectors detracted from relative performance.
- The Fund's underweight allocation to Micron Technology and Intel detracted from relative performance.
- The Fund's security selection in the health care and utilities sectors contributed to relative performance.
- The Fund's overweight allocation to Seagate Technology and Corning contributed to relative performance.
Fund Performance
| AVERAGE ANNUAL TOTAL RETURNS | INCEPTION DATE |
1 YEAR | 5 YEAR | 10 YEAR | |||
| JPMorgan Equity Income Fund (Class R6 Shares) | January 31, 2012 | 22.12 | % | 10.28 | % | 11.84 | % |
| Russell 1000 Index | 22.02 | 12.66 | 15.30 | ||||
| Russell 1000 Value Index | 27.12 | 11.17 | 11.52 |
KEY FUND STATISTICS
| Fund net assets (000's) | $43,500,830 | |
| Total number of portfolio holdings | 83 | |
| Portfolio turnover rate | 38 | % |
| Total advisory fees paid (000's) | $173,069 |
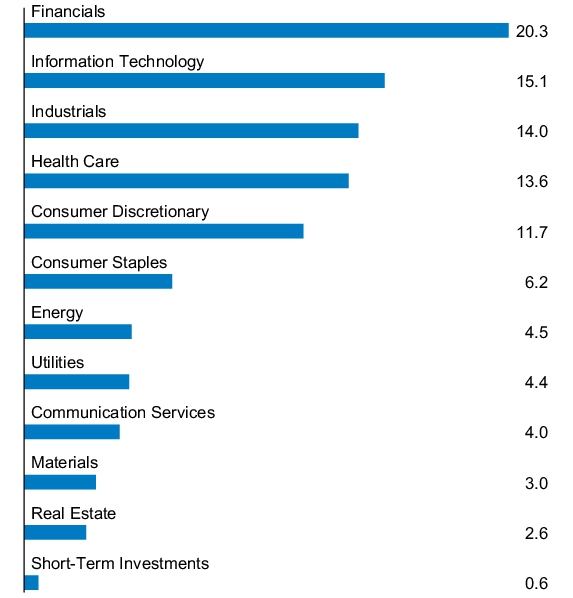
PORTFOLIO COMPOSITION - SECTOR
(% of Total Investments)
(% of Total Investments)
Material changes to the Fund during the period
The Fund added “Industrial Sector Risk” disclosure to its summary prospectus as of November 1, 2025. This disclosure was added in light of a larger concentration of portfolio securities in this sector.
This is a summary of certain changes to the Fund since July 1, 2025. For more complete information, you may review the Fund’s prospectus at www.jpmorganfunds.com/funddocuments or upon request at 1-844-457-6383.
The Fund added “Industrial Sector Risk” disclosure to its summary prospectus as of November 1, 2025. This disclosure was added in light of a larger concentration of portfolio securities in this sector.
This is a summary of certain changes to the Fund since July 1, 2025. For more complete information, you may review the Fund’s prospectus at www.jpmorganfunds.com/funddocuments or upon request at 1-844-457-6383.
This report describes material changes to the Fund that occurred during the reporting period.
What were the Fund costs for the last year?
(based on a hypothetical $10,000 investment)
| Fund (Class) | Costs of a $10,000 investment |
Costs paid as a percentage of a $10,000 investment |
| JPMorgan Equity Index Fund (Class R6 Shares) |
$5 | 0.04% |
How did the Fund Perform?
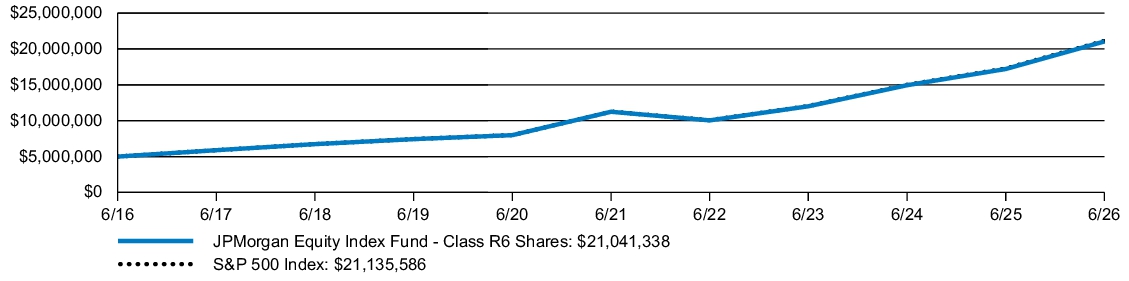
The Fund's Class R6 Shares returned 22.27% for the twelve months ended June 30, 2026. The S&P 500 Index (the "Index") returned 22.32% for the twelve months ended June 30, 2026.
- Consistent with its indexing strategy, the Fund closely tracked the total return of the Index.
- For the twelve months ended June 30, 2026, U.S. large-cap equities provided strong returns as results were supported by solid earnings growth. Earnings improved as results came in better than expected. Leadership remained concentrated in mega-cap technology, helped by continued AI enthusiasm and investment. Volatility persisted at times as investors weighed macro and policy risks. Oil price moves tied to the U.S.-Iran conflict added to inflation concerns and contributed to market uncertainty.
- All sectors in the Index produced positive returns. Information technology and energy were the best performing sectors, with both providing returns over 20%. Financials and consumer staples were the lowest returning sectors, with both in the mid-single-digit range.
- The Fund achieved its indexing objective by following a full replication approach, owning all stocks in the Index in nearly the same weights. Further cash was minimized, and cash held was equitized with futures to limit any drag on performance.
Fund Performance
| AVERAGE ANNUAL TOTAL RETURNS | INCEPTION DATE |
1 YEAR | 5 YEAR | 10 YEAR | |||
| JPMorgan Equity Index Fund (Class R6 Shares) | September 1, 2016 | 22.27 | % | 13.35 | % | 15.45 | % |
| S&P 500 Index | 22.32 | 13.41 | 15.51 |
KEY FUND STATISTICS
| Fund net assets (000's) | $13,895,155 | |
| Total number of portfolio holdings | 508 | |
| Portfolio turnover rate | 9 | % |
| Total advisory fees paid (000's) | $0 |
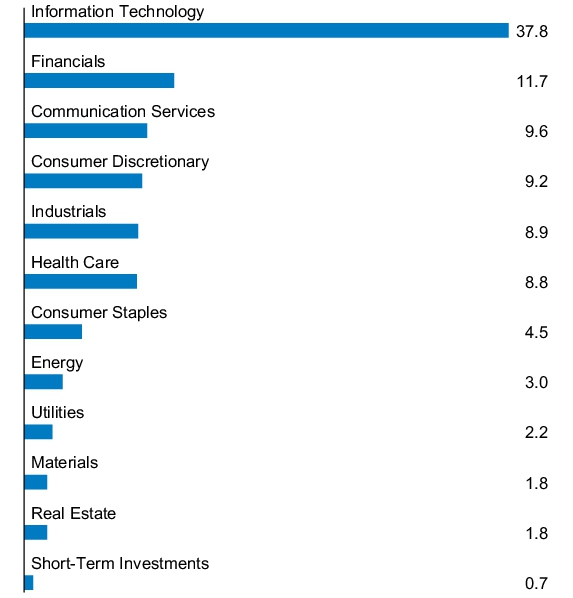
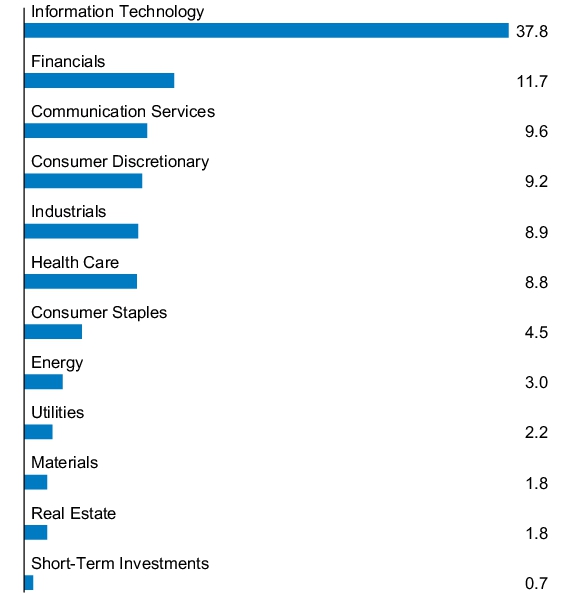
PORTFOLIO COMPOSITION - SECTOR
(% of Total Investments)
(% of Total Investments)
Material changes to the Fund during the period
The Fund added “Diversification Risk” to its prospectus as of December 1, 2025. This disclosure was added because the Fund, which is classified as “diversified” under the 1940 Act, may operate as a “non-diversified” fund, as defined by the 1940 Act, to the approximate extent the S&P 500 Index is non-diversified. The Fund may, therefore, operate as a non-diversified fund solely as a result of a change in the relative market capitalization or index weighting of one or more constituents of the S&P 500 Index. A non-diversified fund may invest a greater percentage of its assets in a particular issuer or group of issuers than a diversified fund would. This increased investment in fewer issuers may result in the Fund’s shares being more sensitive to economic results of those issuing the securities. The value of the Fund’s shares may also be more volatile than the value of a fund which invests in more securities.
This is a summary of certain changes to the Fund since July 1, 2025. For more complete information, you may review the Fund’s prospectus at www.jpmorganfunds.com/funddocuments or upon request at 1-800-480-4111.
The Fund added “Diversification Risk” to its prospectus as of December 1, 2025. This disclosure was added because the Fund, which is classified as “diversified” under the 1940 Act, may operate as a “non-diversified” fund, as defined by the 1940 Act, to the approximate extent the S&P 500 Index is non-diversified. The Fund may, therefore, operate as a non-diversified fund solely as a result of a change in the relative market capitalization or index weighting of one or more constituents of the S&P 500 Index. A non-diversified fund may invest a greater percentage of its assets in a particular issuer or group of issuers than a diversified fund would. This increased investment in fewer issuers may result in the Fund’s shares being more sensitive to economic results of those issuing the securities. The value of the Fund’s shares may also be more volatile than the value of a fund which invests in more securities.
This is a summary of certain changes to the Fund since July 1, 2025. For more complete information, you may review the Fund’s prospectus at www.jpmorganfunds.com/funddocuments or upon request at 1-800-480-4111.
This report describes material changes to the Fund that occurred during the reporting period.
What were the Fund costs for the last year?
(based on a hypothetical $10,000 investment)
| Fund (Class) | Costs of a $10,000 investment |
Costs paid as a percentage of a $10,000 investment |
| JPMorgan Equity Index Fund (Class I Shares) |
$22 | 0.20% |
How did the Fund Perform?
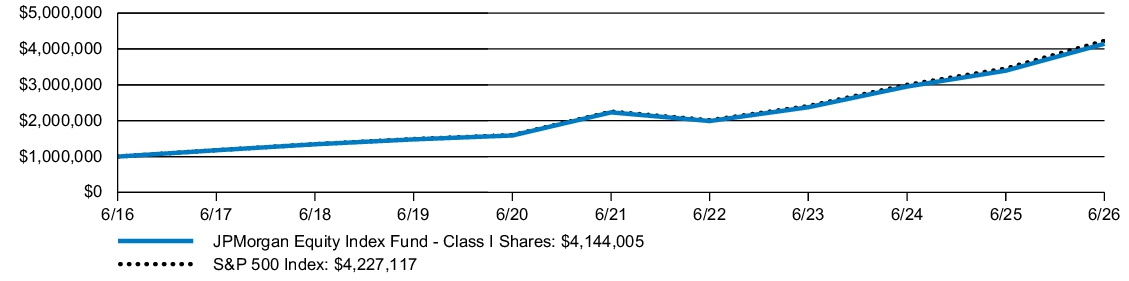
The Fund's Class I Shares returned 22.09% for the twelve months ended June 30, 2026. The S&P 500 Index (the "Index") returned 22.32% for the twelve months ended June 30, 2026.
- Consistent with its indexing strategy, the Fund closely tracked the total return of the Index.
- For the twelve months ended June 30, 2026, U.S. large-cap equities provided strong returns as results were supported by solid earnings growth. Earnings improved as results came in better than expected. Leadership remained concentrated in mega-cap technology, helped by continued AI enthusiasm and investment. Volatility persisted at times as investors weighed macro and policy risks. Oil price moves tied to the U.S.-Iran conflict added to inflation concerns and contributed to market uncertainty.
- All sectors in the Index produced positive returns. Information technology and energy were the best performing sectors, with both providing returns over 20%. Financials and consumer staples were the lowest returning sectors, with both in the mid-single-digit range.
- The Fund achieved its indexing objective by following a full replication approach, owning all stocks in the Index in nearly the same weights. Further cash was minimized, and cash held was equitized with futures to limit any drag on performance.
Fund Performance
| AVERAGE ANNUAL TOTAL RETURNS | INCEPTION DATE |
1 YEAR | 5 YEAR | 10 YEAR | |||
| JPMorgan Equity Index Fund (Class I Shares) | July 2, 1991 | 22.09 | % | 13.17 | % | 15.28 | % |
| S&P 500 Index | 22.32 | 13.41 | 15.51 |
KEY FUND STATISTICS
| Fund net assets (000's) | $13,895,155 | |
| Total number of portfolio holdings | 508 | |
| Portfolio turnover rate | 9 | % |
| Total advisory fees paid (000's) | $0 |
PORTFOLIO COMPOSITION - SECTOR
(% of Total Investments)
(% of Total Investments)
Material changes to the Fund during the period
The Fund added “Diversification Risk” to its prospectus as of December 1, 2025. This disclosure was added because the Fund, which is classified as “diversified” under the 1940 Act, may operate as a “non-diversified” fund, as defined by the 1940 Act, to the approximate extent the S&P 500 Index is non-diversified. The Fund may, therefore, operate as a non-diversified fund solely as a result of a change in the relative market capitalization or index weighting of one or more constituents of the S&P 500 Index. A non-diversified fund may invest a greater percentage of its assets in a particular issuer or group of issuers than a diversified fund would. This increased investment in fewer issuers may result in the Fund’s shares being more sensitive to economic results of those issuing the securities. The value of the Fund’s shares may also be more volatile than the value of a fund which invests in more securities.
This is a summary of certain changes to the Fund since July 1, 2025. For more complete information, you may review the Fund’s prospectus at www.jpmorganfunds.com/funddocuments or upon request at 1-800-480-4111.
The Fund added “Diversification Risk” to its prospectus as of December 1, 2025. This disclosure was added because the Fund, which is classified as “diversified” under the 1940 Act, may operate as a “non-diversified” fund, as defined by the 1940 Act, to the approximate extent the S&P 500 Index is non-diversified. The Fund may, therefore, operate as a non-diversified fund solely as a result of a change in the relative market capitalization or index weighting of one or more constituents of the S&P 500 Index. A non-diversified fund may invest a greater percentage of its assets in a particular issuer or group of issuers than a diversified fund would. This increased investment in fewer issuers may result in the Fund’s shares being more sensitive to economic results of those issuing the securities. The value of the Fund’s shares may also be more volatile than the value of a fund which invests in more securities.
This is a summary of certain changes to the Fund since July 1, 2025. For more complete information, you may review the Fund’s prospectus at www.jpmorganfunds.com/funddocuments or upon request at 1-800-480-4111.
This report describes material changes to the Fund that occurred during the reporting period.
What were the Fund costs for the last year?
(based on a hypothetical $10,000 investment)
| Fund (Class) | Costs of a $10,000 investment |
Costs paid as a percentage of a $10,000 investment |
| JPMorgan Equity Index Fund (Class C Shares) |
$116 | 1.05% |
How did the Fund Perform?
The Fund's Class C Shares, without a sales charge, returned 21.04% for the twelve months ended June 30, 2026. The S&P 500 Index (the "Index") returned 22.32% for the twelve months ended June 30, 2026.
- Consistent with its indexing strategy, the Fund closely tracked the total return of the Index.
- For the twelve months ended June 30, 2026, U.S. large-cap equities provided strong returns as results were supported by solid earnings growth. Earnings improved as results came in better than expected. Leadership remained concentrated in mega-cap technology, helped by continued AI enthusiasm and investment. Volatility persisted at times as investors weighed macro and policy risks. Oil price moves tied to the U.S.-Iran conflict added to inflation concerns and contributed to market uncertainty.
- All sectors in the Index produced positive returns. Information technology and energy were the best performing sectors, with both providing returns over 20%. Financials and consumer staples were the lowest returning sectors, with both in the mid-single-digit range.
- The Fund achieved its indexing objective by following a full replication approach, owning all stocks in the Index in nearly the same weights. Further cash was minimized, and cash held was equitized with futures to limit any drag on performance.
Fund Performance
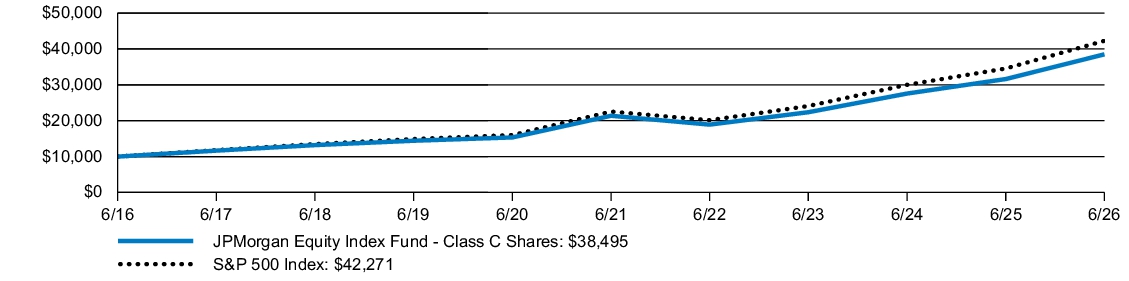
| AVERAGE ANNUAL TOTAL RETURNS | INCEPTION DATE |
1 YEAR | 5 YEAR | 10 YEAR | |||
| JPMorgan Equity Index Fund (Class C Shares) | November 4, 1997 | 20.04 | % | 12.22 | % | 14.43 | % |
| JPMorgan Equity Index Fund (Class C Shares) - excluding sales charge | 21.04 | 12.22 | 14.43 | ||||
| S&P 500 Index | 22.32 | 13.41 | 15.51 |
KEY FUND STATISTICS
| Fund net assets (000's) | $13,895,155 | |
| Total number of portfolio holdings | 508 | |
| Portfolio turnover rate | 9 | % |
| Total advisory fees paid (000's) | $0 |
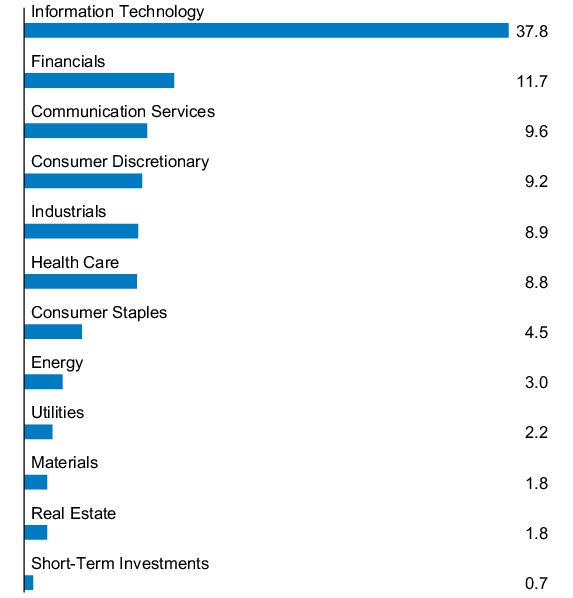
PORTFOLIO COMPOSITION - SECTOR
(% of Total Investments)
(% of Total Investments)
Material changes to the Fund during the period
The Fund added “Diversification Risk” to its prospectus as of December 1, 2025. This disclosure was added because the Fund, which is classified as “diversified” under the 1940 Act, may operate as a “non-diversified” fund, as defined by the 1940 Act, to the approximate extent the S&P 500 Index is non-diversified. The Fund may, therefore, operate as a non-diversified fund solely as a result of a change in the relative market capitalization or index weighting of one or more constituents of the S&P 500 Index. A non-diversified fund may invest a greater percentage of its assets in a particular issuer or group of issuers than a diversified fund would. This increased investment in fewer issuers may result in the Fund’s shares being more sensitive to economic results of those issuing the securities. The value of the Fund’s shares may also be more volatile than the value of a fund which invests in more securities.
This is a summary of certain changes to the Fund since July 1, 2025. For more complete information, you may review the Fund’s prospectus at www.jpmorganfunds.com/funddocuments or upon request at 1-800-480-4111.
The Fund added “Diversification Risk” to its prospectus as of December 1, 2025. This disclosure was added because the Fund, which is classified as “diversified” under the 1940 Act, may operate as a “non-diversified” fund, as defined by the 1940 Act, to the approximate extent the S&P 500 Index is non-diversified. The Fund may, therefore, operate as a non-diversified fund solely as a result of a change in the relative market capitalization or index weighting of one or more constituents of the S&P 500 Index. A non-diversified fund may invest a greater percentage of its assets in a particular issuer or group of issuers than a diversified fund would. This increased investment in fewer issuers may result in the Fund’s shares being more sensitive to economic results of those issuing the securities. The value of the Fund’s shares may also be more volatile than the value of a fund which invests in more securities.
This is a summary of certain changes to the Fund since July 1, 2025. For more complete information, you may review the Fund’s prospectus at www.jpmorganfunds.com/funddocuments or upon request at 1-800-480-4111.
This report describes material changes to the Fund that occurred during the reporting period.
What were the Fund costs for the last year?
(based on a hypothetical $10,000 investment)
| Fund (Class) | Costs of a $10,000 investment |
Costs paid as a percentage of a $10,000 investment |
| JPMorgan Equity Index Fund (Class A Shares) |
$50 | 0.45% |
How did the Fund Perform?
The Fund's Class A Shares, without a sales charge, returned 21.77% for the twelve months ended June 30, 2026. The S&P 500 Index (the "Index") returned 22.32% for the twelve months ended June 30, 2026.
- Consistent with its indexing strategy, the Fund closely tracked the total return of the Index.
- For the twelve months ended June 30, 2026, U.S. large-cap equities provided strong returns as results were supported by solid earnings growth. Earnings improved as results came in better than expected. Leadership remained concentrated in mega-cap technology, helped by continued AI enthusiasm and investment. Volatility persisted at times as investors weighed macro and policy risks. Oil price moves tied to the U.S.-Iran conflict added to inflation concerns and contributed to market uncertainty.
- All sectors in the Index produced positive returns. Information technology and energy were the best performing sectors, with both providing returns over 20%. Financials and consumer staples were the lowest returning sectors, with both in the mid-single-digit range.
- The Fund achieved its indexing objective by following a full replication approach, owning all stocks in the Index in nearly the same weights. Further cash was minimized, and cash held was equitized with futures to limit any drag on performance.
Fund Performance
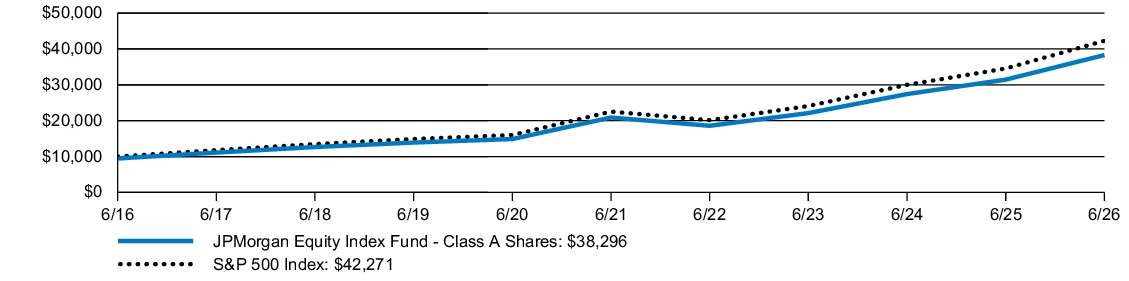
| AVERAGE ANNUAL TOTAL RETURNS | INCEPTION DATE |
1 YEAR | 5 YEAR | 10 YEAR | |||
| JPMorgan Equity Index Fund (Class A Shares) | February 18, 1992 | 15.38 | % | 11.68 | % | 14.37 | % |
| JPMorgan Equity Index Fund (Class A Shares) - excluding sales charge | 21.77 | 12.89 | 14.99 | ||||
| S&P 500 Index | 22.32 | 13.41 | 15.51 |
KEY FUND STATISTICS
| Fund net assets (000's) | $13,895,155 | |
| Total number of portfolio holdings | 508 | |
| Portfolio turnover rate | 9 | % |
| Total advisory fees paid (000's) | $0 |
PORTFOLIO COMPOSITION - SECTOR
(% of Total Investments)
(% of Total Investments)
Material changes to the Fund during the period
The Fund added “Diversification Risk” to its prospectus as of December 1, 2025. This disclosure was added because the Fund, which is classified as “diversified” under the 1940 Act, may operate as a “non-diversified” fund, as defined by the 1940 Act, to the approximate extent the S&P 500 Index is non-diversified. The Fund may, therefore, operate as a non-diversified fund solely as a result of a change in the relative market capitalization or index weighting of one or more constituents of the S&P 500 Index. A non-diversified fund may invest a greater percentage of its assets in a particular issuer or group of issuers than a diversified fund would. This increased investment in fewer issuers may result in the Fund’s shares being more sensitive to economic results of those issuing the securities. The value of the Fund’s shares may also be more volatile than the value of a fund which invests in more securities.
This is a summary of certain changes to the Fund since July 1, 2025. For more complete information, you may review the Fund’s prospectus at www.jpmorganfunds.com/funddocuments or upon request at 1-800-480-4111.
The Fund added “Diversification Risk” to its prospectus as of December 1, 2025. This disclosure was added because the Fund, which is classified as “diversified” under the 1940 Act, may operate as a “non-diversified” fund, as defined by the 1940 Act, to the approximate extent the S&P 500 Index is non-diversified. The Fund may, therefore, operate as a non-diversified fund solely as a result of a change in the relative market capitalization or index weighting of one or more constituents of the S&P 500 Index. A non-diversified fund may invest a greater percentage of its assets in a particular issuer or group of issuers than a diversified fund would. This increased investment in fewer issuers may result in the Fund’s shares being more sensitive to economic results of those issuing the securities. The value of the Fund’s shares may also be more volatile than the value of a fund which invests in more securities.
This is a summary of certain changes to the Fund since July 1, 2025. For more complete information, you may review the Fund’s prospectus at www.jpmorganfunds.com/funddocuments or upon request at 1-800-480-4111.
What were the Fund costs for the last year?
(based on a hypothetical $10,000 investment)
| Fund (Class) | Costs of a $10,000 investment |
Costs paid as a percentage of a $10,000 investment |
| JPMorgan SMID Cap Equity Fund (Class A Shares) |
$115 | 1.09% |
How did the Fund Perform?
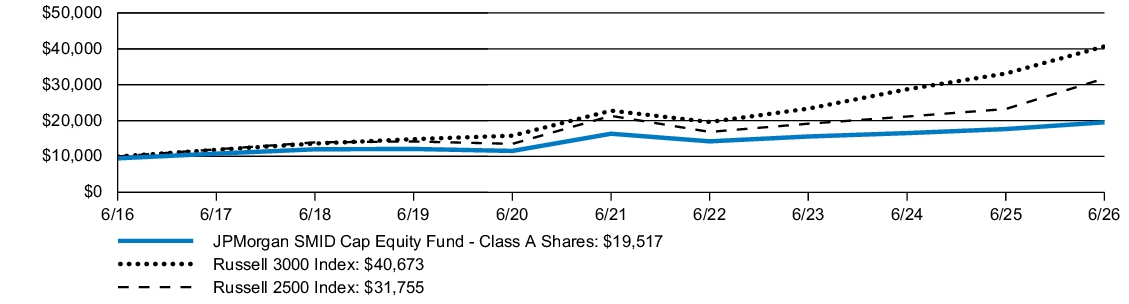
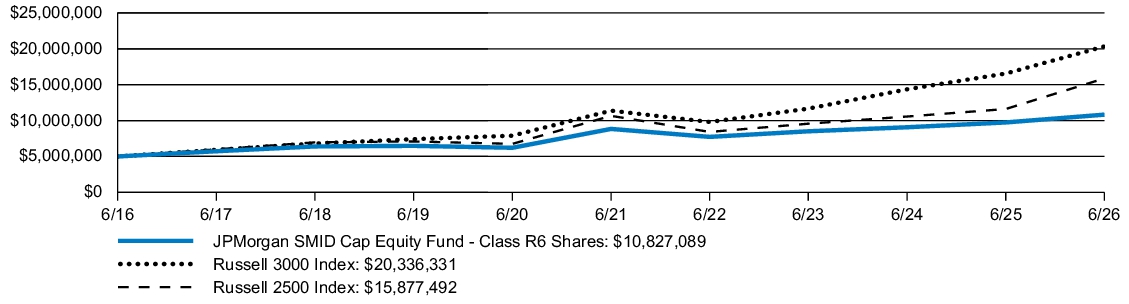
The JPMorgan SMID Cap Equity Fund's Class A Shares, without a sales charge, returned 10.64% for the twelve months ended June 30, 2026. The Russell 3000 Index returned 22.82% and the Russell 2500 Index (the "Index") returned 36.72% for the twelve months ended June 30, 2026.
- The Fund's security selection in financials and technology detracted from performance.
- The Fund's security selection in basic materials and consumer staples contributed to performance.
- The Fund's underweight allocation to Sandisk and overweight allocation to Morningstar detracted from performance.
- The Fund's overweight allocation to MACOM Technology Solutions and Entegris contributed to performance.
Fund Performance
| AVERAGE ANNUAL TOTAL RETURNS | INCEPTION DATE |
1 YEAR | 5 YEAR | 10 YEAR | |||
| JPMorgan SMID Cap Equity Fund (Class A Shares) | May 1, 1992 | 4.81 | % | 2.51 | % | 6.92 | % |
| JPMorgan SMID Cap Equity Fund (Class A Shares) - excluding sales charge | 10.64 | 3.62 | 7.49 | ||||
| Russell 3000 Index | 22.82 | 12.31 | 15.06 | ||||
| Russell 2500 Index | 36.72 | 8.30 | 12.25 |
KEY FUND STATISTICS
| Fund net assets (000's) | $314,568 | |
| Total number of portfolio holdings | 116 | |
| Portfolio turnover rate | 60 | % |
| Total advisory fees paid (000's) | $1,493 |
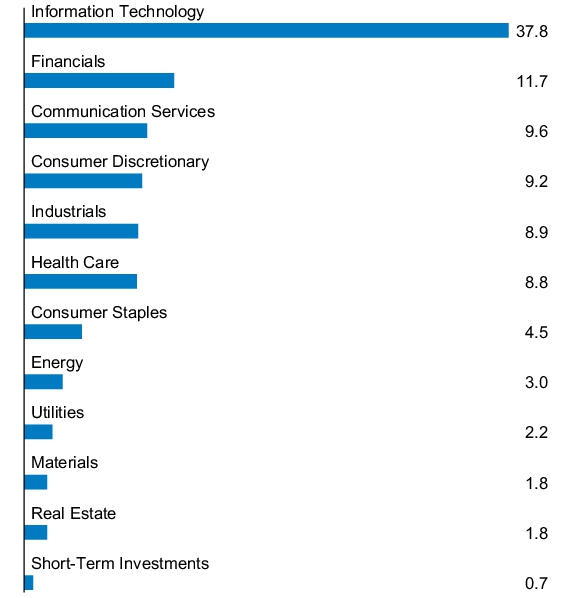
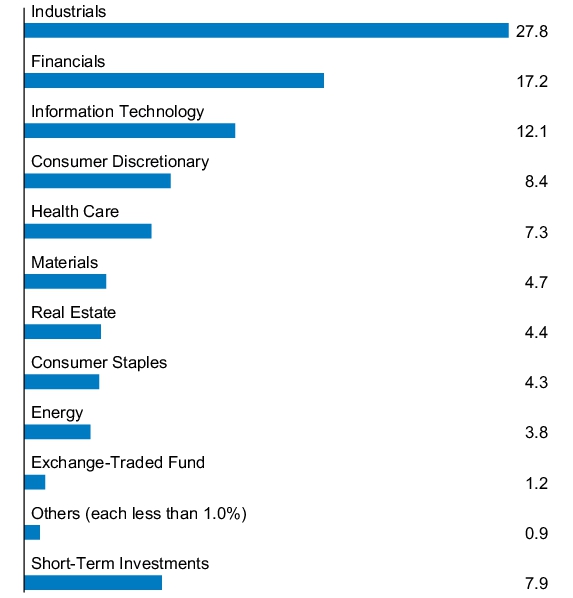
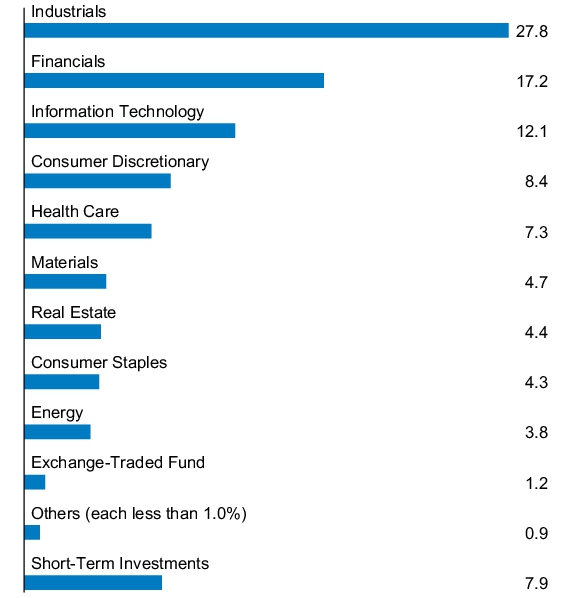
PORTFOLIO COMPOSITION - SECTOR
(% of Total Investments)
(% of Total Investments)
What were the Fund costs for the last year?
(based on a hypothetical $10,000 investment)
| Fund (Class) | Costs of a $10,000 investment |
Costs paid as a percentage of a $10,000 investment |
| JPMorgan SMID Cap Equity Fund (Class C Shares) |
$167 | 1.59% |
How did the Fund Perform?
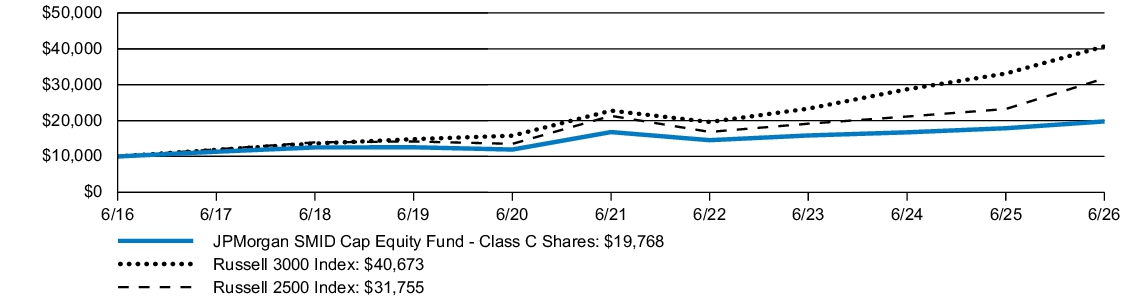
The JPMorgan SMID Cap Equity Fund's Class C Shares, without a sales charge, returned 10.03% for the twelve months ended June 30, 2026. The Russell 3000 Index returned 22.82% and the Russell 2500 Index (the "Index") returned 36.72% for the twelve months ended June 30, 2026.
- The Fund's security selection in financials and technology detracted from performance.
- The Fund's security selection in basic materials and consumer staples contributed to performance.
- The Fund's underweight allocation to Sandisk and overweight allocation to Morningstar detracted from performance.
- The Fund's overweight allocation to MACOM Technology Solutions and Entegris contributed to performance.
Fund Performance
| AVERAGE ANNUAL TOTAL RETURNS | INCEPTION DATE |
1 YEAR | 5 YEAR | 10 YEAR | |||
| JPMorgan SMID Cap Equity Fund (Class C Shares) | March 22, 1999 | 9.03 | % | 3.10 | % | 7.05 | % |
| JPMorgan SMID Cap Equity Fund (Class C Shares) - excluding sales charge | 10.03 | 3.10 | 7.05 | ||||
| Russell 3000 Index | 22.82 | 12.31 | 15.06 | ||||
| Russell 2500 Index | 36.72 | 8.30 | 12.25 |
KEY FUND STATISTICS
| Fund net assets (000's) | $314,568 | |
| Total number of portfolio holdings | 116 | |
| Portfolio turnover rate | 60 | % |
| Total advisory fees paid (000's) | $1,493 |
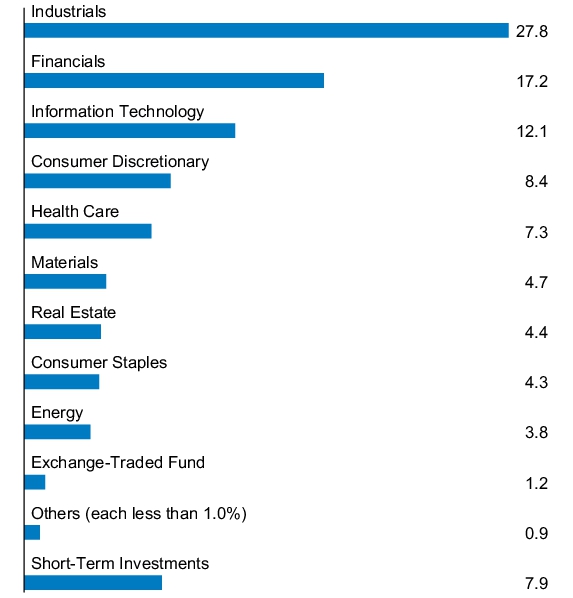
PORTFOLIO COMPOSITION - SECTOR
(% of Total Investments)
(% of Total Investments)
What were the Fund costs for the last year?
(based on a hypothetical $10,000 investment)
| Fund (Class) | Costs of a $10,000 investment |
Costs paid as a percentage of a $10,000 investment |
| JPMorgan SMID Cap Equity Fund (Class I Shares) |
$89 | 0.84% |
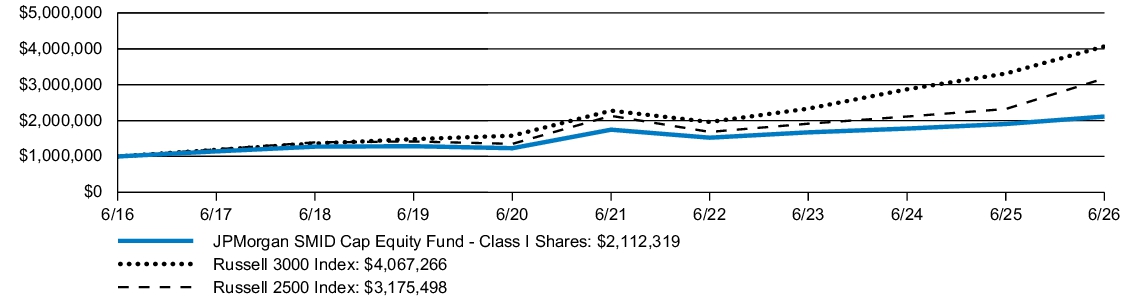
How did the Fund Perform?
The JPMorgan SMID Cap Equity Fund's Class I Shares returned 10.90% for the twelve months ended June 30, 2026. The Russell 3000 Index returned 22.82% and the Russell 2500 Index (the "Index") returned 36.72% for the twelve months ended June 30, 2026.
- The Fund's security selection in financials and technology detracted from performance.
- The Fund's security selection in basic materials and consumer staples contributed to performance.
- The Fund's underweight allocation to Sandisk and overweight allocation to Morningstar detracted from performance.
- The Fund's overweight allocation to MACOM Technology Solutions and Entegris contributed to performance.
Fund Performance
| AVERAGE ANNUAL TOTAL RETURNS | INCEPTION DATE |
1 YEAR | 5 YEAR | 10 YEAR | |||
| JPMorgan SMID Cap Equity Fund (Class I Shares) | June 1, 1991 | 10.90 | % | 3.88 | % | 7.76 | % |
| Russell 3000 Index | 22.82 | 12.31 | 15.06 | ||||
| Russell 2500 Index | 36.72 | 8.30 | 12.25 |
KEY FUND STATISTICS
| Fund net assets (000's) | $314,568 | |
| Total number of portfolio holdings | 116 | |
| Portfolio turnover rate | 60 | % |
| Total advisory fees paid (000's) | $1,493 |
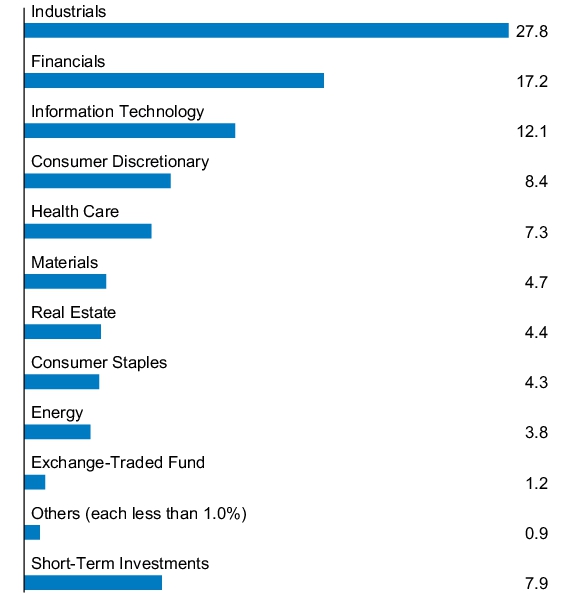
PORTFOLIO COMPOSITION - SECTOR
(% of Total Investments)
(% of Total Investments)
What were the Fund costs for the last year?
(based on a hypothetical $10,000 investment)
| Fund (Class) | Costs of a $10,000 investment |
Costs paid as a percentage of a $10,000 investment |
| JPMorgan SMID Cap Equity Fund (Class R3 Shares) |
$115 | 1.09% |
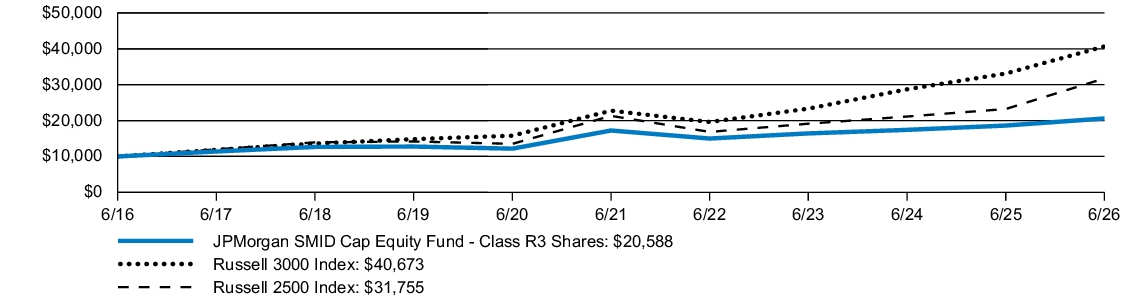
How did the Fund Perform?
The JPMorgan SMID Cap Equity Fund's Class R3 Shares returned 10.61% for the twelve months ended June 30, 2026. The Russell 3000 Index returned 22.82% and the Russell 2500 Index (the "Index") returned 36.72% for the twelve months ended June 30, 2026.
- The Fund's security selection in financials and technology detracted from performance.
- The Fund's security selection in basic materials and consumer staples contributed to performance.
- The Fund's underweight allocation to Sandisk and overweight allocation to Morningstar detracted from performance.
- The Fund's overweight allocation to MACOM Technology Solutions and Entegris contributed to performance.
Fund Performance
| AVERAGE ANNUAL TOTAL RETURNS | INCEPTION DATE |
1 YEAR | 5 YEAR | 10 YEAR | |||
| JPMorgan SMID Cap Equity Fund (Class R3 Shares) | September 9, 2016 | 10.61 | % | 3.62 | % | 7.49 | % |
| Russell 3000 Index | 22.82 | 12.31 | 15.06 | ||||
| Russell 2500 Index | 36.72 | 8.30 | 12.25 |
KEY FUND STATISTICS
| Fund net assets (000's) | $314,568 | |
| Total number of portfolio holdings | 116 | |
| Portfolio turnover rate | 60 | % |
| Total advisory fees paid (000's) | $1,493 |
PORTFOLIO COMPOSITION - SECTOR
(% of Total Investments)
(% of Total Investments)
What were the Fund costs for the last year?
(based on a hypothetical $10,000 investment)
| Fund (Class) | Costs of a $10,000 investment |
Costs paid as a percentage of a $10,000 investment |
| JPMorgan SMID Cap Equity Fund (Class R6 Shares) |
$63 | 0.59% |
How did the Fund Perform?
The JPMorgan SMID Cap Equity Fund's Class R6 Shares returned 11.15% for the twelve months ended June 30, 2026. The Russell 3000 Index returned 22.82% and the Russell 2500 Index (the "Index") returned 36.72% for the twelve months ended June 30, 2026.
- The Fund's security selection in financials and technology detracted from performance.
- The Fund's security selection in basic materials and consumer staples contributed to performance.
- The Fund's underweight allocation to Sandisk and overweight allocation to Morningstar detracted from performance.
- The Fund's overweight allocation to MACOM Technology Solutions and Entegris contributed to performance.
Fund Performance
| AVERAGE ANNUAL TOTAL RETURNS | INCEPTION DATE |
1 YEAR | 5 YEAR | 10 YEAR | |||
| JPMorgan SMID Cap Equity Fund (Class R6 Shares) | November 2, 2015 | 11.15 | % | 4.15 | % | 8.03 | % |
| Russell 3000 Index | 22.82 | 12.31 | 15.06 | ||||
| Russell 2500 Index | 36.72 | 8.30 | 12.25 |
KEY FUND STATISTICS
| Fund net assets (000's) | $314,568 | |
| Total number of portfolio holdings | 116 | |
| Portfolio turnover rate | 60 | % |
| Total advisory fees paid (000's) | $1,493 |
PORTFOLIO COMPOSITION - SECTOR
(% of Total Investments)
(% of Total Investments)
What were the Fund costs for the last year?
(based on a hypothetical $10,000 investment)
| Fund (Class) | Costs of a $10,000 investment |
Costs paid as a percentage of a $10,000 investment |
| JPMorgan Large Cap Growth Fund (Class R6 Shares) |
$47 | 0.44% |
How did the Fund Perform?
The Fund's Class R6 Shares returned 15.56% for the twelve months ended June 30, 2026. The Russell 1000 Index returned 22.02% and the Russell 1000 Growth Index ("the Index") returned 17.71% for the twelve months ended June 30, 2026.
- The Fund’s overweight allocation to the health care sector and security selection in the consumer discretionary sector detracted from relative performance.
- The Fund’s underweight allocation to Apple and not owning KLA detracted from relative performance.
- The Fund’s security selection in the telecommunications and industrials sectors contributed to relative performance.
- The Fund’s overweight allocation to Western Digital and underweight allocation to Microsoft contributed to relative performance.
Fund Performance
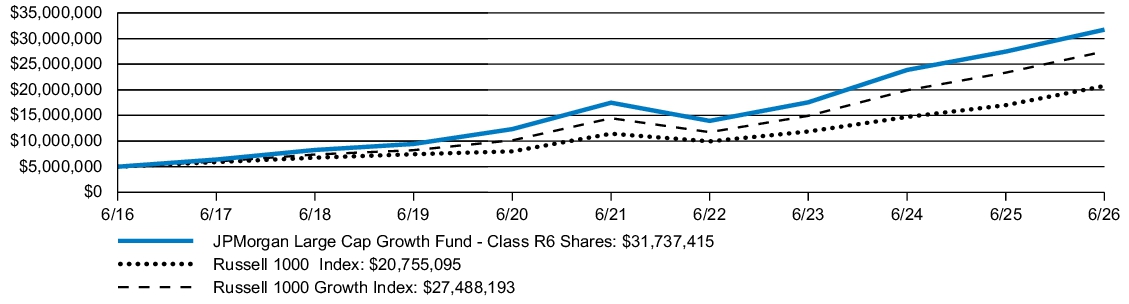
| AVERAGE ANNUAL TOTAL RETURNS | INCEPTION DATE |
1 YEAR | 5 YEAR | 10 YEAR | |||
| JPMorgan Large Cap Growth Fund (Class R6 Shares) | November 30, 2010 | 15.56 | % | 12.66 | % | 20.30 | % |
| Russell 1000 Index | 22.02 | 12.66 | 15.30 | ||||
| Russell 1000 Growth Index | 17.71 | 13.71 | 18.58 |
KEY FUND STATISTICS
| Fund net assets (000's) | $121,692,648 | |
| Total number of portfolio holdings | 82 | |
| Portfolio turnover rate | 72 | % |
| Total advisory fees paid (000's) | $503,730 |
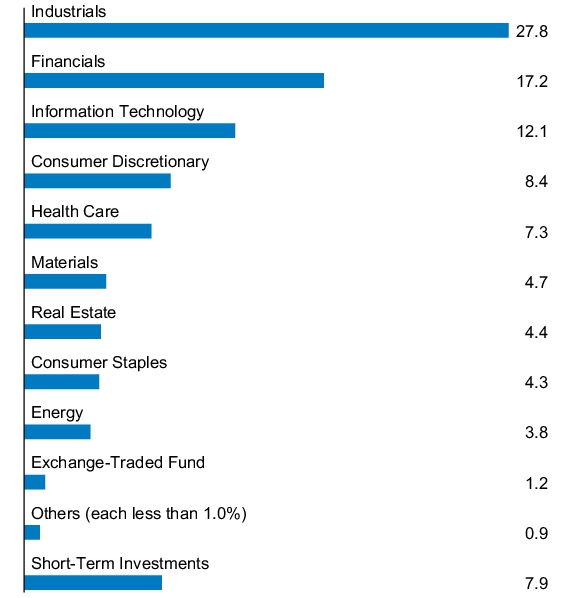
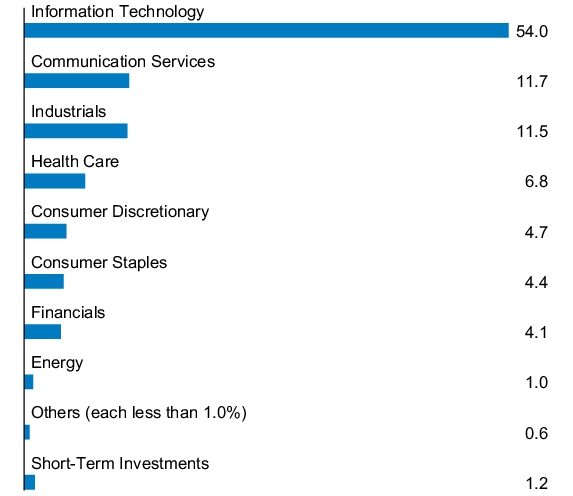
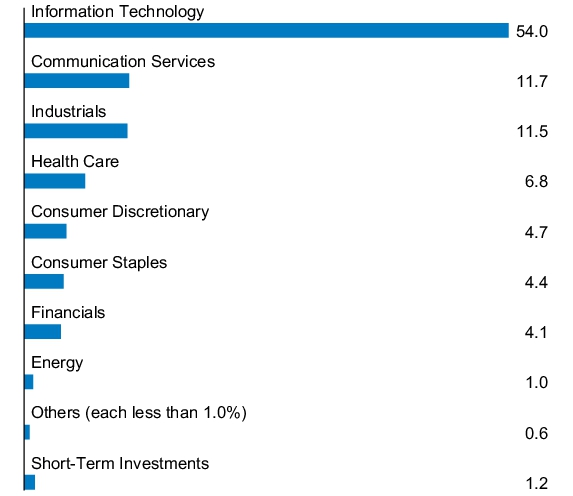
PORTFOLIO COMPOSITION - SECTOR
(% of Total Investments)
(% of Total Investments)
What were the Fund costs for the last year?
(based on a hypothetical $10,000 investment)
| Fund (Class) | Costs of a $10,000 investment |
Costs paid as a percentage of a $10,000 investment |
| JPMorgan Large Cap Growth Fund (Class R5 Shares) |
$58 | 0.54% |
How did the Fund Perform?
The Fund's Class R5 Shares returned 15.45% for the twelve months ended June 30, 2026. The Russell 1000 Index returned 22.02% and the Russell 1000 Growth Index ("the Index") returned 17.71% for the twelve months ended June 30, 2026.
- The Fund’s overweight allocation to the health care sector and security selection in the consumer discretionary sector detracted from relative performance.
- The Fund’s underweight allocation to Apple and not owning KLA detracted from relative performance.
- The Fund’s security selection in the telecommunications and industrials sectors contributed to relative performance.
- The Fund’s overweight allocation to Western Digital and underweight allocation to Microsoft contributed to relative performance.
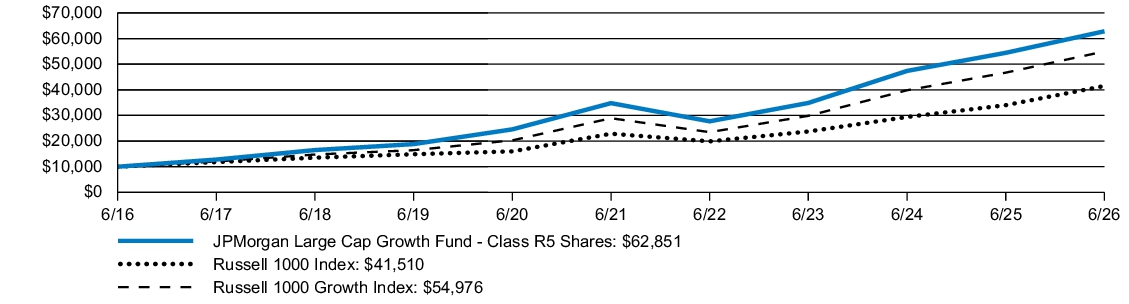
Fund Performance
| AVERAGE ANNUAL TOTAL RETURNS | INCEPTION DATE |
1 YEAR | 5 YEAR | 10 YEAR | |||
| JPMorgan Large Cap Growth Fund (Class R5 Shares) | April 14, 2009 | 15.45 | % | 12.55 | % | 20.18 | % |
| Russell 1000 Index | 22.02 | 12.66 | 15.30 | ||||
| Russell 1000 Growth Index | 17.71 | 13.71 | 18.58 |
KEY FUND STATISTICS
| Fund net assets (000's) | $121,692,648 | |
| Total number of portfolio holdings | 82 | |
| Portfolio turnover rate | 72 | % |
| Total advisory fees paid (000's) | $503,730 |
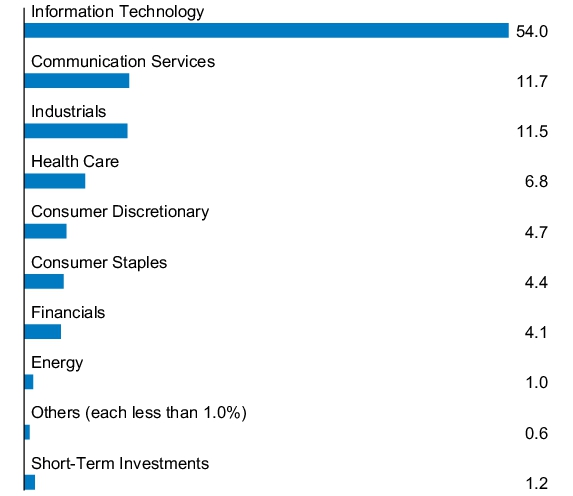
PORTFOLIO COMPOSITION - SECTOR
(% of Total Investments)
(% of Total Investments)
What were the Fund costs for the last year?
(based on a hypothetical $10,000 investment)
| Fund (Class) | Costs of a $10,000 investment |
Costs paid as a percentage of a $10,000 investment |
| JPMorgan Large Cap Growth Fund (Class R4 Shares) |
$74 | 0.69% |
How did the Fund Perform?
The Fund's Class R4 Shares returned 15.26% for the twelve months ended June 30, 2026. The Russell 1000 Index returned 22.02% and the Russell 1000 Growth Index ("the Index") returned 17.71% for the twelve months ended June 30, 2026.
- The Fund’s overweight allocation to the health care sector and security selection in the consumer discretionary sector detracted from relative performance.
- The Fund’s underweight allocation to Apple and not owning KLA detracted from relative performance.
- The Fund’s security selection in the telecommunications and industrials sectors contributed to relative performance.
- The Fund’s overweight allocation to Western Digital and underweight allocation to Microsoft contributed to relative performance.
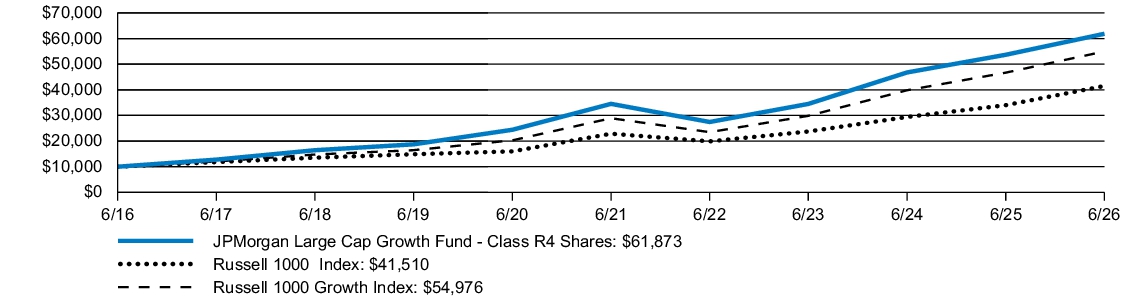
Fund Performance
| AVERAGE ANNUAL TOTAL RETURNS | INCEPTION DATE |
1 YEAR | 5 YEAR | 10 YEAR | |||
| JPMorgan Large Cap Growth Fund (Class R4 Shares) | September 9, 2016 | 15.26 | % | 12.38 | % | 19.99 | % |
| Russell 1000 Index | 22.02 | 12.66 | 15.30 | ||||
| Russell 1000 Growth Index | 17.71 | 13.71 | 18.58 |
KEY FUND STATISTICS
| Fund net assets (000's) | $121,692,648 | |
| Total number of portfolio holdings | 82 | |
| Portfolio turnover rate | 72 | % |
| Total advisory fees paid (000's) | $503,730 |
PORTFOLIO COMPOSITION - SECTOR
(% of Total Investments)
(% of Total Investments)
What were the Fund costs for the last year?
(based on a hypothetical $10,000 investment)
| Fund (Class) | Costs of a $10,000 investment |
Costs paid as a percentage of a $10,000 investment |
| JPMorgan Large Cap Growth Fund (Class R3 Shares) |
$101 | 0.94% |
How did the Fund Perform?
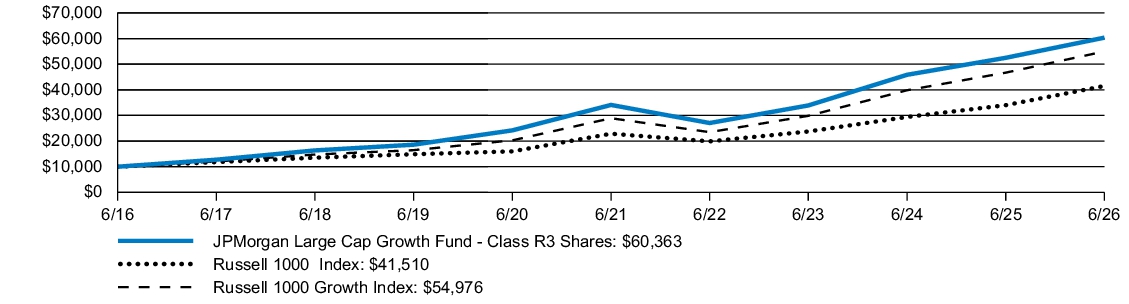
The Fund's Class R3 Shares returned 14.98% for the twelve months ended June 30, 2026. The Russell 1000 Index returned 22.02% and the Russell 1000 Growth Index ("the Index") returned 17.71% for the twelve months ended June 30, 2026.
- The Fund’s overweight allocation to the health care sector and security selection in the consumer discretionary sector detracted from relative performance.
- The Fund’s underweight allocation to Apple and not owning KLA detracted from relative performance.
- The Fund’s security selection in the telecommunications and industrials sectors contributed to relative performance.
- The Fund’s overweight allocation to Western Digital and underweight allocation to Microsoft contributed to relative performance.
Fund Performance
| AVERAGE ANNUAL TOTAL RETURNS | INCEPTION DATE |
1 YEAR | 5 YEAR | 10 YEAR | |||
| JPMorgan Large Cap Growth Fund (Class R3 Shares) | September 9, 2016 | 14.98 | % | 12.10 | % | 19.70 | % |
| Russell 1000 Index | 22.02 | 12.66 | 15.30 | ||||
| Russell 1000 Growth Index | 17.71 | 13.71 | 18.58 |
KEY FUND STATISTICS
| Fund net assets (000's) | $121,692,648 | |
| Total number of portfolio holdings | 82 | |
| Portfolio turnover rate | 72 | % |
| Total advisory fees paid (000's) | $503,730 |
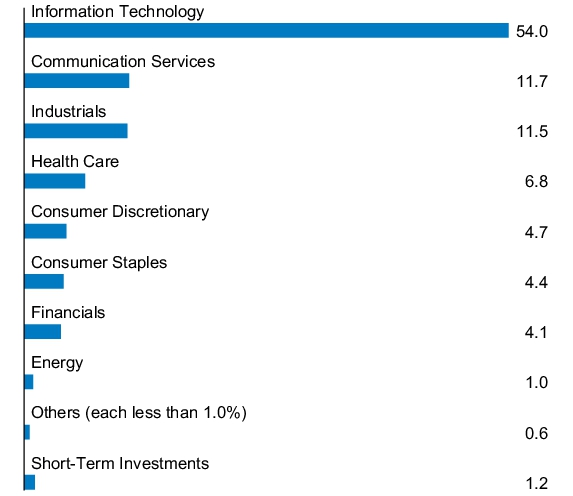
PORTFOLIO COMPOSITION - SECTOR
(% of Total Investments)
(% of Total Investments)
What were the Fund costs for the last year?
(based on a hypothetical $10,000 investment)
| Fund (Class) | Costs of a $10,000 investment |
Costs paid as a percentage of a $10,000 investment |
| JPMorgan Large Cap Growth Fund (Class R2 Shares) |
$127 | 1.19% |
How did the Fund Perform?
The Fund's Class R2 Shares returned 14.69% for the twelve months ended June 30, 2026. The Russell 1000 Index returned 22.02% and the Russell 1000 Growth Index ("the Index") returned 17.71% for the twelve months ended June 30, 2026.
- The Fund’s overweight allocation to the health care sector and security selection in the consumer discretionary sector detracted from relative performance.
- The Fund’s underweight allocation to Apple and not owning KLA detracted from relative performance.
- The Fund’s security selection in the telecommunications and industrials sectors contributed to relative performance.
- The Fund’s overweight allocation to Western Digital and underweight allocation to Microsoft contributed to relative performance.
Fund Performance
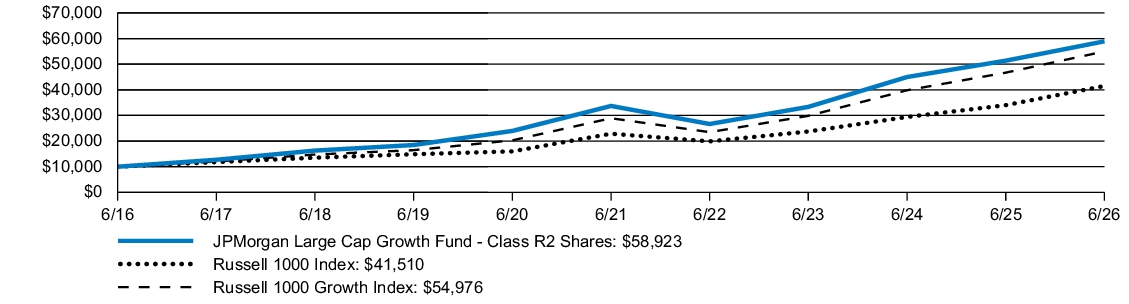
| AVERAGE ANNUAL TOTAL RETURNS | INCEPTION DATE |
1 YEAR | 5 YEAR | 10 YEAR | |||
| JPMorgan Large Cap Growth Fund (Class R2 Shares) | November 3, 2008 | 14.69 | % | 11.82 | % | 19.41 | % |
| Russell 1000 Index | 22.02 | 12.66 | 15.30 | ||||
| Russell 1000 Growth Index | 17.71 | 13.71 | 18.58 |
KEY FUND STATISTICS
| Fund net assets (000's) | $121,692,648 | |
| Total number of portfolio holdings | 82 | |
| Portfolio turnover rate | 72 | % |
| Total advisory fees paid (000's) | $503,730 |
PORTFOLIO COMPOSITION - SECTOR
(% of Total Investments)
(% of Total Investments)
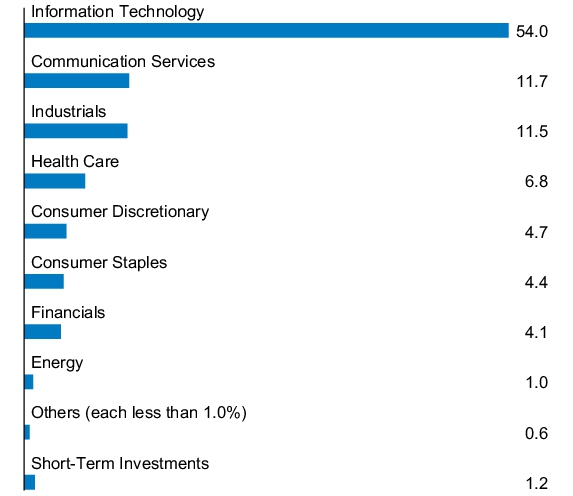
What were the Fund costs for the last year?
(based on a hypothetical $10,000 investment)
| Fund (Class) | Costs of a $10,000 investment |
Costs paid as a percentage of a $10,000 investment |
| JPMorgan Large Cap Growth Fund (Class I Shares) |
$74 | 0.69% |
How did the Fund Perform?
The Fund's Class I Shares returned 15.26% for the twelve months ended June 30, 2026. The Russell 1000 Index returned 22.02% and the Russell 1000 Growth Index ("the Index") returned 17.71% for the twelve months ended June 30, 2026.
- The Fund’s overweight allocation to the health care sector and security selection in the consumer discretionary sector detracted from relative performance.
- The Fund’s underweight allocation to Apple and not owning KLA detracted from relative performance.
- The Fund’s security selection in the telecommunications and industrials sectors contributed to relative performance.
- The Fund’s overweight allocation to Western Digital and underweight allocation to Microsoft contributed to relative performance.
Fund Performance
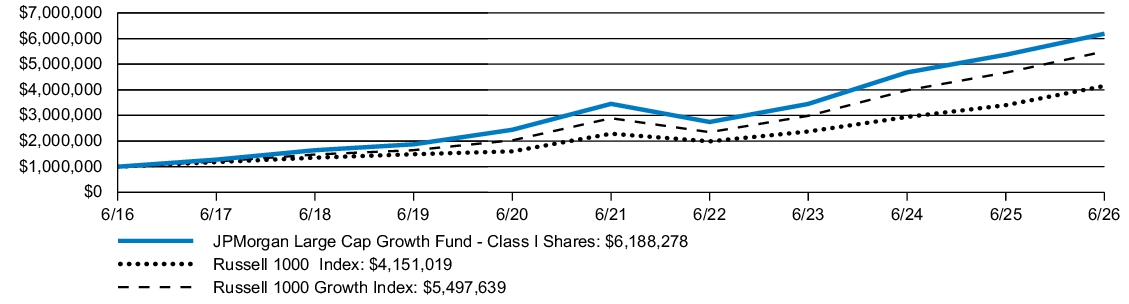
| AVERAGE ANNUAL TOTAL RETURNS | INCEPTION DATE |
1 YEAR | 5 YEAR | 10 YEAR | |||
| JPMorgan Large Cap Growth Fund (Class I Shares) | February 28, 1992 | 15.26 | % | 12.38 | % | 19.99 | % |
| Russell 1000 Index | 22.02 | 12.66 | 15.30 | ||||
| Russell 1000 Growth Index | 17.71 | 13.71 | 18.58 |
KEY FUND STATISTICS
| Fund net assets (000's) | $121,692,648 | |
| Total number of portfolio holdings | 82 | |
| Portfolio turnover rate | 72 | % |
| Total advisory fees paid (000's) | $503,730 |
PORTFOLIO COMPOSITION - SECTOR
(% of Total Investments)
(% of Total Investments)
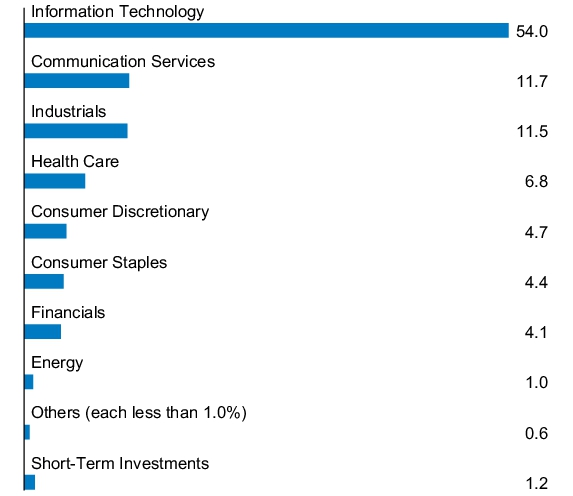
What were the Fund costs for the last year?
(based on a hypothetical $10,000 investment)
| Fund (Class) | Costs of a $10,000 investment |
Costs paid as a percentage of a $10,000 investment |
| JPMorgan Large Cap Growth Fund (Class C Shares) |
$154 | 1.44% |
How did the Fund Perform?
The Fund's Class C Shares, without a sales charge, returned 14.42% for the twelve months ended June 30, 2026. The Russell 1000 Index returned 22.02% and the Russell 1000 Growth Index ("the Index") returned 17.71% for the twelve months ended June 30, 2026.
- The Fund’s overweight allocation to the health care sector and security selection in the consumer discretionary sector detracted from relative performance.
- The Fund’s underweight allocation to Apple and not owning KLA detracted from relative performance.
- The Fund’s security selection in the telecommunications and industrials sectors contributed to relative performance.
- The Fund’s overweight allocation to Western Digital and underweight allocation to Microsoft contributed to relative performance.
Fund Performance
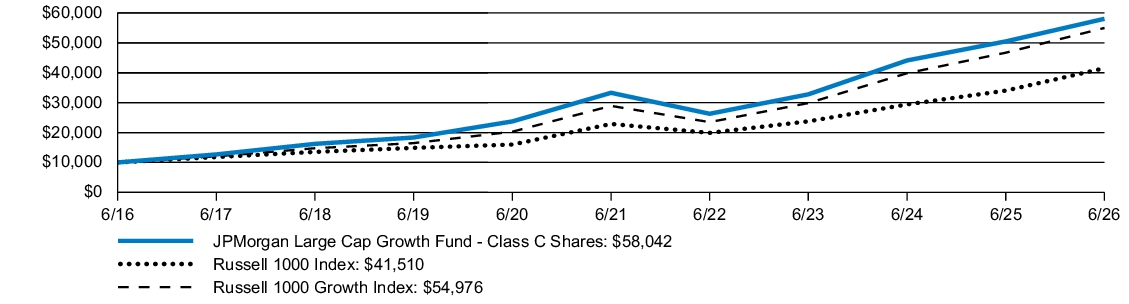
| AVERAGE ANNUAL TOTAL RETURNS | INCEPTION DATE |
1 YEAR | 5 YEAR | 10 YEAR | |||
| JPMorgan Large Cap Growth Fund (Class C Shares) | November 4, 1997 | 13.42 | % | 11.54 | % | 19.23 | % |
| JPMorgan Large Cap Growth Fund (Class C Shares) - excluding sales charge | 14.42 | 11.54 | 19.23 | ||||
| Russell 1000 Index | 22.02 | 12.66 | 15.30 | ||||
| Russell 1000 Growth Index | 17.71 | 13.71 | 18.58 |
KEY FUND STATISTICS
| Fund net assets (000's) | $121,692,648 | |
| Total number of portfolio holdings | 82 | |
| Portfolio turnover rate | 72 | % |
| Total advisory fees paid (000's) | $503,730 |
PORTFOLIO COMPOSITION - SECTOR
(% of Total Investments)
(% of Total Investments)
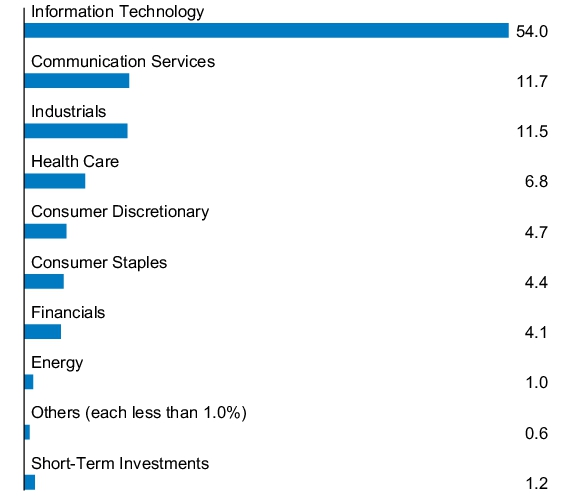
What were the Fund costs for the last year?
(based on a hypothetical $10,000 investment)
| Fund (Class) | Costs of a $10,000 investment |
Costs paid as a percentage of a $10,000 investment |
| JPMorgan Large Cap Growth Fund (Class A Shares) |
$101 | 0.94% |
How did the Fund Perform?
The Fund's Class A Shares, without a sales charge, returned 14.97% for the twelve months ended June 30, 2026. The Russell 1000 Index returned 22.02% and the Russell 1000 Growth Index ("the Index") returned 17.71% for the twelve months ended June 30, 2026.
- The Fund’s overweight allocation to the health care sector and security selection in the consumer discretionary sector detracted from relative performance.
- The Fund’s underweight allocation to Apple and not owning KLA detracted from relative performance.
- The Fund’s security selection in the telecommunications and industrials sectors contributed to relative performance.
- The Fund’s overweight allocation to Western Digital and underweight allocation to Microsoft contributed to relative performance.
Fund Performance
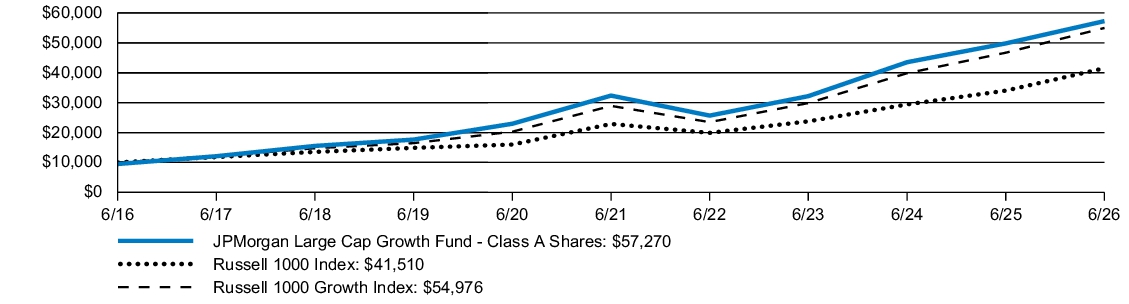
| AVERAGE ANNUAL TOTAL RETURNS | INCEPTION DATE |
1 YEAR | 5 YEAR | 10 YEAR | |||
| JPMorgan Large Cap Growth Fund (Class A Shares) | February 22, 1994 | 8.93 | % | 10.89 | % | 19.07 | % |
| JPMorgan Large Cap Growth Fund (Class A Shares) - excluding sales charge | 14.97 | 12.10 | 19.71 | ||||
| Russell 1000 Index | 22.02 | 12.66 | 15.30 | ||||
| Russell 1000 Growth Index | 17.71 | 13.71 | 18.58 |
KEY FUND STATISTICS
| Fund net assets (000's) | $121,692,648 | |
| Total number of portfolio holdings | 82 | |
| Portfolio turnover rate | 72 | % |
| Total advisory fees paid (000's) | $503,730 |
PORTFOLIO COMPOSITION - SECTOR
(% of Total Investments)
(% of Total Investments)
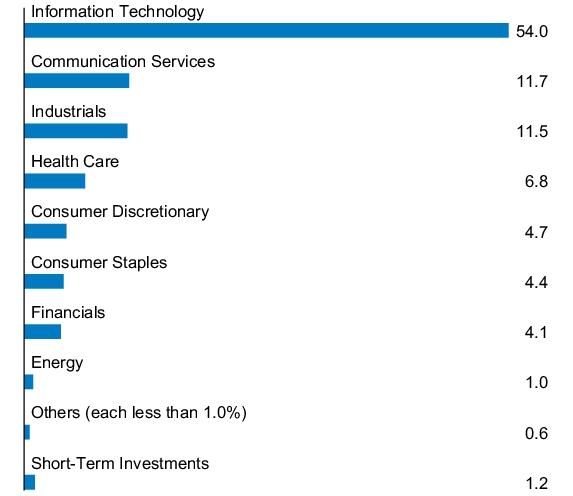
What were the Fund costs for the last year?
(based on a hypothetical $10,000 investment)
| Fund (Class) | Costs of a $10,000 investment |
Costs paid as a percentage of a $10,000 investment |
| JPMorgan Large Cap Value Fund (Class A Shares) |
$103 | 0.93% |
How did the Fund Perform?
The Fund's Class A Shares, without a sales charge, returned 21.28% for the twelve months ended June 30, 2026. The Russell 1000 Index (the "Index") returned 22.02% and the Russell 1000 Value Index returned 27.12% for the twelve months ended June 30, 2026.
- The Fund's security selection in the health care and communication services sectors detracted from performance.
- The Fund's security selection in the information technology sector and underweight allocation to consumer staples contributed to performance.
- The Fund's underweight allocation to Intel and overweight allocation to FMC detracted from performance.
- The Fund's overweight allocation to Western Digital and Corning contributed to performance.
Fund Performance
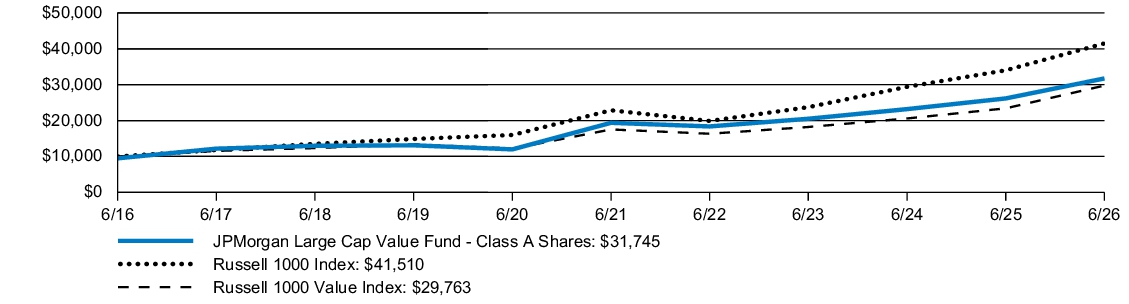
| AVERAGE ANNUAL TOTAL RETURNS | INCEPTION DATE |
1 YEAR | 5 YEAR | 10 YEAR | |||
| JPMorgan Large Cap Value Fund (Class A Shares) | February 18, 1992 | 14.89 | % | 9.19 | % | 12.25 | % |
| JPMorgan Large Cap Value Fund (Class A Shares) - excluding sales charge | 21.28 | 10.37 | 12.85 | ||||
| Russell 1000 Index | 22.02 | 12.66 | 15.30 | ||||
| Russell 1000 Value Index | 27.12 | 11.17 | 11.52 |
KEY FUND STATISTICS
| Fund net assets (000's) | $5,159,976 | |
| Total number of portfolio holdings | 103 | |
| Portfolio turnover rate | 223 | % |
| Total advisory fees paid (000's) | $19,528 |
PORTFOLIO COMPOSITION - SECTOR
(% of Total Investments)
(% of Total Investments)
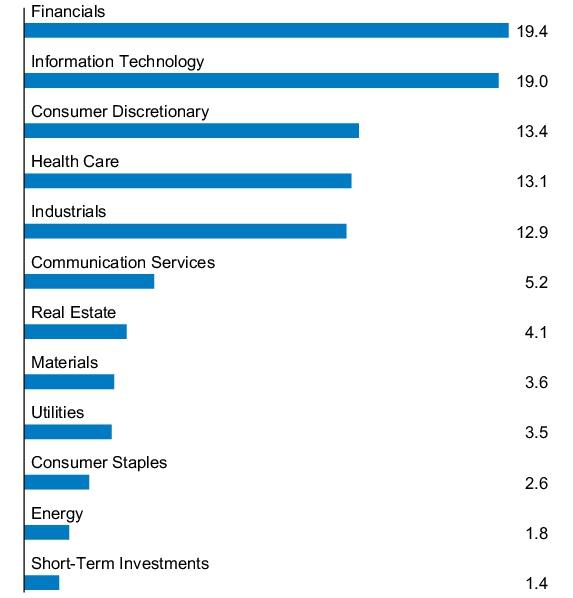
What were the Fund costs for the last year?
(based on a hypothetical $10,000 investment)
| Fund (Class) | Costs of a $10,000 investment |
Costs paid as a percentage of a $10,000 investment |
| JPMorgan Large Cap Value Fund (Class C Shares) |
$159 | 1.44% |
How did the Fund Perform?
The Fund's Class C Shares, without a sales charge, returned 20.65% for the twelve months ended June 30, 2026. The Russell 1000 Index (the "Index") returned 22.02% and the Russell 1000 Value Index returned 27.12% for the twelve months ended June 30, 2026.
- The Fund's security selection in the health care and communication services sectors detracted from performance.
- The Fund's security selection in the information technology sector and underweight allocation to consumer staples contributed to performance.
- The Fund's underweight allocation to Intel and overweight allocation to FMC detracted from performance.
- The Fund's overweight allocation to Western Digital and Corning contributed to performance.
Fund Performance
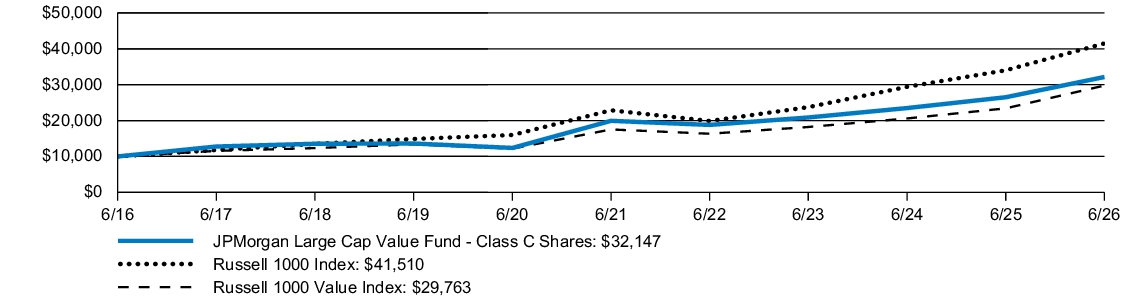
| AVERAGE ANNUAL TOTAL RETURNS | INCEPTION DATE |
1 YEAR | 5 YEAR | 10 YEAR | |||
| JPMorgan Large Cap Value Fund (Class C Shares) | March 22, 1999 | 19.65 | % | 9.80 | % | 12.39 | % |
| JPMorgan Large Cap Value Fund (Class C Shares) - excluding sales charge | 20.65 | 9.80 | 12.39 | ||||
| Russell 1000 Index | 22.02 | 12.66 | 15.30 | ||||
| Russell 1000 Value Index | 27.12 | 11.17 | 11.52 |
KEY FUND STATISTICS
| Fund net assets (000's) | $5,159,976 | |
| Total number of portfolio holdings | 103 | |
| Portfolio turnover rate | 223 | % |
| Total advisory fees paid (000's) | $19,528 |
PORTFOLIO COMPOSITION - SECTOR
(% of Total Investments)
(% of Total Investments)
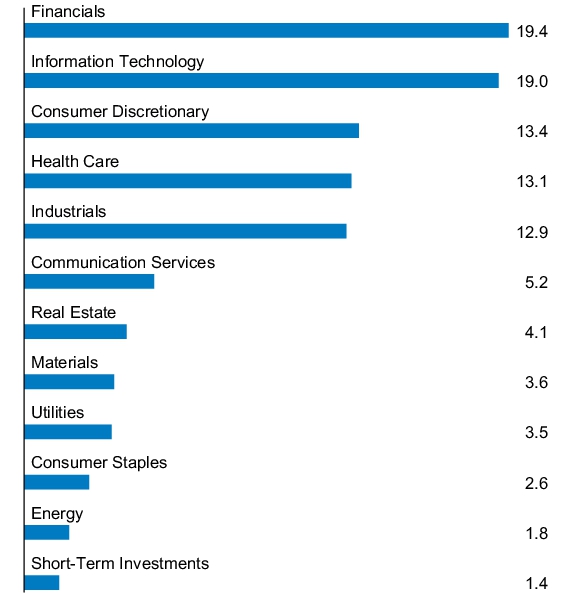
What were the Fund costs for the last year?
(based on a hypothetical $10,000 investment)
| Fund (Class) | Costs of a $10,000 investment |
Costs paid as a percentage of a $10,000 investment |
| JPMorgan Large Cap Value Fund (Class I Shares) |
$76 | 0.69% |
How did the Fund Perform?
The Fund's Class I Shares returned 21.64% for the twelve months ended June 30, 2026. The Russell 1000 Index (the "Index") returned 22.02% and the Russell 1000 Value Index returned 27.12% for the twelve months ended June 30, 2026.
- The Fund's security selection in the health care and communication services sectors detracted from performance.
- The Fund's security selection in the information technology sector and underweight allocation to consumer staples contributed to performance.
- The Fund's underweight allocation to Intel and overweight allocation to FMC detracted from performance.
- The Fund's overweight allocation to Western Digital and Corning contributed to performance.
Fund Performance
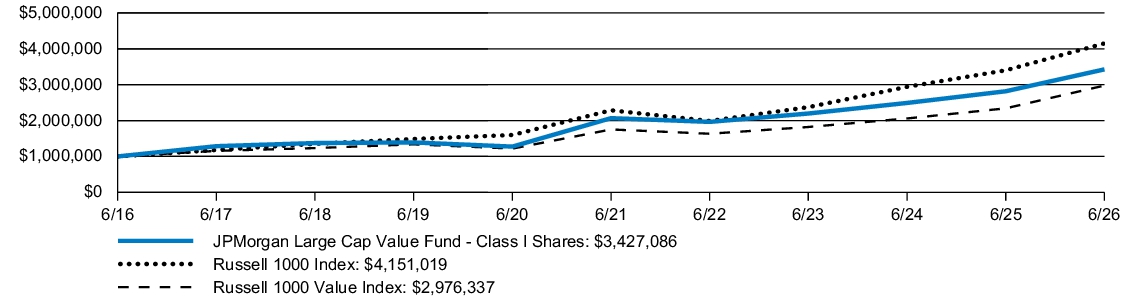
| AVERAGE ANNUAL TOTAL RETURNS | INCEPTION DATE |
1 YEAR | 5 YEAR | 10 YEAR | |||
| JPMorgan Large Cap Value Fund (Class I Shares) | March 1, 1991 | 21.64 | % | 10.63 | % | 13.11 | % |
| Russell 1000 Index | 22.02 | 12.66 | 15.30 | ||||
| Russell 1000 Value Index | 27.12 | 11.17 | 11.52 |
KEY FUND STATISTICS
| Fund net assets (000's) | $5,159,976 | |
| Total number of portfolio holdings | 103 | |
| Portfolio turnover rate | 223 | % |
| Total advisory fees paid (000's) | $19,528 |
PORTFOLIO COMPOSITION - SECTOR
(% of Total Investments)
(% of Total Investments)
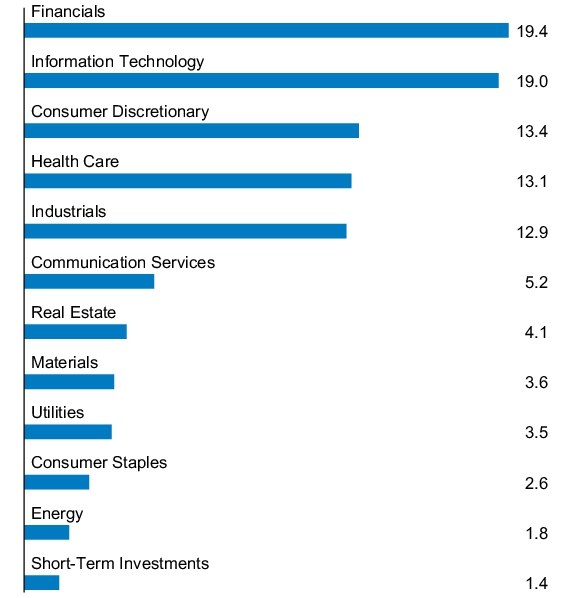
What were the Fund costs for the last year?
(based on a hypothetical $10,000 investment)
| Fund (Class) | Costs of a $10,000 investment |
Costs paid as a percentage of a $10,000 investment |
| JPMorgan Large Cap Value Fund (Class R2 Shares) |
$131 | 1.19% |
How did the Fund Perform?
The Fund's Class R2 Shares returned 20.99% for the twelve months ended June 30, 2026. The Russell 1000 Index (the "Index") returned 22.02% and the Russell 1000 Value Index returned 27.12% for the twelve months ended June 30, 2026.
- The Fund's security selection in the health care and communication services sectors detracted from performance.
- The Fund's security selection in the information technology sector and underweight allocation to consumer staples contributed to performance.
- The Fund's underweight allocation to Intel and overweight allocation to FMC detracted from performance.
- The Fund's overweight allocation to Western Digital and Corning contributed to performance.
Fund Performance
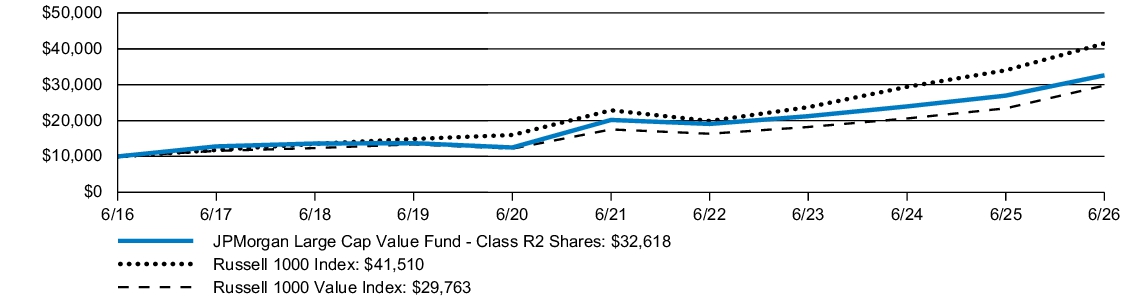
| AVERAGE ANNUAL TOTAL RETURNS | INCEPTION DATE |
1 YEAR | 5 YEAR | 10 YEAR | |||
| JPMorgan Large Cap Value Fund (Class R2 Shares) | November 3, 2008 | 20.99 | % | 10.08 | % | 12.55 | % |
| Russell 1000 Index | 22.02 | 12.66 | 15.30 | ||||
| Russell 1000 Value Index | 27.12 | 11.17 | 11.52 |
KEY FUND STATISTICS
| Fund net assets (000's) | $5,159,976 | |
| Total number of portfolio holdings | 103 | |
| Portfolio turnover rate | 223 | % |
| Total advisory fees paid (000's) | $19,528 |
PORTFOLIO COMPOSITION - SECTOR
(% of Total Investments)
(% of Total Investments)
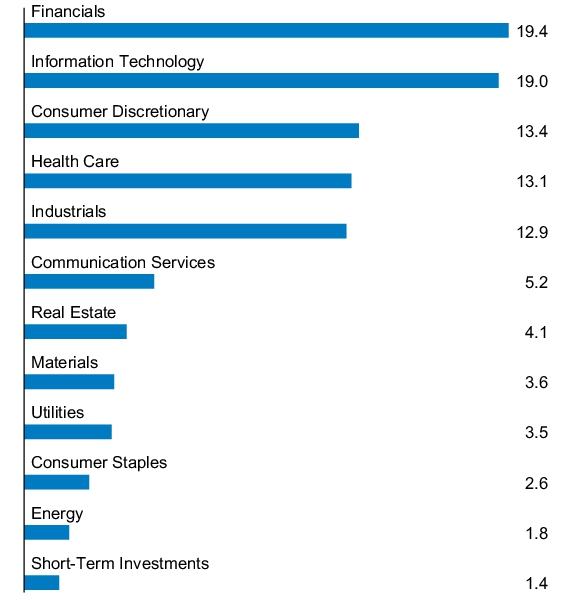
What were the Fund costs for the last year?
(based on a hypothetical $10,000 investment)
| Fund (Class) | Costs of a $10,000 investment |
Costs paid as a percentage of a $10,000 investment |
| JPMorgan Large Cap Value Fund (Class R3 Shares) |
$104 | 0.94% |
How did the Fund Perform?
The Fund's Class R3 Shares returned 21.28% for the twelve months ended June 30, 2026. The Russell 1000 Index (the "Index") returned 22.02% and the Russell 1000 Value Index returned 27.12% for the twelve months ended June 30, 2026.
- The Fund's security selection in the health care and communication services sectors detracted from performance.
- The Fund's security selection in the information technology sector and underweight allocation to consumer staples contributed to performance.
- The Fund's underweight allocation to Intel and overweight allocation to FMC detracted from performance.
- The Fund's overweight allocation to Western Digital and Corning contributed to performance.
Fund Performance
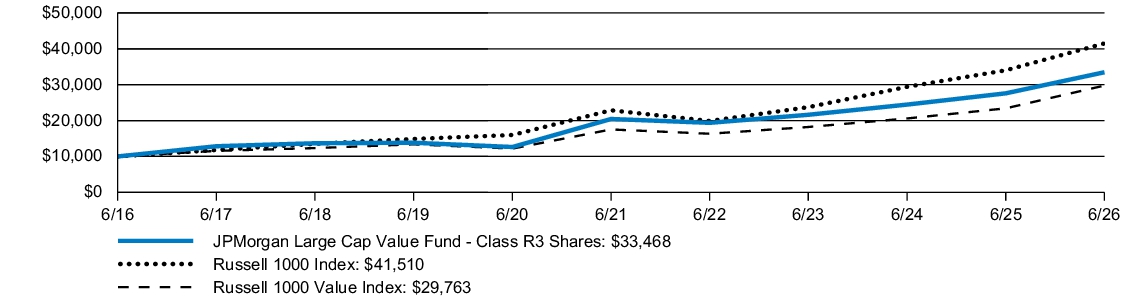
| AVERAGE ANNUAL TOTAL RETURNS | INCEPTION DATE |
1 YEAR | 5 YEAR | 10 YEAR | |||
| JPMorgan Large Cap Value Fund (Class R3 Shares) | October 1, 2018 | 21.28 | % | 10.36 | % | 12.84 | % |
| Russell 1000 Index | 22.02 | 12.66 | 15.30 | ||||
| Russell 1000 Value Index | 27.12 | 11.17 | 11.52 |
KEY FUND STATISTICS
| Fund net assets (000's) | $5,159,976 | |
| Total number of portfolio holdings | 103 | |
| Portfolio turnover rate | 223 | % |
| Total advisory fees paid (000's) | $19,528 |
PORTFOLIO COMPOSITION - SECTOR
(% of Total Investments)
(% of Total Investments)
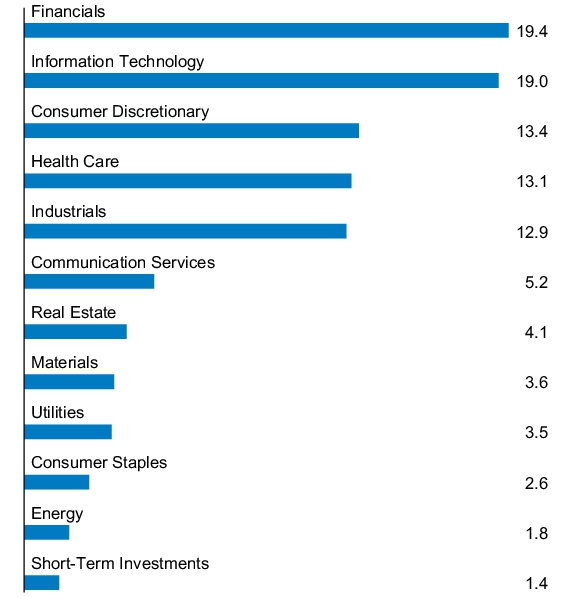
What were the Fund costs for the last year?
(based on a hypothetical $10,000 investment)
| Fund (Class) | Costs of a $10,000 investment |
Costs paid as a percentage of a $10,000 investment |
| JPMorgan Large Cap Value Fund (Class R4 Shares) |
$76 | 0.69% |
How did the Fund Perform?
The Fund's Class R4 Shares returned 21.61% for the twelve months ended June 30, 2026. The Russell 1000 Index (the "Index") returned 22.02% and the Russell 1000 Value Index returned 27.12% for the twelve months ended June 30, 2026.
- The Fund's security selection in the health care and communication services sectors detracted from performance.
- The Fund's security selection in the information technology sector and underweight allocation to consumer staples contributed to performance.
- The Fund's underweight allocation to Intel and overweight allocation to FMC detracted from performance.
- The Fund's overweight allocation to Western Digital and Corning contributed to performance.
Fund Performance
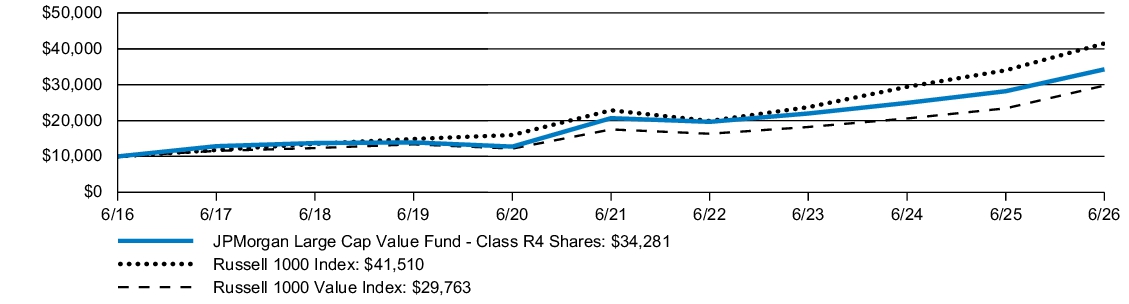
| AVERAGE ANNUAL TOTAL RETURNS | INCEPTION DATE |
1 YEAR | 5 YEAR | 10 YEAR | |||
| JPMorgan Large Cap Value Fund (Class R4 Shares) | October 1, 2018 | 21.61 | % | 10.65 | % | 13.11 | % |
| Russell 1000 Index | 22.02 | 12.66 | 15.30 | ||||
| Russell 1000 Value Index | 27.12 | 11.17 | 11.52 |
KEY FUND STATISTICS
| Fund net assets (000's) | $5,159,976 | |
| Total number of portfolio holdings | 103 | |
| Portfolio turnover rate | 223 | % |
| Total advisory fees paid (000's) | $19,528 |
PORTFOLIO COMPOSITION - SECTOR
(% of Total Investments)
(% of Total Investments)
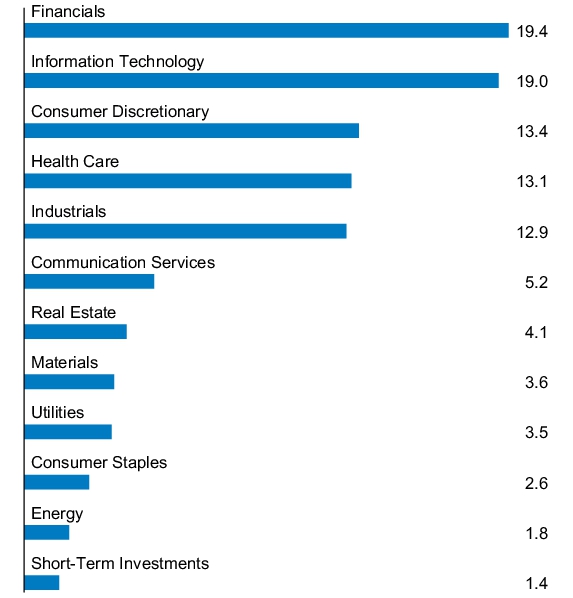
What were the Fund costs for the last year?
(based on a hypothetical $10,000 investment)
| Fund (Class) | Costs of a $10,000 investment |
Costs paid as a percentage of a $10,000 investment |
| JPMorgan Large Cap Value Fund (Class R5 Shares) |
$60 | 0.54% |
How did the Fund Perform?
The Fund's Class R5 Shares returned 21.79% for the twelve months ended June 30, 2026. The Russell 1000 Index (the "Index") returned 22.02% and the Russell 1000 Value Index returned 27.12% for the twelve months ended June 30, 2026.
- The Fund's security selection in the health care and communication services sectors detracted from performance.
- The Fund's security selection in the information technology sector and underweight allocation to consumer staples contributed to performance.
- The Fund's underweight allocation to Intel and overweight allocation to FMC detracted from performance.
- The Fund's overweight allocation to Western Digital and Corning contributed to performance.
Fund Performance
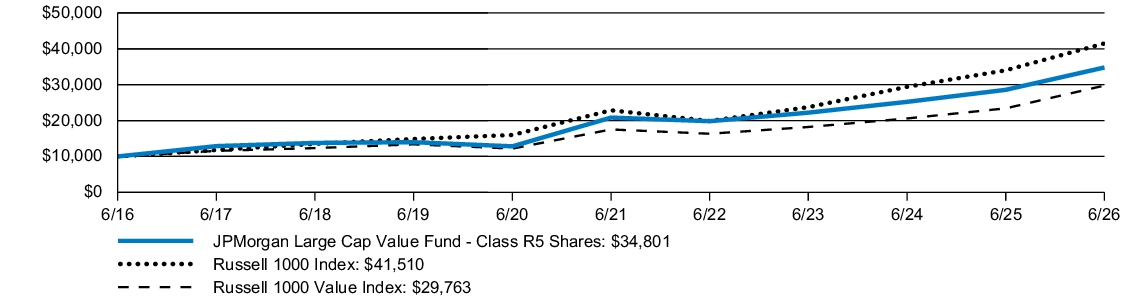
| AVERAGE ANNUAL TOTAL RETURNS | INCEPTION DATE |
1 YEAR | 5 YEAR | 10 YEAR | |||
| JPMorgan Large Cap Value Fund (Class R5 Shares) | May 15, 2006 | 21.79 | % | 10.81 | % | 13.28 | % |
| Russell 1000 Index | 22.02 | 12.66 | 15.30 | ||||
| Russell 1000 Value Index | 27.12 | 11.17 | 11.52 |
KEY FUND STATISTICS
| Fund net assets (000's) | $5,159,976 | |
| Total number of portfolio holdings | 103 | |
| Portfolio turnover rate | 223 | % |
| Total advisory fees paid (000's) | $19,528 |
PORTFOLIO COMPOSITION - SECTOR
(% of Total Investments)
(% of Total Investments)
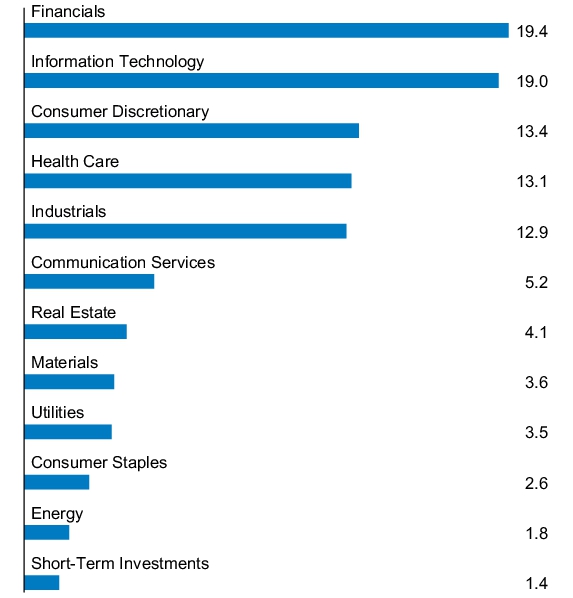
What were the Fund costs for the last year?
(based on a hypothetical $10,000 investment)
| Fund (Class) | Costs of a $10,000 investment |
Costs paid as a percentage of a $10,000 investment |
| JPMorgan Large Cap Value Fund (Class R6 Shares) |
$49 | 0.44% |
How did the Fund Perform?
The Fund's Class R6 Shares returned 21.93% for the twelve months ended June 30, 2026. The Russell 1000 Index (the "Index") returned 22.02% and the Russell 1000 Value Index returned 27.12% for the twelve months ended June 30, 2026.
- The Fund's security selection in the health care and communication services sectors detracted from performance.
- The Fund's security selection in the information technology sector and underweight allocation to consumer staples contributed to performance.
- The Fund's underweight allocation to Intel and overweight allocation to FMC detracted from performance.
- The Fund's overweight allocation to Western Digital and Corning contributed to performance.
Fund Performance
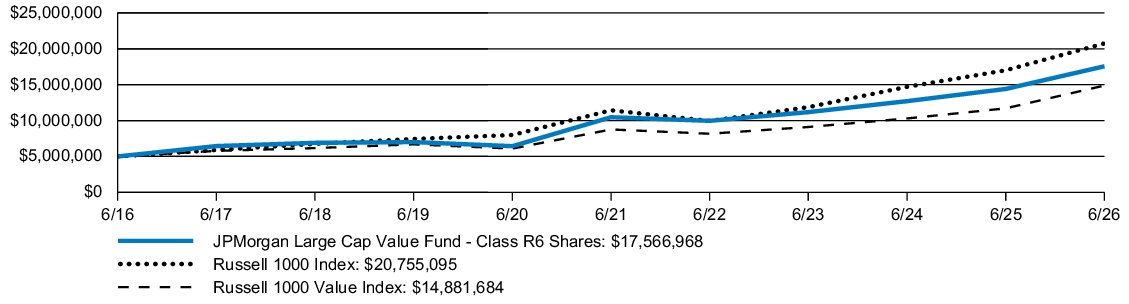
| AVERAGE ANNUAL TOTAL RETURNS | INCEPTION DATE |
1 YEAR | 5 YEAR | 10 YEAR | |||
| JPMorgan Large Cap Value Fund (Class R6 Shares) | November 30, 2010 | 21.93 | % | 10.91 | % | 13.39 | % |
| Russell 1000 Index | 22.02 | 12.66 | 15.30 | ||||
| Russell 1000 Value Index | 27.12 | 11.17 | 11.52 |
KEY FUND STATISTICS
| Fund net assets (000's) | $5,159,976 | |
| Total number of portfolio holdings | 103 | |
| Portfolio turnover rate | 223 | % |
| Total advisory fees paid (000's) | $19,528 |
PORTFOLIO COMPOSITION - SECTOR
(% of Total Investments)
(% of Total Investments)
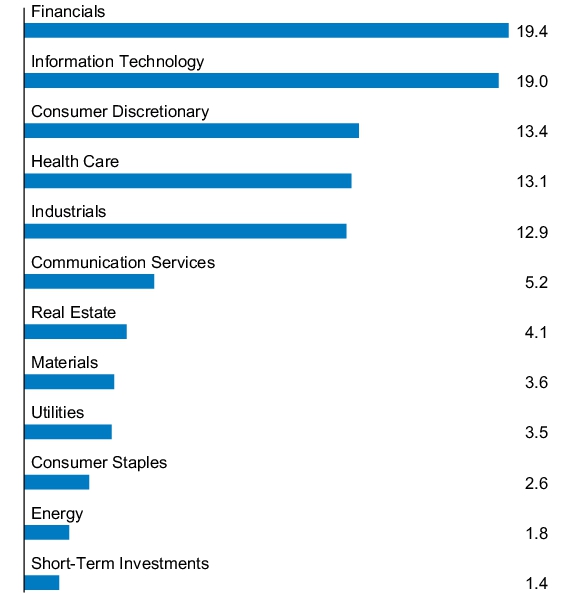
What were the Fund costs for the last year?
(based on a hypothetical $10,000 investment)
| Fund (Class) | Costs of a $10,000 investment |
Costs paid as a percentage of a $10,000 investment |
| JPMorgan Small Cap Growth Fund (Class R6 Shares) |
$89 | 0.74% |
How did the Fund Perform?
The JPMorgan Small Cap Growth Fund's Class R6 Shares returned 39.77% for the twelve months ended June 30, 2026. The Russell 3000 Index returned 22.82% and the Russell 2000 Growth Index (the "Index") returned 38.74% for the twelve months ended June 30, 2026.
- The Fund’s security selection in the technology and health care sectors contributed to relative performance.
- The Fund’s overweight allocations to Vicor and DigitalOcean contributed to relative performance.
- The Fund’s security selection in the consumer discretionary sector and underweight allocation to the telecommunications sector detracted from relative performance.
- The Fund’s underweight allocation to Bloom Energy and overweight allocation to BlackLine detracted from relative performance.
Fund Performance
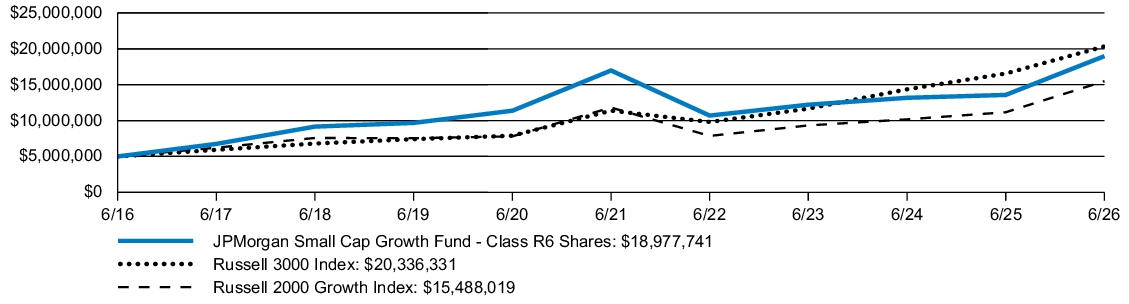
| AVERAGE ANNUAL TOTAL RETURNS | INCEPTION DATE |
1 YEAR | 5 YEAR | 10 YEAR | |||
| JPMorgan Small Cap Growth Fund (Class R6 Shares) | November 30, 2010 | 39.77 | % | 2.25 | % | 14.27 | % |
| Russell 3000 Index | 22.82 | 12.31 | 15.06 | ||||
| Russell 2000 Growth Index | 38.74 | 5.57 | 11.97 |
KEY FUND STATISTICS
| Fund net assets (000's) | $2,592,081 | |
| Total number of portfolio holdings | 145 | |
| Portfolio turnover rate | 82 | % |
| Total advisory fees paid (000's) | $17,691 |
PORTFOLIO COMPOSITION - SECTOR
(% of Total Investments)
(% of Total Investments)
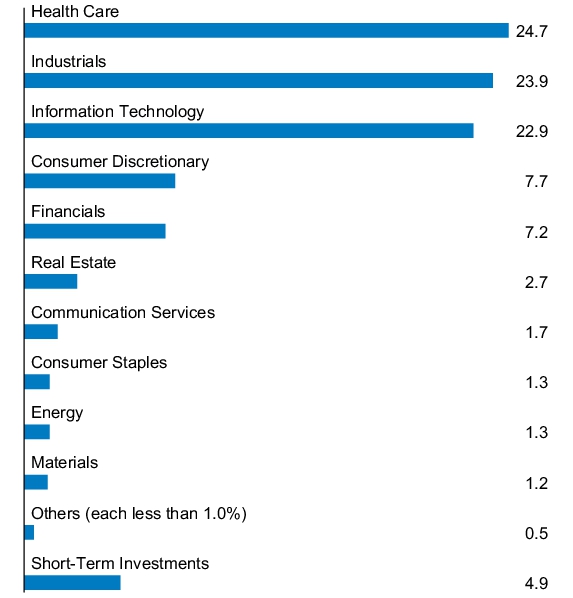
What were the Fund costs for the last year?
(based on a hypothetical $10,000 investment)
| Fund (Class) | Costs of a $10,000 investment |
Costs paid as a percentage of a $10,000 investment |
| JPMorgan Small Cap Growth Fund (Class R5 Shares) |
$101 | 0.84% |
How did the Fund Perform?
The JPMorgan Small Cap Growth Fund's Class R5 Shares returned 39.65% for the twelve months ended June 30, 2026. The Russell 3000 Index returned 22.82% and the Russell 2000 Growth Index (the "Index") returned 38.74% for the twelve months ended June 30, 2026.
- The Fund’s security selection in the technology and health care sectors contributed to relative performance.
- The Fund’s overweight allocations to Vicor and DigitalOcean contributed to relative performance.
- The Fund’s security selection in the consumer discretionary sector and underweight allocation to the telecommunications sector detracted from relative performance.
- The Fund’s underweight allocation to Bloom Energy and overweight allocation to BlackLine detracted from relative performance.
Fund Performance
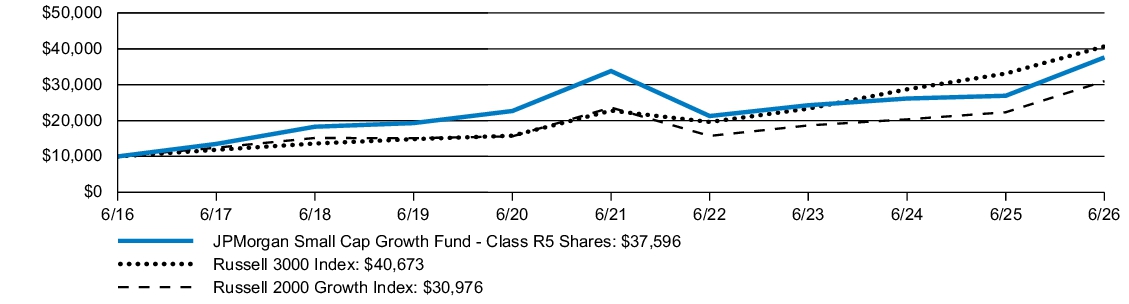
| AVERAGE ANNUAL TOTAL RETURNS | INCEPTION DATE |
1 YEAR | 5 YEAR | 10 YEAR | |||
| JPMorgan Small Cap Growth Fund (Class R5 Shares) | September 9, 2016 | 39.65 | % | 2.15 | % | 14.16 | % |
| Russell 3000 Index | 22.82 | 12.31 | 15.06 | ||||
| Russell 2000 Growth Index | 38.74 | 5.57 | 11.97 |
KEY FUND STATISTICS
| Fund net assets (000's) | $2,592,081 | |
| Total number of portfolio holdings | 145 | |
| Portfolio turnover rate | 82 | % |
| Total advisory fees paid (000's) | $17,691 |
PORTFOLIO COMPOSITION - SECTOR
(% of Total Investments)
(% of Total Investments)
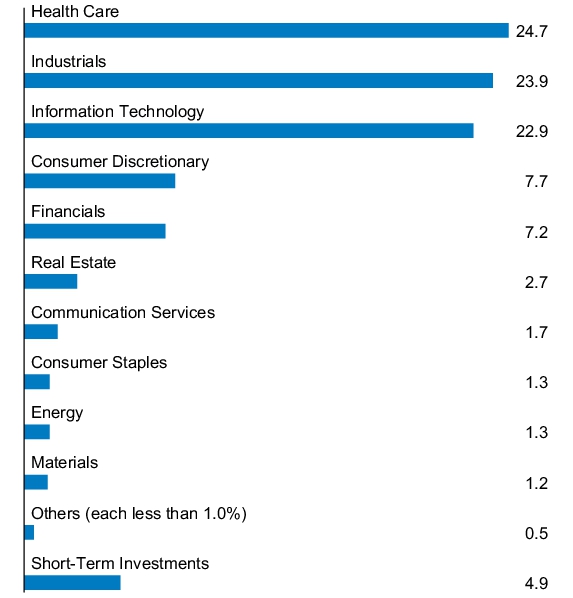
What were the Fund costs for the last year?
(based on a hypothetical $10,000 investment)
| Fund (Class) | Costs of a $10,000 investment |
Costs paid as a percentage of a $10,000 investment |
| JPMorgan Small Cap Growth Fund (Class R4 Shares) |
$118 | 0.99% |
How did the Fund Perform?
The JPMorgan Small Cap Growth Fund's Class R4 Shares returned 39.42% for the twelve months ended June 30, 2026. The Russell 3000 Index returned 22.82% and the Russell 2000 Growth Index (the "Index") returned 38.74% for the twelve months ended June 30, 2026.
- The Fund’s security selection in the technology and health care sectors contributed to relative performance.
- The Fund’s overweight allocations to Vicor and DigitalOcean contributed to relative performance.
- The Fund’s security selection in the consumer discretionary sector and underweight allocation to the telecommunications sector detracted from relative performance.
- The Fund’s underweight allocation to Bloom Energy and overweight allocation to BlackLine detracted from relative performance.
Fund Performance
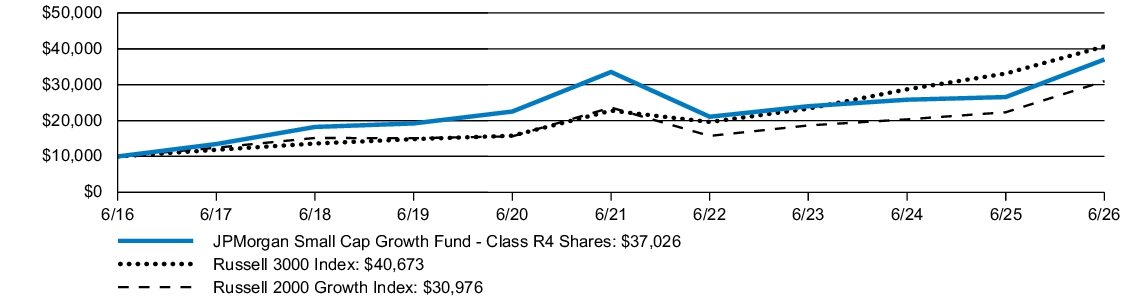
| AVERAGE ANNUAL TOTAL RETURNS | INCEPTION DATE |
1 YEAR | 5 YEAR | 10 YEAR | |||
| JPMorgan Small Cap Growth Fund (Class R4 Shares) | July 31, 2017 | 39.42 | % | 2.00 | % | 13.99 | % |
| Russell 3000 Index | 22.82 | 12.31 | 15.06 | ||||
| Russell 2000 Growth Index | 38.74 | 5.57 | 11.97 |
KEY FUND STATISTICS
| Fund net assets (000's) | $2,592,081 | |
| Total number of portfolio holdings | 145 | |
| Portfolio turnover rate | 82 | % |
| Total advisory fees paid (000's) | $17,691 |
PORTFOLIO COMPOSITION - SECTOR
(% of Total Investments)
(% of Total Investments)
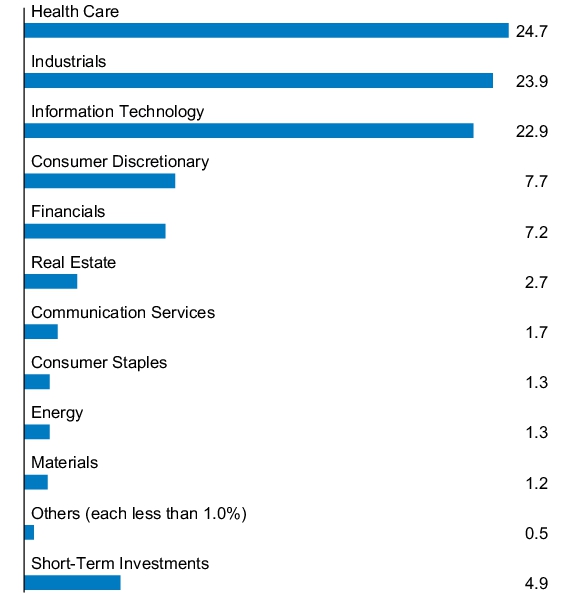
What were the Fund costs for the last year?
(based on a hypothetical $10,000 investment)
| Fund (Class) | Costs of a $10,000 investment |
Costs paid as a percentage of a $10,000 investment |
| JPMorgan Small Cap Growth Fund (Class R3 Shares) |
$148 | 1.24% |
How did the Fund Perform?
The JPMorgan Small Cap Growth Fund's Class R3 Shares returned 39.12% for the twelve months ended June 30, 2026. The Russell 3000 Index returned 22.82% and the Russell 2000 Growth Index (the "Index") returned 38.74% for the twelve months ended June 30, 2026.
- The Fund’s security selection in the technology and health care sectors contributed to relative performance.
- The Fund’s overweight allocations to Vicor and DigitalOcean contributed to relative performance.
- The Fund’s security selection in the consumer discretionary sector and underweight allocation to the telecommunications sector detracted from relative performance.
- The Fund’s underweight allocation to Bloom Energy and overweight allocation to BlackLine detracted from relative performance.
Fund Performance
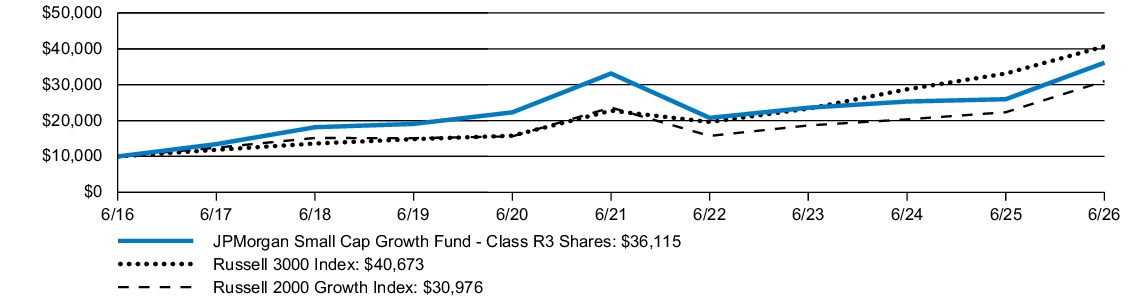
| AVERAGE ANNUAL TOTAL RETURNS | INCEPTION DATE |
1 YEAR | 5 YEAR | 10 YEAR | |||
| JPMorgan Small Cap Growth Fund (Class R3 Shares) | July 31, 2017 | 39.12 | % | 1.74 | % | 13.70 | % |
| Russell 3000 Index | 22.82 | 12.31 | 15.06 | ||||
| Russell 2000 Growth Index | 38.74 | 5.57 | 11.97 |
KEY FUND STATISTICS
| Fund net assets (000's) | $2,592,081 | |
| Total number of portfolio holdings | 145 | |
| Portfolio turnover rate | 82 | % |
| Total advisory fees paid (000's) | $17,691 |
PORTFOLIO COMPOSITION - SECTOR
(% of Total Investments)
(% of Total Investments)
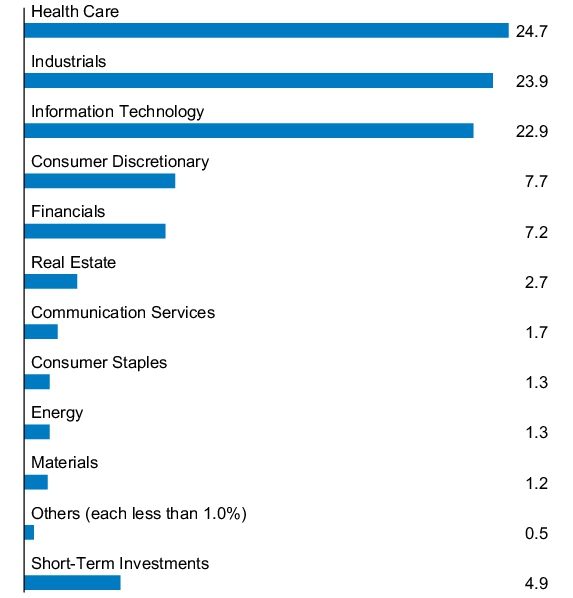
What were the Fund costs for the last year?
(based on a hypothetical $10,000 investment)
| Fund (Class) | Costs of a $10,000 investment |
Costs paid as a percentage of a $10,000 investment |
| JPMorgan Small Cap Growth Fund (Class R2 Shares) |
$178 | 1.49% |
How did the Fund Perform?
The JPMorgan Small Cap Growth Fund's Class R2 Shares returned 38.67% for the twelve months ended June 30, 2026. The Russell 3000 Index returned 22.82% and the Russell 2000 Growth Index (the "Index") returned 38.74% for the twelve months ended June 30, 2026.
- The Fund’s security selection in the technology and health care sectors contributed to relative performance.
- The Fund’s overweight allocations to Vicor and DigitalOcean contributed to relative performance.
- The Fund’s security selection in the consumer discretionary sector and underweight allocation to the telecommunications sector detracted from relative performance.
- The Fund’s underweight allocation to Bloom Energy and overweight allocation to BlackLine detracted from relative performance.
Fund Performance
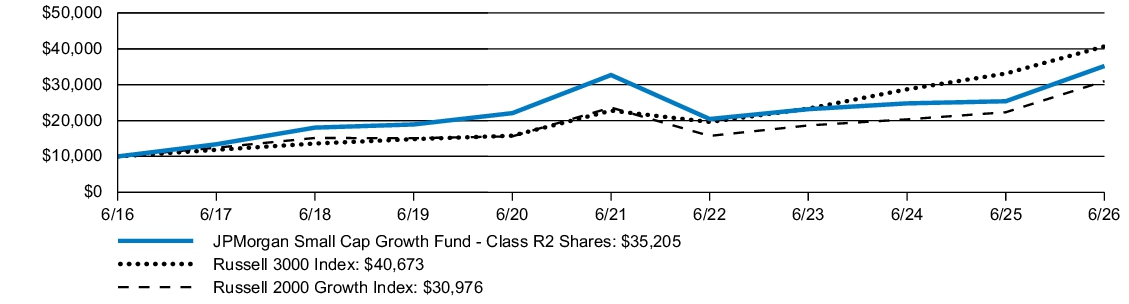
| AVERAGE ANNUAL TOTAL RETURNS | INCEPTION DATE |
1 YEAR | 5 YEAR | 10 YEAR | |||
| JPMorgan Small Cap Growth Fund (Class R2 Shares) | November 3, 2008 | 38.67 | % | 1.49 | % | 13.41 | % |
| Russell 3000 Index | 22.82 | 12.31 | 15.06 | ||||
| Russell 2000 Growth Index | 38.74 | 5.57 | 11.97 |
KEY FUND STATISTICS
| Fund net assets (000's) | $2,592,081 | |
| Total number of portfolio holdings | 145 | |
| Portfolio turnover rate | 82 | % |
| Total advisory fees paid (000's) | $17,691 |
PORTFOLIO COMPOSITION - SECTOR
(% of Total Investments)
(% of Total Investments)
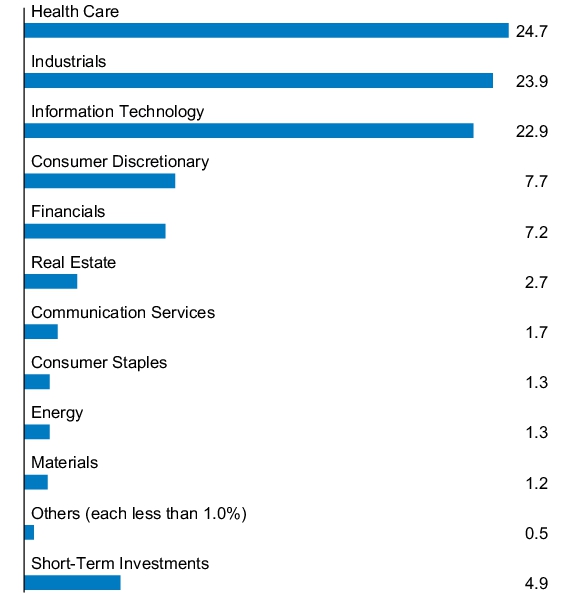
What were the Fund costs for the last year?
(based on a hypothetical $10,000 investment)
| Fund (Class) | Costs of a $10,000 investment |
Costs paid as a percentage of a $10,000 investment |
| JPMorgan Small Cap Growth Fund (Class L Shares) |
$101 | 0.84% |
How did the Fund Perform?
The JPMorgan Small Cap Growth Fund's Class L Shares returned 39.61% for the twelve months ended June 30, 2026. The Russell 3000 Index returned 22.82% and the Russell 2000 Growth Index (the "Index") returned 38.74% for the twelve months ended June 30, 2026.
- The Fund’s security selection in the technology and health care sectors contributed to relative performance.
- The Fund’s overweight allocations to Vicor and DigitalOcean contributed to relative performance.
- The Fund’s security selection in the consumer discretionary sector and underweight allocation to the telecommunications sector detracted from relative performance.
- The Fund’s underweight allocation to Bloom Energy and overweight allocation to BlackLine detracted from relative performance.
Fund Performance
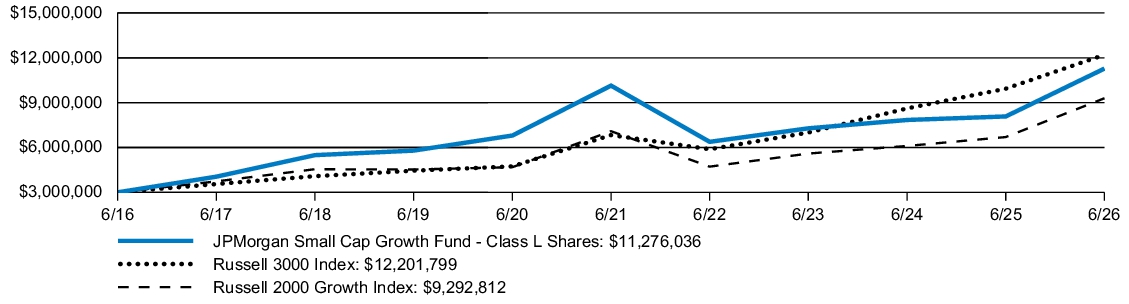
| AVERAGE ANNUAL TOTAL RETURNS | INCEPTION DATE |
1 YEAR | 5 YEAR | 10 YEAR | |||
| JPMorgan Small Cap Growth Fund (Class L Shares) | February 19, 2005 | 39.61 | % | 2.15 | % | 14.16 | % |
| Russell 3000 Index | 22.82 | 12.31 | 15.06 | ||||
| Russell 2000 Growth Index | 38.74 | 5.57 | 11.97 |
KEY FUND STATISTICS
| Fund net assets (000's) | $2,592,081 | |
| Total number of portfolio holdings | 145 | |
| Portfolio turnover rate | 82 | % |
| Total advisory fees paid (000's) | $17,691 |
PORTFOLIO COMPOSITION - SECTOR
(% of Total Investments)
(% of Total Investments)
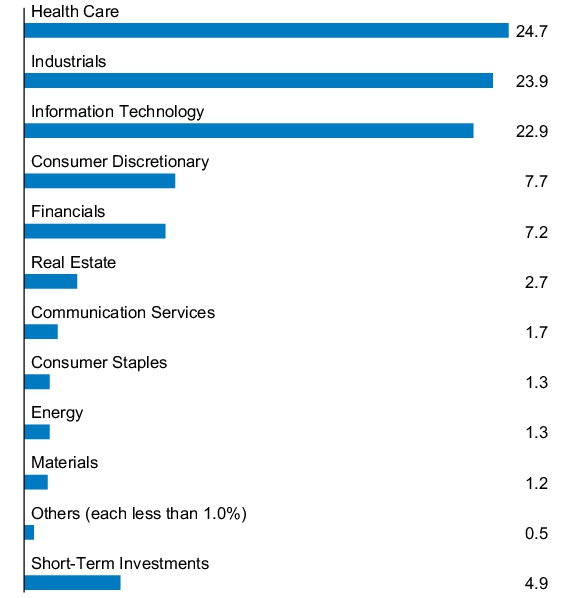
What were the Fund costs for the last year?
(based on a hypothetical $10,000 investment)
| Fund (Class) | Costs of a $10,000 investment |
Costs paid as a percentage of a $10,000 investment |
| JPMorgan Small Cap Growth Fund (Class I Shares) |
$118 | 0.99% |
How did the Fund Perform?
The JPMorgan Small Cap Growth Fund's Class I Shares returned 39.37% for the twelve months ended June 30, 2026. The Russell 3000 Index returned 22.82% and the Russell 2000 Growth Index (the "Index") returned 38.74% for the twelve months ended June 30, 2026.
- The Fund’s security selection in the technology and health care sectors contributed to relative performance.
- The Fund’s overweight allocations to Vicor and DigitalOcean contributed to relative performance.
- The Fund’s security selection in the consumer discretionary sector and underweight allocation to the telecommunications sector detracted from relative performance.
- The Fund’s underweight allocation to Bloom Energy and overweight allocation to BlackLine detracted from relative performance.
Fund Performance
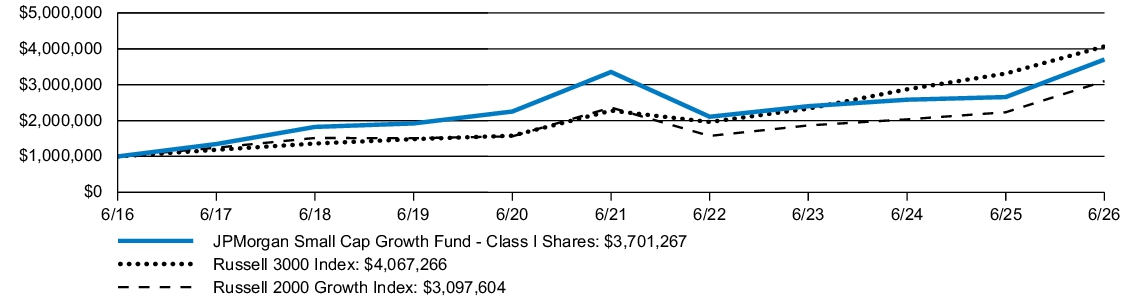
| AVERAGE ANNUAL TOTAL RETURNS | INCEPTION DATE |
1 YEAR | 5 YEAR | 10 YEAR | |||
| JPMorgan Small Cap Growth Fund (Class I Shares) | March 26, 1996 | 39.37 | % | 1.99 | % | 13.98 | % |
| Russell 3000 Index | 22.82 | 12.31 | 15.06 | ||||
| Russell 2000 Growth Index | 38.74 | 5.57 | 11.97 |
KEY FUND STATISTICS
| Fund net assets (000's) | $2,592,081 | |
| Total number of portfolio holdings | 145 | |
| Portfolio turnover rate | 82 | % |
| Total advisory fees paid (000's) | $17,691 |
PORTFOLIO COMPOSITION - SECTOR
(% of Total Investments)
(% of Total Investments)
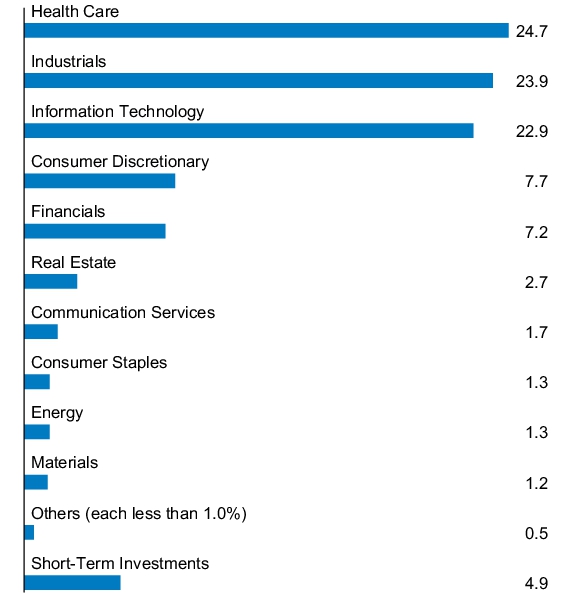
What were the Fund costs for the last year?
(based on a hypothetical $10,000 investment)
| Fund (Class) | Costs of a $10,000 investment |
Costs paid as a percentage of a $10,000 investment |
| JPMorgan Small Cap Growth Fund (Class C Shares) |
$207 | 1.74% |
How did the Fund Perform?
The JPMorgan Small Cap Growth Fund's Class C Shares, without a sales charge, returned 38.44% for the twelve months ended June 30, 2026. The Russell 3000 Index returned 22.82% and the Russell 2000 Growth Index (the "Index") returned 38.74% for the twelve months ended June 30, 2026.
- The Fund’s security selection in the technology and health care sectors contributed to relative performance.
- The Fund’s overweight allocations to Vicor and DigitalOcean contributed to relative performance.
- The Fund’s security selection in the consumer discretionary sector and underweight allocation to the telecommunications sector detracted from relative performance.
- The Fund’s underweight allocation to Bloom Energy and overweight allocation to BlackLine detracted from relative performance.
Fund Performance
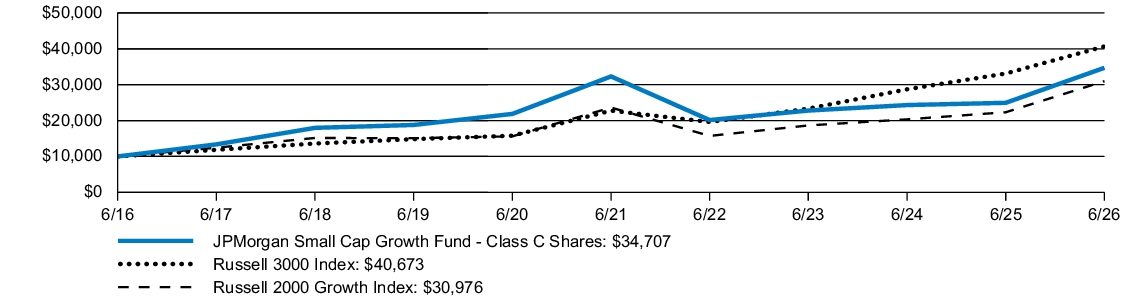
| AVERAGE ANNUAL TOTAL RETURNS | INCEPTION DATE |
1 YEAR | 5 YEAR | 10 YEAR | |||
| JPMorgan Small Cap Growth Fund (Class C Shares) | November 4, 1997 | 37.44 | % | 1.24 | % | 13.25 | % |
| JPMorgan Small Cap Growth Fund (Class C Shares) - excluding sales charge | 38.44 | 1.24 | 13.25 | ||||
| Russell 3000 Index | 22.82 | 12.31 | 15.06 | ||||
| Russell 2000 Growth Index | 38.74 | 5.57 | 11.97 |
KEY FUND STATISTICS
| Fund net assets (000's) | $2,592,081 | |
| Total number of portfolio holdings | 145 | |
| Portfolio turnover rate | 82 | % |
| Total advisory fees paid (000's) | $17,691 |
PORTFOLIO COMPOSITION - SECTOR
(% of Total Investments)
(% of Total Investments)
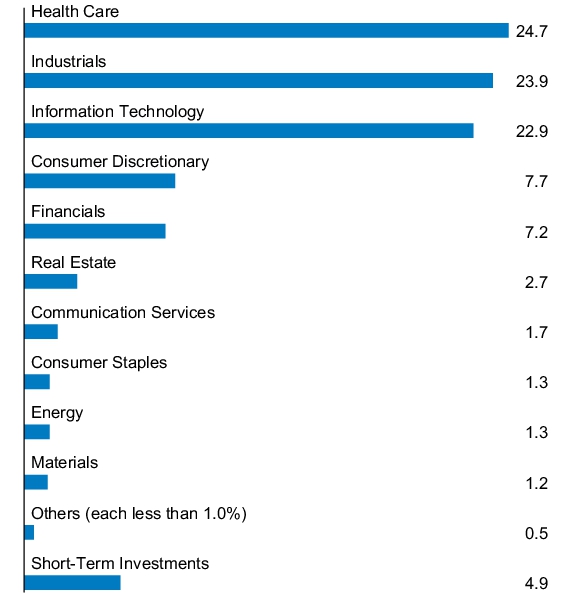
What were the Fund costs for the last year?
(based on a hypothetical $10,000 investment)
| Fund (Class) | Costs of a $10,000 investment |
Costs paid as a percentage of a $10,000 investment |
| JPMorgan Small Cap Growth Fund (Class A Shares) |
$148 | 1.24% |
How did the Fund Perform?
The JPMorgan Small Cap Growth Fund's Class A Shares, without a sales charge, returned 39.09% for the twelve months ended June 30, 2026. The Russell 3000 Index returned 22.82% and the Russell 2000 Growth Index (the "Index") returned 38.74% for the twelve months ended June 30, 2026.
- The Fund’s security selection in the technology and health care sectors contributed to relative performance.
- The Fund’s overweight allocations to Vicor and DigitalOcean contributed to relative performance.
- The Fund’s security selection in the consumer discretionary sector and underweight allocation to the telecommunications sector detracted from relative performance.
- The Fund’s underweight allocation to Bloom Energy and overweight allocation to BlackLine detracted from relative performance.
Fund Performance
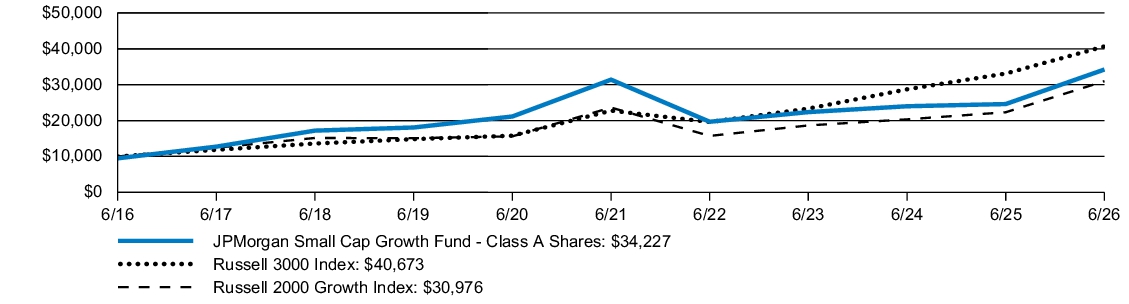
| AVERAGE ANNUAL TOTAL RETURNS | INCEPTION DATE |
1 YEAR | 5 YEAR | 10 YEAR | |||
| JPMorgan Small Cap Growth Fund (Class A Shares) | July 1, 1991 | 31.82 | % | 0.65 | % | 13.09 | % |
| JPMorgan Small Cap Growth Fund (Class A Shares) - excluding sales charge | 39.09 | 1.74 | 13.70 | ||||
| Russell 3000 Index | 22.82 | 12.31 | 15.06 | ||||
| Russell 2000 Growth Index | 38.74 | 5.57 | 11.97 |
KEY FUND STATISTICS
| Fund net assets (000's) | $2,592,081 | |
| Total number of portfolio holdings | 145 | |
| Portfolio turnover rate | 82 | % |
| Total advisory fees paid (000's) | $17,691 |
PORTFOLIO COMPOSITION - SECTOR
(% of Total Investments)
(% of Total Investments)
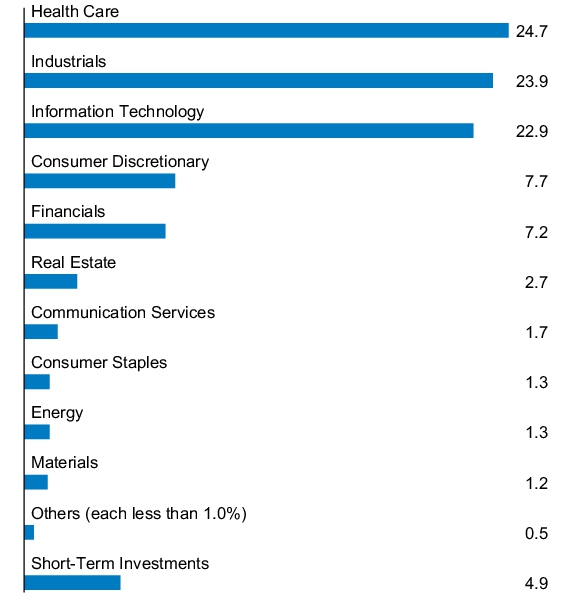
What were the Fund costs for the last year?
(based on a hypothetical $10,000 investment)
| Fund (Class) | Costs of a $10,000 investment |
Costs paid as a percentage of a $10,000 investment |
| JPMorgan Small Cap Value Fund (Class A Shares) |
$144 | 1.19% |
How did the Fund Perform?
The JPMorgan Small Cap Value Fund's Class A Shares, without a sales charge, returned 41.92% for the twelve months ended June 30, 2026. The Russell 3000 Index returned 22.82% and the Russell 2000 Value Index (the "Index") returned 43.01% for the twelve months ended June 30, 2026.
- The Fund's security selection in the health care and financials sectors detracted from performance.
- The Fund's security selection in the industrials and utilities sectors contributed to performance.
- The Fund's underweight allocation to TTM Technologies and not owning EchoStar detracted from performance.
- The Fund's overweight allocation to Sanmina and Ralliant Corp. contributed to performance.
Fund Performance
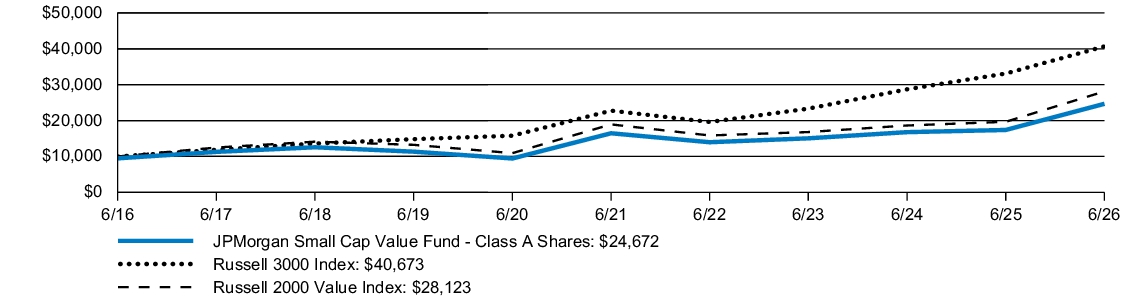
| AVERAGE ANNUAL TOTAL RETURNS | INCEPTION DATE |
1 YEAR | 5 YEAR | 10 YEAR | |||
| JPMorgan Small Cap Value Fund (Class A Shares) | January 27, 1995 | 34.47 | % | 7.26 | % | 9.45 | % |
| JPMorgan Small Cap Value Fund (Class A Shares) - excluding sales charge | 41.92 | 8.43 | 10.04 | ||||
| Russell 3000 Index | 22.82 | 12.31 | 15.06 | ||||
| Russell 2000 Value Index | 43.01 | 8.23 | 10.89 |
KEY FUND STATISTICS
| Fund net assets (000's) | $1,315,121 | |
| Total number of portfolio holdings | 490 | |
| Portfolio turnover rate | 82 | % |
| Total advisory fees paid (000's) | $7,875 |
PORTFOLIO COMPOSITION - SECTOR
(% of Total Investments)
(% of Total Investments)
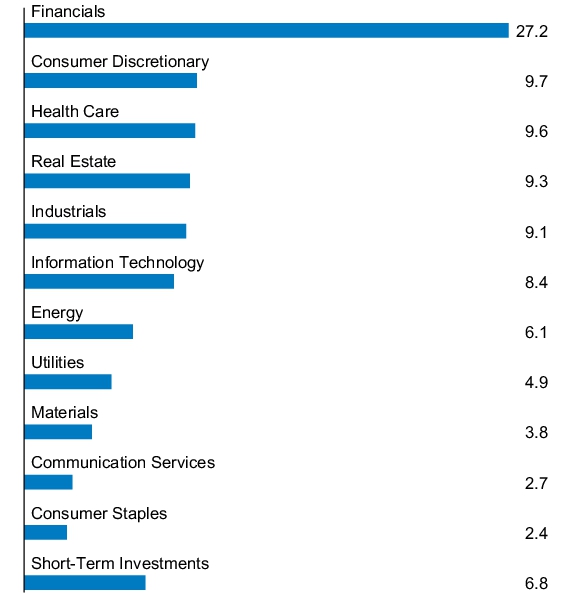
What were the Fund costs for the last year?
(based on a hypothetical $10,000 investment)
| Fund (Class) | Costs of a $10,000 investment |
Costs paid as a percentage of a $10,000 investment |
| JPMorgan Small Cap Value Fund (Class C Shares) |
$204 | 1.69% |
How did the Fund Perform?
The JPMorgan Small Cap Value Fund's Class C Shares, without a sales charge, returned 41.29% for the twelve months ended June 30, 2026. The Russell 3000 Index returned 22.82% and the Russell 2000 Value Index (the "Index") returned 43.01% for the twelve months ended June 30, 2026.
- The Fund's security selection in the health care and financials sectors detracted from performance.
- The Fund's security selection in the industrials and utilities sectors contributed to performance.
- The Fund's underweight allocation to TTM Technologies and not owning EchoStar detracted from performance.
- The Fund's overweight allocation to Sanmina and Ralliant Corp. contributed to performance.
Fund Performance
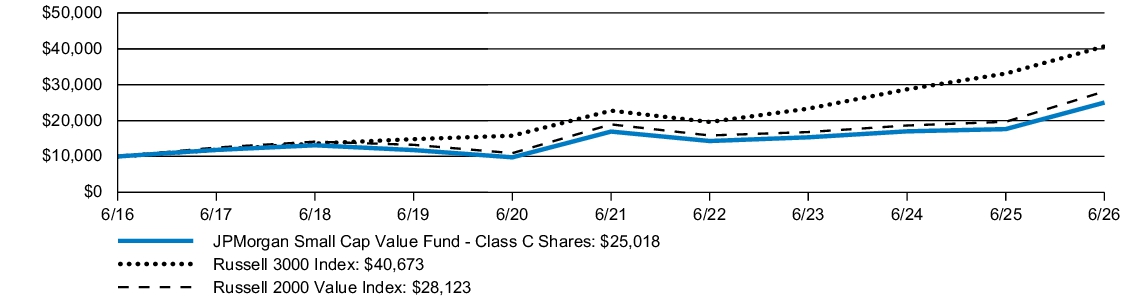
| AVERAGE ANNUAL TOTAL RETURNS | INCEPTION DATE |
1 YEAR | 5 YEAR | 10 YEAR | |||
| JPMorgan Small Cap Value Fund (Class C Shares) | March 22, 1999 | 40.29 | % | 7.90 | % | 9.60 | % |
| JPMorgan Small Cap Value Fund (Class C Shares) - excluding sales charge | 41.29 | 7.90 | 9.60 | ||||
| Russell 3000 Index | 22.82 | 12.31 | 15.06 | ||||
| Russell 2000 Value Index | 43.01 | 8.23 | 10.89 |
KEY FUND STATISTICS
| Fund net assets (000's) | $1,315,121 | |
| Total number of portfolio holdings | 490 | |
| Portfolio turnover rate | 82 | % |
| Total advisory fees paid (000's) | $7,875 |
PORTFOLIO COMPOSITION - SECTOR
(% of Total Investments)
(% of Total Investments)
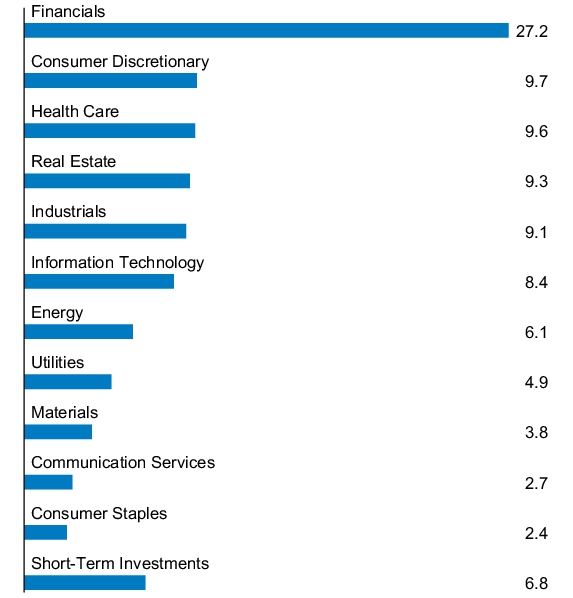
What were the Fund costs for the last year?
(based on a hypothetical $10,000 investment)
| Fund (Class) | Costs of a $10,000 investment |
Costs paid as a percentage of a $10,000 investment |
| JPMorgan Small Cap Value Fund (Class I Shares) |
$114 | 0.94% |
How did the Fund Perform?
The JPMorgan Small Cap Value Fund's Class I Shares returned 42.30% for the twelve months ended June 30, 2026. The Russell 3000 Index returned 22.82% and the Russell 2000 Value Index (the "Index") returned 43.01% for the twelve months ended June 30, 2026.
- The Fund's security selection in the health care and financials sectors detracted from performance.
- The Fund's security selection in the industrials and utilities sectors contributed to performance.
- The Fund's underweight allocation to TTM Technologies and not owning EchoStar detracted from performance.
- The Fund's overweight allocation to Sanmina and Ralliant Corp. contributed to performance.
Fund Performance
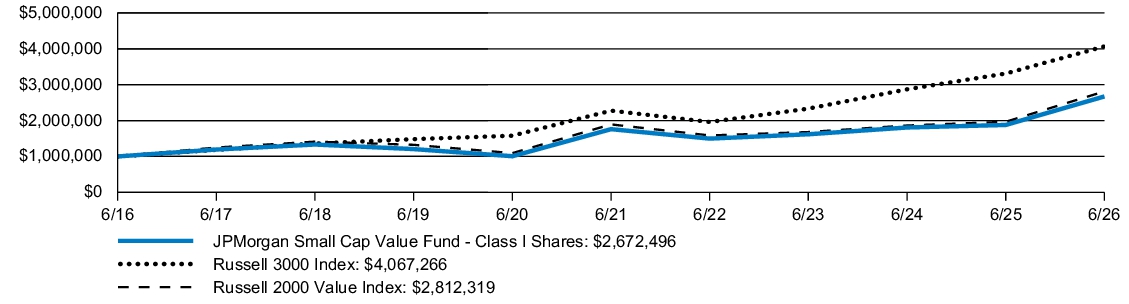
| AVERAGE ANNUAL TOTAL RETURNS | INCEPTION DATE |
1 YEAR | 5 YEAR | 10 YEAR | |||
| JPMorgan Small Cap Value Fund (Class I Shares) | January 27, 1995 | 42.30 | % | 8.70 | % | 10.33 | % |
| Russell 3000 Index | 22.82 | 12.31 | 15.06 | ||||
| Russell 2000 Value Index | 43.01 | 8.23 | 10.89 |
KEY FUND STATISTICS
| Fund net assets (000's) | $1,315,121 | |
| Total number of portfolio holdings | 490 | |
| Portfolio turnover rate | 82 | % |
| Total advisory fees paid (000's) | $7,875 |
PORTFOLIO COMPOSITION - SECTOR
(% of Total Investments)
(% of Total Investments)
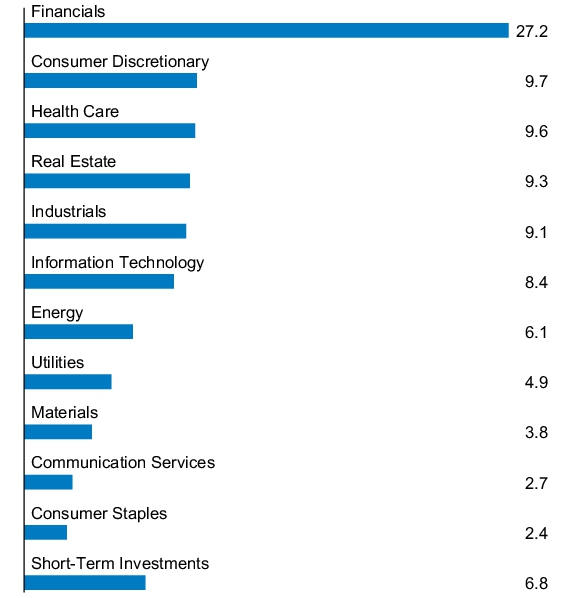
What were the Fund costs for the last year?
(based on a hypothetical $10,000 investment)
| Fund (Class) | Costs of a $10,000 investment |
Costs paid as a percentage of a $10,000 investment |
| JPMorgan Small Cap Value Fund (Class R2 Shares) |
$180 | 1.49% |
How did the Fund Perform?
The JPMorgan Small Cap Value Fund's Class R2 Shares returned 41.57% for the twelve months ended June 30, 2026. The Russell 3000 Index returned 22.82% and the Russell 2000 Value Index (the "Index") returned 43.01% for the twelve months ended June 30, 2026.
- The Fund's security selection in the health care and financials sectors detracted from performance.
- The Fund's security selection in the industrials and utilities sectors contributed to performance.
- The Fund's underweight allocation to TTM Technologies and not owning EchoStar detracted from performance.
- The Fund's overweight allocation to Sanmina and Ralliant Corp. contributed to performance.
Fund Performance
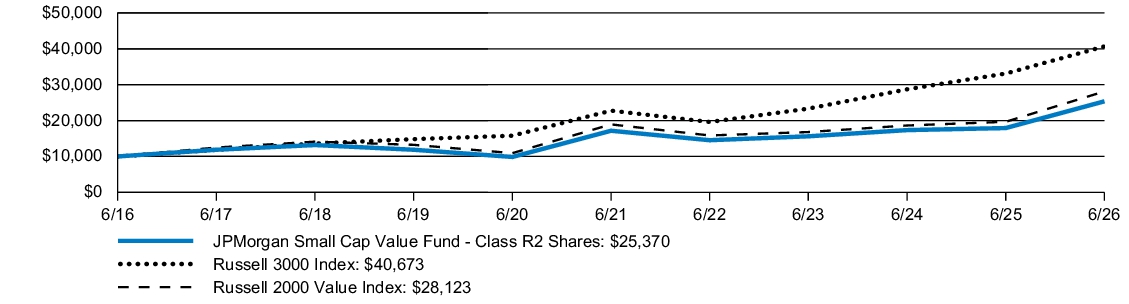
| AVERAGE ANNUAL TOTAL RETURNS | INCEPTION DATE |
1 YEAR | 5 YEAR | 10 YEAR | |||
| JPMorgan Small Cap Value Fund (Class R2 Shares) | November 3, 2008 | 41.57 | % | 8.13 | % | 9.76 | % |
| Russell 3000 Index | 22.82 | 12.31 | 15.06 | ||||
| Russell 2000 Value Index | 43.01 | 8.23 | 10.89 |
KEY FUND STATISTICS
| Fund net assets (000's) | $1,315,121 | |
| Total number of portfolio holdings | 490 | |
| Portfolio turnover rate | 82 | % |
| Total advisory fees paid (000's) | $7,875 |
PORTFOLIO COMPOSITION - SECTOR
(% of Total Investments)
(% of Total Investments)
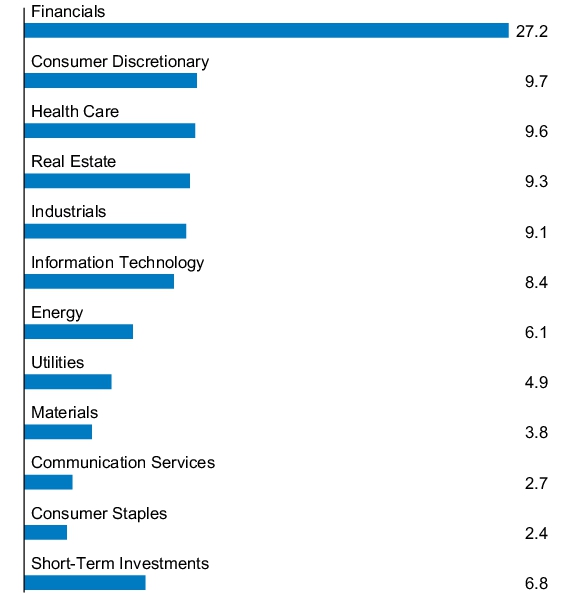
What were the Fund costs for the last year?
(based on a hypothetical $10,000 investment)
| Fund (Class) | Costs of a $10,000 investment |
Costs paid as a percentage of a $10,000 investment |
| JPMorgan Small Cap Value Fund (Class R3 Shares) |
$150 | 1.24% |
How did the Fund Perform?
The JPMorgan Small Cap Value Fund's Class R3 Shares returned 41.90% for the twelve months ended June 30, 2026. The Russell 3000 Index returned 22.82% and the Russell 2000 Value Index (the "Index") returned 43.01% for the twelve months ended June 30, 2026.
- The Fund's security selection in the health care and financials sectors detracted from performance.
- The Fund's security selection in the industrials and utilities sectors contributed to performance.
- The Fund's underweight allocation to TTM Technologies and not owning EchoStar detracted from performance.
- The Fund's overweight allocation to Sanmina and Ralliant Corp. contributed to performance.
Fund Performance
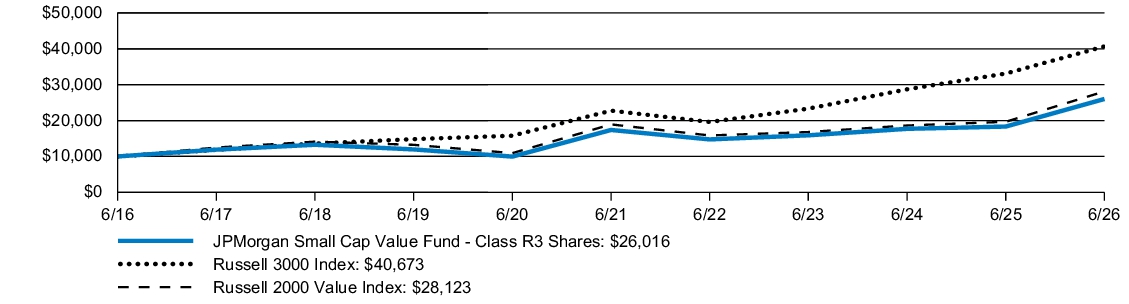
| AVERAGE ANNUAL TOTAL RETURNS | INCEPTION DATE |
1 YEAR | 5 YEAR | 10 YEAR | |||
| JPMorgan Small Cap Value Fund (Class R3 Shares) | September 9, 2016 | 41.90 | % | 8.40 | % | 10.03 | % |
| Russell 3000 Index | 22.82 | 12.31 | 15.06 | ||||
| Russell 2000 Value Index | 43.01 | 8.23 | 10.89 |
KEY FUND STATISTICS
| Fund net assets (000's) | $1,315,121 | |
| Total number of portfolio holdings | 490 | |
| Portfolio turnover rate | 82 | % |
| Total advisory fees paid (000's) | $7,875 |
PORTFOLIO COMPOSITION - SECTOR
(% of Total Investments)
(% of Total Investments)
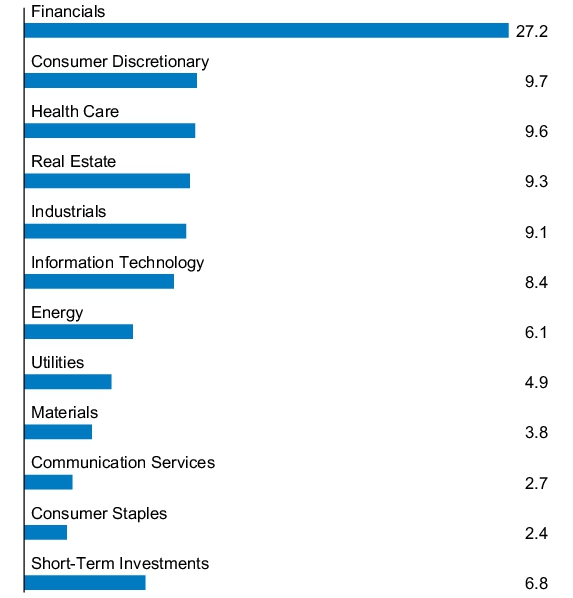
What were the Fund costs for the last year?
(based on a hypothetical $10,000 investment)
| Fund (Class) | Costs of a $10,000 investment |
Costs paid as a percentage of a $10,000 investment |
| JPMorgan Small Cap Value Fund (Class R4 Shares) |
$120 | 0.99% |
How did the Fund Perform?
The JPMorgan Small Cap Value Fund's Class R4 Shares returned 42.25% for the twelve months ended June 30, 2026. The Russell 3000 Index returned 22.82% and the Russell 2000 Value Index (the "Index") returned 43.01% for the twelve months ended June 30, 2026.
- The Fund's security selection in the health care and financials sectors detracted from performance.
- The Fund's security selection in the industrials and utilities sectors contributed to performance.
- The Fund's underweight allocation to TTM Technologies and not owning EchoStar detracted from performance.
- The Fund's overweight allocation to Sanmina and Ralliant Corp. contributed to performance.
Fund Performance
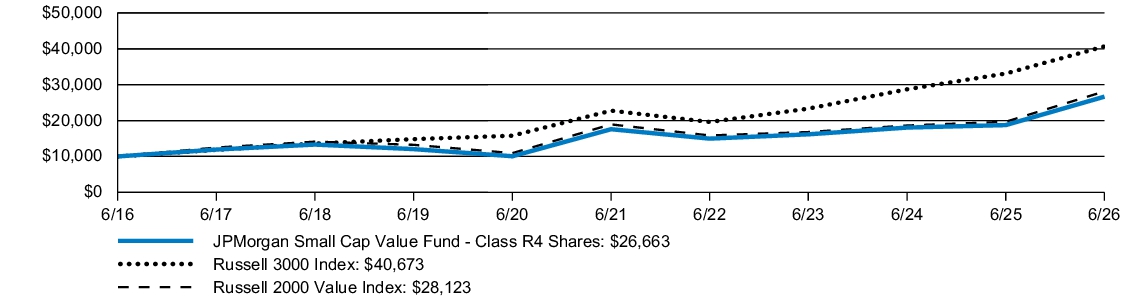
| AVERAGE ANNUAL TOTAL RETURNS | INCEPTION DATE |
1 YEAR | 5 YEAR | 10 YEAR | |||
| JPMorgan Small Cap Value Fund (Class R4 Shares) | September 9, 2016 | 42.25 | % | 8.67 | % | 10.30 | % |
| Russell 3000 Index | 22.82 | 12.31 | 15.06 | ||||
| Russell 2000 Value Index | 43.01 | 8.23 | 10.89 |
KEY FUND STATISTICS
| Fund net assets (000's) | $1,315,121 | |
| Total number of portfolio holdings | 490 | |
| Portfolio turnover rate | 82 | % |
| Total advisory fees paid (000's) | $7,875 |
PORTFOLIO COMPOSITION - SECTOR
(% of Total Investments)
(% of Total Investments)
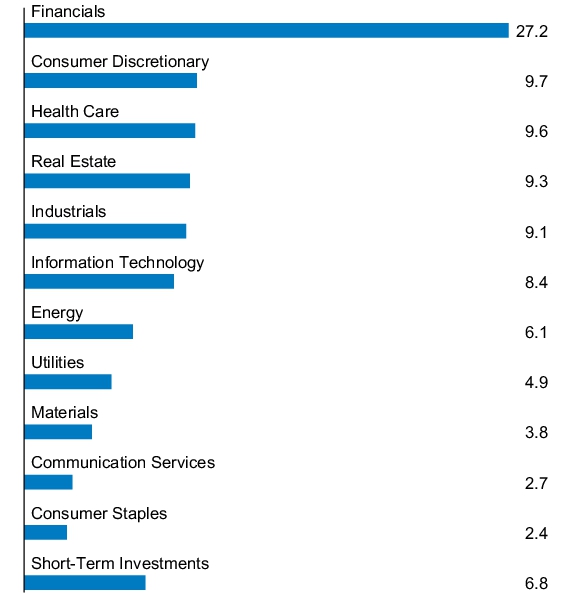
What were the Fund costs for the last year?
(based on a hypothetical $10,000 investment)
| Fund (Class) | Costs of a $10,000 investment |
Costs paid as a percentage of a $10,000 investment |
| JPMorgan Small Cap Value Fund (Class R5 Shares) |
$102 | 0.84% |
How did the Fund Perform?
The JPMorgan Small Cap Value Fund's Class R5 Shares returned 42.47% for the twelve months ended June 30, 2026. The Russell 3000 Index returned 22.82% and the Russell 2000 Value Index (the "Index") returned 43.01% for the twelve months ended June 30, 2026.
- The Fund's security selection in the health care and financials sectors detracted from performance.
- The Fund's security selection in the industrials and utilities sectors contributed to performance.
- The Fund's underweight allocation to TTM Technologies and not owning EchoStar detracted from performance.
- The Fund's overweight allocation to Sanmina and Ralliant Corp. contributed to performance.
Fund Performance
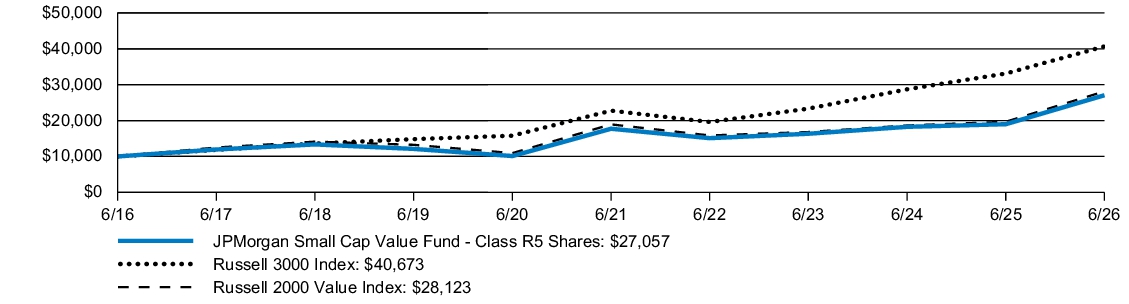
| AVERAGE ANNUAL TOTAL RETURNS | INCEPTION DATE |
1 YEAR | 5 YEAR | 10 YEAR | |||
| JPMorgan Small Cap Value Fund (Class R5 Shares) | May 15, 2006 | 42.47 | % | 8.83 | % | 10.47 | % |
| Russell 3000 Index | 22.82 | 12.31 | 15.06 | ||||
| Russell 2000 Value Index | 43.01 | 8.23 | 10.89 |
KEY FUND STATISTICS
| Fund net assets (000's) | $1,315,121 | |
| Total number of portfolio holdings | 490 | |
| Portfolio turnover rate | 82 | % |
| Total advisory fees paid (000's) | $7,875 |
PORTFOLIO COMPOSITION - SECTOR
(% of Total Investments)
(% of Total Investments)
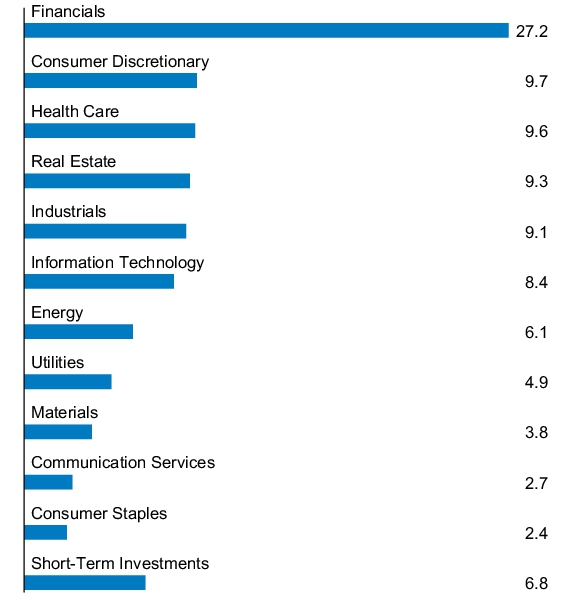
What were the Fund costs for the last year?
(based on a hypothetical $10,000 investment)
| Fund (Class) | Costs of a $10,000 investment |
Costs paid as a percentage of a $10,000 investment |
| JPMorgan Small Cap Value Fund (Class R6 Shares) |
$90 | 0.74% |
How did the Fund Perform?
The JPMorgan Small Cap Value Fund's Class R6 Shares returned 42.61% for the twelve months ended June 30, 2026. The Russell 3000 Index returned 22.82% and the Russell 2000 Value Index (the "Index") returned 43.01% for the twelve months ended June 30, 2026.
- The Fund's security selection in the health care and financials sectors detracted from performance.
- The Fund's security selection in the industrials and utilities sectors contributed to performance.
- The Fund's underweight allocation to TTM Technologies and not owning EchoStar detracted from performance.
- The Fund's overweight allocation to Sanmina and Ralliant Corp. contributed to performance.
Fund Performance
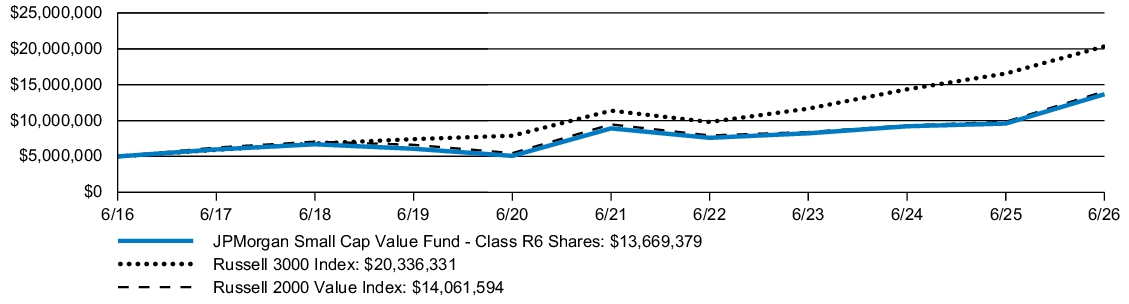
| AVERAGE ANNUAL TOTAL RETURNS | INCEPTION DATE |
1 YEAR | 5 YEAR | 10 YEAR | |||
| JPMorgan Small Cap Value Fund (Class R6 Shares) | February 22, 2005 | 42.61 | % | 8.94 | % | 10.58 | % |
| Russell 3000 Index | 22.82 | 12.31 | 15.06 | ||||
| Russell 2000 Value Index | 43.01 | 8.23 | 10.89 |
KEY FUND STATISTICS
| Fund net assets (000's) | $1,315,121 | |
| Total number of portfolio holdings | 490 | |
| Portfolio turnover rate | 82 | % |
| Total advisory fees paid (000's) | $7,875 |
PORTFOLIO COMPOSITION - SECTOR
(% of Total Investments)
(% of Total Investments)
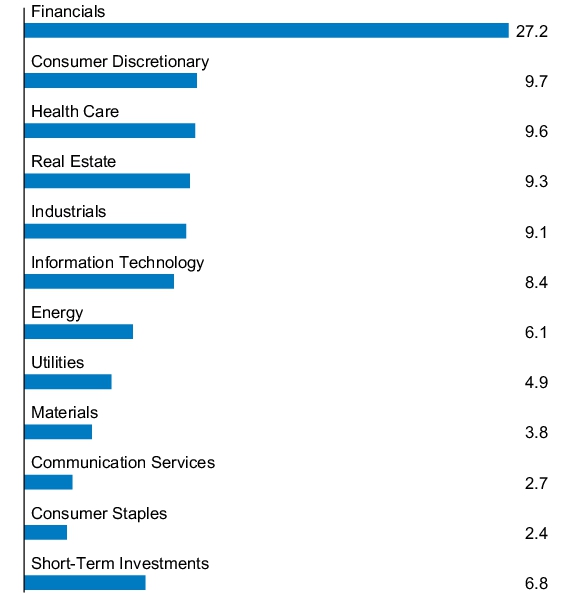
What were the Fund costs for the last year?
(based on a hypothetical $10,000 investment)
| Fund (Class) | Costs of a $10,000 investment |
Costs paid as a percentage of a $10,000 investment |
| JPMorgan Investor Growth Fund (Class R6 Shares) |
$7 | 0.07% |
How did the Fund Perform?
The Fund's Class R6 Shares returned 18.48% for the twelve months ended June 30, 2026. The Russell 3000 Index (the "Index") returned 22.82%, the Bloomberg US Intermediate Aggregate Index returned 3.76%, the MSCI EAFE Index (net total return) returned 20.23% and the Lipper Mixed-Asset Target Allocation Aggressive Growth Funds returned 22.79% for the twelve months ended June 30, 2026.
- Relative to the Index, which is an all-equity index, the Fund’s allocation to fixed income was a detractor, as equity markets outperformed fixed-income markets during the period.
- The allocation to equities contributed the most to overall performance, as global growth continued to power through — with overall economic growth remaining resilient and inflation continuing its move downward. Within equities, we preferred U.S. large-cap and international developed equities, which contributed to performance.
- Our allocation to corporate credit, including high-yield and investment-grade bonds, also contributed positively.
- The Fund’s longer overall duration from its allocation to the JPMorgan Core Bond Fund detracted from overall performance as credit outpaced Treasuries.
Fund Performance
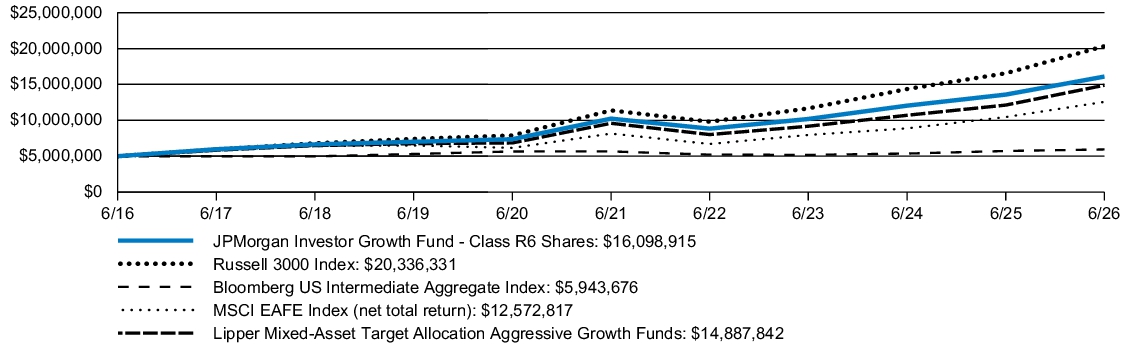
| AVERAGE ANNUAL TOTAL RETURNS | INCEPTION DATE |
1 YEAR | 5 YEAR | 10 YEAR | |||
| JPMorgan Investor Growth Fund (Class R6 Shares) | July 31, 2017 | 18.48 | % | 9.48 | % | 12.40 | % |
| Russell 3000 Index | 22.82 | 12.31 | 15.06 | ||||
| Bloomberg US Intermediate Aggregate Index | 3.76 | 0.97 | 1.74 | ||||
| MSCI EAFE Index (net total return) | 20.23 | 9.05 | 9.66 | ||||
| Lipper Mixed-Asset Target Allocation Aggressive Growth Funds | 22.79 | 9.19 | 11.52 |
KEY FUND STATISTICS
| Fund net assets (000's) | $7,096,260 | |
| Total number of portfolio holdings | 24 | |
| Portfolio turnover rate | 4 | % |
| Total advisory fees paid (000's) | $3,205 |
PORTFOLIO COMPOSITION - ASSET CLASS
(% of Total Investments)
(% of Total Investments)
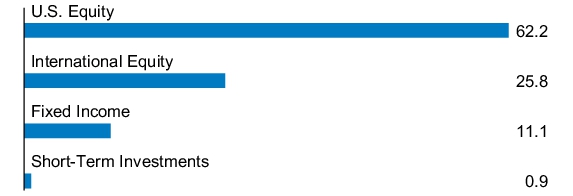
What were the Fund costs for the last year?
(based on a hypothetical $10,000 investment)
| Fund (Class) | Costs of a $10,000 investment |
Costs paid as a percentage of a $10,000 investment |
| JPMorgan Investor Growth Fund (Class I Shares) |
$34 | 0.31% |
How did the Fund Perform?
The Fund's Class I Shares returned 18.19% for the twelve months ended June 30, 2026. The Russell 3000 Index (the "Index") returned 22.82%, the Bloomberg US Intermediate Aggregate Index returned 3.76%, the MSCI EAFE Index (net total return) returned 20.23% and the Lipper Mixed-Asset Target Allocation Aggressive Growth Funds returned 22.79% for the twelve months ended June 30, 2026.
- Relative to the Index, which is an all-equity index, the Fund’s allocation to fixed income was a detractor, as equity markets outperformed fixed-income markets during the period.
- The allocation to equities contributed the most to overall performance, as global growth continued to power through — with overall economic growth remaining resilient and inflation continuing its move downward. Within equities, we preferred U.S. large-cap and international developed equities, which contributed to performance.
- Our allocation to corporate credit, including high-yield and investment-grade bonds, also contributed positively.
- The Fund’s longer overall duration from its allocation to the JPMorgan Core Bond Fund detracted from overall performance as credit outpaced Treasuries.
Fund Performance
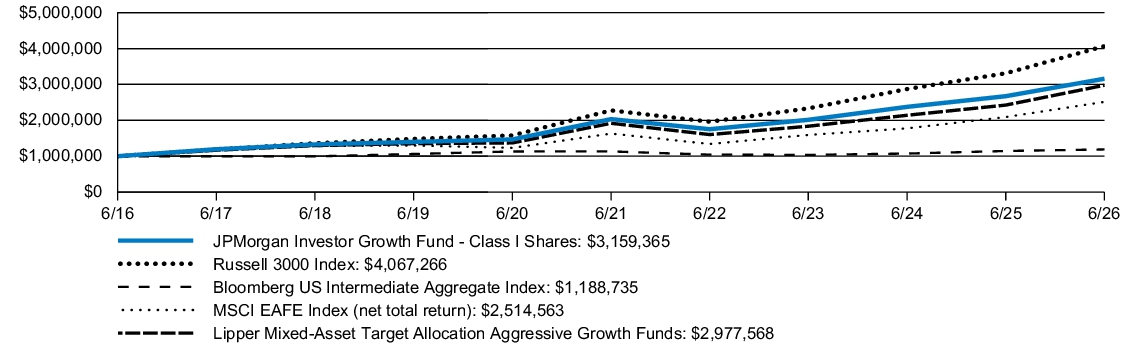
| AVERAGE ANNUAL TOTAL RETURNS | INCEPTION DATE |
1 YEAR | 5 YEAR | 10 YEAR | |||
| JPMorgan Investor Growth Fund (Class I Shares) | December 10, 1996 | 18.19 | % | 9.21 | % | 12.19 | % |
| Russell 3000 Index | 22.82 | 12.31 | 15.06 | ||||
| Bloomberg US Intermediate Aggregate Index | 3.76 | 0.97 | 1.74 | ||||
| MSCI EAFE Index (net total return) | 20.23 | 9.05 | 9.66 | ||||
| Lipper Mixed-Asset Target Allocation Aggressive Growth Funds | 22.79 | 9.19 | 11.52 |
KEY FUND STATISTICS
| Fund net assets (000's) | $7,096,260 | |
| Total number of portfolio holdings | 24 | |
| Portfolio turnover rate | 4 | % |
| Total advisory fees paid (000's) | $3,205 |
PORTFOLIO COMPOSITION - ASSET CLASS
(% of Total Investments)
(% of Total Investments)
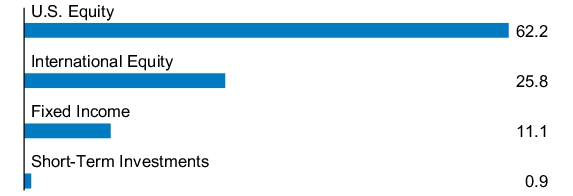
What were the Fund costs for the last year?
(based on a hypothetical $10,000 investment)
| Fund (Class) | Costs of a $10,000 investment |
Costs paid as a percentage of a $10,000 investment |
| JPMorgan Investor Growth Fund (Class C Shares) |
$116 | 1.07% |
How did the Fund Perform?
The Fund's Class C Shares, without a sales charge, returned 17.32% for the twelve months ended June 30, 2026. The Russell 3000 Index (the "Index") returned 22.82%, the Bloomberg US Intermediate Aggregate Index returned 3.76%, the MSCI EAFE Index (net total return) returned 20.23% and the Lipper Mixed-Asset Target Allocation Aggressive Growth Funds returned 22.79% for the twelve months ended June 30, 2026.
- Relative to the Index, which is an all-equity index, the Fund’s allocation to fixed income was a detractor, as equity markets outperformed fixed-income markets during the period.
- The allocation to equities contributed the most to overall performance, as global growth continued to power through — with overall economic growth remaining resilient and inflation continuing its move downward. Within equities, we preferred U.S. large-cap and international developed equities, which contributed to performance.
- Our allocation to corporate credit, including high-yield and investment-grade bonds, also contributed positively.
- The Fund’s longer overall duration from its allocation to the JPMorgan Core Bond Fund detracted from overall performance as credit outpaced Treasuries.
Fund Performance
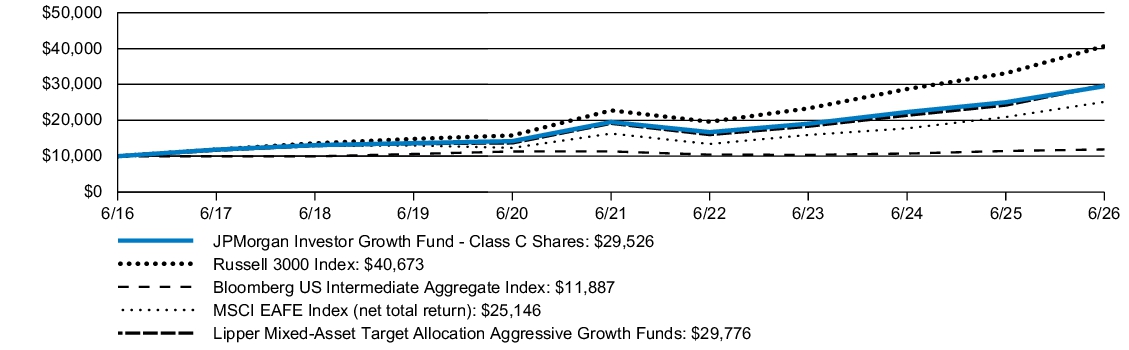
| AVERAGE ANNUAL TOTAL RETURNS | INCEPTION DATE |
1 YEAR | 5 YEAR | 10 YEAR | |||
| JPMorgan Investor Growth Fund (Class C Shares) | July 1, 1997 | 16.32 | % | 8.39 | % | 11.43 | % |
| JPMorgan Investor Growth Fund (Class C Shares) - excluding sales charge | 17.32 | 8.39 | 11.43 | ||||
| Russell 3000 Index | 22.82 | 12.31 | 15.06 | ||||
| Bloomberg US Intermediate Aggregate Index | 3.76 | 0.97 | 1.74 | ||||
| MSCI EAFE Index (net total return) | 20.23 | 9.05 | 9.66 | ||||
| Lipper Mixed-Asset Target Allocation Aggressive Growth Funds | 22.79 | 9.19 | 11.52 |
KEY FUND STATISTICS
| Fund net assets (000's) | $7,096,260 | |
| Total number of portfolio holdings | 24 | |
| Portfolio turnover rate | 4 | % |
| Total advisory fees paid (000's) | $3,205 |
PORTFOLIO COMPOSITION - ASSET CLASS
(% of Total Investments)
(% of Total Investments)
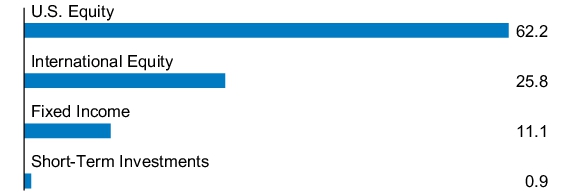
What were the Fund costs for the last year?
(based on a hypothetical $10,000 investment)
| Fund (Class) | Costs of a $10,000 investment |
Costs paid as a percentage of a $10,000 investment |
| JPMorgan Investor Growth Fund (Class A Shares) |
$60 | 0.55% |
How did the Fund Perform?
The Fund's Class A Shares, without a sales charge, returned 17.90% for the twelve months ended June 30, 2026. The Russell 3000 Index (the "Index") returned 22.82%, the Bloomberg US Intermediate Aggregate Index returned 3.76%, the MSCI EAFE Index (net total return) returned 20.23% and the Lipper Mixed-Asset Target Allocation Aggressive Growth Funds returned 22.79% for the twelve months ended June 30, 2026.
- Relative to the Index, which is an all-equity index, the Fund’s allocation to fixed income was a detractor, as equity markets outperformed fixed-income markets during the period.
- The allocation to equities contributed the most to overall performance, as global growth continued to power through — with overall economic growth remaining resilient and inflation continuing its move downward. Within equities, we preferred U.S. large-cap and international developed equities, which contributed to performance.
- Our allocation to corporate credit, including high-yield and investment-grade bonds, also contributed positively.
- The Fund’s longer overall duration from its allocation to the JPMorgan Core Bond Fund detracted from overall performance as credit outpaced Treasuries.
Fund Performance
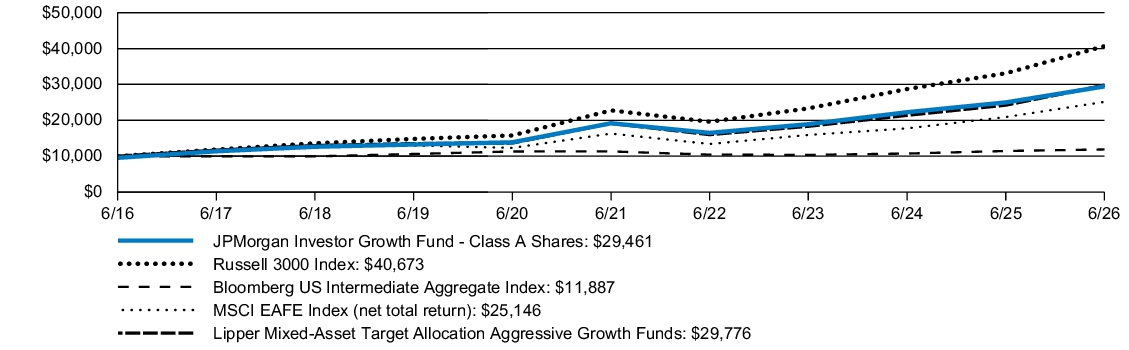
| AVERAGE ANNUAL TOTAL RETURNS | INCEPTION DATE |
1 YEAR | 5 YEAR | 10 YEAR | |||
| JPMorgan Investor Growth Fund (Class A Shares) | December 10, 1996 | 12.59 | % | 7.96 | % | 11.41 | % |
| JPMorgan Investor Growth Fund (Class A Shares) - excluding sales charge | 17.90 | 8.96 | 11.92 | ||||
| Russell 3000 Index | 22.82 | 12.31 | 15.06 | ||||
| Bloomberg US Intermediate Aggregate Index | 3.76 | 0.97 | 1.74 | ||||
| MSCI EAFE Index (net total return) | 20.23 | 9.05 | 9.66 | ||||
| Lipper Mixed-Asset Target Allocation Aggressive Growth Funds | 22.79 | 9.19 | 11.52 |
KEY FUND STATISTICS
| Fund net assets (000's) | $7,096,260 | |
| Total number of portfolio holdings | 24 | |
| Portfolio turnover rate | 4 | % |
| Total advisory fees paid (000's) | $3,205 |
PORTFOLIO COMPOSITION - ASSET CLASS
(% of Total Investments)
(% of Total Investments)
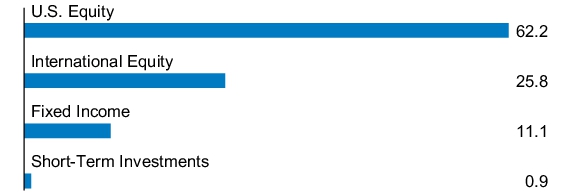
What were the Fund costs for the last year?
(based on a hypothetical $10,000 investment)
| Fund (Class) | Costs of a $10,000 investment |
Costs paid as a percentage of a $10,000 investment |
| JPMorgan Investor Growth & Income Fund (Class A Shares) |
$59 | 0.55% |
How did the Fund Perform?
The Fund's Class A Shares, without a sales charge, returned 14.45% for the twelve months ended June 30, 2026. The Russell 3000 Index (the "Index") returned 22.82%, the Bloomberg US Intermediate Aggregate Index returned 3.76%, the MSCI EAFE Index (net total return) returned 20.23% and the Lipper Mixed-Asset Target Allocation Growth Funds Index returned 17.34% for the twelve months ended June 30, 2026.
- Relative to the Index, which is an all-equity index, the Fund’s allocation to fixed income was a detractor, as equity markets outperformed fixed-income markets during the period.
- The allocation to equities contributed the most to overall performance, as global growth continued to power through — with overall economic growth remaining resilient and inflation continuing its move downward. Within equities, we preferred U.S. large-cap and international developed equities, which contributed to performance.
- Our allocation to corporate credit, including high-yield and investment-grade bonds, also contributed positively.
- The Fund’s longer overall duration from its allocation to the JPMorgan Core Bond Fund detracted from overall performance as credit outpaced Treasuries.
Fund Performance
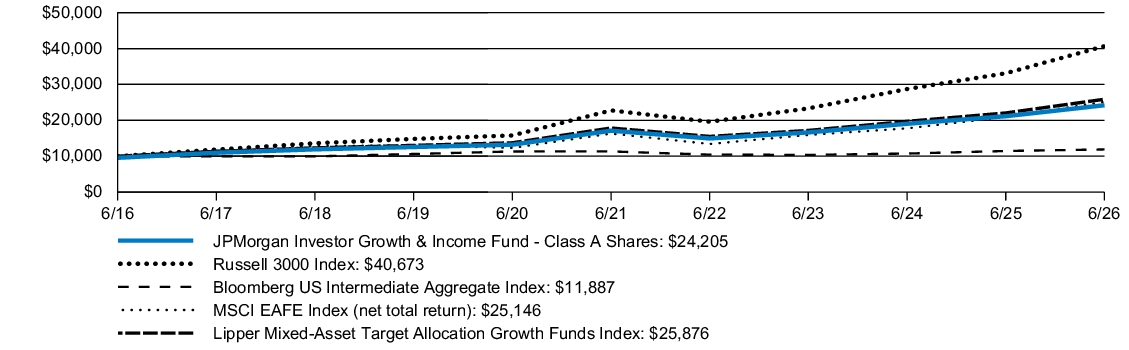
| AVERAGE ANNUAL TOTAL RETURNS | INCEPTION DATE |
1 YEAR | 5 YEAR | 10 YEAR | |||
| JPMorgan Investor Growth & Income Fund (Class A Shares) | December 10, 1996 | 9.27 | % | 6.20 | % | 9.24 | % |
| JPMorgan Investor Growth & Income Fund (Class A Shares) - excluding sales charge | 14.45 | 7.18 | 9.74 | ||||
| Russell 3000 Index | 22.82 | 12.31 | 15.06 | ||||
| Bloomberg US Intermediate Aggregate Index | 3.76 | 0.97 | 1.74 | ||||
| MSCI EAFE Index (net total return) | 20.23 | 9.05 | 9.66 | ||||
| Lipper Mixed-Asset Target Allocation Growth Funds Index | 17.34 | 7.70 | 9.97 |
KEY FUND STATISTICS
| Fund net assets (000's) | $5,491,957 | |
| Total number of portfolio holdings | 25 | |
| Portfolio turnover rate | 10 | % |
| Total advisory fees paid (000's) | $2,563 |
PORTFOLIO COMPOSITION - ASSET CLASS
(% of Total Investments)
(% of Total Investments)
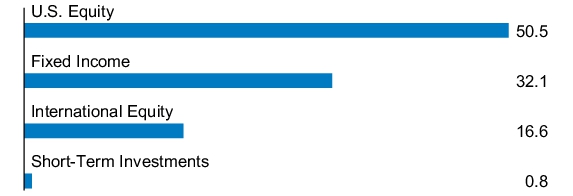
What were the Fund costs for the last year?
(based on a hypothetical $10,000 investment)
| Fund (Class) | Costs of a $10,000 investment |
Costs paid as a percentage of a $10,000 investment |
| JPMorgan Investor Growth & Income Fund (Class C Shares) |
$115 | 1.07% |
How did the Fund Perform?
The Fund's Class C Shares, without a sales charge, returned 13.80% for the twelve months ended June 30, 2026. The Russell 3000 Index (the "Index") returned 22.82%, the Bloomberg US Intermediate Aggregate Index returned 3.76%, the MSCI EAFE Index (net total return) returned 20.23% and the Lipper Mixed-Asset Target Allocation Growth Funds Index returned 17.34% for the twelve months ended June 30, 2026.
- Relative to the Index, which is an all-equity index, the Fund’s allocation to fixed income was a detractor, as equity markets outperformed fixed-income markets during the period.
- The allocation to equities contributed the most to overall performance, as global growth continued to power through — with overall economic growth remaining resilient and inflation continuing its move downward. Within equities, we preferred U.S. large-cap and international developed equities, which contributed to performance.
- Our allocation to corporate credit, including high-yield and investment-grade bonds, also contributed positively.
- The Fund’s longer overall duration from its allocation to the JPMorgan Core Bond Fund detracted from overall performance as credit outpaced Treasuries.
Fund Performance
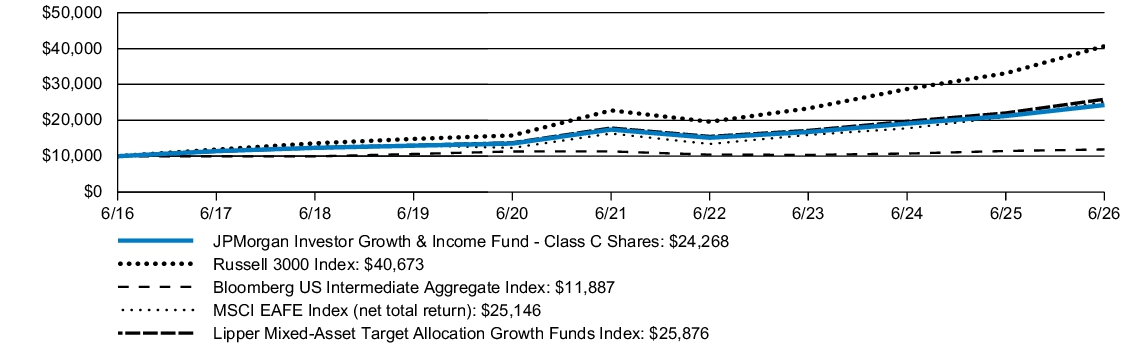
| AVERAGE ANNUAL TOTAL RETURNS | INCEPTION DATE |
1 YEAR | 5 YEAR | 10 YEAR | |||
| JPMorgan Investor Growth & Income Fund (Class C Shares) | July 1, 1997 | 12.80 | % | 6.62 | % | 9.27 | % |
| JPMorgan Investor Growth & Income Fund (Class C Shares) - excluding sales charge | 13.80 | 6.62 | 9.27 | ||||
| Russell 3000 Index | 22.82 | 12.31 | 15.06 | ||||
| Bloomberg US Intermediate Aggregate Index | 3.76 | 0.97 | 1.74 | ||||
| MSCI EAFE Index (net total return) | 20.23 | 9.05 | 9.66 | ||||
| Lipper Mixed-Asset Target Allocation Growth Funds Index | 17.34 | 7.70 | 9.97 |
KEY FUND STATISTICS
| Fund net assets (000's) | $5,491,957 | |
| Total number of portfolio holdings | 25 | |
| Portfolio turnover rate | 10 | % |
| Total advisory fees paid (000's) | $2,563 |
PORTFOLIO COMPOSITION - ASSET CLASS
(% of Total Investments)
(% of Total Investments)
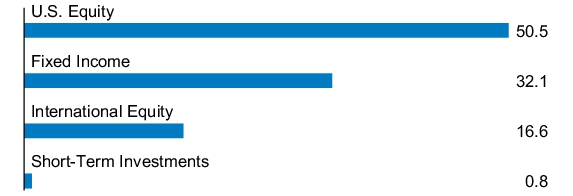
What were the Fund costs for the last year?
(based on a hypothetical $10,000 investment)
| Fund (Class) | Costs of a $10,000 investment |
Costs paid as a percentage of a $10,000 investment |
| JPMorgan Investor Growth & Income Fund (Class I Shares) |
$34 | 0.31% |
How did the Fund Perform?
The Fund's Class I Shares returned 14.64% for the twelve months ended June 30, 2026. The Russell 3000 Index (the "Index") returned 22.82%, the Bloomberg US Intermediate Aggregate Index returned 3.76%, the MSCI EAFE Index (net total return) returned 20.23% and the Lipper Mixed-Asset Target Allocation Growth Funds Index returned 17.34% for the twelve months ended June 30, 2026.
- Relative to the Index, which is an all-equity index, the Fund’s allocation to fixed income was a detractor, as equity markets outperformed fixed-income markets during the period.
- The allocation to equities contributed the most to overall performance, as global growth continued to power through — with overall economic growth remaining resilient and inflation continuing its move downward. Within equities, we preferred U.S. large-cap and international developed equities, which contributed to performance.
- Our allocation to corporate credit, including high-yield and investment-grade bonds, also contributed positively.
- The Fund’s longer overall duration from its allocation to the JPMorgan Core Bond Fund detracted from overall performance as credit outpaced Treasuries.
Fund Performance
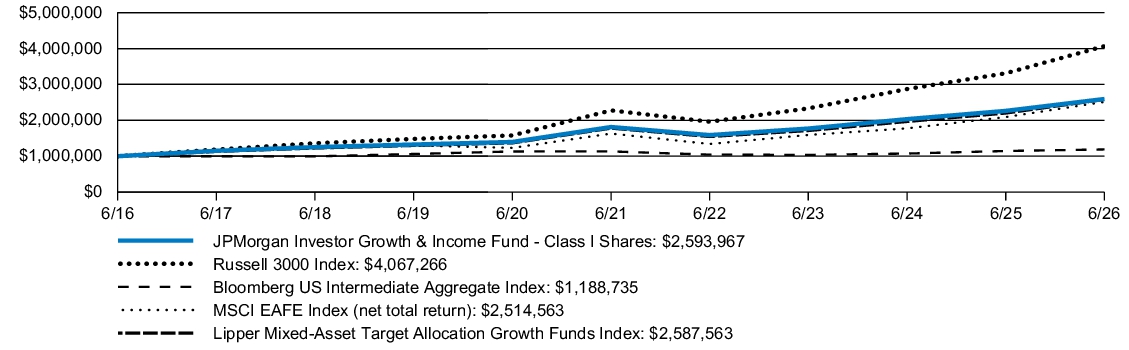
| AVERAGE ANNUAL TOTAL RETURNS | INCEPTION DATE |
1 YEAR | 5 YEAR | 10 YEAR | |||
| JPMorgan Investor Growth & Income Fund (Class I Shares) | December 10, 1996 | 14.64 | % | 7.43 | % | 10.00 | % |
| Russell 3000 Index | 22.82 | 12.31 | 15.06 | ||||
| Bloomberg US Intermediate Aggregate Index | 3.76 | 0.97 | 1.74 | ||||
| MSCI EAFE Index (net total return) | 20.23 | 9.05 | 9.66 | ||||
| Lipper Mixed-Asset Target Allocation Growth Funds Index | 17.34 | 7.70 | 9.97 |
KEY FUND STATISTICS
| Fund net assets (000's) | $5,491,957 | |
| Total number of portfolio holdings | 25 | |
| Portfolio turnover rate | 10 | % |
| Total advisory fees paid (000's) | $2,563 |
PORTFOLIO COMPOSITION - ASSET CLASS
(% of Total Investments)
(% of Total Investments)
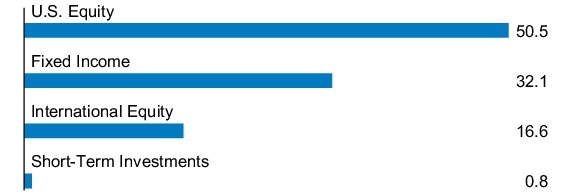
What were the Fund costs for the last year?
(based on a hypothetical $10,000 investment)
| Fund (Class) | Costs of a $10,000 investment |
Costs paid as a percentage of a $10,000 investment |
| JPMorgan Investor Growth & Income Fund (Class R6 Shares) |
$7 | 0.06% |
How did the Fund Perform?
The Fund's Class R6 Shares returned 14.98% for the twelve months ended June 30, 2026. The Russell 3000 Index (the "Index") returned 22.82%, the Bloomberg US Intermediate Aggregate Index returned 3.76%, the MSCI EAFE Index (net total return) returned 20.23% and the Lipper Mixed-Asset Target Allocation Growth Funds Index returned 17.34% for the twelve months ended June 30, 2026.
- Relative to the Index, which is an all-equity index, the Fund’s allocation to fixed income was a detractor, as equity markets outperformed fixed-income markets during the period.
- The allocation to equities contributed the most to overall performance, as global growth continued to power through — with overall economic growth remaining resilient and inflation continuing its move downward. Within equities, we preferred U.S. large-cap and international developed equities, which contributed to performance.
- Our allocation to corporate credit, including high-yield and investment-grade bonds, also contributed positively.
- The Fund’s longer overall duration from its allocation to the JPMorgan Core Bond Fund detracted from overall performance as credit outpaced Treasuries.
Fund Performance
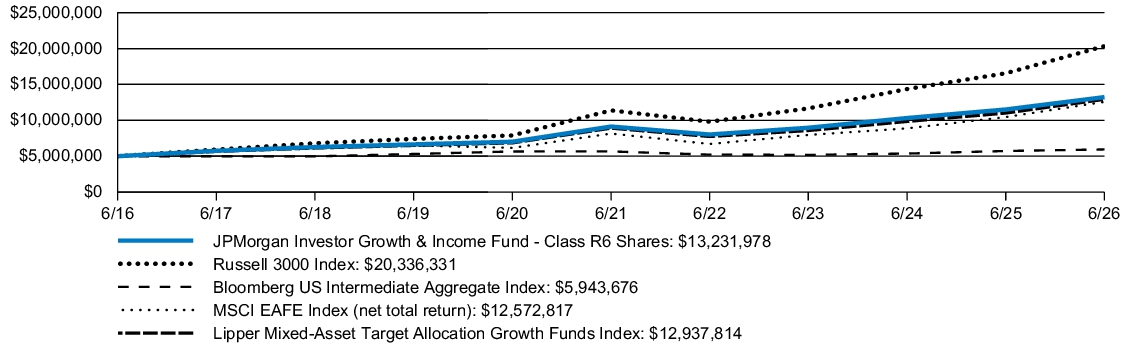
| AVERAGE ANNUAL TOTAL RETURNS | INCEPTION DATE |
1 YEAR | 5 YEAR | 10 YEAR | |||
| JPMorgan Investor Growth & Income Fund (Class R6 Shares) | July 31, 2017 | 14.98 | % | 7.70 | % | 10.22 | % |
| Russell 3000 Index | 22.82 | 12.31 | 15.06 | ||||
| Bloomberg US Intermediate Aggregate Index | 3.76 | 0.97 | 1.74 | ||||
| MSCI EAFE Index (net total return) | 20.23 | 9.05 | 9.66 | ||||
| Lipper Mixed-Asset Target Allocation Growth Funds Index | 17.34 | 7.70 | 9.97 |
KEY FUND STATISTICS
| Fund net assets (000's) | $5,491,957 | |
| Total number of portfolio holdings | 25 | |
| Portfolio turnover rate | 10 | % |
| Total advisory fees paid (000's) | $2,563 |
PORTFOLIO COMPOSITION - ASSET CLASS
(% of Total Investments)
(% of Total Investments)
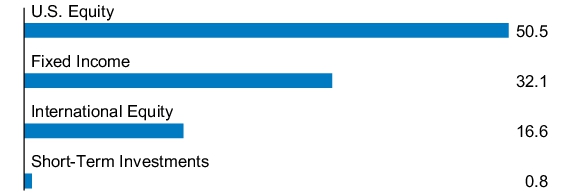
What were the Fund costs for the last year?
(based on a hypothetical $10,000 investment)
| Fund (Class) | Costs of a $10,000 investment |
Costs paid as a percentage of a $10,000 investment |
| JPMorgan Investor Balanced Fund (Class R6 Shares) |
$6 | 0.06% |
How did the Fund Perform?
The Fund's Class R6 Shares returned 12.38% for the twelve months ended June 30, 2026. The Bloomberg US Aggregate Index returned 3.79%, the Bloomberg US Intermediate Aggregate Index (the "Index") returned 3.76%, the Russell 3000 Index returned 22.82%, the MSCI EAFE Index (net total return) returned 20.23%, and the Lipper Mixed-Asset Target Allocation Moderate Funds Index returned 13.68% for the twelve months ended June 30, 2026.
- Relative to the Index, which is an all-fixed income index, the Fund’s diverse allocation to both equity and fixed income was a leading contributor, as equity markets outperformed fixed-income markets during the period.
- The allocation to equities contributed the most to overall performance, as global growth continued to power through — with overall economic growth remaining resilient and inflation continuing its move downward. Within equities, we preferred U.S. large-cap and international developed equities, which contributed to performance.
- Our allocation to corporate credit, including high-yield and investment-grade bonds, also contributed positively.
- The Fund’s longer overall duration from its allocation to the JPMorgan Core Bond Fund detracted from overall performance as credit outpaced Treasuries.
Fund Performance
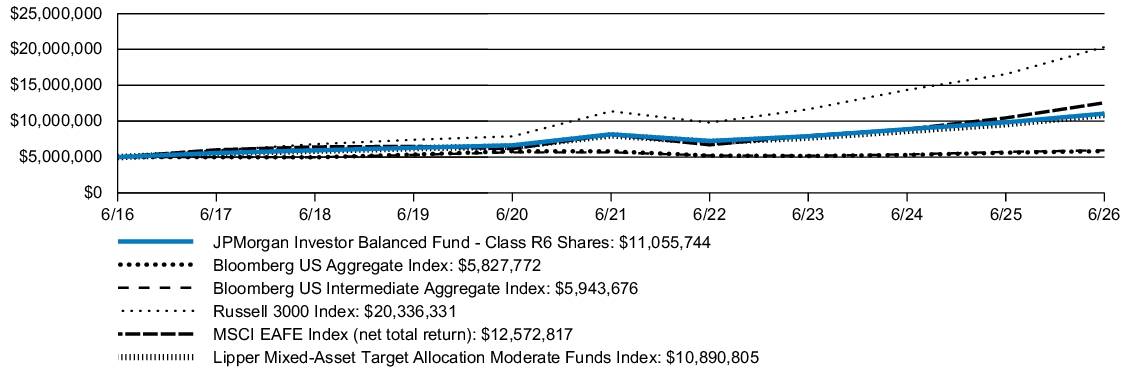
| AVERAGE ANNUAL TOTAL RETURNS | INCEPTION DATE |
1 YEAR | 5 YEAR | 10 YEAR | |||
| JPMorgan Investor Balanced Fund (Class R6 Shares) | July 31, 2017 | 12.38 | % | 6.24 | % | 8.26 | % |
| Bloomberg US Aggregate Index | 3.79 | 0.08 | 1.54 | ||||
| Bloomberg US Intermediate Aggregate Index | 3.76 | 0.97 | 1.74 | ||||
| Russell 3000 Index | 22.82 | 12.31 | 15.06 | ||||
| MSCI EAFE Index (net total return) | 20.23 | 9.05 | 9.66 | ||||
| Lipper Mixed-Asset Target Allocation Moderate Funds Index | 13.68 | 6.30 | 8.09 |
KEY FUND STATISTICS
| Fund net assets (000's) | $5,905,858 | |
| Total number of portfolio holdings | 26 | |
| Portfolio turnover rate | 11 | % |
| Total advisory fees paid (000's) | $2,822 |
PORTFOLIO COMPOSITION - ASSET CLASS
(% of Total Investments)
(% of Total Investments)
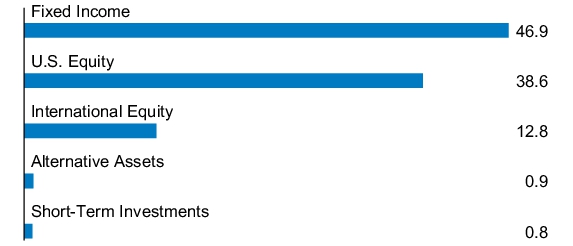
What were the Fund costs for the last year?
(based on a hypothetical $10,000 investment)
| Fund (Class) | Costs of a $10,000 investment |
Costs paid as a percentage of a $10,000 investment |
| JPMorgan Investor Balanced Fund (Class I Shares) |
$33 | 0.31% |
How did the Fund Perform?
The Fund's Class I Shares returned 12.16% for the twelve months ended June 30, 2026. The Bloomberg US Aggregate Index returned 3.79%, the Bloomberg US Intermediate Aggregate Index (the "Index") returned 3.76%, the Russell 3000 Index returned 22.82%, the MSCI EAFE Index (net total return) returned 20.23%, and the Lipper Mixed-Asset Target Allocation Moderate Funds Index returned 13.68% for the twelve months ended June 30, 2026.
- Relative to the Index, which is an all-fixed income index, the Fund’s diverse allocation to both equity and fixed income was a leading contributor, as equity markets outperformed fixed-income markets during the period.
- The allocation to equities contributed the most to overall performance, as global growth continued to power through — with overall economic growth remaining resilient and inflation continuing its move downward. Within equities, we preferred U.S. large-cap and international developed equities, which contributed to performance.
- Our allocation to corporate credit, including high-yield and investment-grade bonds, also contributed positively.
- The Fund’s longer overall duration from its allocation to the JPMorgan Core Bond Fund detracted from overall performance as credit outpaced Treasuries.
Fund Performance
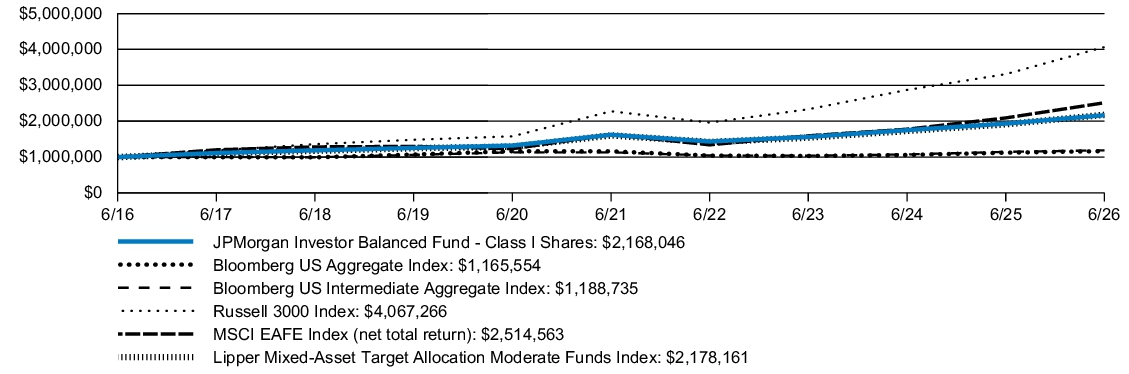
| AVERAGE ANNUAL TOTAL RETURNS | INCEPTION DATE |
1 YEAR | 5 YEAR | 10 YEAR | |||
| JPMorgan Investor Balanced Fund (Class I Shares) | December 10, 1996 | 12.16 | % | 5.98 | % | 8.05 | % |
| Bloomberg US Aggregate Index | 3.79 | 0.08 | 1.54 | ||||
| Bloomberg US Intermediate Aggregate Index | 3.76 | 0.97 | 1.74 | ||||
| Russell 3000 Index | 22.82 | 12.31 | 15.06 | ||||
| MSCI EAFE Index (net total return) | 20.23 | 9.05 | 9.66 | ||||
| Lipper Mixed-Asset Target Allocation Moderate Funds Index | 13.68 | 6.30 | 8.09 |
KEY FUND STATISTICS
| Fund net assets (000's) | $5,905,858 | |
| Total number of portfolio holdings | 26 | |
| Portfolio turnover rate | 11 | % |
| Total advisory fees paid (000's) | $2,822 |
PORTFOLIO COMPOSITION - ASSET CLASS
(% of Total Investments)
(% of Total Investments)
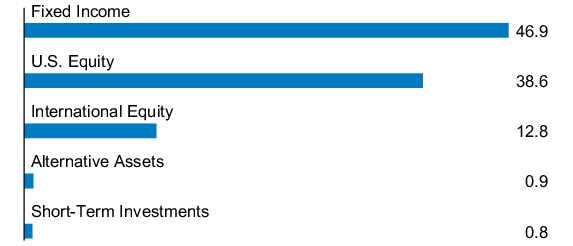
What were the Fund costs for the last year?
(based on a hypothetical $10,000 investment)
| Fund (Class) | Costs of a $10,000 investment |
Costs paid as a percentage of a $10,000 investment |
| JPMorgan Investor Balanced Fund (Class C Shares) |
$112 | 1.06% |
How did the Fund Perform?
The Fund's Class C Shares, without a sales charge, returned 11.33% for the twelve months ended June 30, 2026. The Bloomberg US Aggregate Index returned 3.79%, the Bloomberg US Intermediate Aggregate Index (the "Index") returned 3.76%, the Russell 3000 Index returned 22.82%, the MSCI EAFE Index (net total return) returned 20.23%, and the Lipper Mixed-Asset Target Allocation Moderate Funds Index returned 13.68% for the twelve months ended June 30, 2026.
- Relative to the Index, which is an all-fixed income index, the Fund’s diverse allocation to both equity and fixed income was a leading contributor, as equity markets outperformed fixed-income markets during the period.
- The allocation to equities contributed the most to overall performance, as global growth continued to power through — with overall economic growth remaining resilient and inflation continuing its move downward. Within equities, we preferred U.S. large-cap and international developed equities, which contributed to performance.
- Our allocation to corporate credit, including high-yield and investment-grade bonds, also contributed positively.
- The Fund’s longer overall duration from its allocation to the JPMorgan Core Bond Fund detracted from overall performance as credit outpaced Treasuries.
Fund Performance
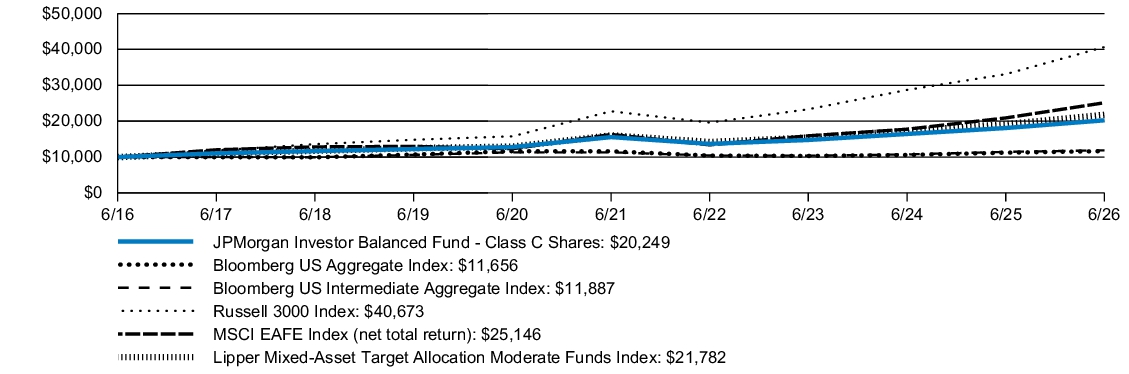
| AVERAGE ANNUAL TOTAL RETURNS | INCEPTION DATE |
1 YEAR | 5 YEAR | 10 YEAR | |||
| JPMorgan Investor Balanced Fund (Class C Shares) | July 1, 1997 | 10.33 | % | 5.19 | % | 7.31 | % |
| JPMorgan Investor Balanced Fund (Class C Shares) - excluding sales charge | 11.33 | 5.19 | 7.31 | ||||
| Bloomberg US Aggregate Index | 3.79 | 0.08 | 1.54 | ||||
| Bloomberg US Intermediate Aggregate Index | 3.76 | 0.97 | 1.74 | ||||
| Russell 3000 Index | 22.82 | 12.31 | 15.06 | ||||
| MSCI EAFE Index (net total return) | 20.23 | 9.05 | 9.66 | ||||
| Lipper Mixed-Asset Target Allocation Moderate Funds Index | 13.68 | 6.30 | 8.09 |
KEY FUND STATISTICS
| Fund net assets (000's) | $5,905,858 | |
| Total number of portfolio holdings | 26 | |
| Portfolio turnover rate | 11 | % |
| Total advisory fees paid (000's) | $2,822 |
PORTFOLIO COMPOSITION - ASSET CLASS
(% of Total Investments)
(% of Total Investments)
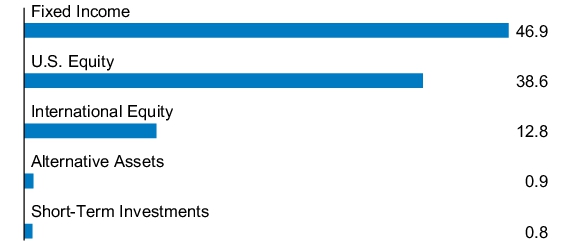
What were the Fund costs for the last year?
(based on a hypothetical $10,000 investment)
| Fund (Class) | Costs of a $10,000 investment |
Costs paid as a percentage of a $10,000 investment |
| JPMorgan Investor Balanced Fund (Class A Shares) |
$60 | 0.56% |
How did the Fund Perform?
The Fund's Class A Shares, without a sales charge, returned 11.85% for the twelve months ended June 30, 2026. The Bloomberg US Aggregate Index returned 3.79%, the Bloomberg US Intermediate Aggregate Index (the "Index") returned 3.76%, the Russell 3000 Index returned 22.82%, the MSCI EAFE Index (net total return) returned 20.23%, and the Lipper Mixed-Asset Target Allocation Moderate Funds Index returned 13.68% for the twelve months ended June 30, 2026.
- Relative to the Index, which is an all-fixed income index, the Fund’s diverse allocation to both equity and fixed income was a leading contributor, as equity markets outperformed fixed-income markets during the period.
- The allocation to equities contributed the most to overall performance, as global growth continued to power through — with overall economic growth remaining resilient and inflation continuing its move downward. Within equities, we preferred U.S. large-cap and international developed equities, which contributed to performance.
- Our allocation to corporate credit, including high-yield and investment-grade bonds, also contributed positively.
- The Fund’s longer overall duration from its allocation to the JPMorgan Core Bond Fund detracted from overall performance as credit outpaced Treasuries.
Fund Performance
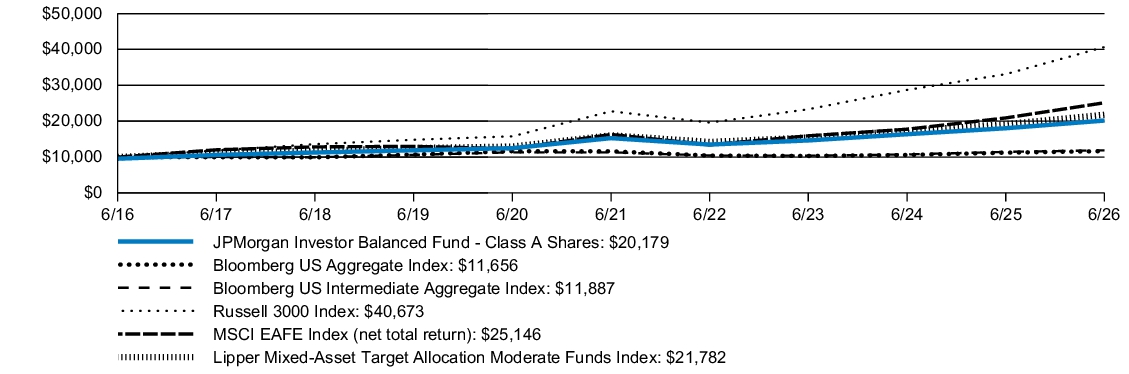
| AVERAGE ANNUAL TOTAL RETURNS | INCEPTION DATE |
1 YEAR | 5 YEAR | 10 YEAR | |||
| JPMorgan Investor Balanced Fund (Class A Shares) | December 10, 1996 | 6.79 | % | 4.75 | % | 7.27 | % |
| JPMorgan Investor Balanced Fund (Class A Shares) - excluding sales charge | 11.85 | 5.71 | 7.77 | ||||
| Bloomberg US Aggregate Index | 3.79 | 0.08 | 1.54 | ||||
| Bloomberg US Intermediate Aggregate Index | 3.76 | 0.97 | 1.74 | ||||
| Russell 3000 Index | 22.82 | 12.31 | 15.06 | ||||
| MSCI EAFE Index (net total return) | 20.23 | 9.05 | 9.66 | ||||
| Lipper Mixed-Asset Target Allocation Moderate Funds Index | 13.68 | 6.30 | 8.09 |
KEY FUND STATISTICS
| Fund net assets (000's) | $5,905,858 | |
| Total number of portfolio holdings | 26 | |
| Portfolio turnover rate | 11 | % |
| Total advisory fees paid (000's) | $2,822 |
PORTFOLIO COMPOSITION - ASSET CLASS
(% of Total Investments)
(% of Total Investments)
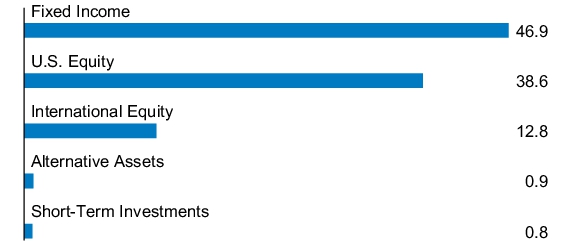
What were the Fund costs for the last year?
(based on a hypothetical $10,000 investment)
| Fund (Class) | Costs of a $10,000 investment |
Costs paid as a percentage of a $10,000 investment |
| JPMorgan Investor Conservative Growth Fund (Class A Shares) |
$59 | 0.57% |
How did the Fund Perform?
The Fund's Class A Shares, without a sales charge, returned 8.66% for the twelve months ended June 30, 2026. The Bloomberg US Aggregate Index returned 3.79%, the Bloomberg US Intermediate Aggregate Index (the "Index") returned 3.76%, the Russell 3000 Index returned 22.82%, the MSCI EAFE Index (net total return) returned 20.23%, and the Lipper Mixed-Asset Target Allocation Conservative Funds Index returned 10.45% for the twelve months ended June 30, 2026.
- Relative to the Index, which is an all fixed-income index, the Fund’s diverse allocation to both equity and fixed income was a leading contributor, as equity markets outperformed fixed-income markets during the period.
- The allocation to equities contributed the most to overall performance, as global growth continued to power through — with overall economic growth remaining resilient and inflation continuing its move downward. Within equities, we preferred U.S. large-cap and international developed equities, which contributed to performance.
- Our allocation to corporate credit, including high-yield and investment-grade bonds, also contributed positively.
- The Fund’s longer overall duration from its allocation to the JPMorgan Core Bond Fund detracted from overall performance as credit outpaced Treasuries.
Fund Performance
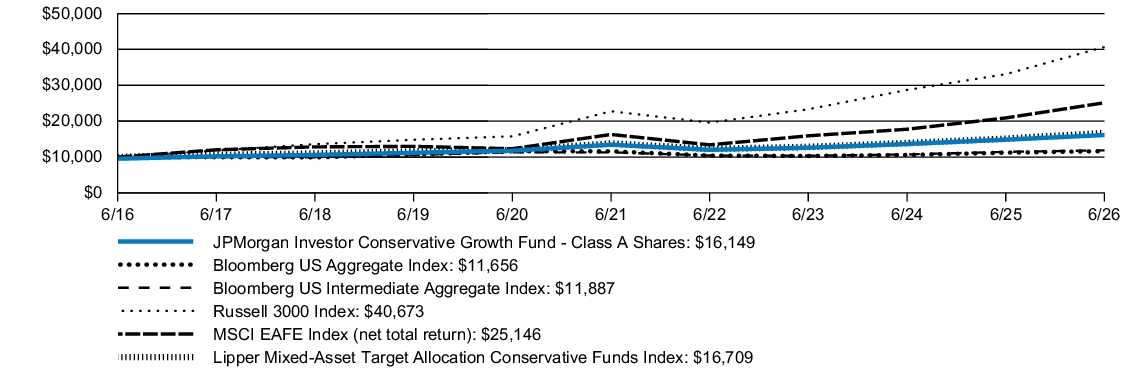
| AVERAGE ANNUAL TOTAL RETURNS | INCEPTION DATE |
1 YEAR | 5 YEAR | 10 YEAR | |||
| JPMorgan Investor Conservative Growth Fund (Class A Shares) | December 10, 1996 | 3.74 | % | 2.78 | % | 4.91 | % |
| JPMorgan Investor Conservative Growth Fund (Class A Shares) - excluding sales charge | 8.66 | 3.72 | 5.39 | ||||
| Bloomberg US Aggregate Index | 3.79 | 0.08 | 1.54 | ||||
| Bloomberg US Intermediate Aggregate Index | 3.76 | 0.97 | 1.74 | ||||
| Russell 3000 Index | 22.82 | 12.31 | 15.06 | ||||
| MSCI EAFE Index (net total return) | 20.23 | 9.05 | 9.66 | ||||
| Lipper Mixed-Asset Target Allocation Conservative Funds Index | 10.45 | 3.90 | 5.26 |
KEY FUND STATISTICS
| Fund net assets (000's) | $4,462,933 | |
| Total number of portfolio holdings | 26 | |
| Portfolio turnover rate | 13 | % |
| Total advisory fees paid (000's) | $2,077 |
PORTFOLIO COMPOSITION - ASSET CLASS
(% of Total Investments)
(% of Total Investments)
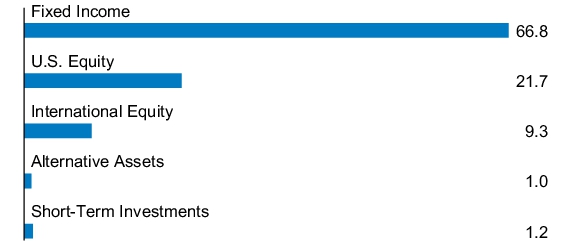
What were the Fund costs for the last year?
(based on a hypothetical $10,000 investment)
| Fund (Class) | Costs of a $10,000 investment |
Costs paid as a percentage of a $10,000 investment |
| JPMorgan Investor Conservative Growth Fund (Class C Shares) |
$111 | 1.07% |
How did the Fund Perform?
The Fund's Class C Shares, without a sales charge, returned 8.17% for the twelve months ended June 30, 2026. The Bloomberg US Aggregate Index returned 3.79%, the Bloomberg US Intermediate Aggregate Index (the "Index") returned 3.76%, the Russell 3000 Index returned 22.82%, the MSCI EAFE Index (net total return) returned 20.23%, and the Lipper Mixed-Asset Target Allocation Conservative Funds Index returned 10.45% for the twelve months ended June 30, 2026.
- Relative to the Index, which is an all fixed-income index, the Fund’s diverse allocation to both equity and fixed income was a leading contributor, as equity markets outperformed fixed-income markets during the period.
- The allocation to equities contributed the most to overall performance, as global growth continued to power through — with overall economic growth remaining resilient and inflation continuing its move downward. Within equities, we preferred U.S. large-cap and international developed equities, which contributed to performance.
- Our allocation to corporate credit, including high-yield and investment-grade bonds, also contributed positively.
- The Fund’s longer overall duration from its allocation to the JPMorgan Core Bond Fund detracted from overall performance as credit outpaced Treasuries.
Fund Performance
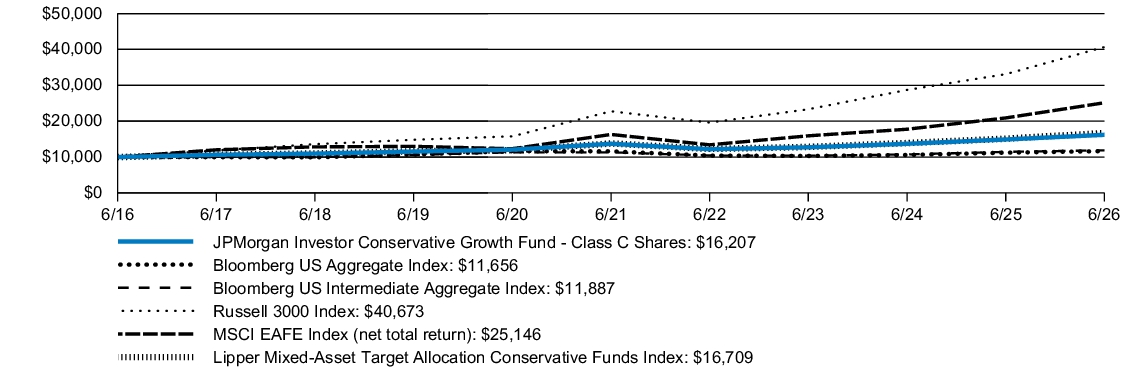
| AVERAGE ANNUAL TOTAL RETURNS | INCEPTION DATE |
1 YEAR | 5 YEAR | 10 YEAR | |||
| JPMorgan Investor Conservative Growth Fund (Class C Shares) | July 1, 1997 | 7.17 | % | 3.20 | % | 4.95 | % |
| JPMorgan Investor Conservative Growth Fund (Class C Shares) - excluding sales charge | 8.17 | 3.20 | 4.95 | ||||
| Bloomberg US Aggregate Index | 3.79 | 0.08 | 1.54 | ||||
| Bloomberg US Intermediate Aggregate Index | 3.76 | 0.97 | 1.74 | ||||
| Russell 3000 Index | 22.82 | 12.31 | 15.06 | ||||
| MSCI EAFE Index (net total return) | 20.23 | 9.05 | 9.66 | ||||
| Lipper Mixed-Asset Target Allocation Conservative Funds Index | 10.45 | 3.90 | 5.26 |
KEY FUND STATISTICS
| Fund net assets (000's) | $4,462,933 | |
| Total number of portfolio holdings | 26 | |
| Portfolio turnover rate | 13 | % |
| Total advisory fees paid (000's) | $2,077 |
PORTFOLIO COMPOSITION - ASSET CLASS
(% of Total Investments)
(% of Total Investments)
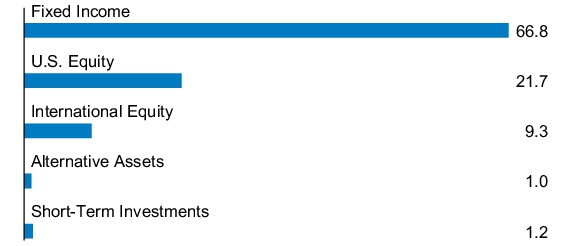
What were the Fund costs for the last year?
(based on a hypothetical $10,000 investment)
| Fund (Class) | Costs of a $10,000 investment |
Costs paid as a percentage of a $10,000 investment |
| JPMorgan Investor Conservative Growth Fund (Class I Shares) |
$33 | 0.31% |
How did the Fund Perform?
The Fund's Class I Shares returned 8.86% for the twelve months ended June 30, 2026. The Bloomberg US Aggregate Index returned 3.79%, the Bloomberg US Intermediate Aggregate Index (the "Index") returned 3.76%, the Russell 3000 Index returned 22.82%, the MSCI EAFE Index (net total return) returned 20.23%, and the Lipper Mixed-Asset Target Allocation Conservative Funds Index returned 10.45% for the twelve months ended June 30, 2026.
- Relative to the Index, which is an all fixed-income index, the Fund’s diverse allocation to both equity and fixed income was a leading contributor, as equity markets outperformed fixed-income markets during the period.
- The allocation to equities contributed the most to overall performance, as global growth continued to power through — with overall economic growth remaining resilient and inflation continuing its move downward. Within equities, we preferred U.S. large-cap and international developed equities, which contributed to performance.
- Our allocation to corporate credit, including high-yield and investment-grade bonds, also contributed positively.
- The Fund’s longer overall duration from its allocation to the JPMorgan Core Bond Fund detracted from overall performance as credit outpaced Treasuries.
Fund Performance
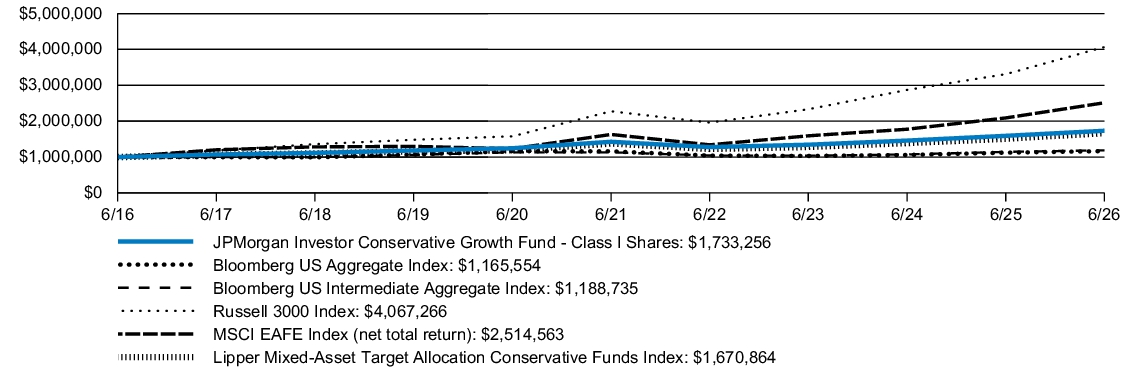
| AVERAGE ANNUAL TOTAL RETURNS | INCEPTION DATE |
1 YEAR | 5 YEAR | 10 YEAR | |||
| JPMorgan Investor Conservative Growth Fund (Class I Shares) | December 10, 1996 | 8.86 | % | 3.98 | % | 5.65 | % |
| Bloomberg US Aggregate Index | 3.79 | 0.08 | 1.54 | ||||
| Bloomberg US Intermediate Aggregate Index | 3.76 | 0.97 | 1.74 | ||||
| Russell 3000 Index | 22.82 | 12.31 | 15.06 | ||||
| MSCI EAFE Index (net total return) | 20.23 | 9.05 | 9.66 | ||||
| Lipper Mixed-Asset Target Allocation Conservative Funds Index | 10.45 | 3.90 | 5.26 |
KEY FUND STATISTICS
| Fund net assets (000's) | $4,462,933 | |
| Total number of portfolio holdings | 26 | |
| Portfolio turnover rate | 13 | % |
| Total advisory fees paid (000's) | $2,077 |
PORTFOLIO COMPOSITION - ASSET CLASS
(% of Total Investments)
(% of Total Investments)
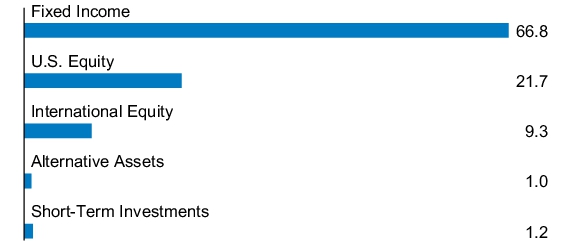
What were the Fund costs for the last year?
(based on a hypothetical $10,000 investment)
| Fund (Class) | Costs of a $10,000 investment |
Costs paid as a percentage of a $10,000 investment |
| JPMorgan Investor Conservative Growth Fund (Class R6 Shares) |
$7 | 0.06% |
How did the Fund Perform?
The Fund's Class R6 Shares returned 9.14% for the twelve months ended June 30, 2026. The Bloomberg US Aggregate Index returned 3.79%, the Bloomberg US Intermediate Aggregate Index (the "Index") returned 3.76%, the Russell 3000 Index returned 22.82%, the MSCI EAFE Index (net total return) returned 20.23%, and the Lipper Mixed-Asset Target Allocation Conservative Funds Index returned 10.45% for the twelve months ended June 30, 2026.
- Relative to the Index, which is an all fixed-income index, the Fund’s diverse allocation to both equity and fixed income was a leading contributor, as equity markets outperformed fixed-income markets during the period.
- The allocation to equities contributed the most to overall performance, as global growth continued to power through — with overall economic growth remaining resilient and inflation continuing its move downward. Within equities, we preferred U.S. large-cap and international developed equities, which contributed to performance.
- Our allocation to corporate credit, including high-yield and investment-grade bonds, also contributed positively.
- The Fund’s longer overall duration from its allocation to the JPMorgan Core Bond Fund detracted from overall performance as credit outpaced Treasuries.
Fund Performance
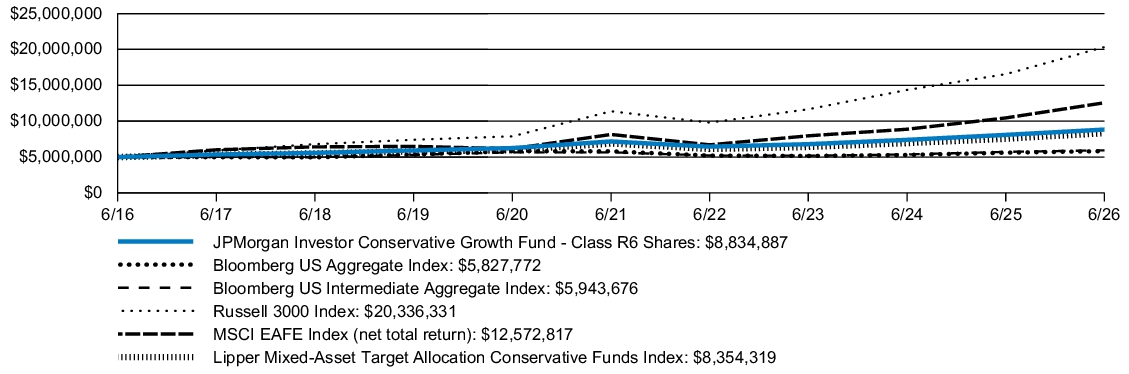
| AVERAGE ANNUAL TOTAL RETURNS | INCEPTION DATE |
1 YEAR | 5 YEAR | 10 YEAR | |||
| JPMorgan Investor Conservative Growth Fund (Class R6 Shares) | July 31, 2017 | 9.14 | % | 4.24 | % | 5.86 | % |
| Bloomberg US Aggregate Index | 3.79 | 0.08 | 1.54 | ||||
| Bloomberg US Intermediate Aggregate Index | 3.76 | 0.97 | 1.74 | ||||
| Russell 3000 Index | 22.82 | 12.31 | 15.06 | ||||
| MSCI EAFE Index (net total return) | 20.23 | 9.05 | 9.66 | ||||
| Lipper Mixed-Asset Target Allocation Conservative Funds Index | 10.45 | 3.90 | 5.26 |
KEY FUND STATISTICS
| Fund net assets (000's) | $4,462,933 | |
| Total number of portfolio holdings | 26 | |
| Portfolio turnover rate | 13 | % |
| Total advisory fees paid (000's) | $2,077 |
PORTFOLIO COMPOSITION - ASSET CLASS
(% of Total Investments)
(% of Total Investments)