Shareholder Report
Jun. 30, 2026
USD ($)
Holding
This report describes material changes to the Fund that occurred during the reporting period.
What were the Fund costs for the last year?
(based on a hypothetical $10,000 investment)
| Fund | Costs of a $10,000 investment |
Costs paid as a percentage of a $10,000 investment |
| JPMorgan Equity Premium Income ETF |
$36 | 0.35% |
How did the Fund Perform?
The Fund returned 7.77% for the twelve months ended June 30, 2026. The S&P 500 Index returned 22.32% and the ICE BofA 3-Month US Treasury Bill Index (the "Index") returned 3.84% for the twelve months ended June 30, 2026.
- The Fund’s security selection in the information technology and communication services sectors detracted from relative performance.
- An overweight in ServiceNow and an underweight in Micron Technology were among the top detractors.
- The Fund captured 35% of the Index’s positive return with 58% of its volatility.
- The Fund’s security selection in the real estate sector contributed to relative performance.
- An underweight in Microsoft and an overweight in Ross Stores were among the top contributors.
Fund Performance
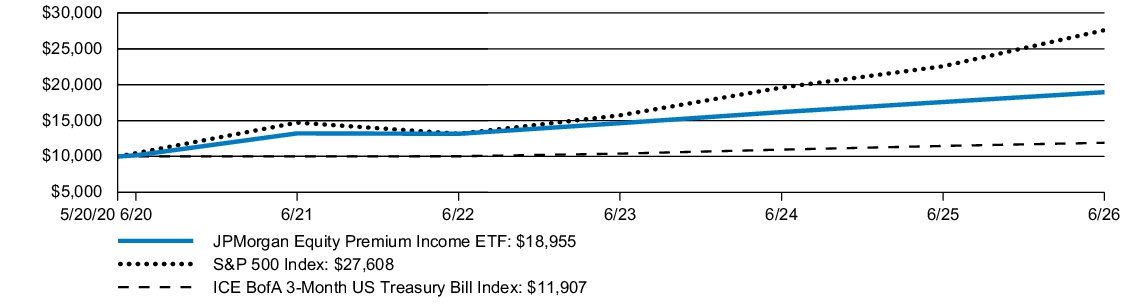
| AVERAGE ANNUAL TOTAL RETURNS | INCEPTION DATE |
1 YEAR | 5 YEAR | SINCE INCEPTION |
|||
| JPMorgan Equity Premium Income ETF - Net Asset Value | May 20, 2020 | 7.77 | % | 7.47 | % | 11.03 | % |
| S&P 500 Index | 22.32 | 13.41 | 18.07 | ||||
| ICE BofA 3-Month US Treasury Bill Index | 3.84 | 3.53 | 2.90 |
Performance shown in this section does not reflect the deduction of taxes that a shareholder may pay on Fund distributions or on gains resulting from redemption or sale of Fund shares.
KEY FUND STATISTICS
| Fund net assets | $44,801,086,561 | |
| Total number of portfolio holdings | 131 | |
| Portfolio turnover rate | 180 | % |
| Total advisory fees paid | $148,347,963 |
PORTFOLIO COMPOSITION - SECTOR
(% of Total Investments)
(% of Total Investments)
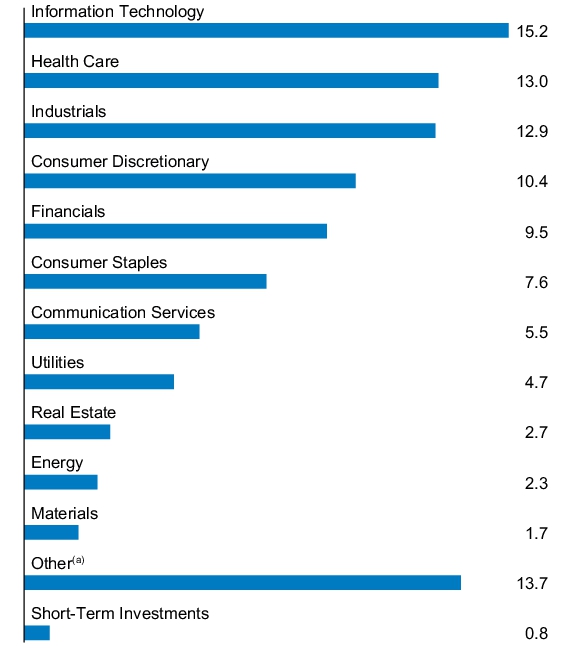
| (a) | Equity-Linked Notes that are linked to the S&P 500 Index. |
Material changes to the Fund during the period
The Fund added “Technology Sector Risk” disclosure to its summary prospectus as of November 1, 2025. This disclosure was added in light of a larger concentration of portfolio securities in this sector.
The Fund added “Significant Holdings Risk” to its prospectus as of March 1, 2026. Although the Fund is considered “diversified” under applicable law, a relatively large portion of its portfolio at times may be invested in a relatively small number of securities, or investments (including futures) whose performance relates in part to the economic results of a relatively small number of securities, or in a combination of the foregoing.
The Fund added “Derivatives Risk” disclosure to its prospectus as of March 1, 2026. This disclosure was added in light of a larger concentration of portfolio securities invested in derivatives.
This is a summary of certain changes to the Fund since July 1, 2025. For more complete information, you may review the Fund’s prospectus at www.jpmorganfunds.com/funddocuments or upon request at 1-844-457-6383.
The Fund added “Technology Sector Risk” disclosure to its summary prospectus as of November 1, 2025. This disclosure was added in light of a larger concentration of portfolio securities in this sector.
The Fund added “Significant Holdings Risk” to its prospectus as of March 1, 2026. Although the Fund is considered “diversified” under applicable law, a relatively large portion of its portfolio at times may be invested in a relatively small number of securities, or investments (including futures) whose performance relates in part to the economic results of a relatively small number of securities, or in a combination of the foregoing.
The Fund added “Derivatives Risk” disclosure to its prospectus as of March 1, 2026. This disclosure was added in light of a larger concentration of portfolio securities invested in derivatives.
This is a summary of certain changes to the Fund since July 1, 2025. For more complete information, you may review the Fund’s prospectus at www.jpmorganfunds.com/funddocuments or upon request at 1-844-457-6383.
This report describes material changes to the Fund that occurred during the reporting period.
What were the Fund costs for the last year?
(based on a hypothetical $10,000 investment)
| Fund | Costs of a $10,000 investment |
Costs paid as a percentage of a $10,000 investment |
| JPMorgan Active Value ETF |
$49 | 0.44% |
How did the Fund Perform?
The Fund returned 22.85% for the twelve months ended June 30, 2026. The Russell 1000 Index returned 22.02% and the Russell 1000 Value Index returned 27.12% for the twelve months ended June 30, 2026.
- The Fund's security selection in communication services and energy detracted from performance.
- The Fund's security selection in information technology and underweight allocation to consumer staples contributed to performance.
- The Fund's underweight allocation to Intel and not owning Caterpillar detracted from performance.
- The Fund's overweight allocation to Western Digital and Corning contributed to performance.
Fund Performance
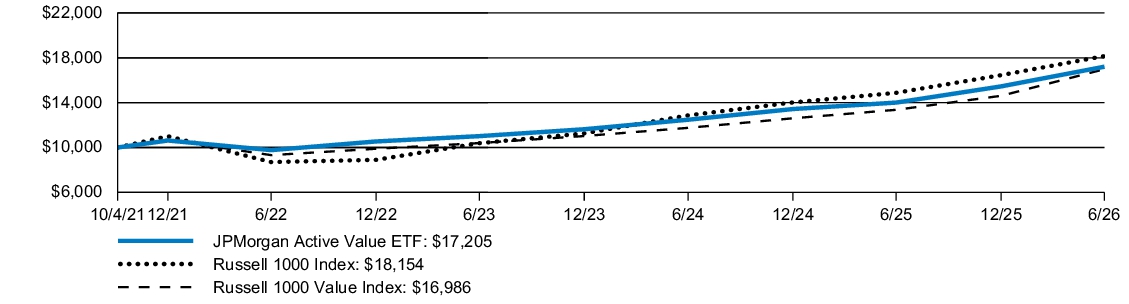
| AVERAGE ANNUAL TOTAL RETURNS | INCEPTION DATE |
1 YEAR | SINCE INCEPTION |
||
| JPMorgan Active Value ETF - Net Asset Value | October 4, 2021 | 22.85 | % | 12.14 | % |
| Russell 1000 Index | 22.02 | 13.41 | |||
| Russell 1000 Value Index | 27.12 | 11.83 |
Performance shown in this section does not reflect the deduction of taxes that a shareholder may pay on Fund distributions or on gains resulting from redemption or sale of Fund shares.
KEY FUND STATISTICS
| Fund net assets | $6,697,804,784 | |
| Total number of portfolio holdings | 161 | |
| Portfolio turnover rate | 124 | % |
| Total advisory fees paid | $22,709,381 |
PORTFOLIO COMPOSITION - SECTOR
(% of Total Investments)
(% of Total Investments)
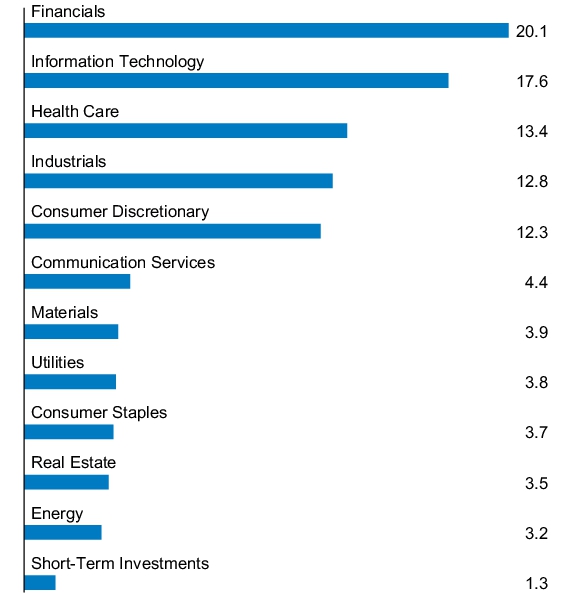
Material changes to the Fund during the period
The Fund added “Industrials Sector Risk” disclosure to its summary prospectus as of November 1, 2025. This disclosure was added in light of a larger concentration of portfolio securities in this sector.
The Fund added “High Portfolio Turnover” risk disclosure to its prospectus as of November 1, 2025. As the Fund will likely engage in active and frequent trading leading to increased portfolio turnover, higher transaction costs, and the possibility that the recognition of capital gains will be accelerated, including short-term capital gains that will generally be taxable to shareholders as ordinary income.
This is a summary of certain changes to the Fund since July 1, 2025. For more complete information, you may review the Fund’s prospectus at www.jpmorganfunds.com/funddocuments or upon request at 1-844-457-6383.
The Fund added “Industrials Sector Risk” disclosure to its summary prospectus as of November 1, 2025. This disclosure was added in light of a larger concentration of portfolio securities in this sector.
The Fund added “High Portfolio Turnover” risk disclosure to its prospectus as of November 1, 2025.
This is a summary of certain changes to the Fund since July 1, 2025. For more complete information, you may review the Fund’s prospectus at www.jpmorganfunds.com/funddocuments or upon request at 1-844-457-6383.
What were the Fund costs for the last year?
(based on a hypothetical $10,000 investment)
| Fund | Costs of a $10,000 investment |
Costs paid as a percentage of a $10,000 investment |
| JPMorgan Small & Mid Cap Enhanced Equity ETF |
$28 | 0.24% |
How did the Fund Perform?
The Fund returned 33.27% for the twelve months ended June 30, 2026. The S&P Composite 1500 Index returned 22.87% and the S&P 1000 Index returned 29.54% for the twelve months ended June 30, 2026.
- The Fund’s security selection in the software and services and industrial cyclical sectors contributed to performance.
- Overweights in DigitalOcean and MaxLinear were among the top contributors.
- The Fund’s security selection in the consumer cyclical and health services and systems sectors detracted from performance.
- An underweight in Vicor and an overweight in Exelixis were among the top detractors.
Fund Performance
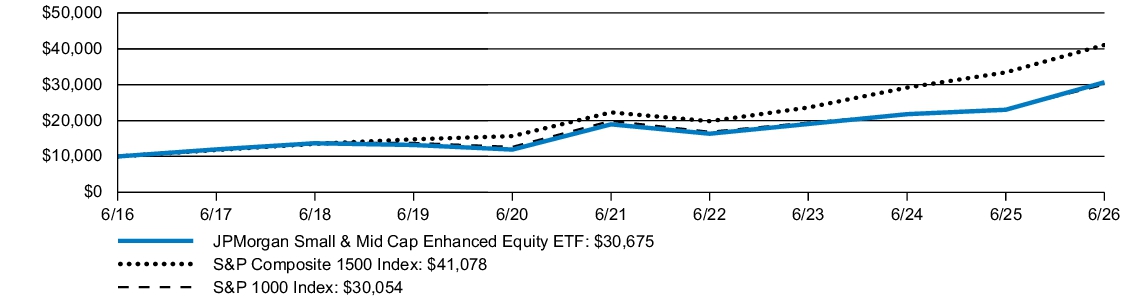
| AVERAGE ANNUAL TOTAL RETURNS | INCEPTION DATE |
1 YEAR | 5 YEAR | 10 YEAR | |||
| JPMorgan Small & Mid Cap Enhanced Equity ETF - Net Asset Value | July 31, 1998* | 33.27 | % | 10.11 | % | 11.86 | % |
| S&P Composite 1500 Index | 22.87 | 13.01 | 15.18 | ||||
| S&P 1000 Index | 29.54 | 8.59 | 11.63 |
| * |
Inception date for Class I Shares of the Acquired Fund (as defined below). |
KEY FUND STATISTICS
| Fund net assets | $2,883,386,971 | |
| Total number of portfolio holdings | 660 | |
| Portfolio turnover rate | 28 | % |
| Total advisory fees paid | $5,537,515 |
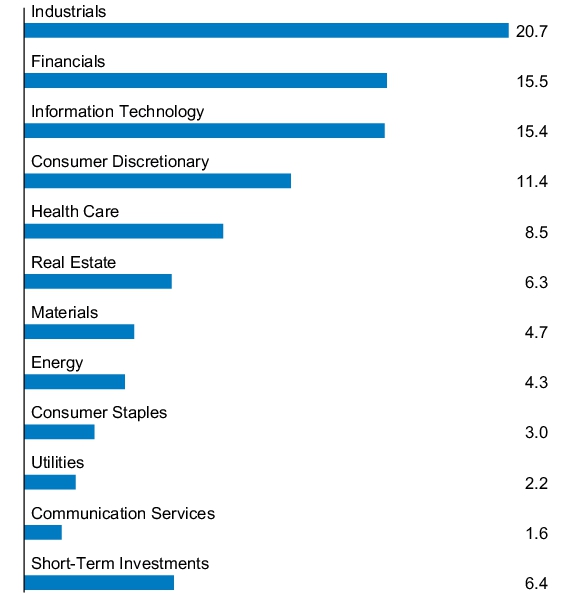
PORTFOLIO COMPOSITION - SECTOR
(% of Total Investments)
(% of Total Investments)
What were the Fund costs for the last year?
(based on a hypothetical $10,000 investment)
| Fund | Costs of a $10,000 investment |
Costs paid as a percentage of a $10,000 investment |
| JPMorgan Nasdaq Equity Premium Income ETF |
$39 | 0.35% |
How did the Fund Perform?
The Fund returned 25.75% for the twelve months ended June 30, 2026. The S&P 500 Index returned 22.32%, the Nasdaq-100 Index (the "Index") returned 34.38%, and the ICE BofA 3-Month US Treasury Bill Index returned 3.84% for the twelve months ended June 30, 2026.
- The Fund captured 75% of the Index’s positive return with 51% of its volatility.
- The Fund’s security selection in the consumer discretionary and communication services sectors detracted from performance.
- Underweights in Intel and KLA were among the top detractors.
- The Fund’s security selection in the information technology and industrials sectors contributed to performance.
- Overweights in Seagate Technology and Micron Technology were among the top contributors.
Fund Performance
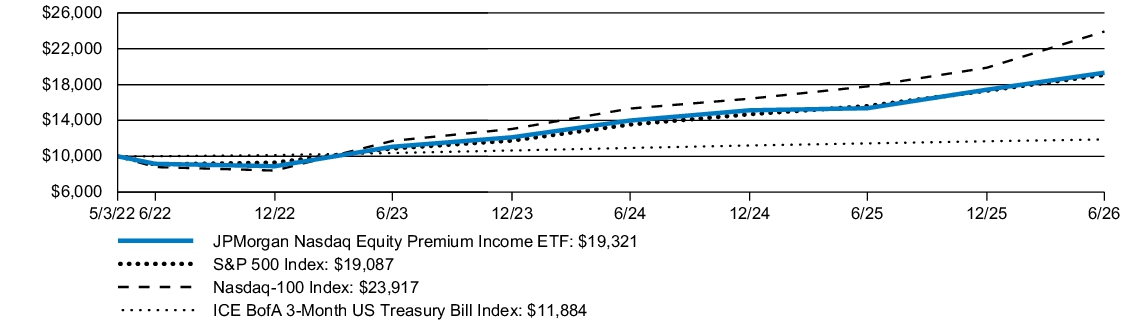
| AVERAGE ANNUAL TOTAL RETURNS | INCEPTION DATE |
1 YEAR | SINCE INCEPTION |
||
| JPMorgan Nasdaq Equity Premium Income ETF - Net Asset Value | May 3, 2022 | 25.75 | % | 17.16 | % |
| S&P 500 Index | 22.32 | 16.82 | |||
| Nasdaq-100 Index | 34.38 | 23.33 | |||
| ICE BofA 3-Month US Treasury Bill Index | 3.84 | 4.24 |
Performance shown in this section does not reflect the deduction of taxes that a shareholder may pay on Fund distributions or on gains resulting from redemption or sale of Fund shares.
KEY FUND STATISTICS
| Fund net assets | $40,819,064,229 | |
| Total number of portfolio holdings | 112 | |
| Portfolio turnover rate | 174 | % |
| Total advisory fees paid | $115,371,917 |
PORTFOLIO COMPOSITION - SECTOR
(% of Total Investments)
(% of Total Investments)
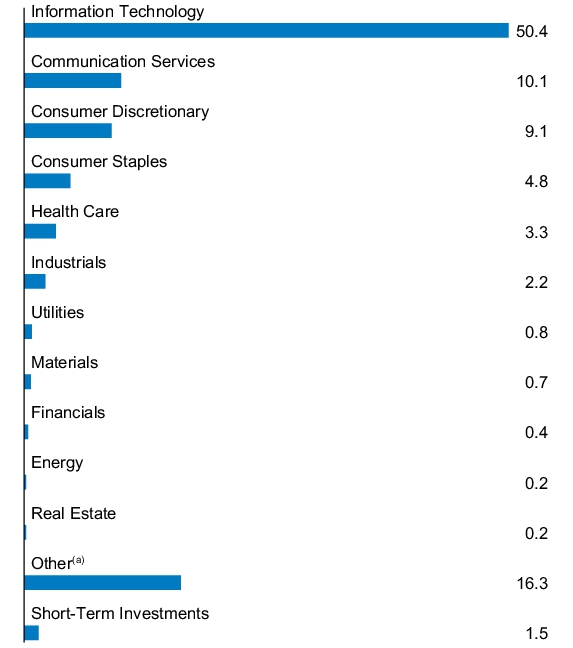
| (a) | Equity-Linked Notes that are linked to the Nasdaq-100 Index. |
What were the Fund costs for the last year?
(based on a hypothetical $10,000 investment)
| Fund | Costs of a $10,000 investment |
Costs paid as a percentage of a $10,000 investment |
| JPMorgan Active Growth ETF |
$47 | 0.44% |
How did the Fund Perform?
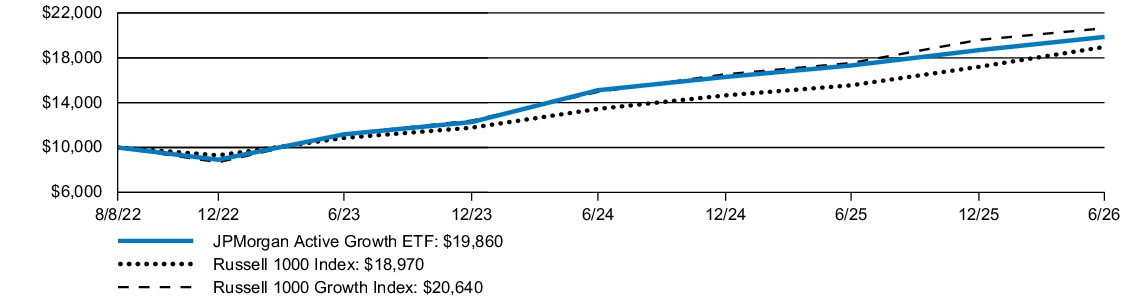
The Fund returned 14.70% for the twelve months ended June 30, 2026. The Russell 1000 Index returned 22.02% and the Russell 1000 Growth Index returned 17.71% for the twelve months ended June 30, 2026.
- The Fund’s security selection in the technology and health care sectors detracted from relative performance.
- The Fund’s underweight allocations to Alphabet and Apple detracted from relative performance.
- The Fund’s security selection in the industrials and telecommunications sectors contributed to relative performance.
- The Fund’s underweight allocation to Microsoft and overweight allocation to Ciena contributed to relative performance.
Fund Performance
| AVERAGE ANNUAL TOTAL RETURNS | INCEPTION DATE |
1 YEAR | SINCE INCEPTION |
||
| JPMorgan Active Growth ETF - Net Asset Value | August 8, 2022 | 14.70 | % | 19.27 | % |
| Russell 1000 Index | 22.02 | 17.87 | |||
| Russell 1000 Growth Index | 17.71 | 20.45 |
Performance shown in this section does not reflect the deduction of taxes that a shareholder may pay on Fund distributions or on gains resulting from redemption or sale of Fund shares.
KEY FUND STATISTICS
| Fund net assets | $9,992,342,989 | |
| Total number of portfolio holdings | 129 | |
| Portfolio turnover rate | 68 | % |
| Total advisory fees paid | $36,036,489 |
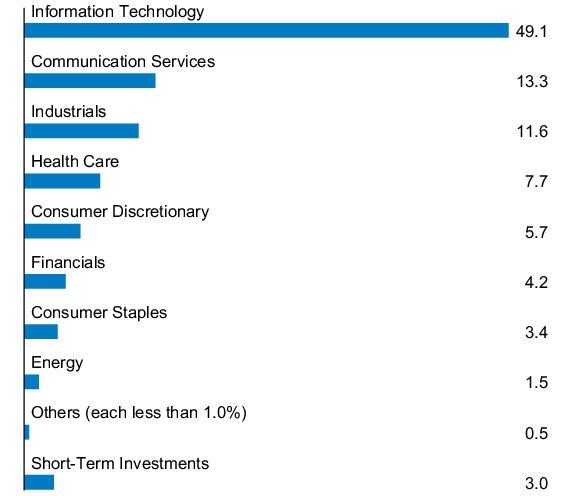
PORTFOLIO COMPOSITION - SECTOR
(% of Total Investments)
(% of Total Investments)
This report describes material changes to the Fund that occurred during the reporting period.
What were the Fund costs for the last year?
(based on a hypothetical $10,000 investment)
| Fund | Costs of a $10,000 investment |
Costs paid as a percentage of a $10,000 investment |
| JPMorgan Active Small Cap Value ETF |
$83 | 0.74% |
How did the Fund Perform?
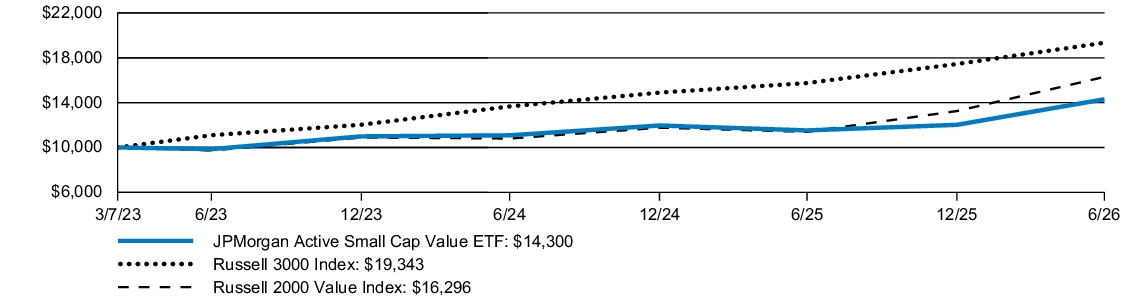
The Fund returned 24.10% for the twelve months ended June 30, 2026. The Russell 3000 Index returned 22.82% and the Russell 2000 Value Index returned 43.01% for the twelve months ended June 30, 2026.
- The Fund's security selection in health care and financials detracted from performance.
- The Fund's security selection in industrials and utilities contributed to performance.
- The Fund's underweight allocation to TTM Technologies and not owning EchoStar detracted from performance.
- The Fund's overweight allocation to Sanmina and Radiant Corp. contributed to performance.
Fund Performance
| AVERAGE ANNUAL TOTAL RETURNS | INCEPTION DATE |
1 YEAR | SINCE INCEPTION |
||
| JPMorgan Active Small Cap Value ETF - Net Asset Value | March 7, 2023 | 24.10 | % | 11.39 | % |
| Russell 3000 Index | 22.82 | 22.02 | |||
| Russell 2000 Value Index | 43.01 | 15.87 |
Performance shown in this section does not reflect the deduction of taxes that a shareholder may pay on Fund distributions or on gains resulting from redemption or sale of Fund shares.
KEY FUND STATISTICS
| Fund net assets | $26,883,007 | |
| Total number of portfolio holdings | 107 | |
| Portfolio turnover rate | 49 | % |
| Total advisory fees paid | $180,138 |
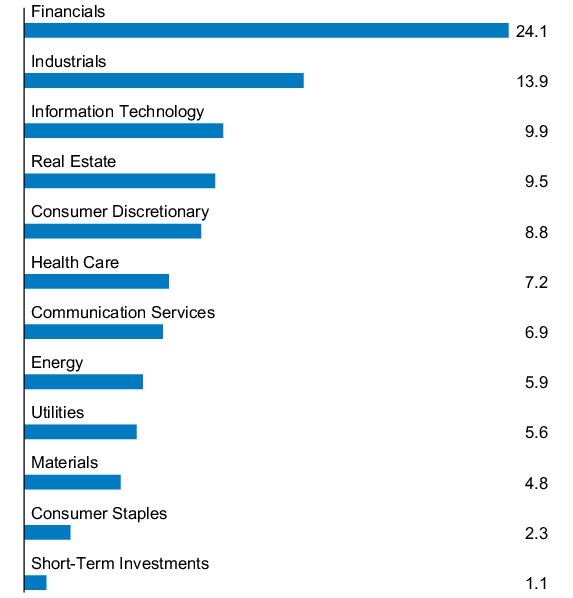
PORTFOLIO COMPOSITION - SECTOR
(% of Total Investments)
(% of Total Investments)
Material changes to the Fund during the period
Effective April 20, 2026, the Fund’s structure changed from a “non-transparent” or “semi-transparent” ETF, which does not publicly disclose its portfolio holdings on a daily basis, to a “transparent” ETF that discloses its portfolio holdings daily and operates in reliance on Rule 6c-11 under the Investment Company Act of 1940, as amended.
This is a summary of certain changes to the Fund since July 1, 2025. For more complete information, you may review the Fund’s prospectus at www.jpmorganfunds.com/funddocuments or upon request at 1-844-457-6383.
This is a summary of certain changes to the Fund since July 1, 2025. For more complete information, you may review the Fund’s prospectus at www.jpmorganfunds.com/funddocuments or upon request at 1-844-457-6383.
This report describes material changes to the Fund that occurred during the reporting period.
What were the Fund costs for the last year?
(based on a hypothetical $10,000 investment)
| Fund | Costs of a $10,000 investment |
Costs paid as a percentage of a $10,000 investment |
| JPMorgan Equity Focus ETF |
$49 | 0.46% |
How did the Fund Perform?
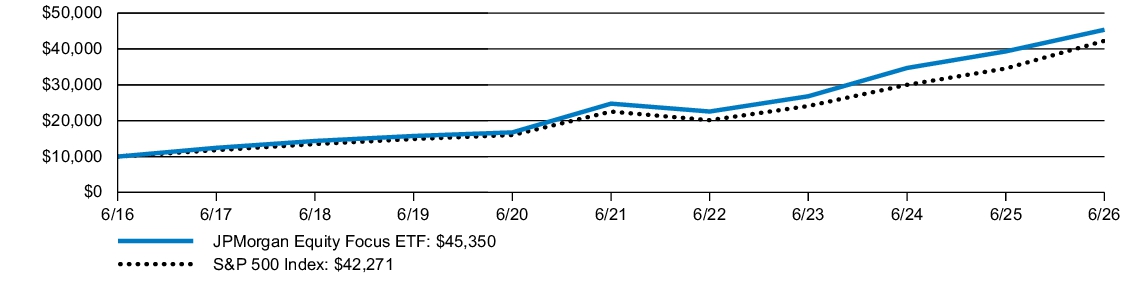
The Fund returned 15.34% for the twelve months ended June 30, 2026. The S&P 500 Index returned 22.32% for the twelve months ended June 30, 2026.
- The Fund’s security selection in the information technology and consumer discretionary sectors detracted from relative performance.
- The Fund’s overweight allocation to Intuit and underweight allocation to Micron Technology detracted from relative performance.
- The Fund’s security selection in the financials and industrials sectors contributed to relative performance.
- The Fund’s overweight allocations to Analog Devices and United Rentals contributed to relative performance.
Fund Performance
| AVERAGE ANNUAL TOTAL RETURNS | INCEPTION DATE |
1 YEAR | 5 YEAR | 10 YEAR | |||
| JPMorgan Equity Focus ETF - Net Asset Value | July 29, 2011* | 15.34 | % | 12.87 | % | 16.32 | % |
| S&P 500 Index | 22.32 | 13.41 | 15.51 |
| * |
Inception date for Class I Shares of the Acquired Fund (as defined below). |
KEY FUND STATISTICS
| Fund net assets | $1,979,763,545 | |
| Total number of portfolio holdings | 41 | |
| Portfolio turnover rate | 36 | % |
| Total advisory fees paid | $7,705,936 |
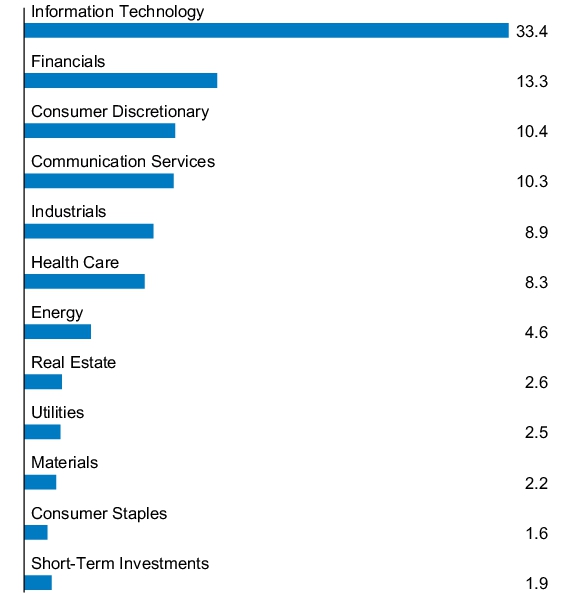
PORTFOLIO COMPOSITION - SECTOR
(% of Total Investments)
(% of Total Investments)
Material changes to the Fund during the period
Effective November 1, 2025, the Fund reduced its investment advisory fee from 0.50% of average daily net assets to 0.44% of daily average net assets.
The Fund added “Significant Holdings Risk” to its prospectus as of March 1, 2026. Although the Fund is considered “diversified” under applicable law, a relatively large portion of its portfolio at times may be invested in a relatively small number of securities, or investments (including futures) whose performance relates in part to the economic results of a relatively small number of securities, or in a combination of the foregoing.
This is a summary of certain changes to the Fund since July 1, 2025. For more complete information, you may review the Fund’s prospectus at www.jpmorganfunds.com/funddocuments or upon request at 1-844-457-6383.
Effective November 1, 2025, the Fund reduced its investment advisory fee from 0.50% of average daily net assets to 0.44% of daily average net assets.
The Fund added “Significant Holdings Risk” to its prospectus as of March 1, 2026. Although the Fund is considered “diversified” under applicable law, a relatively large portion of its portfolio at times may be invested in a relatively small number of securities, or investments (including futures) whose performance relates in part to the economic results of a relatively small number of securities, or in a combination of the foregoing.
This is a summary of certain changes to the Fund since July 1, 2025. For more complete information, you may review the Fund’s prospectus at www.jpmorganfunds.com/funddocuments or upon request at 1-844-457-6383.
This report describes material changes to the Fund that occurred during the reporting period.
What were the Fund costs for the last year?
(based on a hypothetical $10,000 investment)
| Fund | Costs of a $10,000 investment |
Costs paid as a percentage of a $10,000 investment |
| JPMorgan U.S. Tech Leaders ETF |
$75 | 0.65% |
How did the Fund Perform?
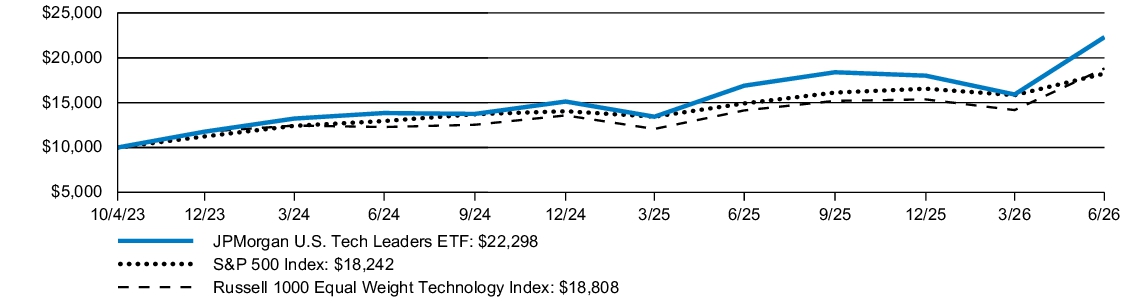
The Fund returned 32.02% for the twelve months ended June 30, 2026. The S&P 500 Index returned 22.32% and the Russell 1000 Equal Weight Technology Index returned 33.07% for the twelve months ended June 30, 2026.
- The Fund’s underweight allocations to computer hardware and production technology equipment within technology detracted from performance.
- The Fund’s underweight allocations to software and computer services within technology contributed to performance.
- The Fund’s underweight allocation to Sandisk and lack of exposure to Western Digital detracted from performance.
- The Fund’s overweight allocation to Ciena and Lam Research contributed to performance.
Fund Performance
| AVERAGE ANNUAL TOTAL RETURNS | INCEPTION DATE |
1 YEAR | SINCE INCEPTION |
||
| JPMorgan U.S. Tech Leaders ETF - Net Asset Value | October 4, 2023 | 32.02 | % | 34.00 | % |
| S&P 500 Index | 22.32 | 24.54 | |||
| Russell 1000 Equal Weight Technology Index | 33.07 | 25.94 |
Performance shown in this section does not reflect the deduction of taxes that a shareholder may pay on Fund distributions or on gains resulting from redemption or sale of Fund shares.
KEY FUND STATISTICS
| Fund net assets | $4,637,768,179 | |
| Total number of portfolio holdings | 63 | |
| Portfolio turnover rate | 72 | % |
| Total advisory fees paid | $20,117,333 |
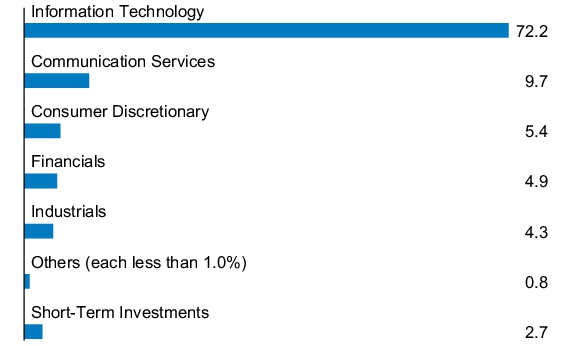
PORTFOLIO COMPOSITION - SECTOR
(% of Total Investments)
(% of Total Investments)
Material changes to the Fund during the period
The Fund added “Communication Services Sector Risk” disclosure to its summary prospectus as of November 1, 2025. This disclosure was added in light of a larger concentration of portfolio securities in this sector.
This is a summary of certain changes to the Fund since July 1, 2025. For more complete information, you may review the Fund’s prospectus at www.jpmorganfunds.com/funddocuments or upon request at 1-844-457-6383.
The Fund added “Communication Services Sector Risk” disclosure to its summary prospectus as of November 1, 2025. This disclosure was added in light of a larger concentration of portfolio securities in this sector.
This is a summary of certain changes to the Fund since July 1, 2025. For more complete information, you may review the Fund’s prospectus at www.jpmorganfunds.com/funddocuments or upon request at 1-844-457-6383.
This report describes material changes to the Fund that occurred during the reporting period.
What were the Fund costs for the last year?
(based on a hypothetical $10,000 investment)
| Fund | Costs of a $10,000 investment |
Costs paid as a percentage of a $10,000 investment |
| JPMorgan Fundamental Data Science Large Core ETF |
$33 | 0.30% |
How did the Fund Perform?
The Fund returned 21.06% for the twelve months ended June 30, 2026. The S&P 500 Index returned 21.88% for the twelve months ended June 30, 2026.
- The Fund’s security selection in the financials and communication services sectors detracted from relative performance.
- Underweights in Intel and Applied Materials were among the top detractors.
- The Fund’s security selection in the information technology and health care sectors contributed to relative performance.
- Overweights in Micron Technology and Seagate Technology were among the top contributors.
Fund Performance
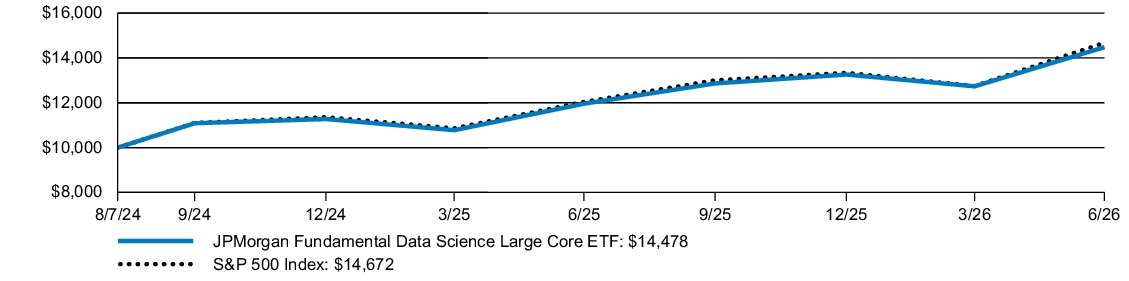
| AVERAGE ANNUAL TOTAL RETURNS | INCEPTION DATE |
1 YEAR | SINCE INCEPTION |
||
| JPMorgan Fundamental Data Science Large Core ETF - Net Asset Value | August 7, 2024 | 21.06 | % | 21.55 | % |
| S&P 500 Index | 21.88 | 22.38 |
Performance shown in this section does not reflect the deduction of taxes that a shareholder may pay on Fund distributions or on gains resulting from redemption or sale of Fund shares.
KEY FUND STATISTICS
| Fund net assets | $15,988,358 | |
| Total number of portfolio holdings | 113 | |
| Portfolio turnover rate | 12 | % |
| Total advisory fees paid | $43,906 |
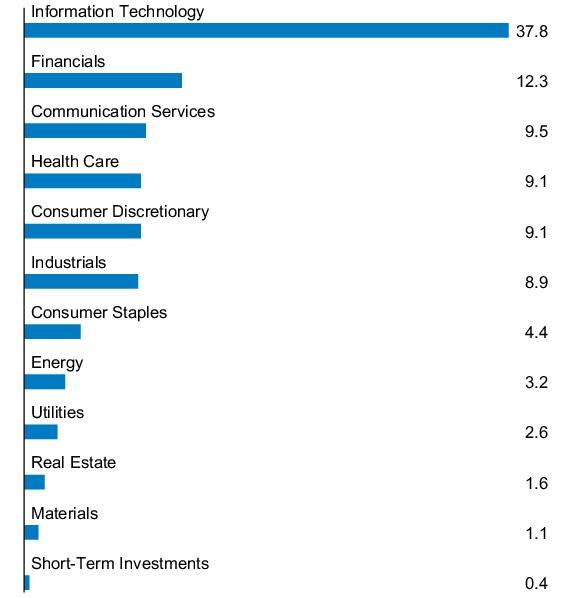
PORTFOLIO COMPOSITION - SECTOR
(% of Total Investments)
(% of Total Investments)
Material changes to the Fund during the period
The Fund added “Financials Sector Risk” disclosure to its summary prospectus as of November 1, 2025. This disclosure was added in light of a larger concentration of portfolio securities in this sector.
This is a summary of certain changes to the Fund since July 1, 2025. For more complete information, you may review the Fund’s prospectus at www.jpmorganfunds.com/funddocuments or upon request at 1-844-457-6383.
The Fund added “Financials Sector Risk” disclosure to its summary prospectus as of November 1, 2025. This disclosure was added in light of a larger concentration of portfolio securities in this sector.
This is a summary of certain changes to the Fund since July 1, 2025. For more complete information, you may review the Fund’s prospectus at www.jpmorganfunds.com/funddocuments or upon request at 1-844-457-6383.
This report describes material changes to the Fund that occurred during the reporting period.
What were the Fund costs for the last year?
(based on a hypothetical $10,000 investment)
| Fund | Costs of a $10,000 investment |
Costs paid as a percentage of a $10,000 investment |
| JPMorgan Fundamental Data Science Mid Core ETF |
$38 | 0.35% |
How did the Fund Perform?
The Fund returned 22.65% for the twelve months ended June 30, 2026. The Russell 3000 Index returned 22.39% and the Russell Midcap Index returned 21.08% for the twelve months ended June 30, 2026.
- The Fund’s security selection in the consumer discretionary and materials sectors contributed to relative performance.
- Overweights in Western Digital and Teradyne were among the top contributors.
- The Fund’s security selection in the information technology and industrials sectors detracted from relative performance.
- An underweight in Sandisk and an overweight in HubSpot were among the top detractors.
Fund Performance
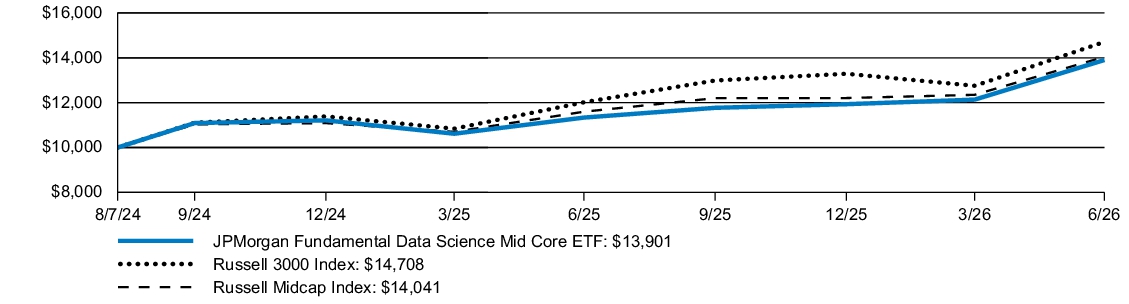
| AVERAGE ANNUAL TOTAL RETURNS | INCEPTION DATE |
1 YEAR | SINCE INCEPTION |
||
| JPMorgan Fundamental Data Science Mid Core ETF - Net Asset Value | August 7, 2024 | 22.65 | % | 18.97 | % |
| Russell 3000 Index | 22.39 | 22.54 | |||
| Russell Midcap Index | 21.08 | 19.58 |
Performance shown in this section does not reflect the deduction of taxes that a shareholder may pay on Fund distributions or on gains resulting from redemption or sale of Fund shares.
KEY FUND STATISTICS
| Fund net assets | $8,154,452 | |
| Total number of portfolio holdings | 205 | |
| Portfolio turnover rate | 26 | % |
| Total advisory fees paid | $24,957 |
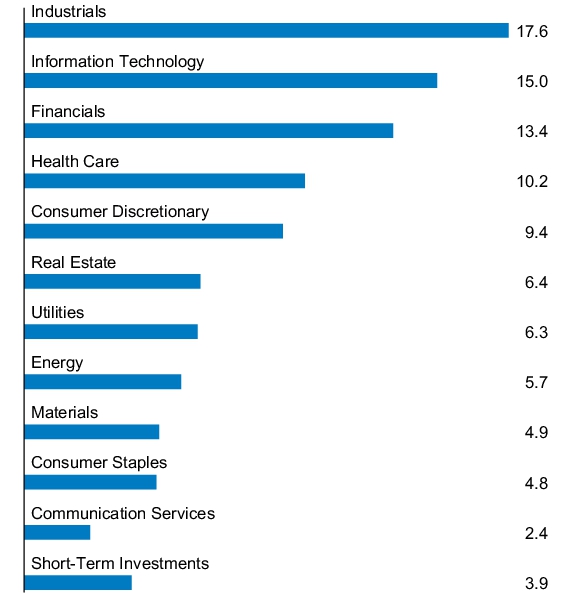
PORTFOLIO COMPOSITION - SECTOR
(% of Total Investments)
(% of Total Investments)
Material changes to the Fund during the period
The Fund added “Consumer Discretionary Sector Risk” disclosure to its summary prospectus as of November 1, 2025. This disclosure was added in light of a larger concentration of portfolio securities in this sector.
This is a summary of certain changes to the Fund since July 1, 2025. For more complete information, you may review the Fund’s prospectus at www.jpmorganfunds.com/funddocuments or upon request at 1-844-457-6383.
The Fund added “Consumer Discretionary Sector Risk” disclosure to its summary prospectus as of November 1, 2025. This disclosure was added in light of a larger concentration of portfolio securities in this sector.
This is a summary of certain changes to the Fund since July 1, 2025. For more complete information, you may review the Fund’s prospectus at www.jpmorganfunds.com/funddocuments or upon request at 1-844-457-6383.
What were the Fund costs for the last year?
(based on a hypothetical $10,000 investment)
| Fund | Costs of a $10,000 investment |
Costs paid as a percentage of a $10,000 investment |
| JPMorgan Fundamental Data Science Small Core ETF |
$48 | 0.40% |
How did the Fund Perform?
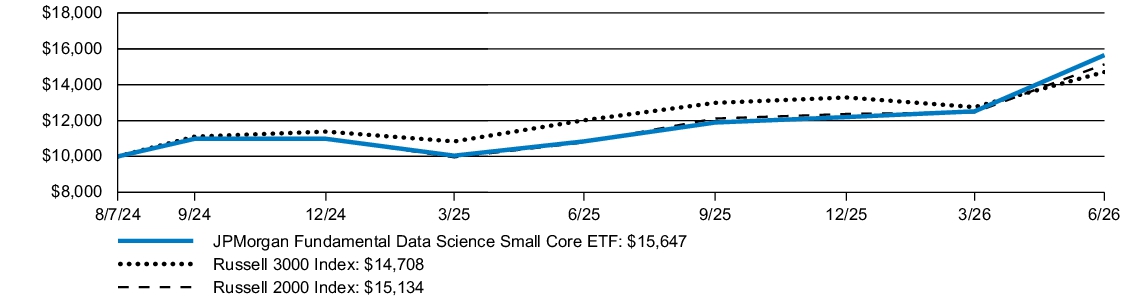
The Fund returned 44.35% for the twelve months ended June 30, 2026. The Russell 3000 Index returned 22.39% and the Russell 2000 Index returned 40.29% for the twelve months ended June 30, 2026.
- The Fund’s security selection in the industrials and information technology sectors contributed to relative performance.
- Overweights in Vicor and Bloom Energy were among the top contributors.
- The Fund’s security selection in the health care and communication services sectors detracted from relative performance.
- Overweights in BlackLine and Exl Service were among the top detractors.
Fund Performance
| AVERAGE ANNUAL TOTAL RETURNS | INCEPTION DATE |
1 YEAR | SINCE INCEPTION |
||
| JPMorgan Fundamental Data Science Small Core ETF - Net Asset Value | August 7, 2024 | 44.35 | % | 26.63 | % |
| Russell 3000 Index | 22.39 | 22.54 | |||
| Russell 2000 Index | 40.29 | 24.40 |
Performance shown in this section does not reflect the deduction of taxes that a shareholder may pay on Fund distributions or on gains resulting from redemption or sale of Fund shares.
KEY FUND STATISTICS
| Fund net assets | $9,211,157 | |
| Total number of portfolio holdings | 277 | |
| Portfolio turnover rate | 28 | % |
| Total advisory fees paid | $29,728 |
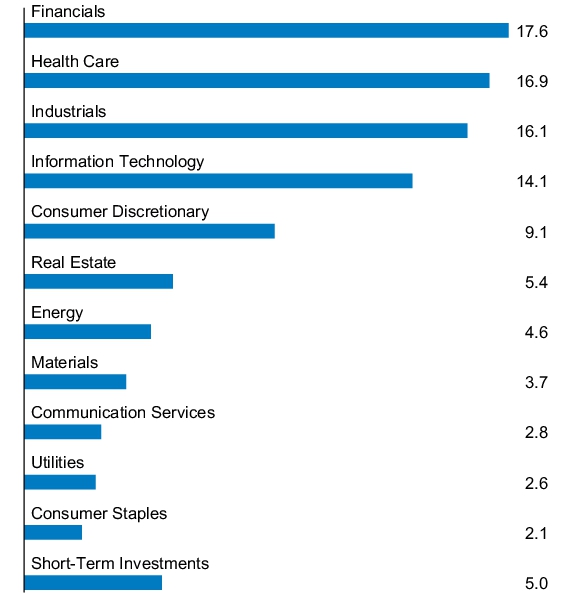
PORTFOLIO COMPOSITION - SECTOR
(% of Total Investments)
(% of Total Investments)
This report describes material changes to the Fund that occurred during the reporting period.
What were the Fund costs for the last year?
(based on a hypothetical $10,000 investment)
| Fund | Costs of a $10,000 investment |
Costs paid as a percentage of a $10,000 investment |
| JPMorgan U.S. Research Enhanced Large Cap ETF |
$16 | 0.15% |
How did the Fund Perform?
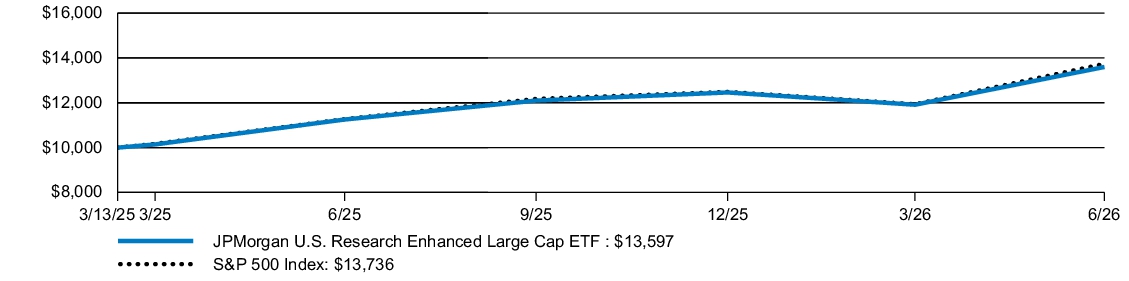
The Fund returned 20.83% for the twelve months ended June 30, 2026. The S&P 500 Index (the "Index") returned 21.88% for the twelve months ended June 30, 2026.
- The Fund’s security selection in the industrial cyclical and software and services sectors detracted from performance.
- Underweights in Intel and Applied Materials were among the top detractors.
- The Fund’s security selection in the financial services and consumer cyclical sectors contributed to performance.
- Overweights in Micron Technology and Seagate Technology were among the top contributors.
Fund Performance
| AVERAGE ANNUAL TOTAL RETURNS | INCEPTION DATE |
1 YEAR | SINCE INCEPTION |
||
| JPMorgan U.S. Research Enhanced Large Cap ETF - Net Asset Value | March 13, 2025 | 20.83 | % | 26.70 | % |
| S&P 500 Index | 21.88 | 27.69 |
Performance shown in this section does not reflect the deduction of taxes that a shareholder may pay on Fund distributions or on gains resulting from redemption or sale of Fund shares.
KEY FUND STATISTICS
| Fund net assets | $424,402,290 | |
| Total number of portfolio holdings | 251 | |
| Portfolio turnover rate | 25 | % |
| Total advisory fees paid | $107,844 |
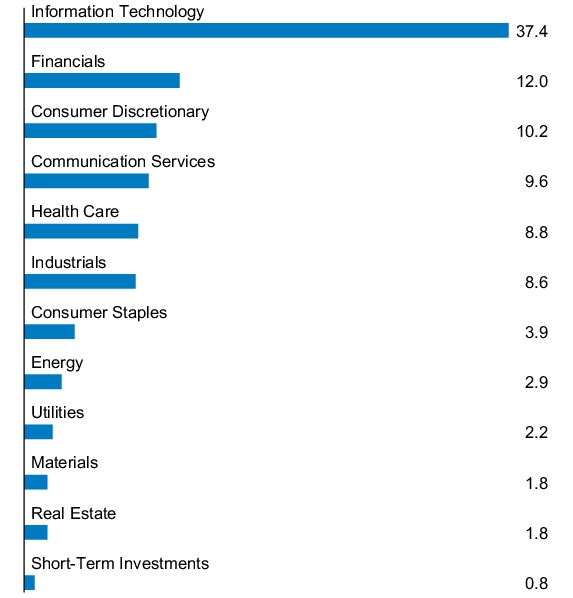
PORTFOLIO COMPOSITION - SECTOR
(% of Total Investments)
(% of Total Investments)
Material changes to the Fund during the period
Effective May 13, 2026, the Fund reduced its management fee from 0.20% of average daily net assets to 0.18% of daily average net assets and the Fund’s adviser has contractually agreed to waive fees and/or reimburse expenses to the extent Total Annual Fund Operating Expenses (excluding acquired fund fees and expenses other than certain money market fund fees as described below, dividend and interest expenses related to short sales, interest, taxes, expenses related to litigation and potential litigation, costs of shareholder meetings, and extraordinary expenses) exceed 0.12% of the average daily net assets of the Fund. These contractual waivers are in effect through October 31, 2027, at which time the adviser expects to charge the full management fee of 0.18% of average daily net assets.
The Fund added “Financials Sector Risk” disclosure to its summary prospectus as of November 1, 2025. This disclosure was added in light of a larger concentration of portfolio securities in this sector.
Effective June 4, 2026, the Fund changed from a diversified company to a non-diversified company and removed “Significant Holdings” risk disclosure from its prospectus and added “Non-Diversified Fund” risk disclosure to its prospectus. Since the Fund is non-diversified, it may invest a greater percentage of its assets in a particular issuer or group of issuers than a diversified fund would. This increased investment in fewer issuers may result in the Fund’s Shares being more sensitive to economic results among those issuing the securities. The value of the Fund’s Shares may also be more volatile than the value of a Fund which invests in more securities.
This is a summary of certain changes to the Fund since July 1, 2025. For more complete information, you may review the Fund’s prospectus at www.jpmorganfunds.com/funddocuments or upon request at 1-844-457-6383.
Effective May 13, 2026, the Fund reduced its management fee from 0.20% of average daily net assets to 0.18% of daily average net assets and the Fund’s adviser has contractually agreed to waive fees and/or reimburse expenses to the extent Total Annual Fund Operating Expenses (excluding acquired fund fees and expenses other than certain money market fund fees as described below, dividend and interest expenses related to short sales, interest, taxes, expenses related to litigation and potential litigation, costs of shareholder meetings, and extraordinary expenses) exceed 0.12% of the average daily net assets of the Fund. These contractual waivers are in effect through October 31, 2027, at which time the adviser expects to charge the full management fee of 0.18% of average daily net assets.
The Fund added “Financials Sector Risk” disclosure to its summary prospectus as of November 1, 2025. This disclosure was added in light of a larger concentration of portfolio securities in this sector.
Effective June 4, 2026, the Fund changed from a diversified company to a non-diversified company and removed “Significant Holdings” risk disclosure from its prospectus and added “Non-Diversified Fund” risk disclosure to its prospectus. Since the Fund is non-diversified, it may invest a greater percentage of its assets in a particular issuer or group of issuers than a diversified fund would. This increased investment in fewer issuers may result in the Fund’s Shares being more sensitive to economic results among those issuing the securities. The value of the Fund’s Shares may also be more volatile than the value of a Fund which invests in more securities.
This is a summary of certain changes to the Fund since July 1, 2025. For more complete information, you may review the Fund’s prospectus at www.jpmorganfunds.com/funddocuments or upon request at 1-844-457-6383.
This report describes material changes to the Fund that occurred during the reporting period.
What were the Fund costs for the last year?
(based on a hypothetical $10,000 investment)
| Fund | Costs of a $10,000 investment |
Costs paid as a percentage of a $10,000 investment |
| JPMorgan Fundamental Data Science Large Value ETF |
$36 | 0.32% |
How did the Fund Perform?
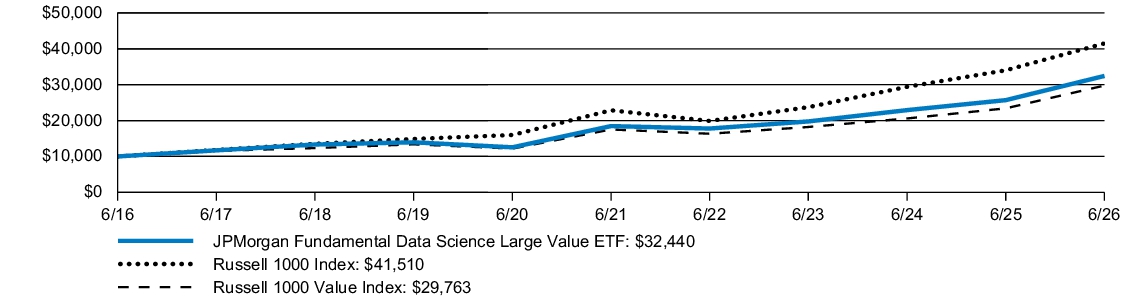
The Fund returned 26.24% for the twelve months ended June 30, 2026. The Russell 1000 Index returned 22.02% and the Russell 1000 Value Index (the "Index") returned 27.12% for the twelve months ended June 30, 2026.
- The Fund’s security selection in the communication services and industrials sectors detracted from relative performance.
- Overweights in Microsoft and Cognizant were among the top detractors.
- The Fund’s security selection in the information technology and financials sectors contributed to relative performance.
- An overweight in Seagate Technology and an underweight in Accenture were among the top contributors.
Fund Performance
| AVERAGE ANNUAL TOTAL RETURNS | INCEPTION DATE |
1 YEAR | 5 YEAR | 10 YEAR | |||
| JPMorgan Fundamental Data Science Large Value ETF - Net Asset Value | November 30, 2010* | 26.24 | % | 11.93 | % | 12.49 | % |
| Russell 1000 Index | 22.02 | 12.66 | 15.30 | ||||
| Russell 1000 Value Index | 27.12 | 11.17 | 11.52 |
| * |
Inception date for Class R6 Shares of the Acquired Fund (as defined below). |
KEY FUND STATISTICS
| Fund net assets | $106,021,581 | |
| Total number of portfolio holdings | 132 | |
| Portfolio turnover rate | 24 | % |
| Total advisory fees paid | $282,842 |
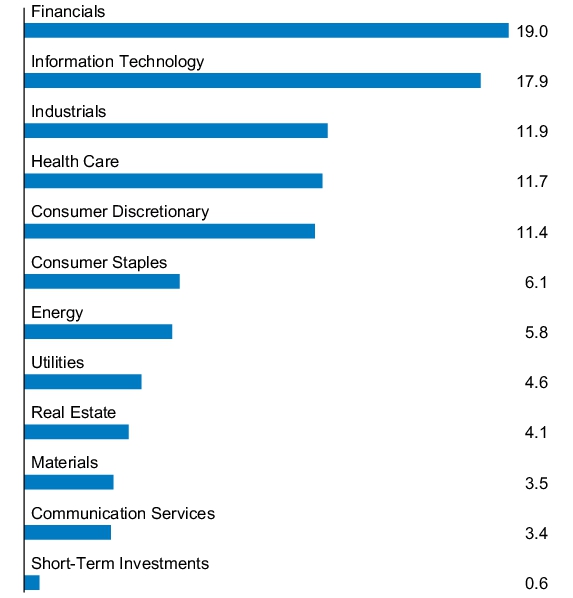
PORTFOLIO COMPOSITION - SECTOR
(% of Total Investments)
(% of Total Investments)
Material changes to the Fund during the period
The Fund acquired the assets and liabilities of the JPMorgan U.S. Applied Data Science Value Fund (“Acquired Fund”) in a reorganization that occurred as of the close of business on July 11, 2025. Performance and financial history of the Acquired Fund’s Class R6 Shares have been adopted by the Fund and will be used going forward. As a result, the performance for the Fund prior to the close of business on July 11, 2025, is the performance of the Acquired Fund’s Class R6 Shares. Inception date for the Acquired Fund’s Class R6 Shares is November 30, 2010.
The Fund is managed in a substantially similar manner as the Acquired Fund but, in order to meet the requirements of Rule 35d-1 under the 1940 Act, the Fund has a new 80% policy, according to which it invests at least 80% of its assets in large, well-established equity securities (companies with market capitalizations similar to those within the universe of the Russell 100 Value Index), while the Acquired Fund invested at least 80% of its assets in securities of U.S. large and mid-capitalization companies.
This is a summary of certain changes to the Fund since July 1, 2025. For more complete information, you may review the Fund’s prospectus at www.jpmorganfunds.com/funddocuments or upon request at 1-844-457-6383.
The Fund is managed in a substantially similar manner as the Acquired Fund but, in order to meet the requirements of Rule 35d-1 under the 1940 Act, the Fund has a new 80% policy, according to which it invests at least 80% of its assets in large, well-established equity securities (companies with market capitalizations similar to those within the universe of the Russell 100 Value Index), while the Acquired Fund invested at least 80% of its assets in securities of U.S. large and mid-capitalization companies.
This is a summary of certain changes to the Fund since July 1, 2025. For more complete information, you may review the Fund’s prospectus at www.jpmorganfunds.com/funddocuments or upon request at 1-844-457-6383.
| [1] | Inception date for Class I Shares of the Acquired Fund (as defined below). |
| [2] | Inception date for Class I Shares of the Acquired Fund (as defined below). |
| [3] | Inception date for Class R6 Shares of the Acquired Fund (as defined below). |