
Fidelity Core Real Estate Fund Q2 2026 Quarterly Update September 9, 2026 Presented by: Not FDIC Insured May Lose Value No Bank Guarantee All information as of 6/30/2026 unless otherwise noted. This quarterly update is intended for distribution only to investors in Fidelity Core Real Estate Fund. Not for redistribution. © 2026 FMR LLC. All rights reserved. Ellen Hall—Head of Direct Real Estate, Portfolio Manager Patrick McLaughlin, CFA—Head of Asset Management, Co-Portfolio Manager Jessica Taylor, CPA—VP, Finance Colton Bridge, CFA, CAIA—VP, Investor Relations Ben Kalkert, CFA, CAIA, CFP—Alternatives Strategist
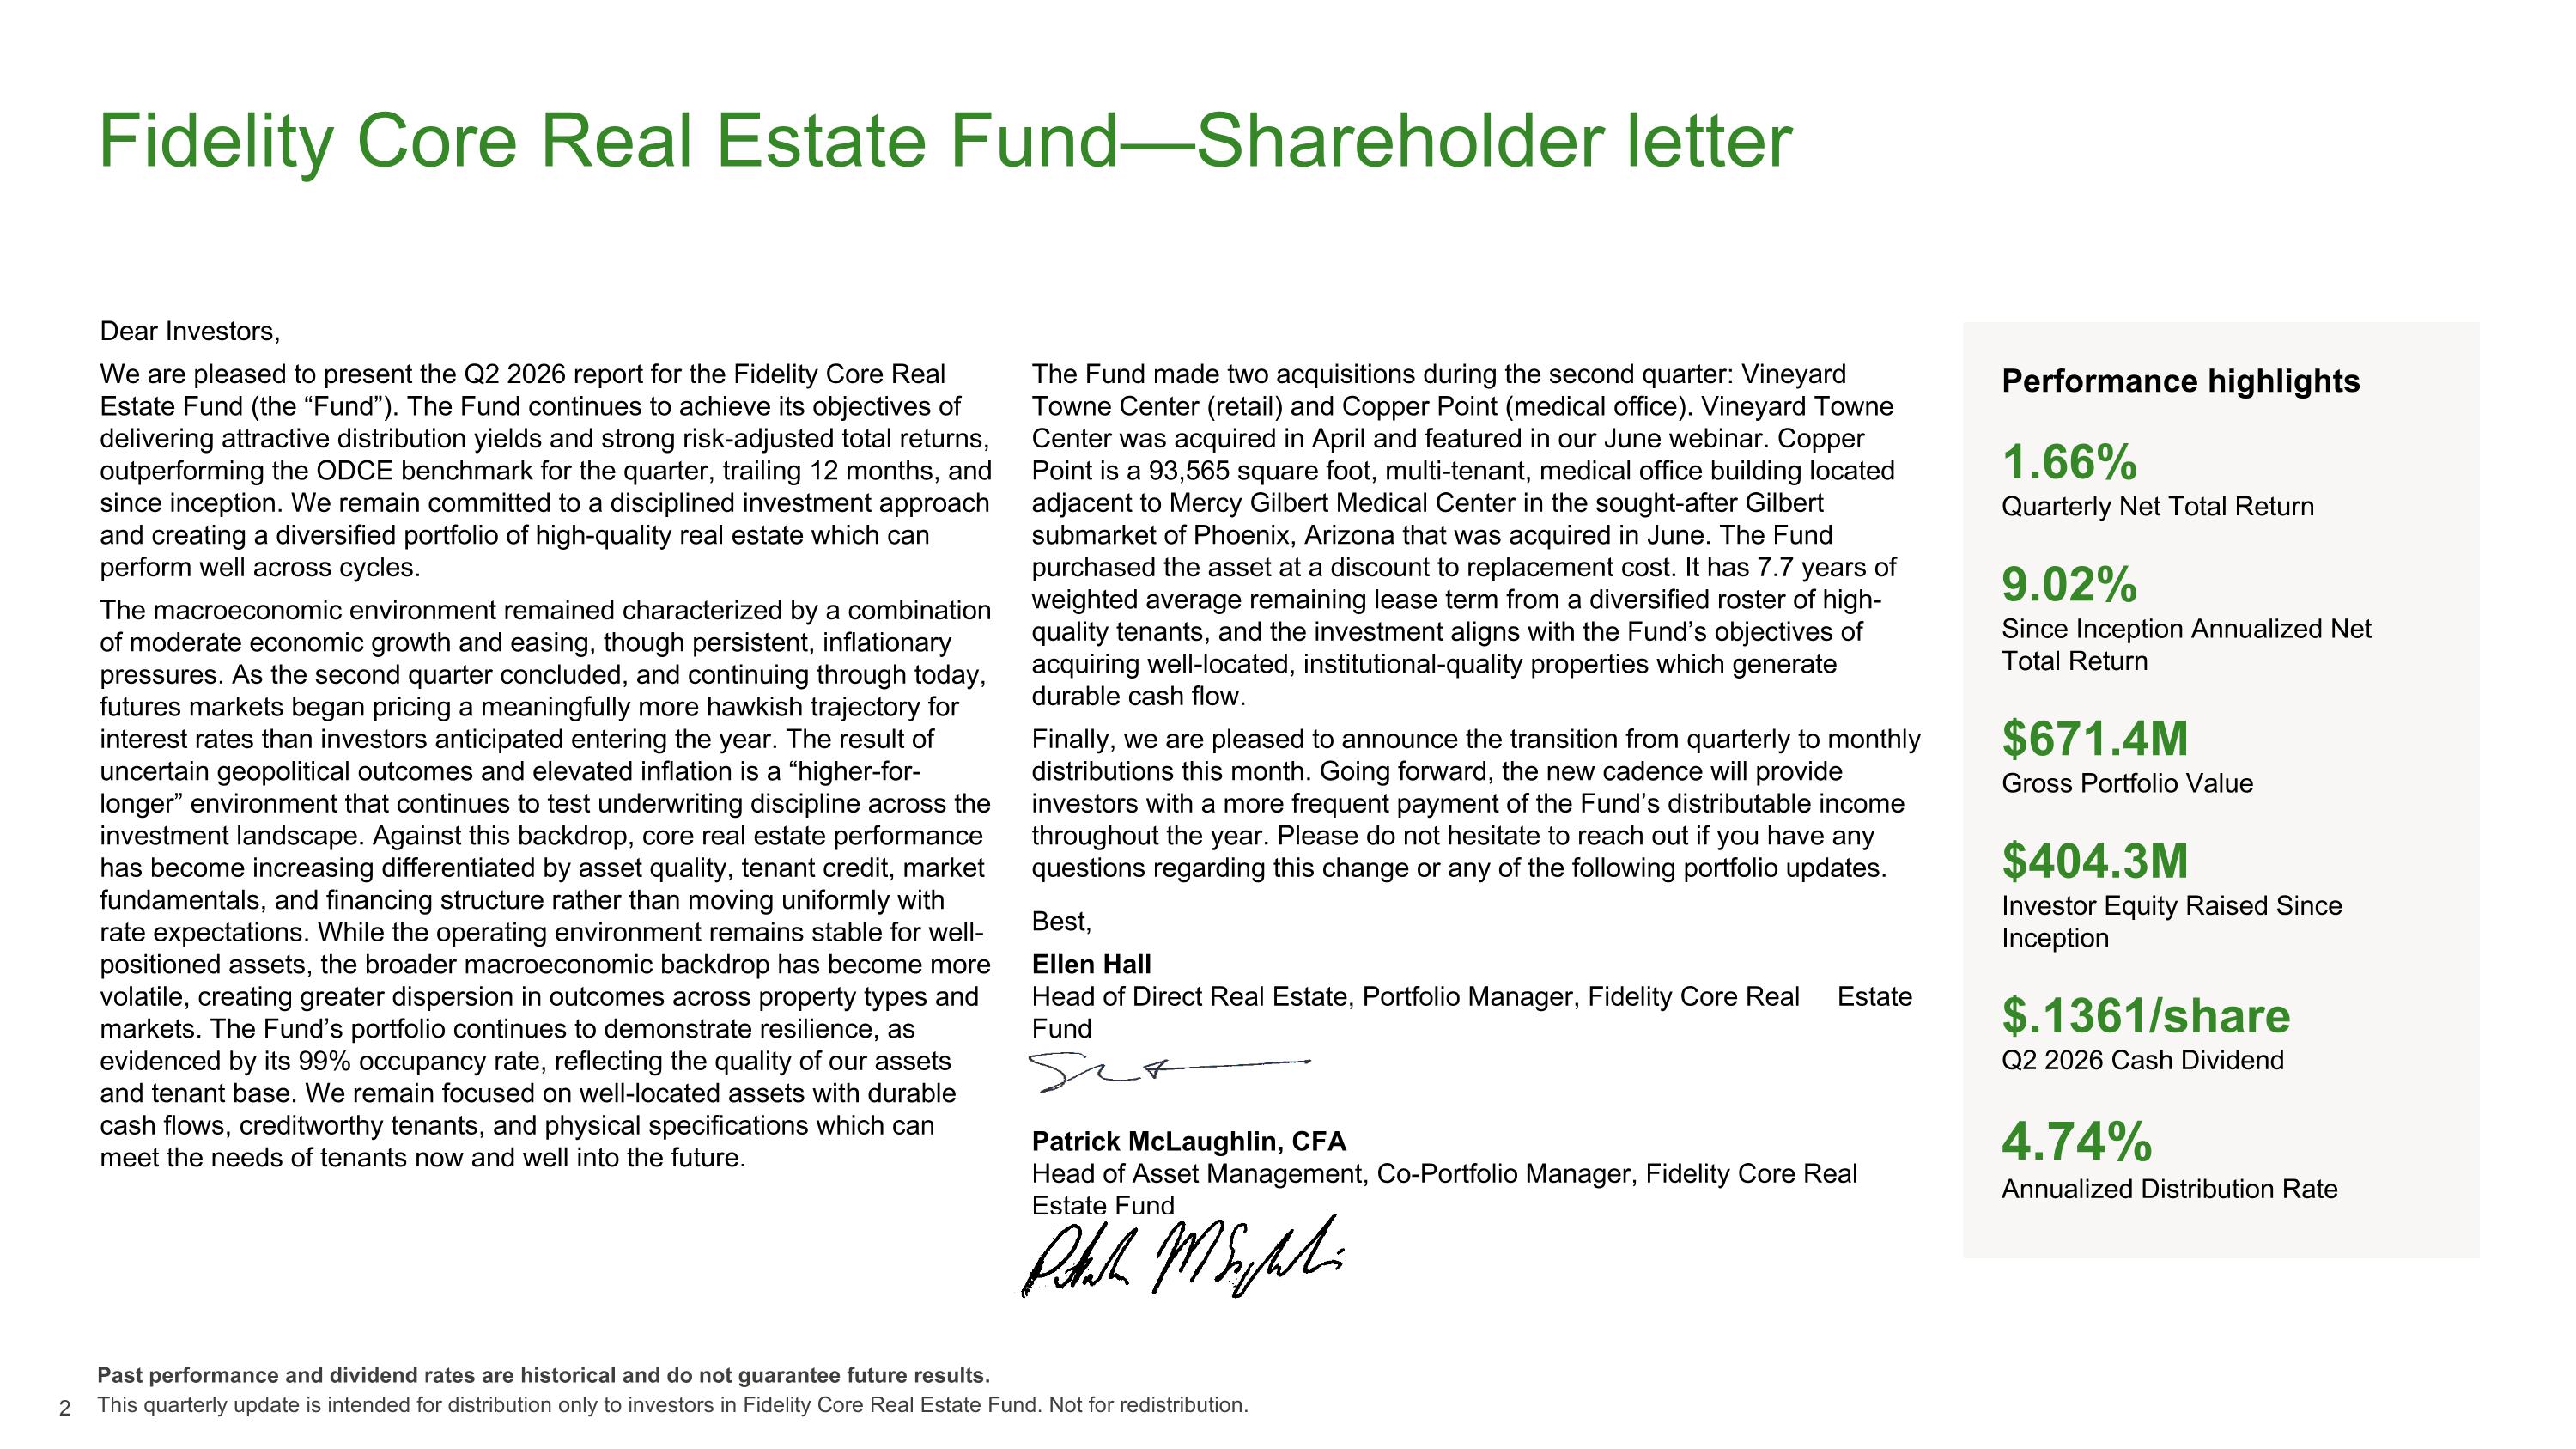
Fidelity Core Real Estate Fund—Shareholder letter Dear Investors, We are pleased to present the Q2 2026 report for the Fidelity Core Real Estate Fund (the “Fund”). The Fund continues to achieve its objectives of delivering attractive distribution yields and strong risk-adjusted total returns, outperforming the ODCE benchmark for the quarter, trailing 12 months, and since inception. We remain committed to a disciplined investment approach and creating a diversified portfolio of high-quality real estate which can perform well across cycles. The macroeconomic environment remained characterized by a combination of moderate economic growth and easing, though persistent, inflationary pressures. As the second quarter concluded, and continuing through today, futures markets began pricing a meaningfully more hawkish trajectory for interest rates than investors anticipated entering the year. The result of uncertain geopolitical outcomes and elevated inflation is a “higher-for-longer” environment that continues to test underwriting discipline across the investment landscape. Against this backdrop, core real estate performance has become increasing differentiated by asset quality, tenant credit, market fundamentals, and financing structure rather than moving uniformly with rate expectations. While the operating environment remains stable for well-positioned assets, the broader macroeconomic backdrop has become more volatile, creating greater dispersion in outcomes across property types and markets. The Fund’s portfolio continues to demonstrate resilience, as evidenced by its 99% occupancy rate, reflecting the quality of our assets and tenant base. We remain focused on well-located assets with durable cash flows, creditworthy tenants, and physical specifications which can meet the needs of tenants now and well into the future. The Fund made two acquisitions during the second quarter: Vineyard Towne Center (retail) and Copper Point (medical office). Vineyard Towne Center was acquired in April and featured in our June webinar. Copper Point is a 93,565 square foot, multi-tenant, medical office building located adjacent to Mercy Gilbert Medical Center in the sought-after Gilbert submarket of Phoenix, Arizona that was acquired in June. The Fund purchased the asset at a discount to replacement cost. It has 7.7 years of weighted average remaining lease term from a diversified roster of high-quality tenants, and the investment aligns with the Fund’s objectives of acquiring well-located, institutional-quality properties which generate durable cash flow. Finally, we are pleased to announce the transition from quarterly to monthly distributions this month. Going forward, the new cadence will provide investors with a more frequent payment of the Fund’s distributable income throughout the year. Please do not hesitate to reach out if you have any questions regarding this change or any of the following portfolio updates. Best, Ellen Hall Head of Direct Real Estate, Portfolio Manager, Fidelity Core Real Estate Fund Patrick McLaughlin, CFA Head of Asset Management, Co-Portfolio Manager, Fidelity Core Real Estate Fund Performance highlights 1.66% Quarterly Net Total Return 9.02% Since Inception Annualized Net Total Return $671.4M Gross Portfolio Value $404.3M Investor Equity Raised Since Inception $.1361/share Q2 2026 Cash Dividend 4.74% Annualized Distribution Rate Past performance and dividend rates are historical and do not guarantee future results. This quarterly update is intended for distribution only to investors in Fidelity Core Real Estate Fund. Not for redistribution.
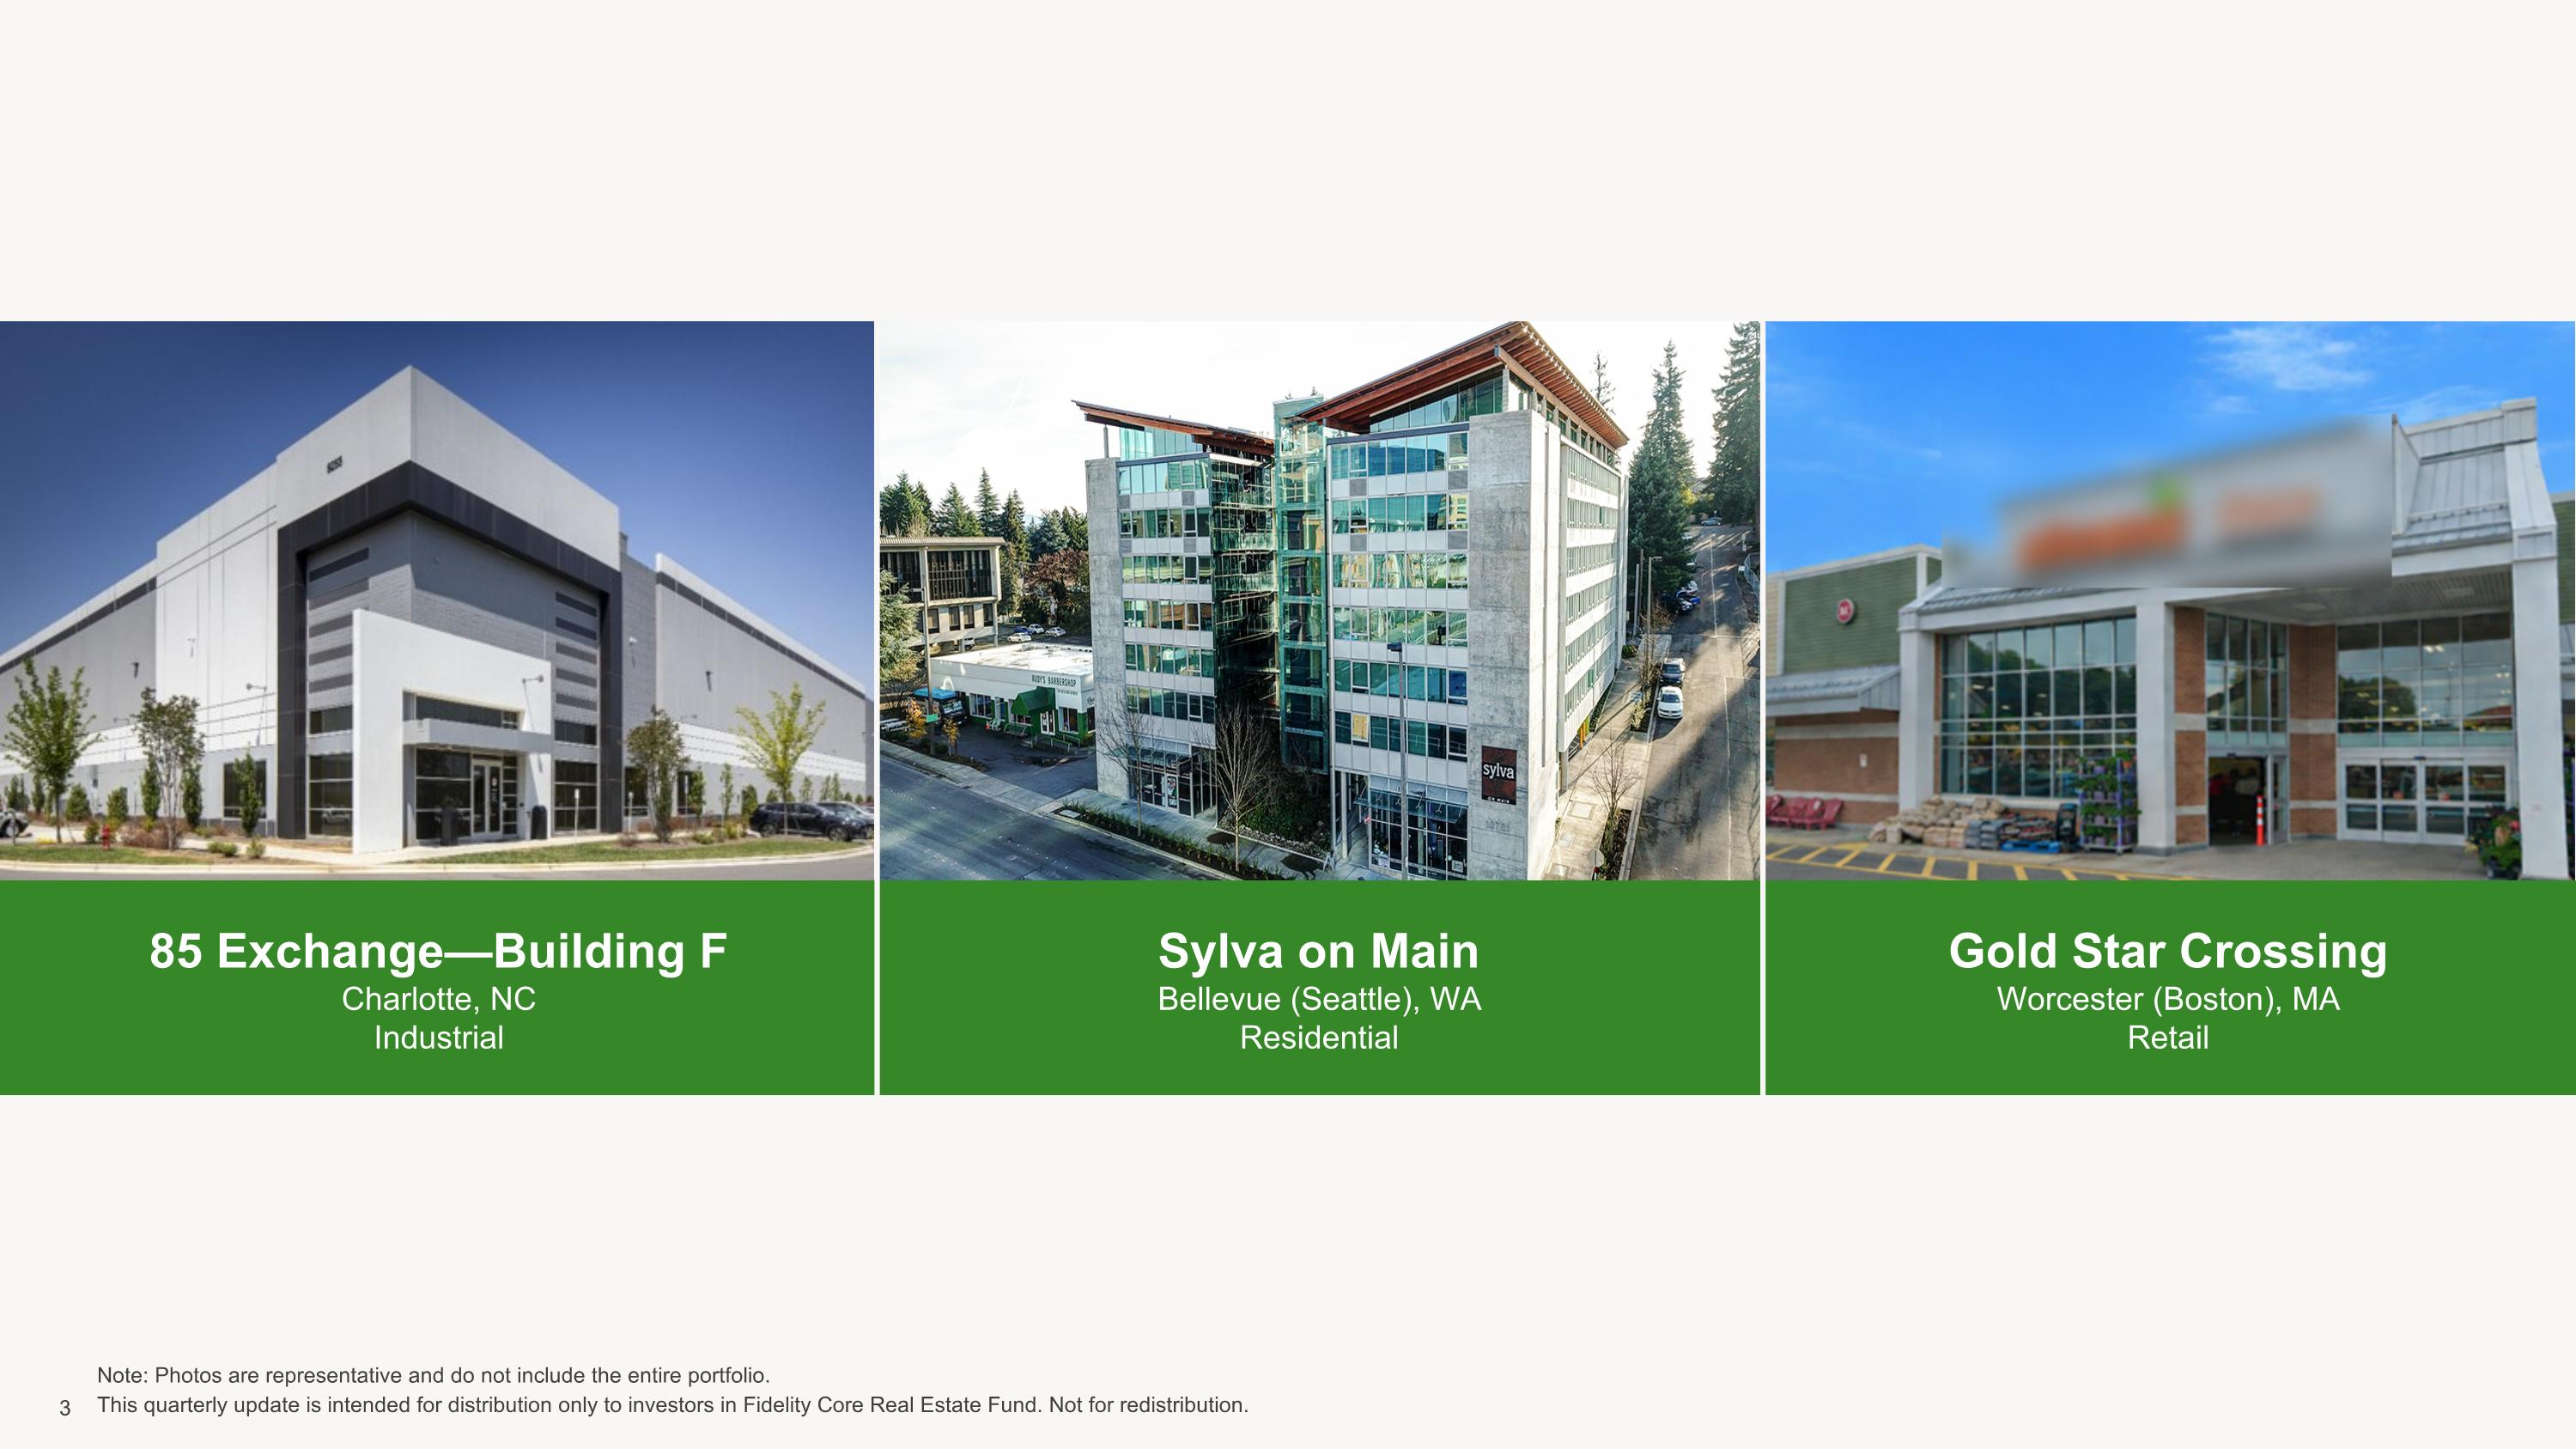
85 Exchange—Building F Charlotte, NC Industrial Sylva on Main Bellevue (Seattle), WA Residential Gold Star Crossing Worcester (Boston), MA Retail Note: Photos are representative and do not include the entire portfolio. This quarterly update is intended for distribution only to investors in Fidelity Core Real Estate Fund. Not for redistribution.
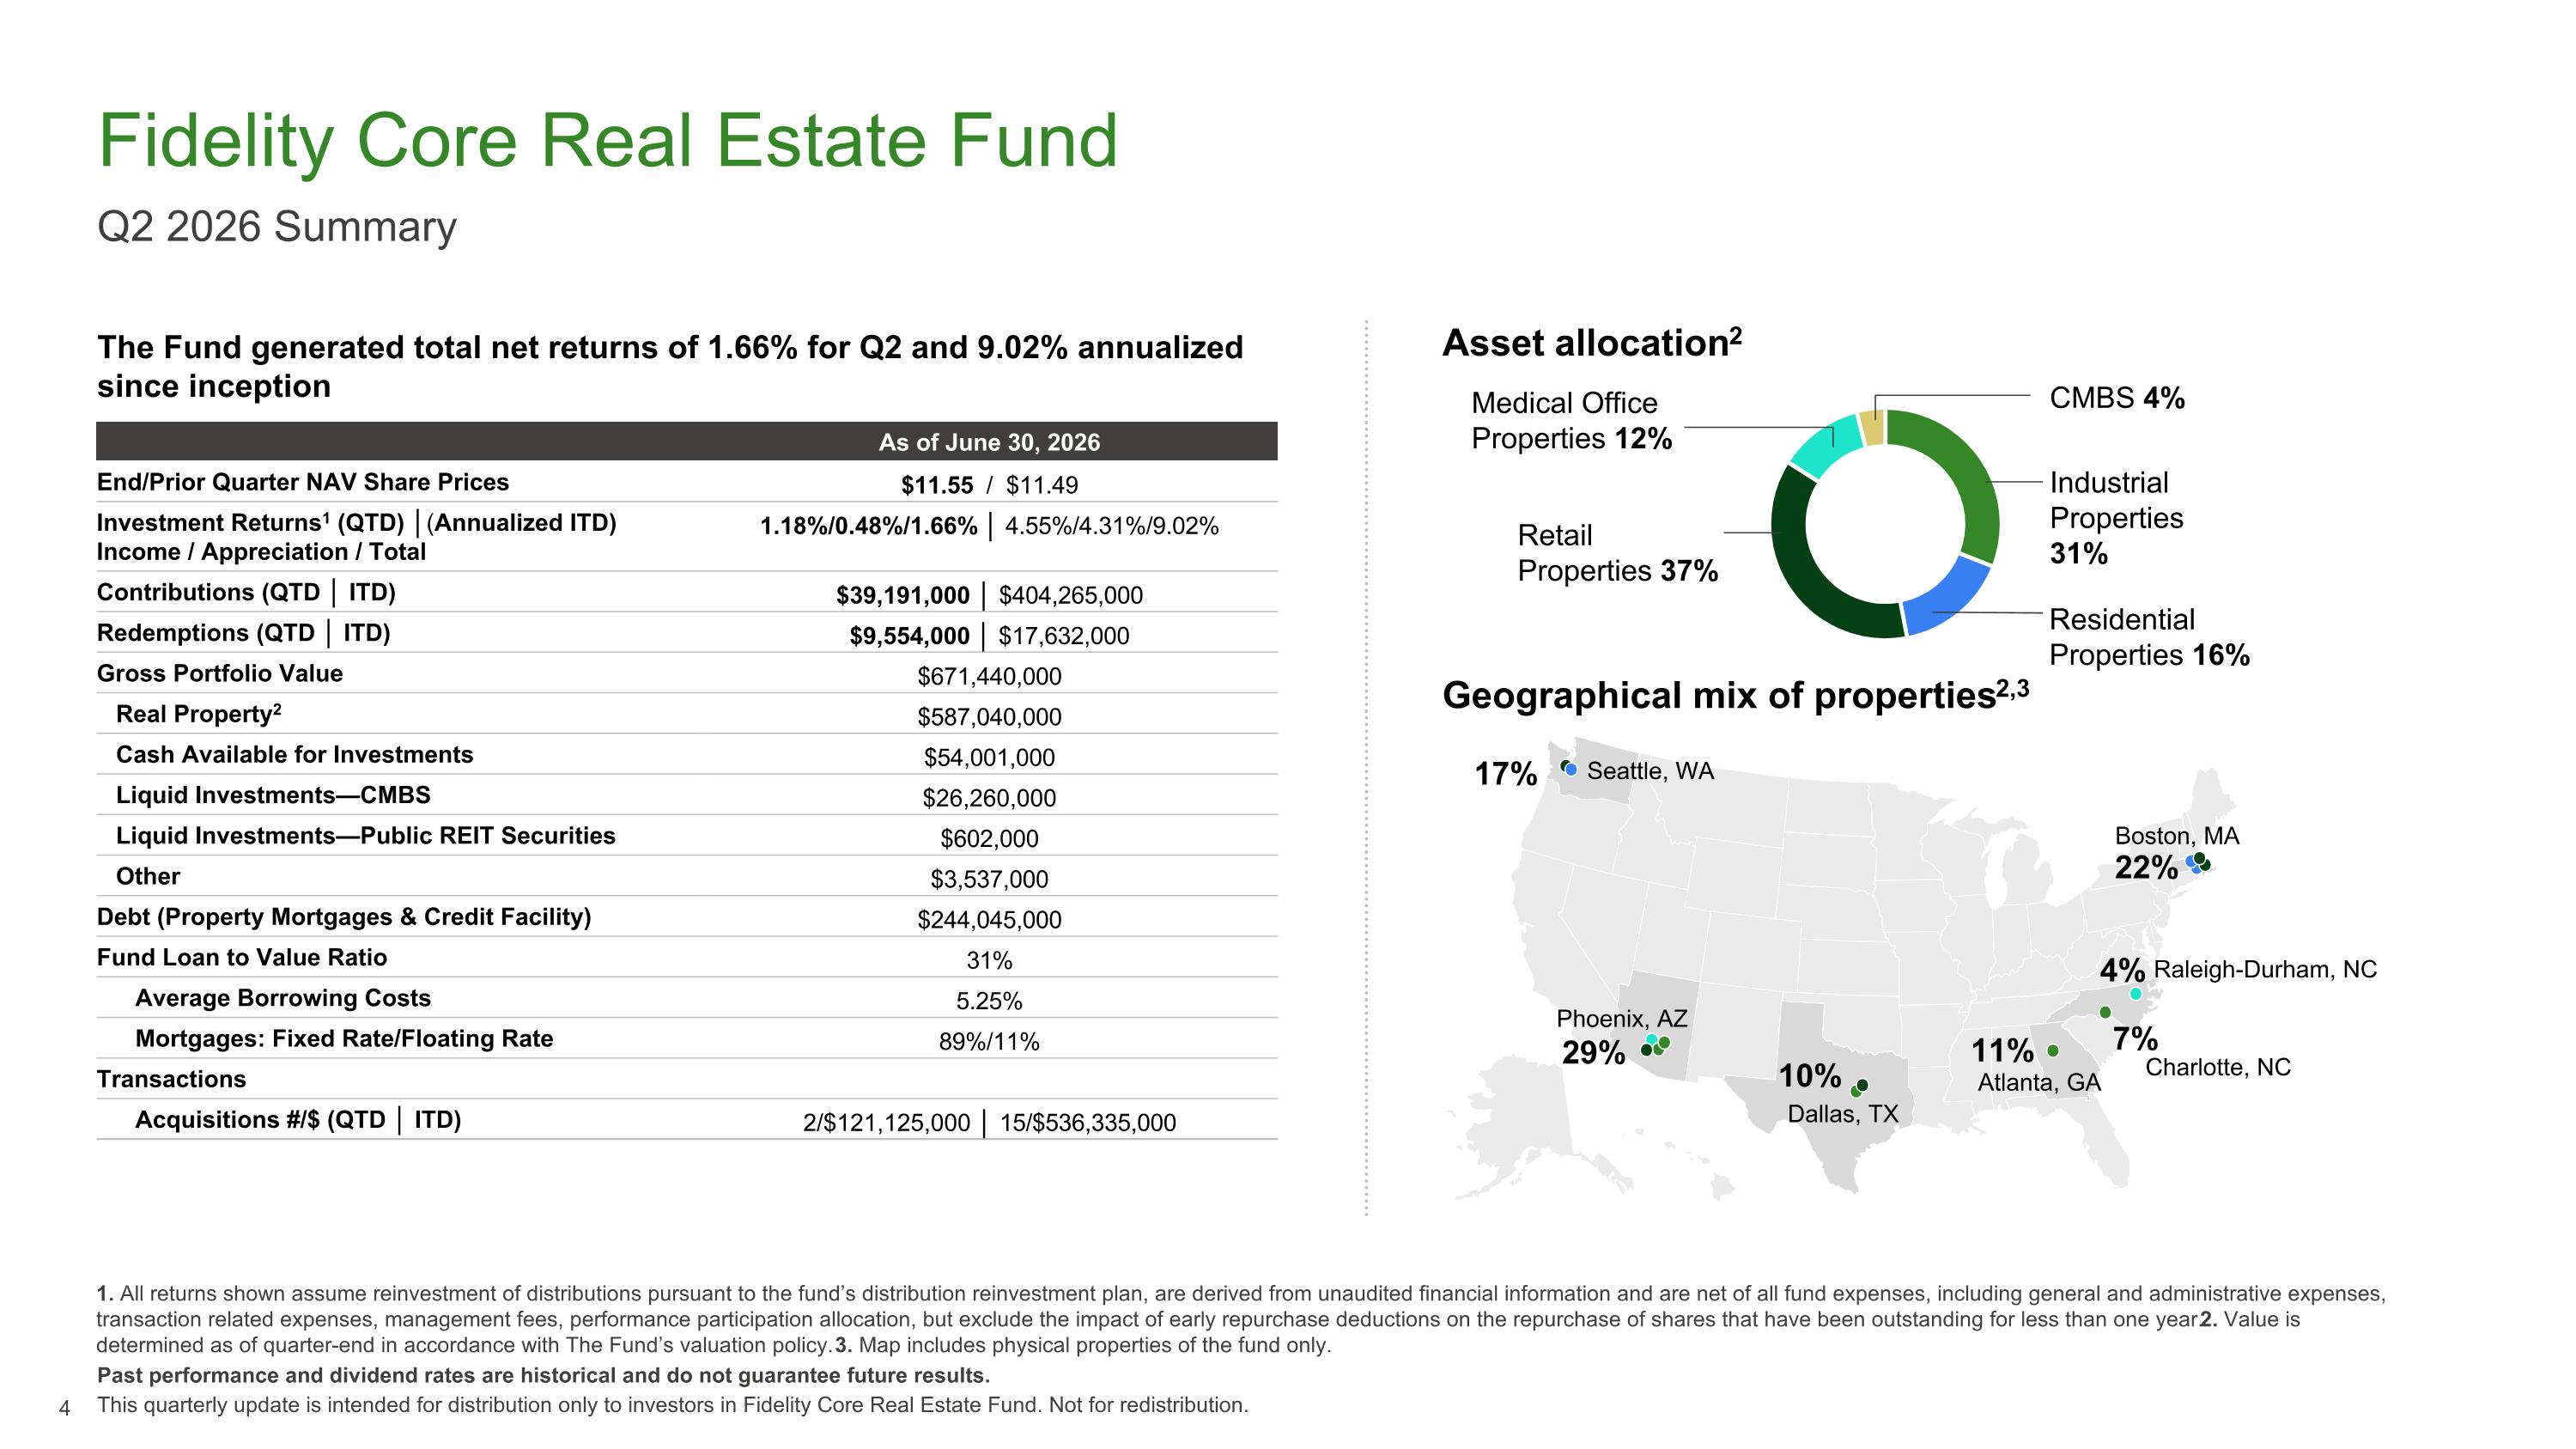
The Fund generated total net returns of 1.66% for Q2 and 9.02% annualized since inception Fidelity Core Real Estate Fund Q2 2026 Summary 1. All returns shown assume reinvestment of distributions pursuant to the fund’s distribution reinvestment plan, are derived from unaudited financial information and are net of all fund expenses, including general and administrative expenses, transaction related expenses, management fees, performance participation allocation, but exclude the impact of early repurchase deductions on the repurchase of shares that have been outstanding for less than one year. 2. Value is determined as of quarter-end in accordance with The Fund’s valuation policy. 3. Map includes physical properties of the fund only. As of June 30, 2026 End/Prior Quarter NAV Share Prices $11.55 / $11.49 Investment Returns1 (QTD) │(Annualized ITD) Income / Appreciation / Total 1.18%/0.48%/1.66% │ 4.55%/4.31%/9.02% Contributions (QTD │ ITD) $39,191,000 │ $404,265,000 Redemptions (QTD │ ITD) $9,554,000 │ $17,632,000 Gross Portfolio Value $671,440,000 Real Property2 $587,040,000 Cash Available for Investments $54,001,000 Liquid Investments—CMBS $26,260,000 Liquid Investments—Public REIT Securities $602,000 Other $3,537,000 Debt (Property Mortgages & Credit Facility) $244,045,000 Fund Loan to Value Ratio 31% Average Borrowing Costs 5.25% Mortgages: Fixed Rate/Floating Rate 89%/11% Transactions Acquisitions #/$ (QTD │ ITD) 2/$121,125,000 │ 15/$536,335,000 Industrial Properties 31% Medical Office Properties 12% Residential Properties 16% Asset allocation2 Past performance and dividend rates are historical and do not guarantee future results. This quarterly update is intended for distribution only to investors in Fidelity Core Real Estate Fund. Not for redistribution. Retail Properties 37% Geographical mix of properties2,3 CMBS 4% 17% Seattle, WA Phoenix, AZ Dallas, TX Boston, MA Atlanta, GA Raleigh-Durham, NC 22% 4% 10% 29% 11% Charlotte, NC 7%
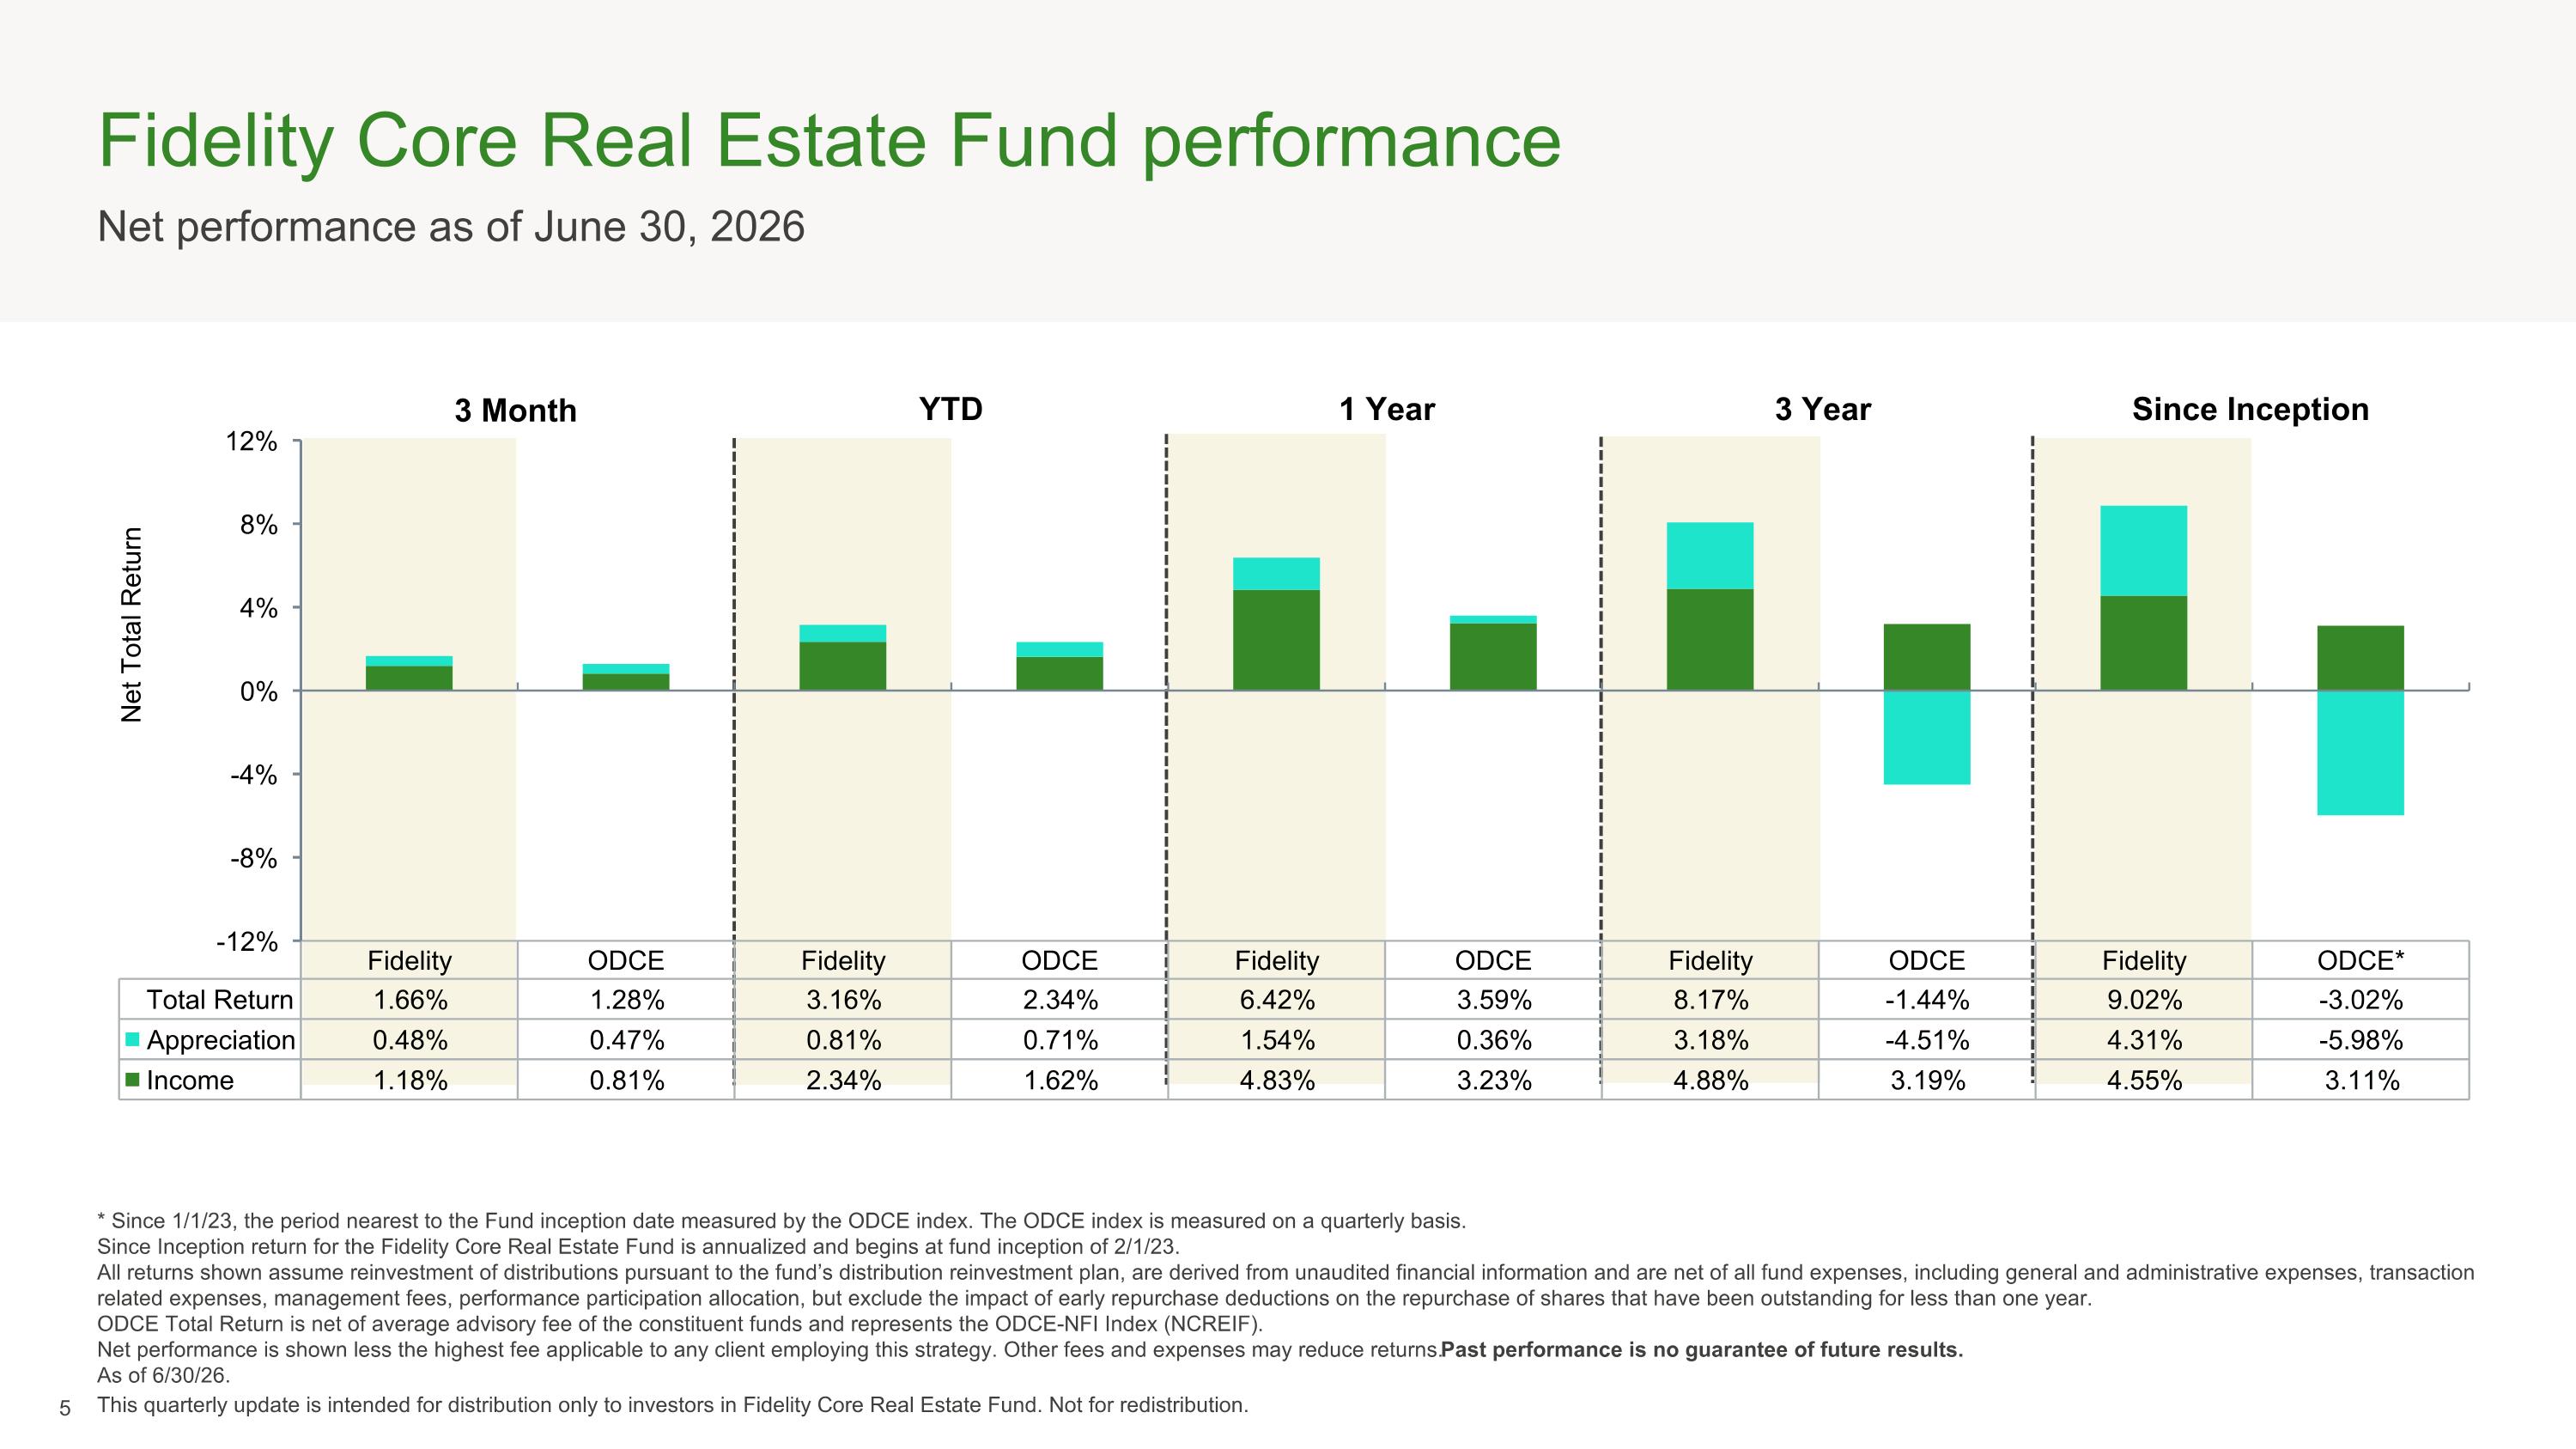
Fidelity Core Real Estate Fund performance Net performance as of June 30, 2026 * Since 1/1/23, the period nearest to the Fund inception date measured by the ODCE index. The ODCE index is measured on a quarterly basis. Since Inception return for the Fidelity Core Real Estate Fund is annualized and begins at fund inception of 2/1/23. All returns shown assume reinvestment of distributions pursuant to the fund’s distribution reinvestment plan, are derived from unaudited financial information and are net of all fund expenses, including general and administrative expenses, transaction related expenses, management fees, performance participation allocation, but exclude the impact of early repurchase deductions on the repurchase of shares that have been outstanding for less than one year. ODCE Total Return is net of average advisory fee of the constituent funds and represents the ODCE-NFI Index (NCREIF). Net performance is shown less the highest fee applicable to any client employing this strategy. Other fees and expenses may reduce returns. Past performance is no guarantee of future results. As of 6/30/26. This quarterly update is intended for distribution only to investors in Fidelity Core Real Estate Fund. Not for redistribution. 3 Month YTD 1 Year Since Inception 3 Year
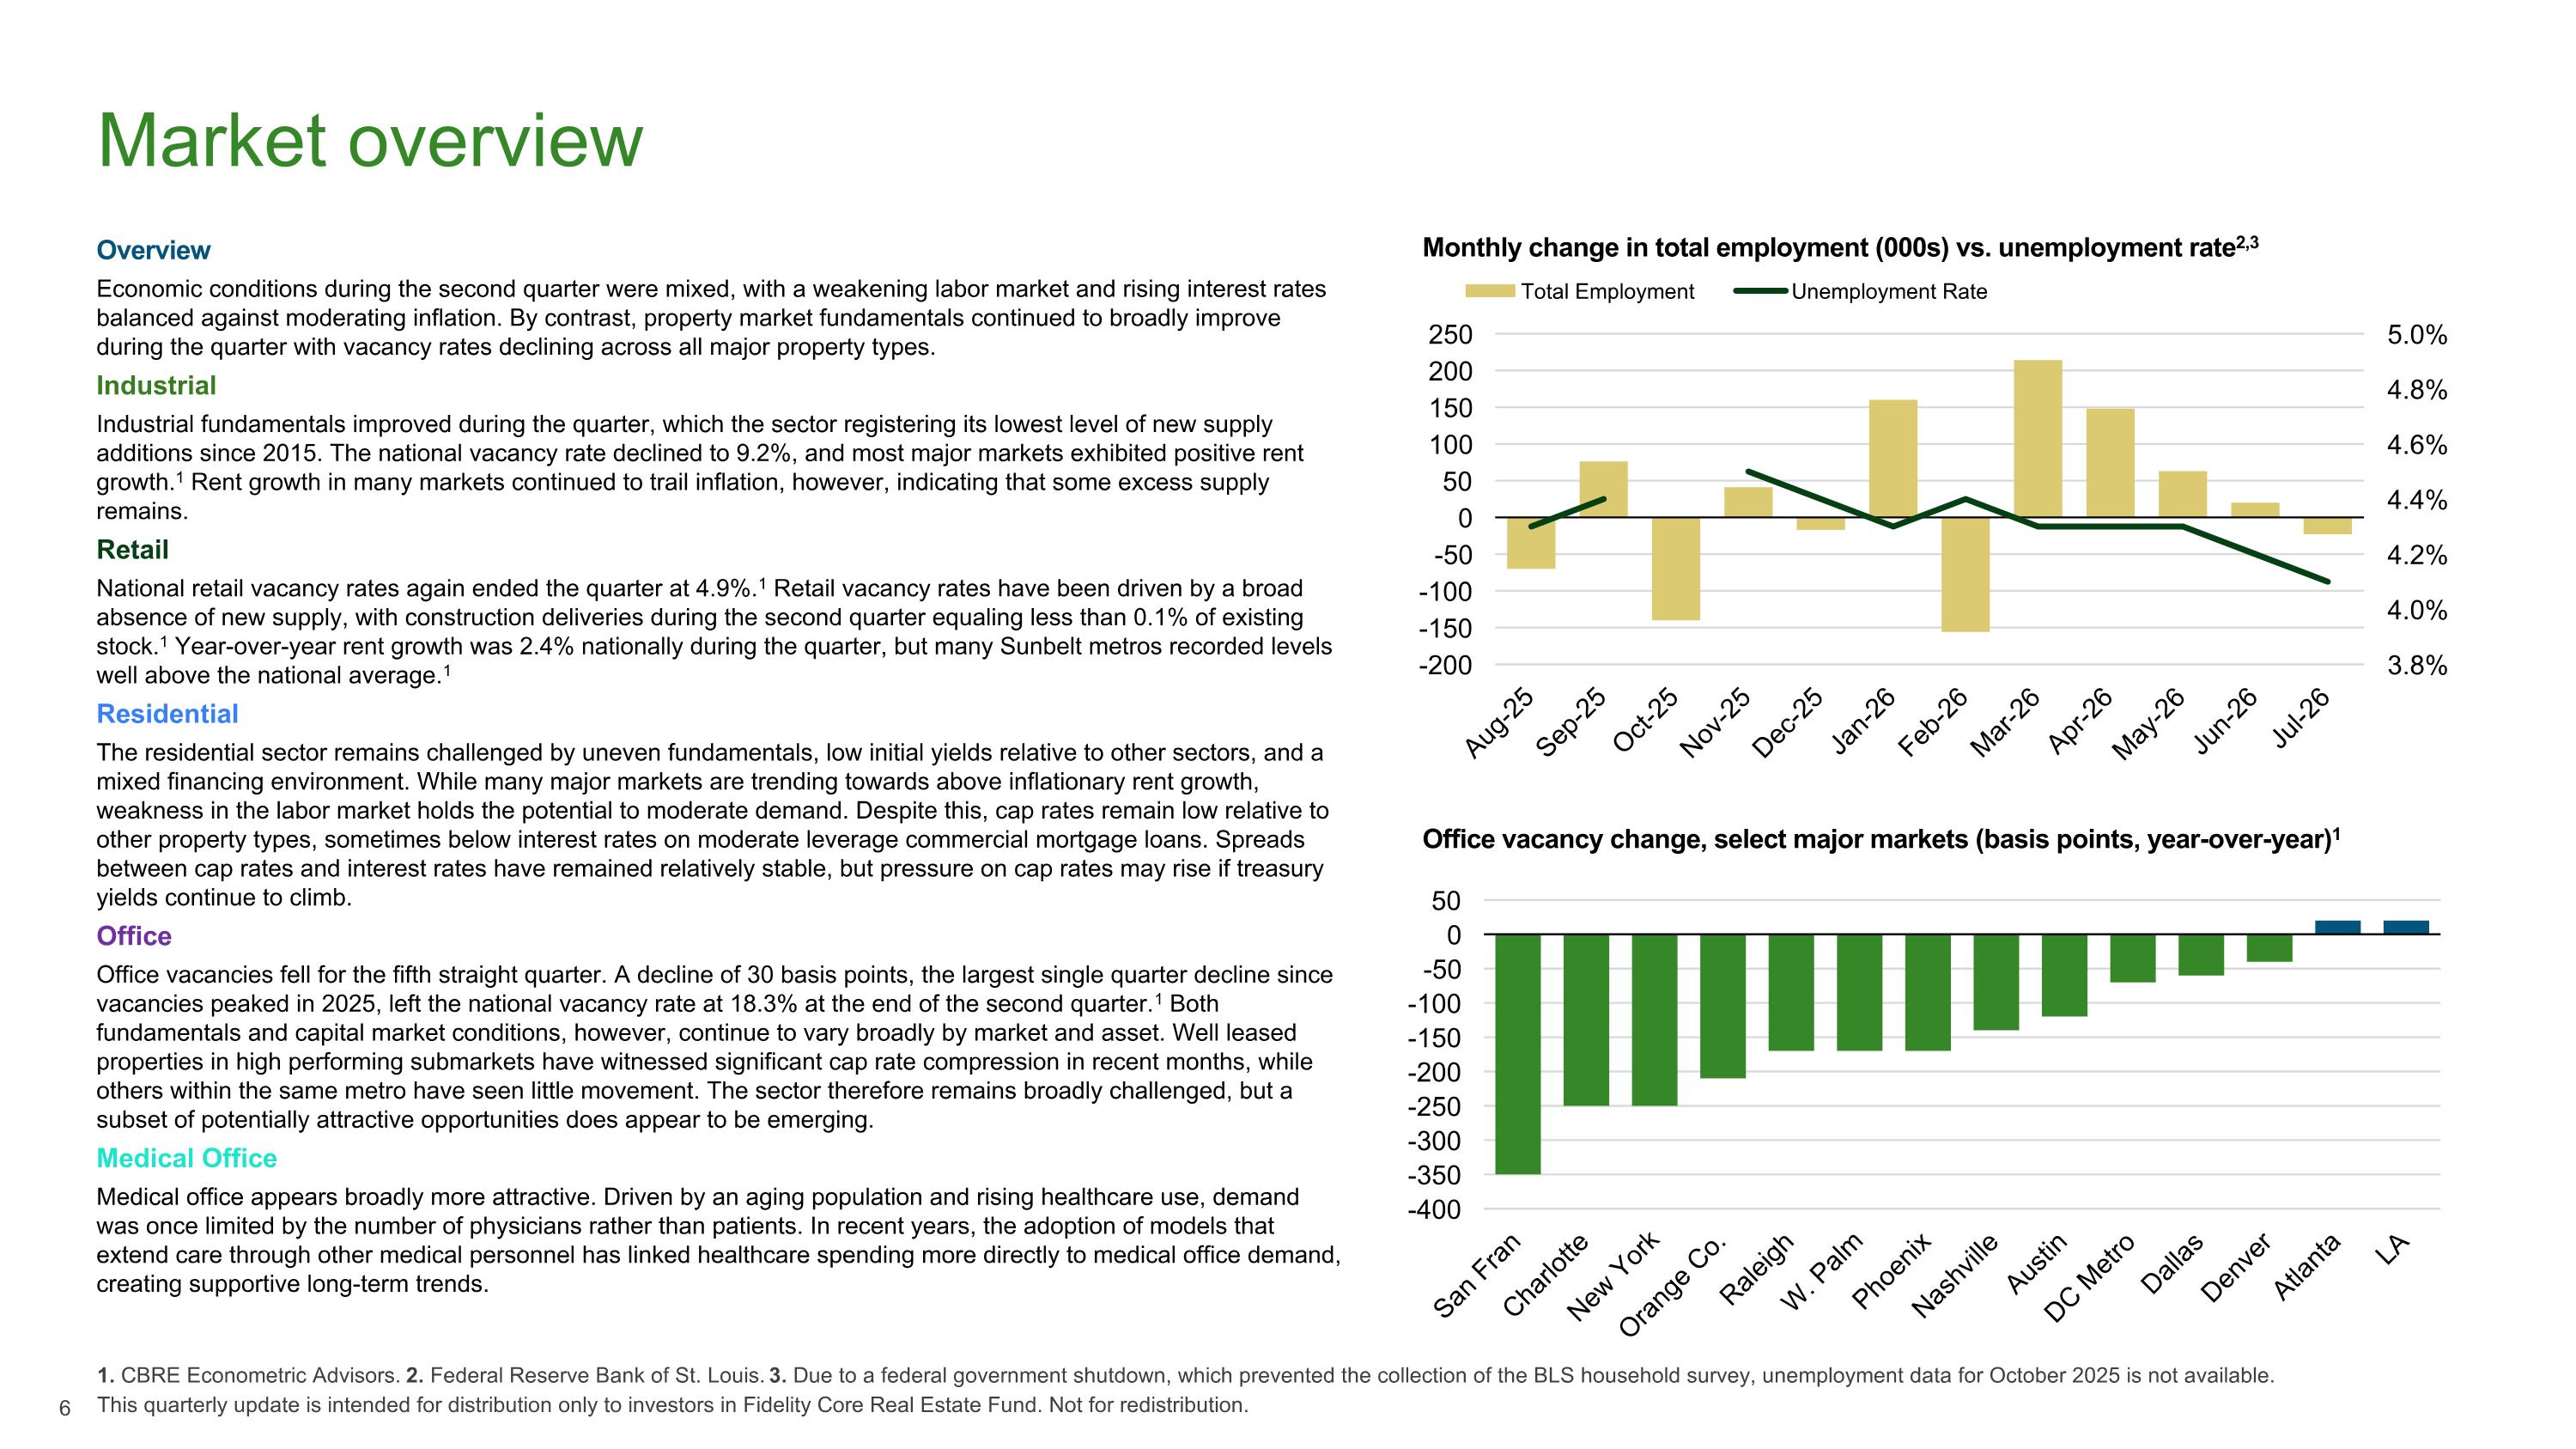
Overview Economic conditions during the second quarter were mixed, with a weakening labor market and rising interest rates balanced against moderating inflation. By contrast, property market fundamentals continued to broadly improve during the quarter with vacancy rates declining across all major property types. Industrial Industrial fundamentals improved during the quarter, which the sector registering its lowest level of new supply additions since 2015. The national vacancy rate declined to 9.2%, and most major markets exhibited positive rent growth.1 Rent growth in many markets continued to trail inflation, however, indicating that some excess supply remains. Retail National retail vacancy rates again ended the quarter at 4.9%.1 Retail vacancy rates have been driven by a broad absence of new supply, with construction deliveries during the second quarter equaling less than 0.1% of existing stock.1 Year-over-year rent growth was 2.4% nationally during the quarter, but many Sunbelt metros recorded levels well above the national average.1 Residential The residential sector remains challenged by uneven fundamentals, low initial yields relative to other sectors, and a mixed financing environment. While many major markets are trending towards above inflationary rent growth, weakness in the labor market holds the potential to moderate demand. Despite this, cap rates remain low relative to other property types, sometimes below interest rates on moderate leverage commercial mortgage loans. Spreads between cap rates and interest rates have remained relatively stable, but pressure on cap rates may rise if treasury yields continue to climb. Office Office vacancies fell for the fifth straight quarter. A decline of 30 basis points, the largest single quarter decline since vacancies peaked in 2025, left the national vacancy rate at 18.3% at the end of the second quarter.1 Both fundamentals and capital market conditions, however, continue to vary broadly by market and asset. Well leased properties in high performing submarkets have witnessed significant cap rate compression in recent months, while others within the same metro have seen little movement. The sector therefore remains broadly challenged, but a subset of potentially attractive opportunities does appear to be emerging. Medical Office Medical office appears broadly more attractive. Driven by an aging population and rising healthcare use, demand was once limited by the number of physicians rather than patients. In recent years, the adoption of models that extend care through other medical personnel has linked healthcare spending more directly to medical office demand, creating supportive long-term trends. Market overview 1. CBRE Econometric Advisors. 2. Federal Reserve Bank of St. Louis. 3. Due to a federal government shutdown, which prevented the collection of the BLS household survey, unemployment data for October 2025 is not available. Monthly change in total employment (000s) vs. unemployment rate2,3 Office vacancy change, select major markets (basis points, year-over-year)1 This quarterly update is intended for distribution only to investors in Fidelity Core Real Estate Fund. Not for redistribution.
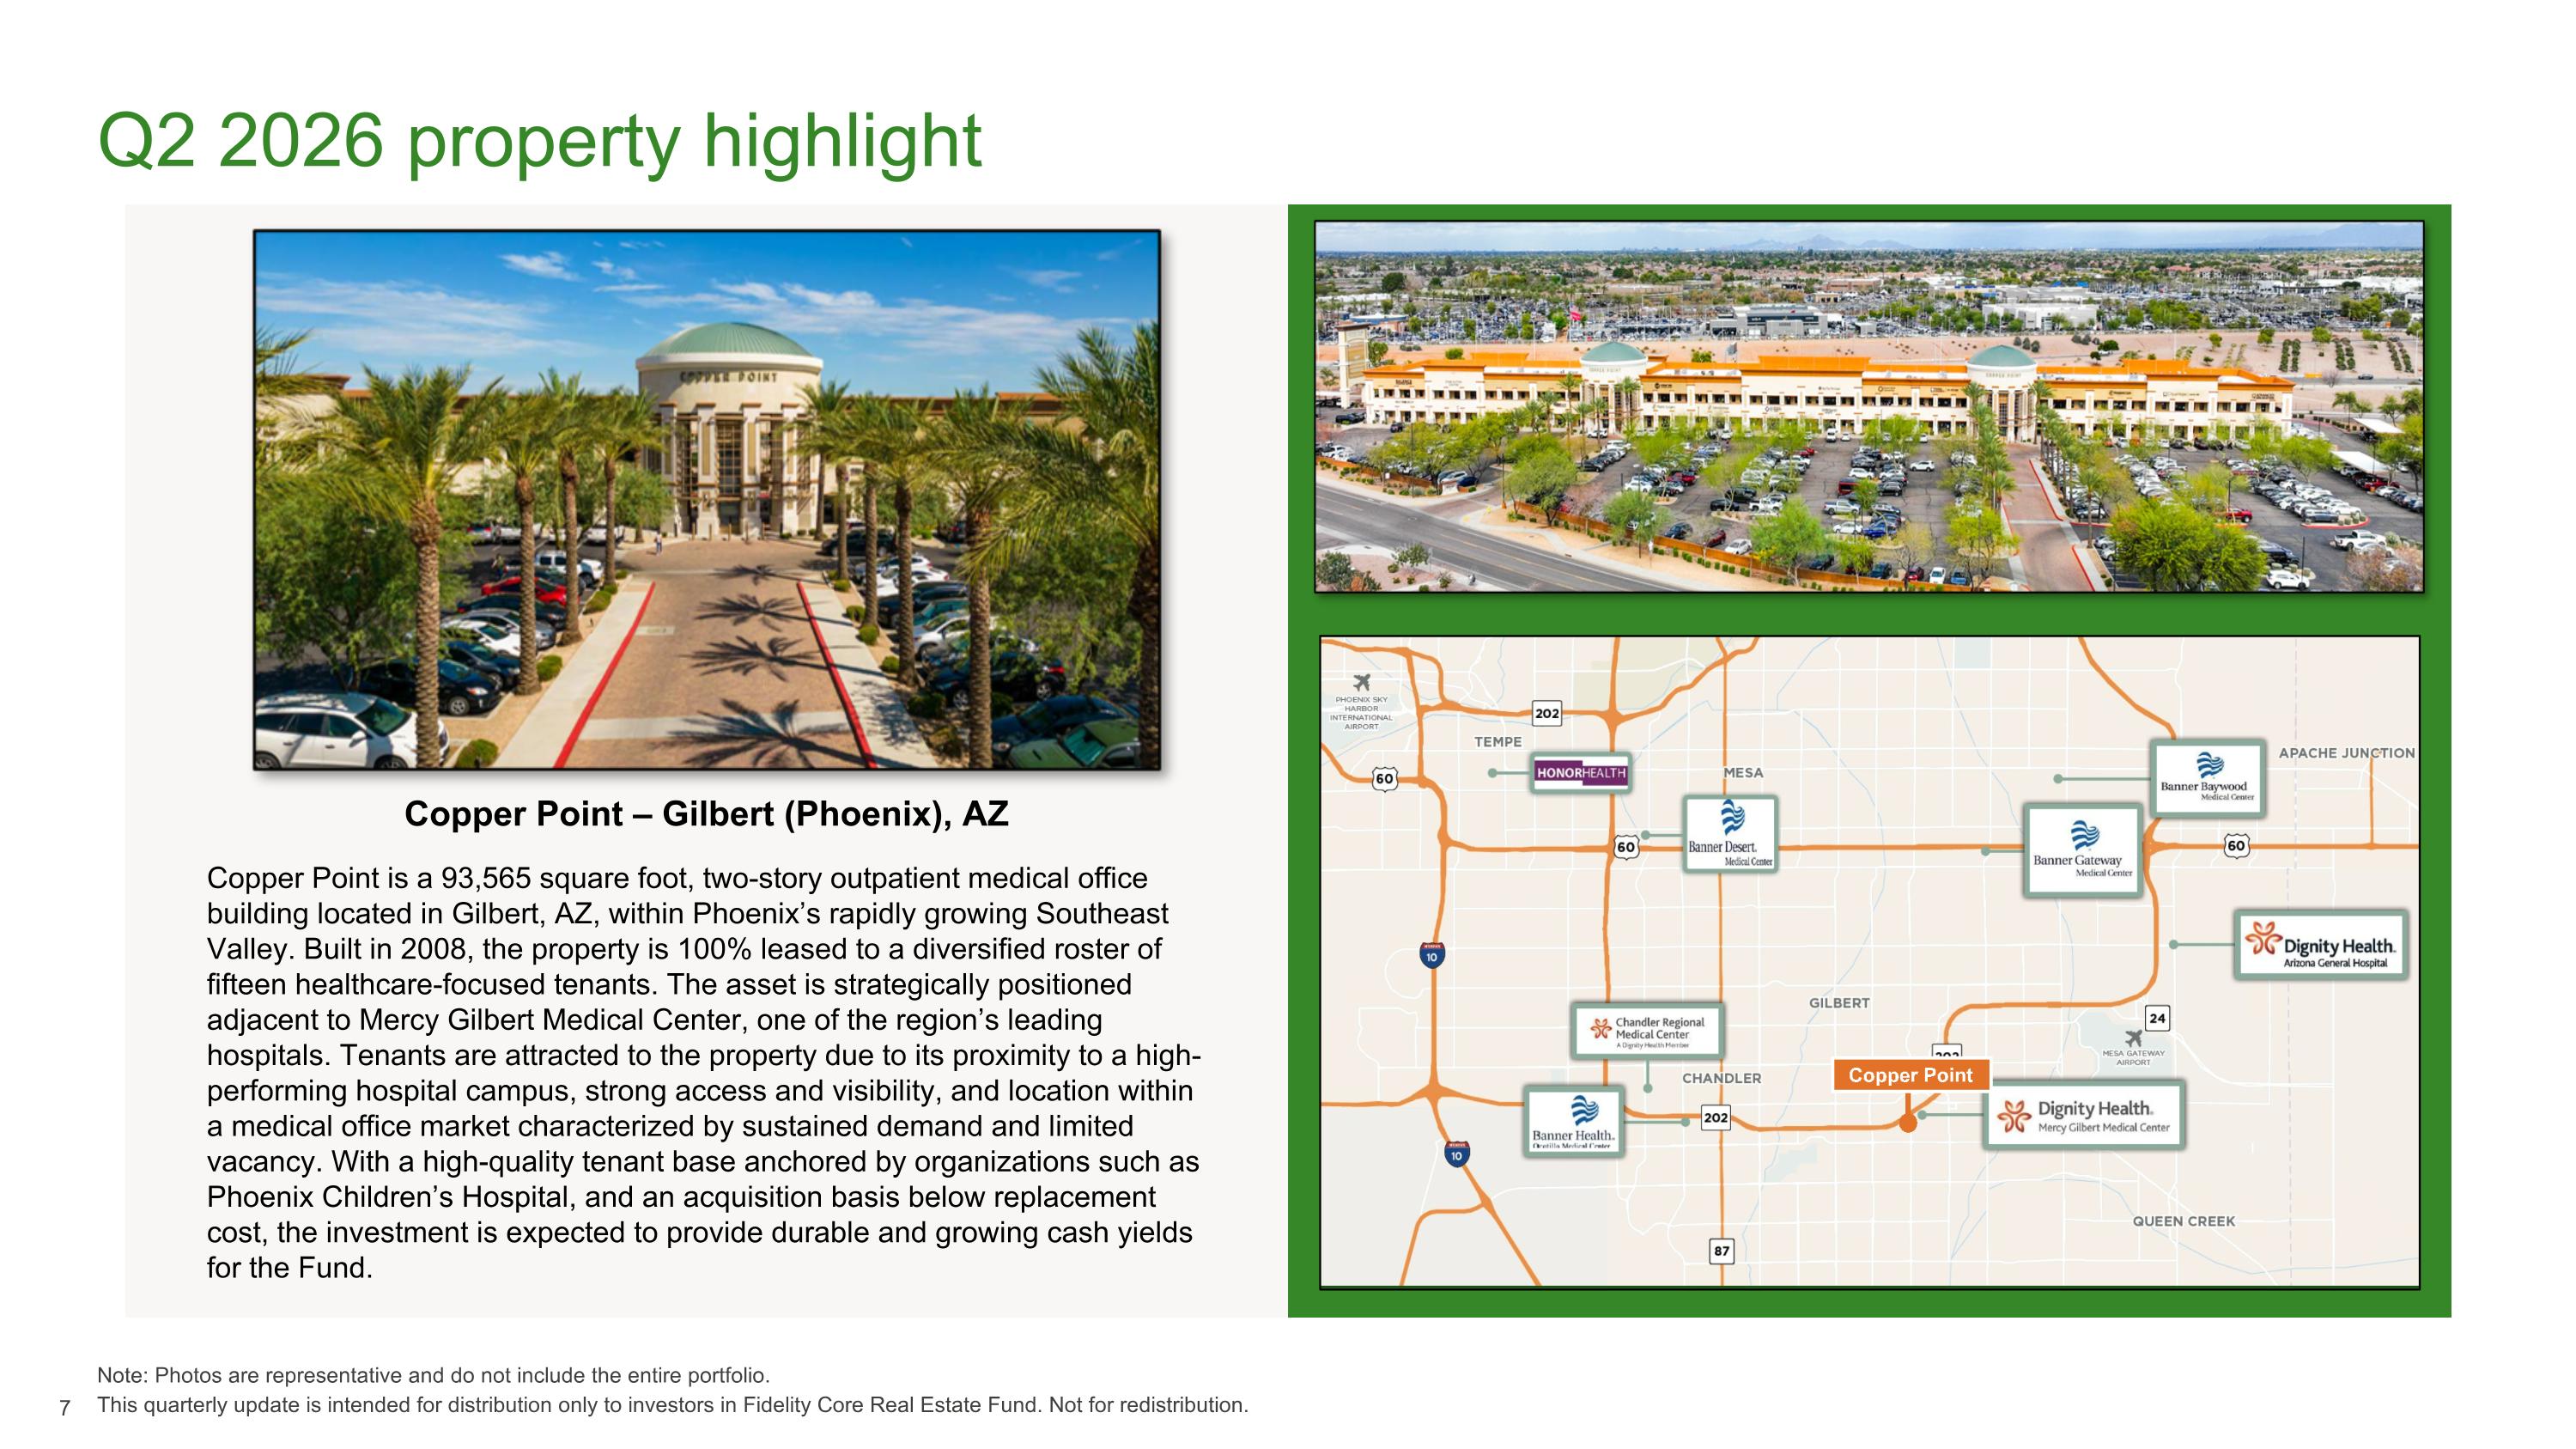
Q2 2026 property highlight This quarterly update is intended for distribution only to investors in Fidelity Core Real Estate Fund. Not for redistribution. Note: Photos are representative and do not include the entire portfolio. Copper Point – Gilbert (Phoenix), AZ Copper Point is a 93,565 square foot, two-story outpatient medical office building located in Gilbert, AZ, within Phoenix’s rapidly growing Southeast Valley. Built in 2008, the property is 100% leased to a diversified roster of fifteen healthcare-focused tenants. The asset is strategically positioned adjacent to Mercy Gilbert Medical Center, one of the region’s leading hospitals. Tenants are attracted to the property due to its proximity to a high-performing hospital campus, strong access and visibility, and location within a medical office market characterized by sustained demand and limited vacancy. With a high-quality tenant base anchored by organizations such as Phoenix Children’s Hospital, and an acquisition basis below replacement cost, the investment is expected to provide durable and growing cash yields for the Fund.
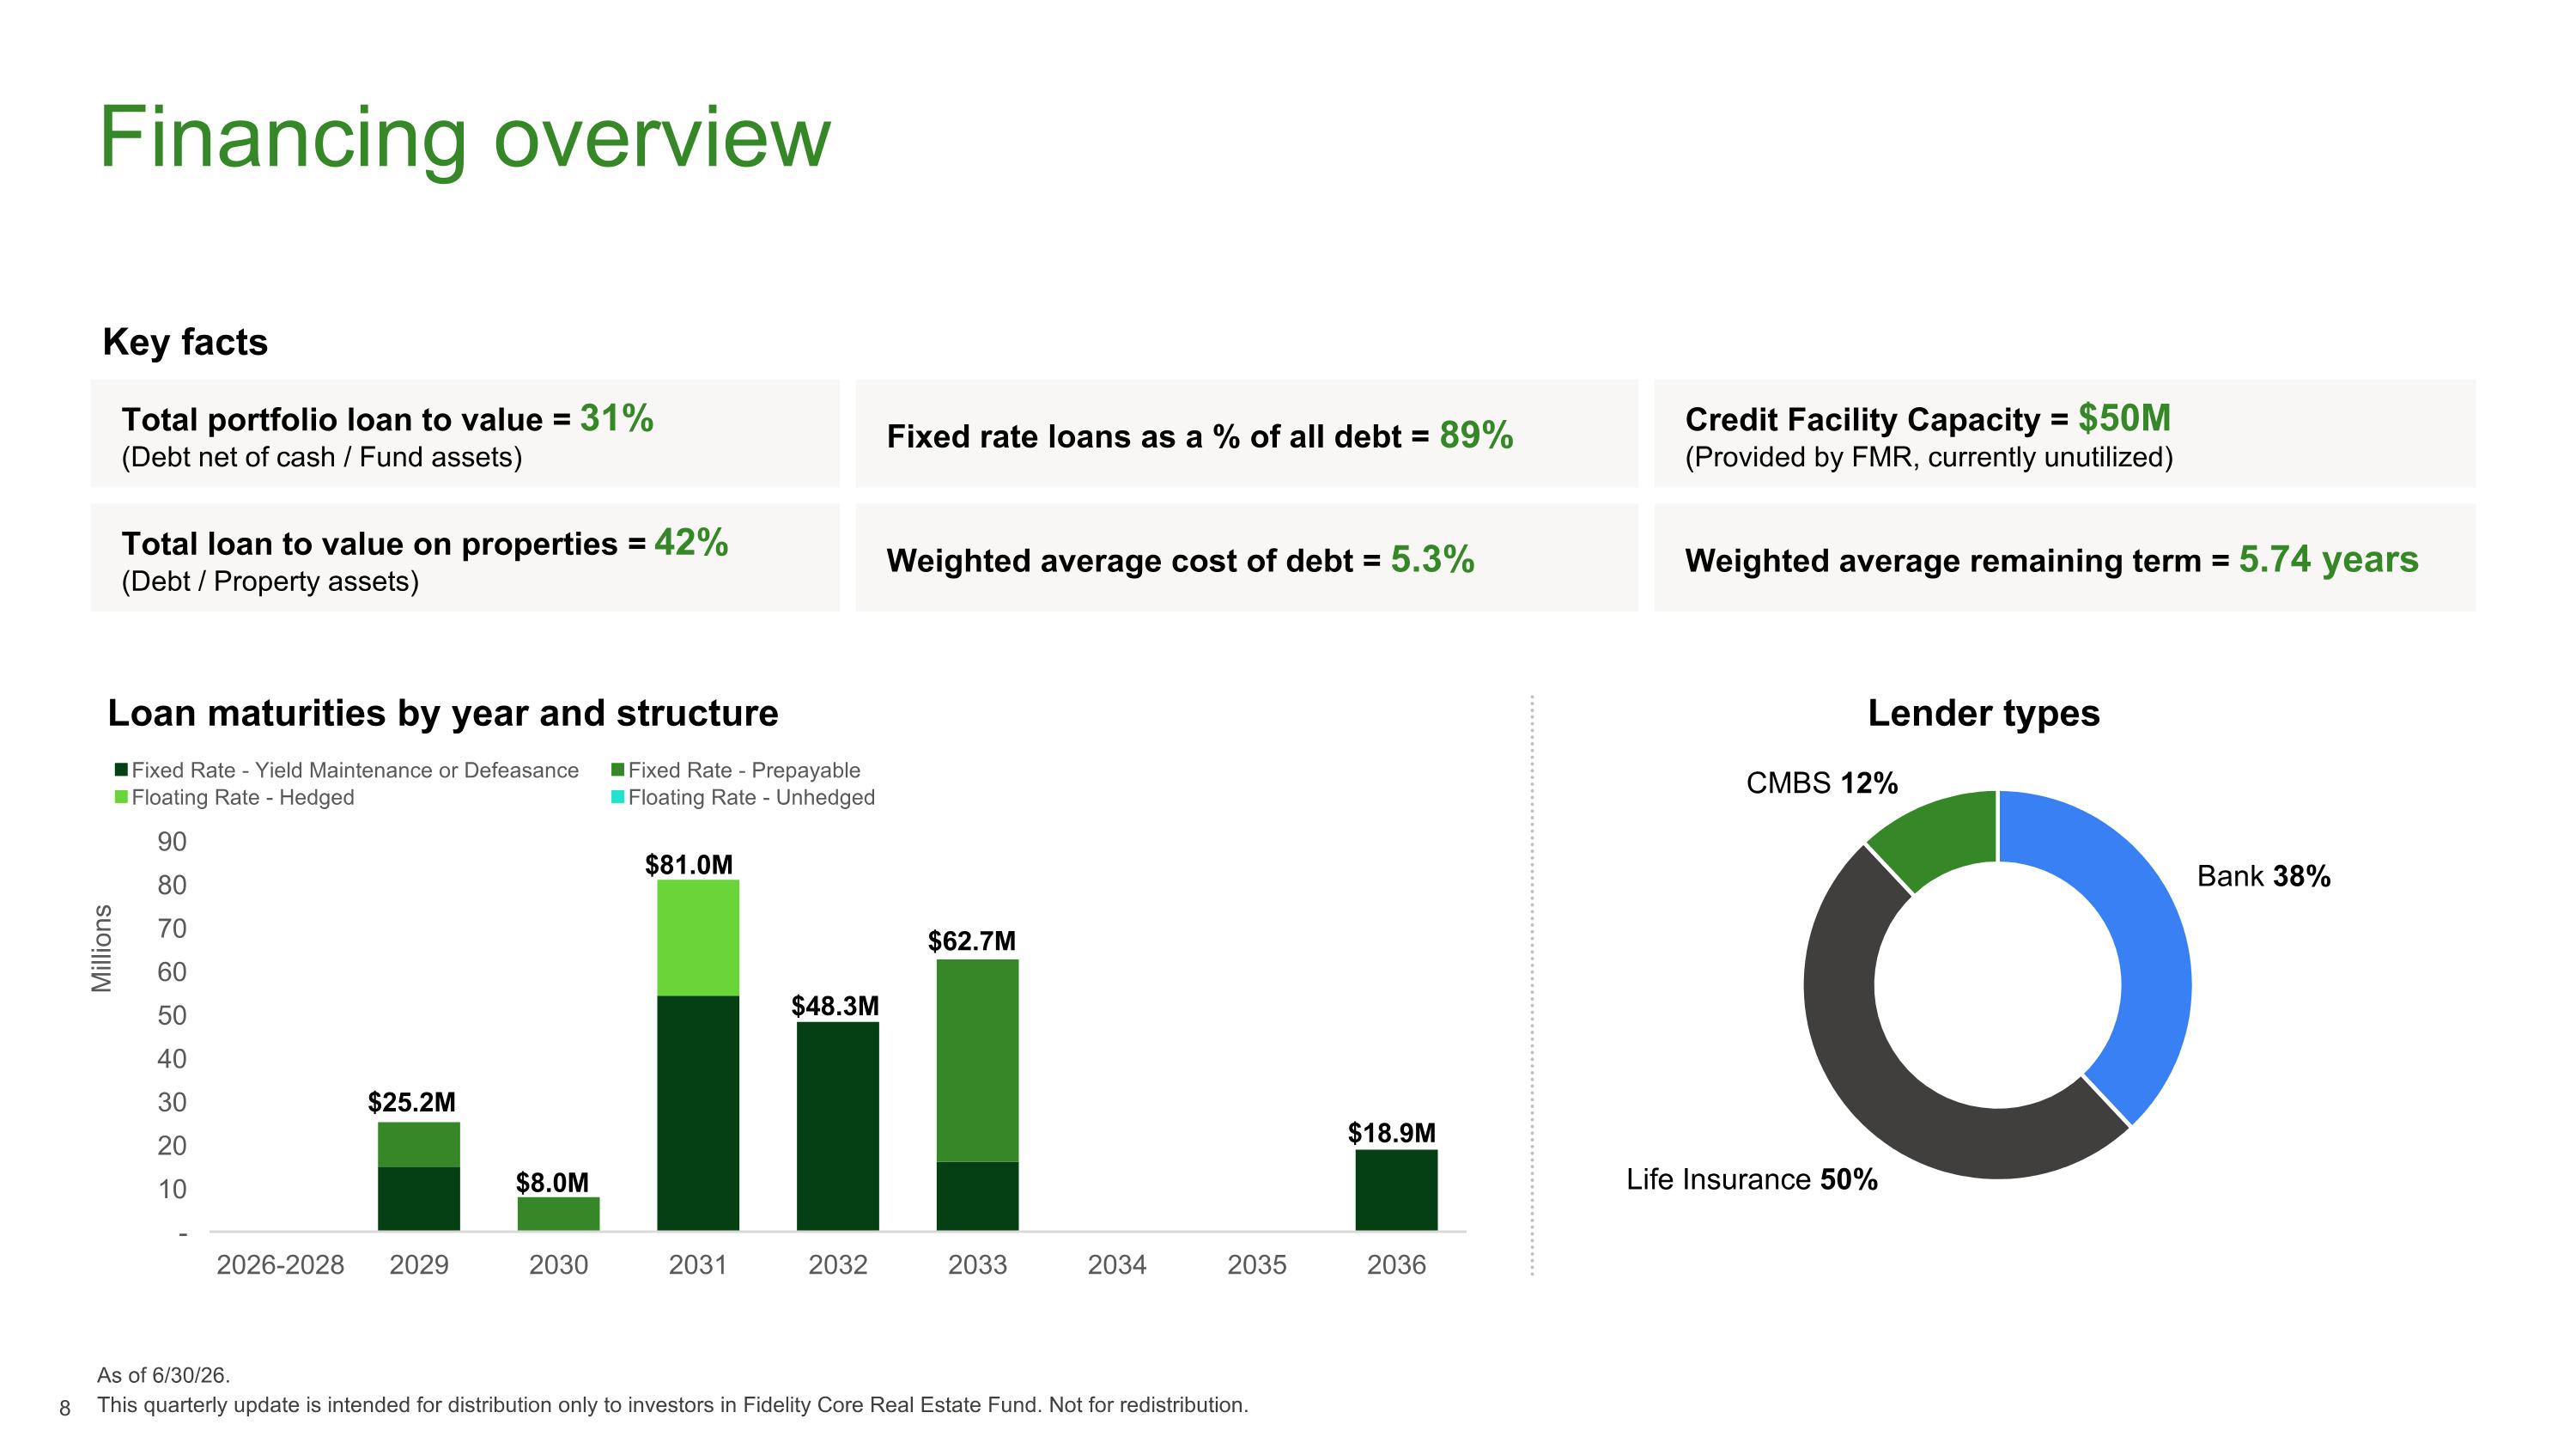
Financing overview This quarterly update is intended for distribution only to investors in Fidelity Core Real Estate Fund. Not for redistribution. Total portfolio loan to value = 31% (Debt net of cash / Fund assets) Fixed rate loans as a % of all debt = 89% Credit Facility Capacity = $50M (Provided by FMR, currently unutilized) Total loan to value on properties = 42% (Debt / Property assets) Weighted average cost of debt = 5.3% Weighted average remaining term = 5.74 years Key facts Lender types Loan maturities by year and structure CMBS 12% Life Insurance 50% Bank 38% $25.2M $8.0M $81.0M $18.9M $48.3M $62.7M As of 6/30/26.
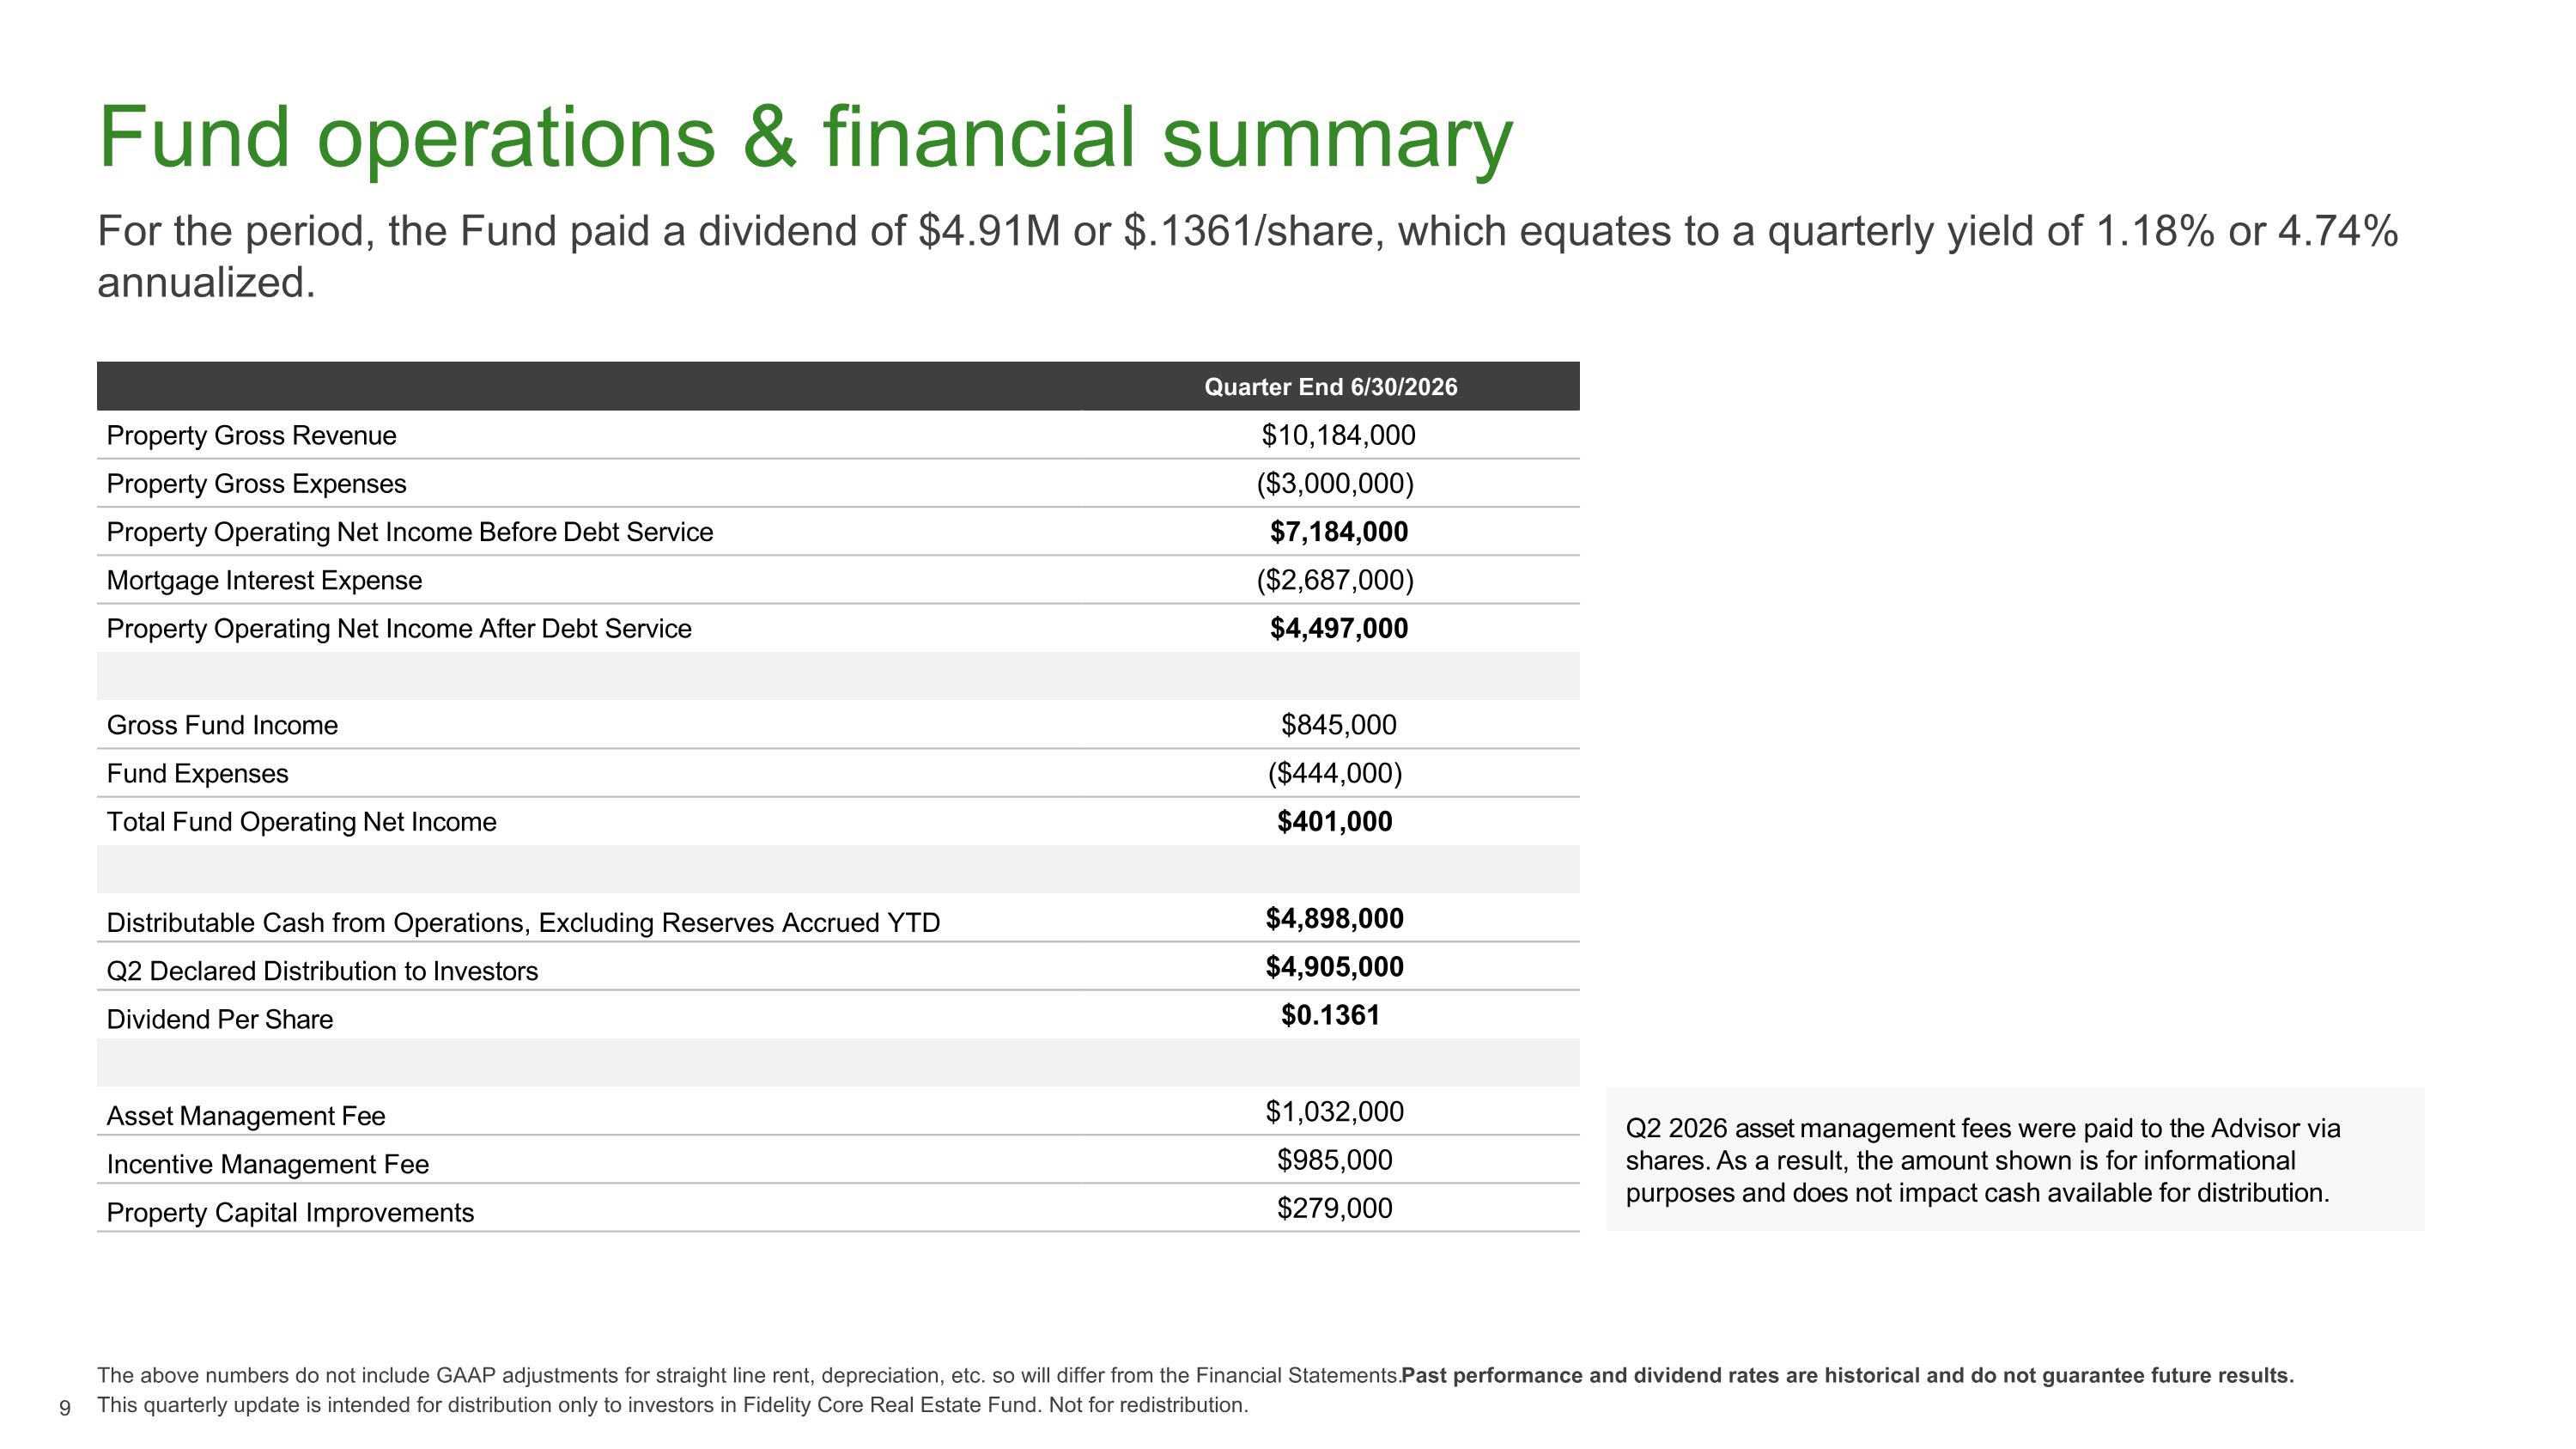
Fund operations & financial summary For the period, the Fund paid a dividend of $4.91M or $.1361/share, which equates to a quarterly yield of 1.18% or 4.74% annualized. The above numbers do not include GAAP adjustments for straight line rent, depreciation, etc. so will differ from the Financial Statements. Past performance and dividend rates are historical and do not guarantee future results. Q2 2026 asset management fees were paid to the Advisor via shares. As a result, the amount shown is for informational purposes and does not impact cash available for distribution. Quarter End 6/30/2026 Property Gross Revenue $10,184,000 Property Gross Expenses ($3,000,000) Property Operating Net Income Before Debt Service $7,184,000 Mortgage Interest Expense ($2,687,000) Property Operating Net Income After Debt Service $4,497,000 Gross Fund Income $845,000 Fund Expenses ($444,000) Total Fund Operating Net Income $401,000 Distributable Cash from Operations, Excluding Reserves Accrued YTD $4,898,000 Q2 Declared Distribution to Investors $4,905,000 Dividend Per Share $0.1361 Asset Management Fee $1,032,000 Incentive Management Fee $985,000 Property Capital Improvements $279,000 This quarterly update is intended for distribution only to investors in Fidelity Core Real Estate Fund. Not for redistribution.

Special Topic: Medical Office This quarterly update is intended for distribution only to investors in Fidelity Core Real Estate Fund. Not for redistribution.
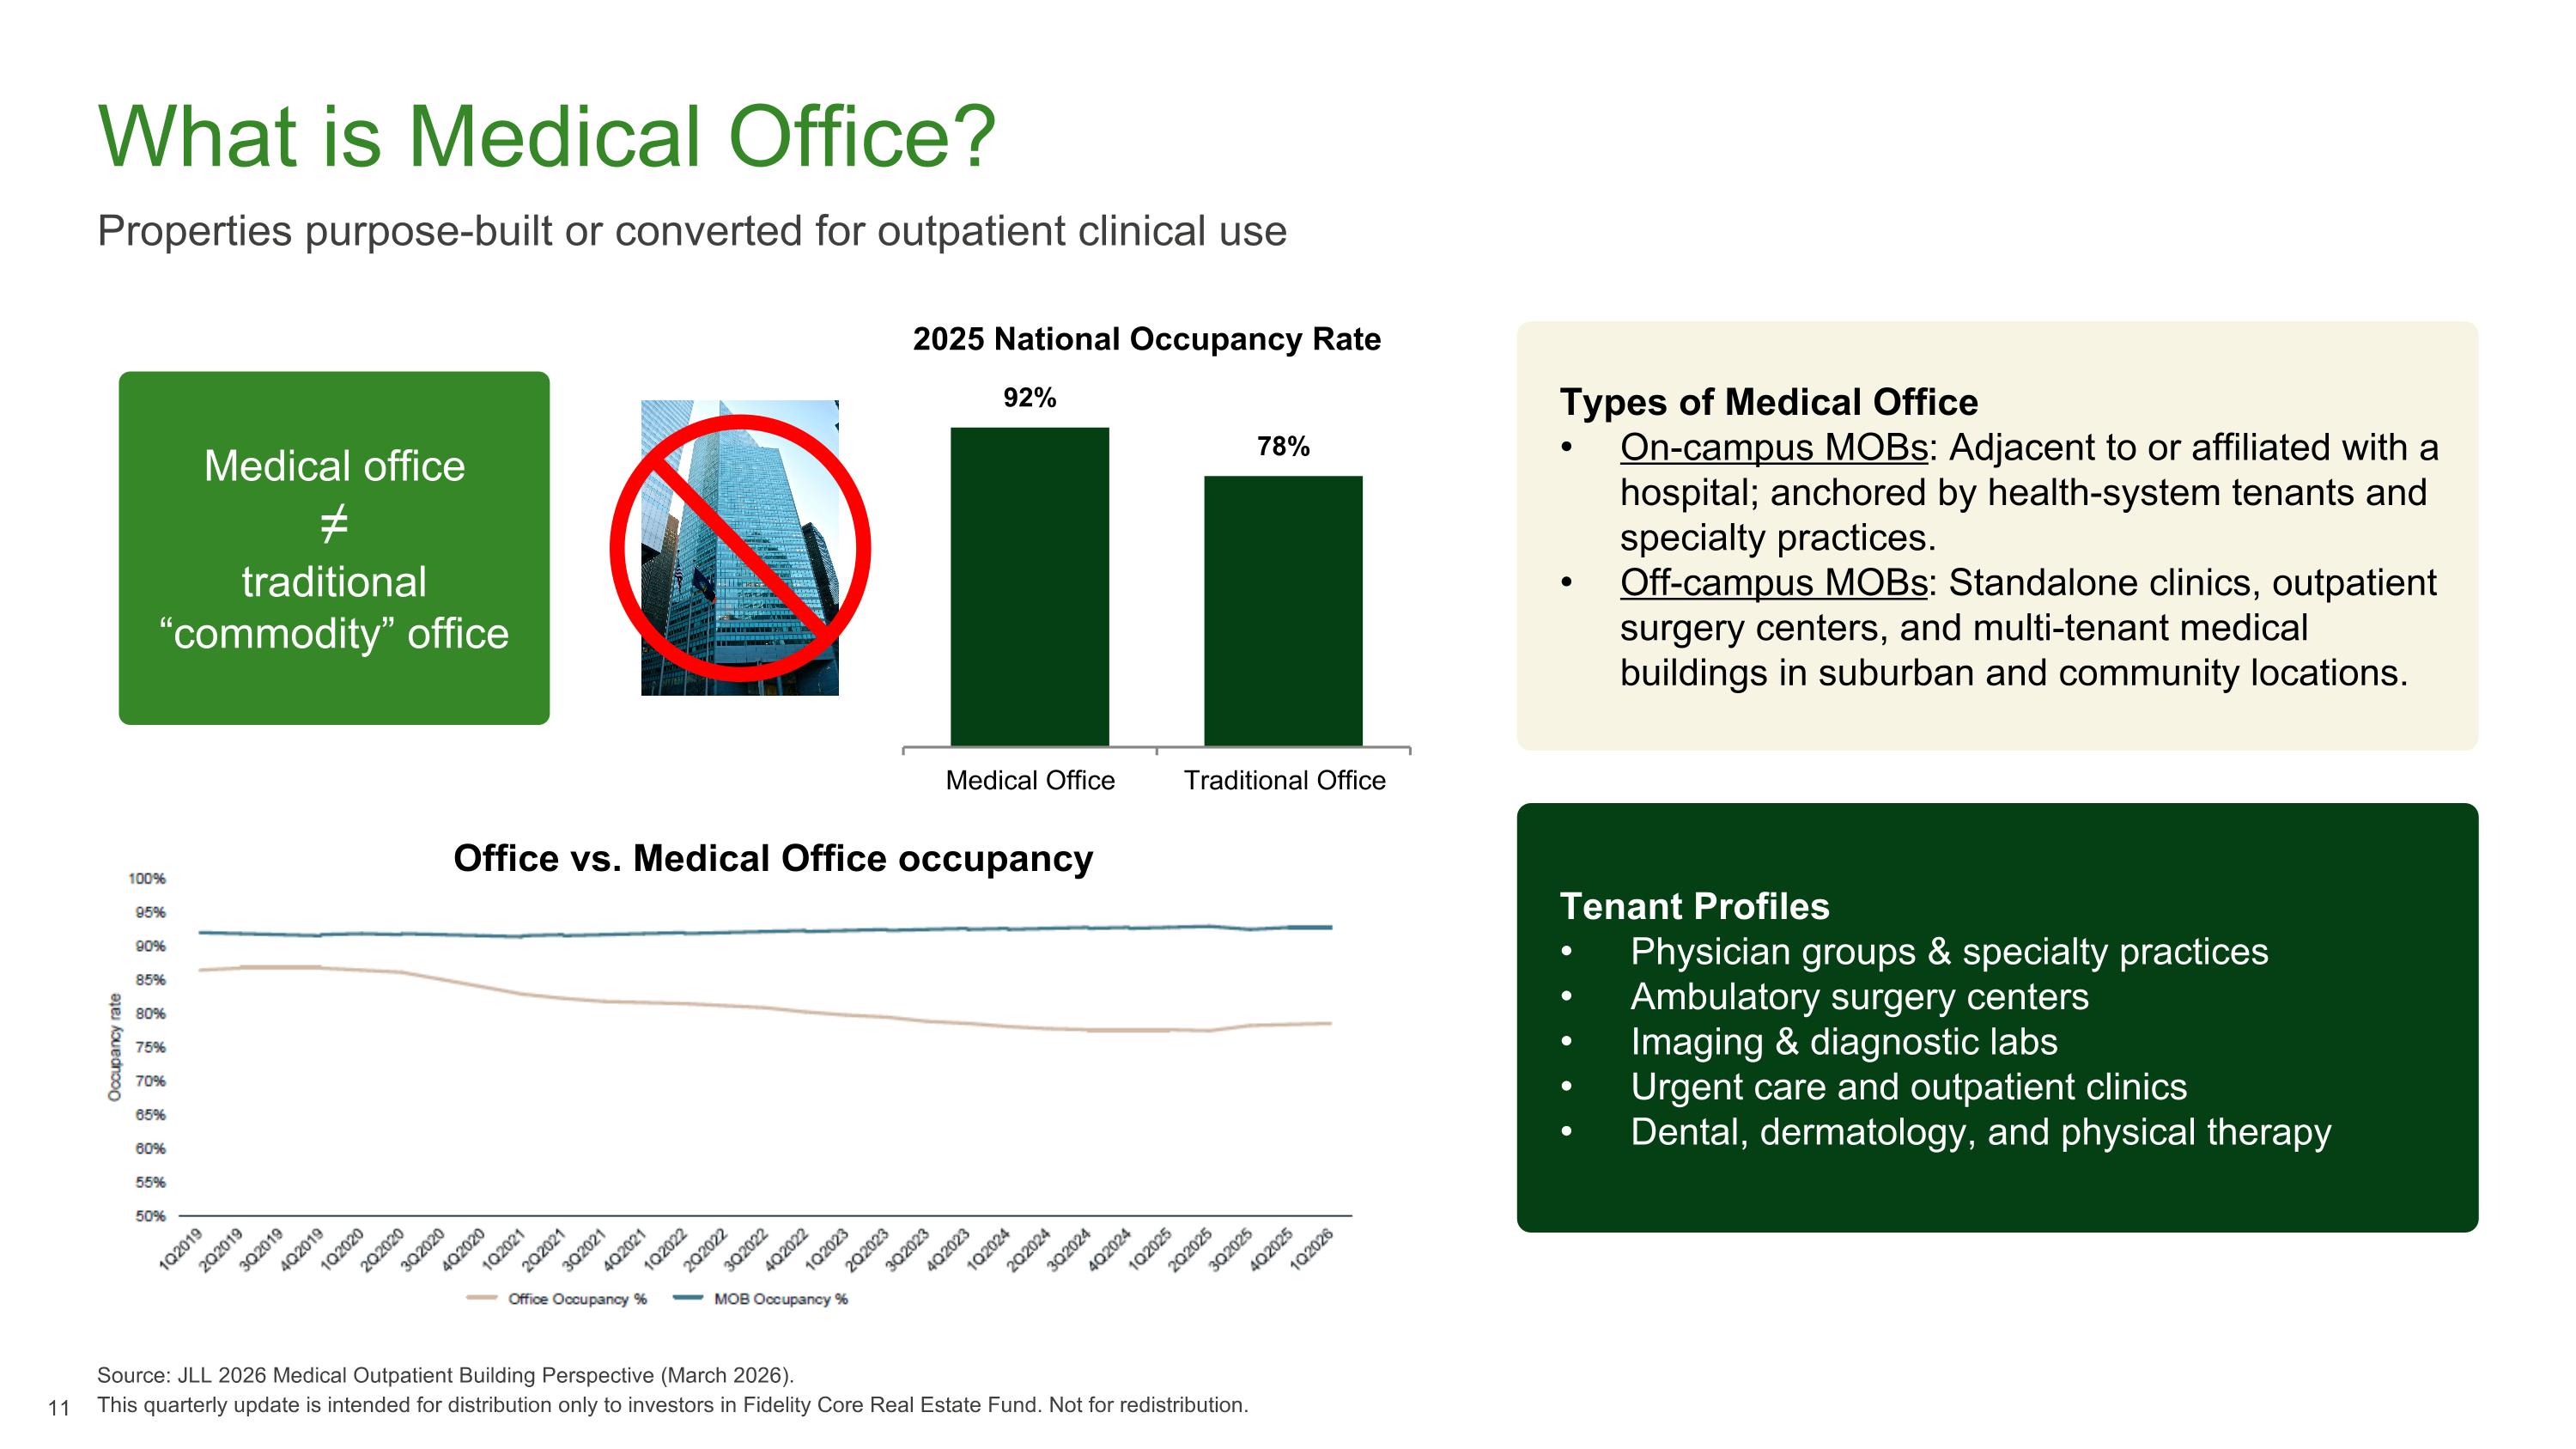
What is Medical Office? Properties purpose-built or converted for outpatient clinical use Source: JLL 2026 Medical Outpatient Building Perspective (March 2026). This quarterly update is intended for distribution only to investors in Fidelity Core Real Estate Fund. Not for redistribution. Tenant Profiles Physician groups & specialty practices Ambulatory surgery centers Imaging & diagnostic labs Urgent care and outpatient clinics Dental, dermatology, and physical therapy Types of Medical Office On-campus MOBs: Adjacent to or affiliated with a hospital; anchored by health-system tenants and specialty practices. Off-campus MOBs: Standalone clinics, outpatient surgery centers, and multi-tenant medical buildings in suburban and community locations. Office vs. Medical Office occupancy 2025 National Occupancy Rate Medical office ≠ traditional “commodity” office
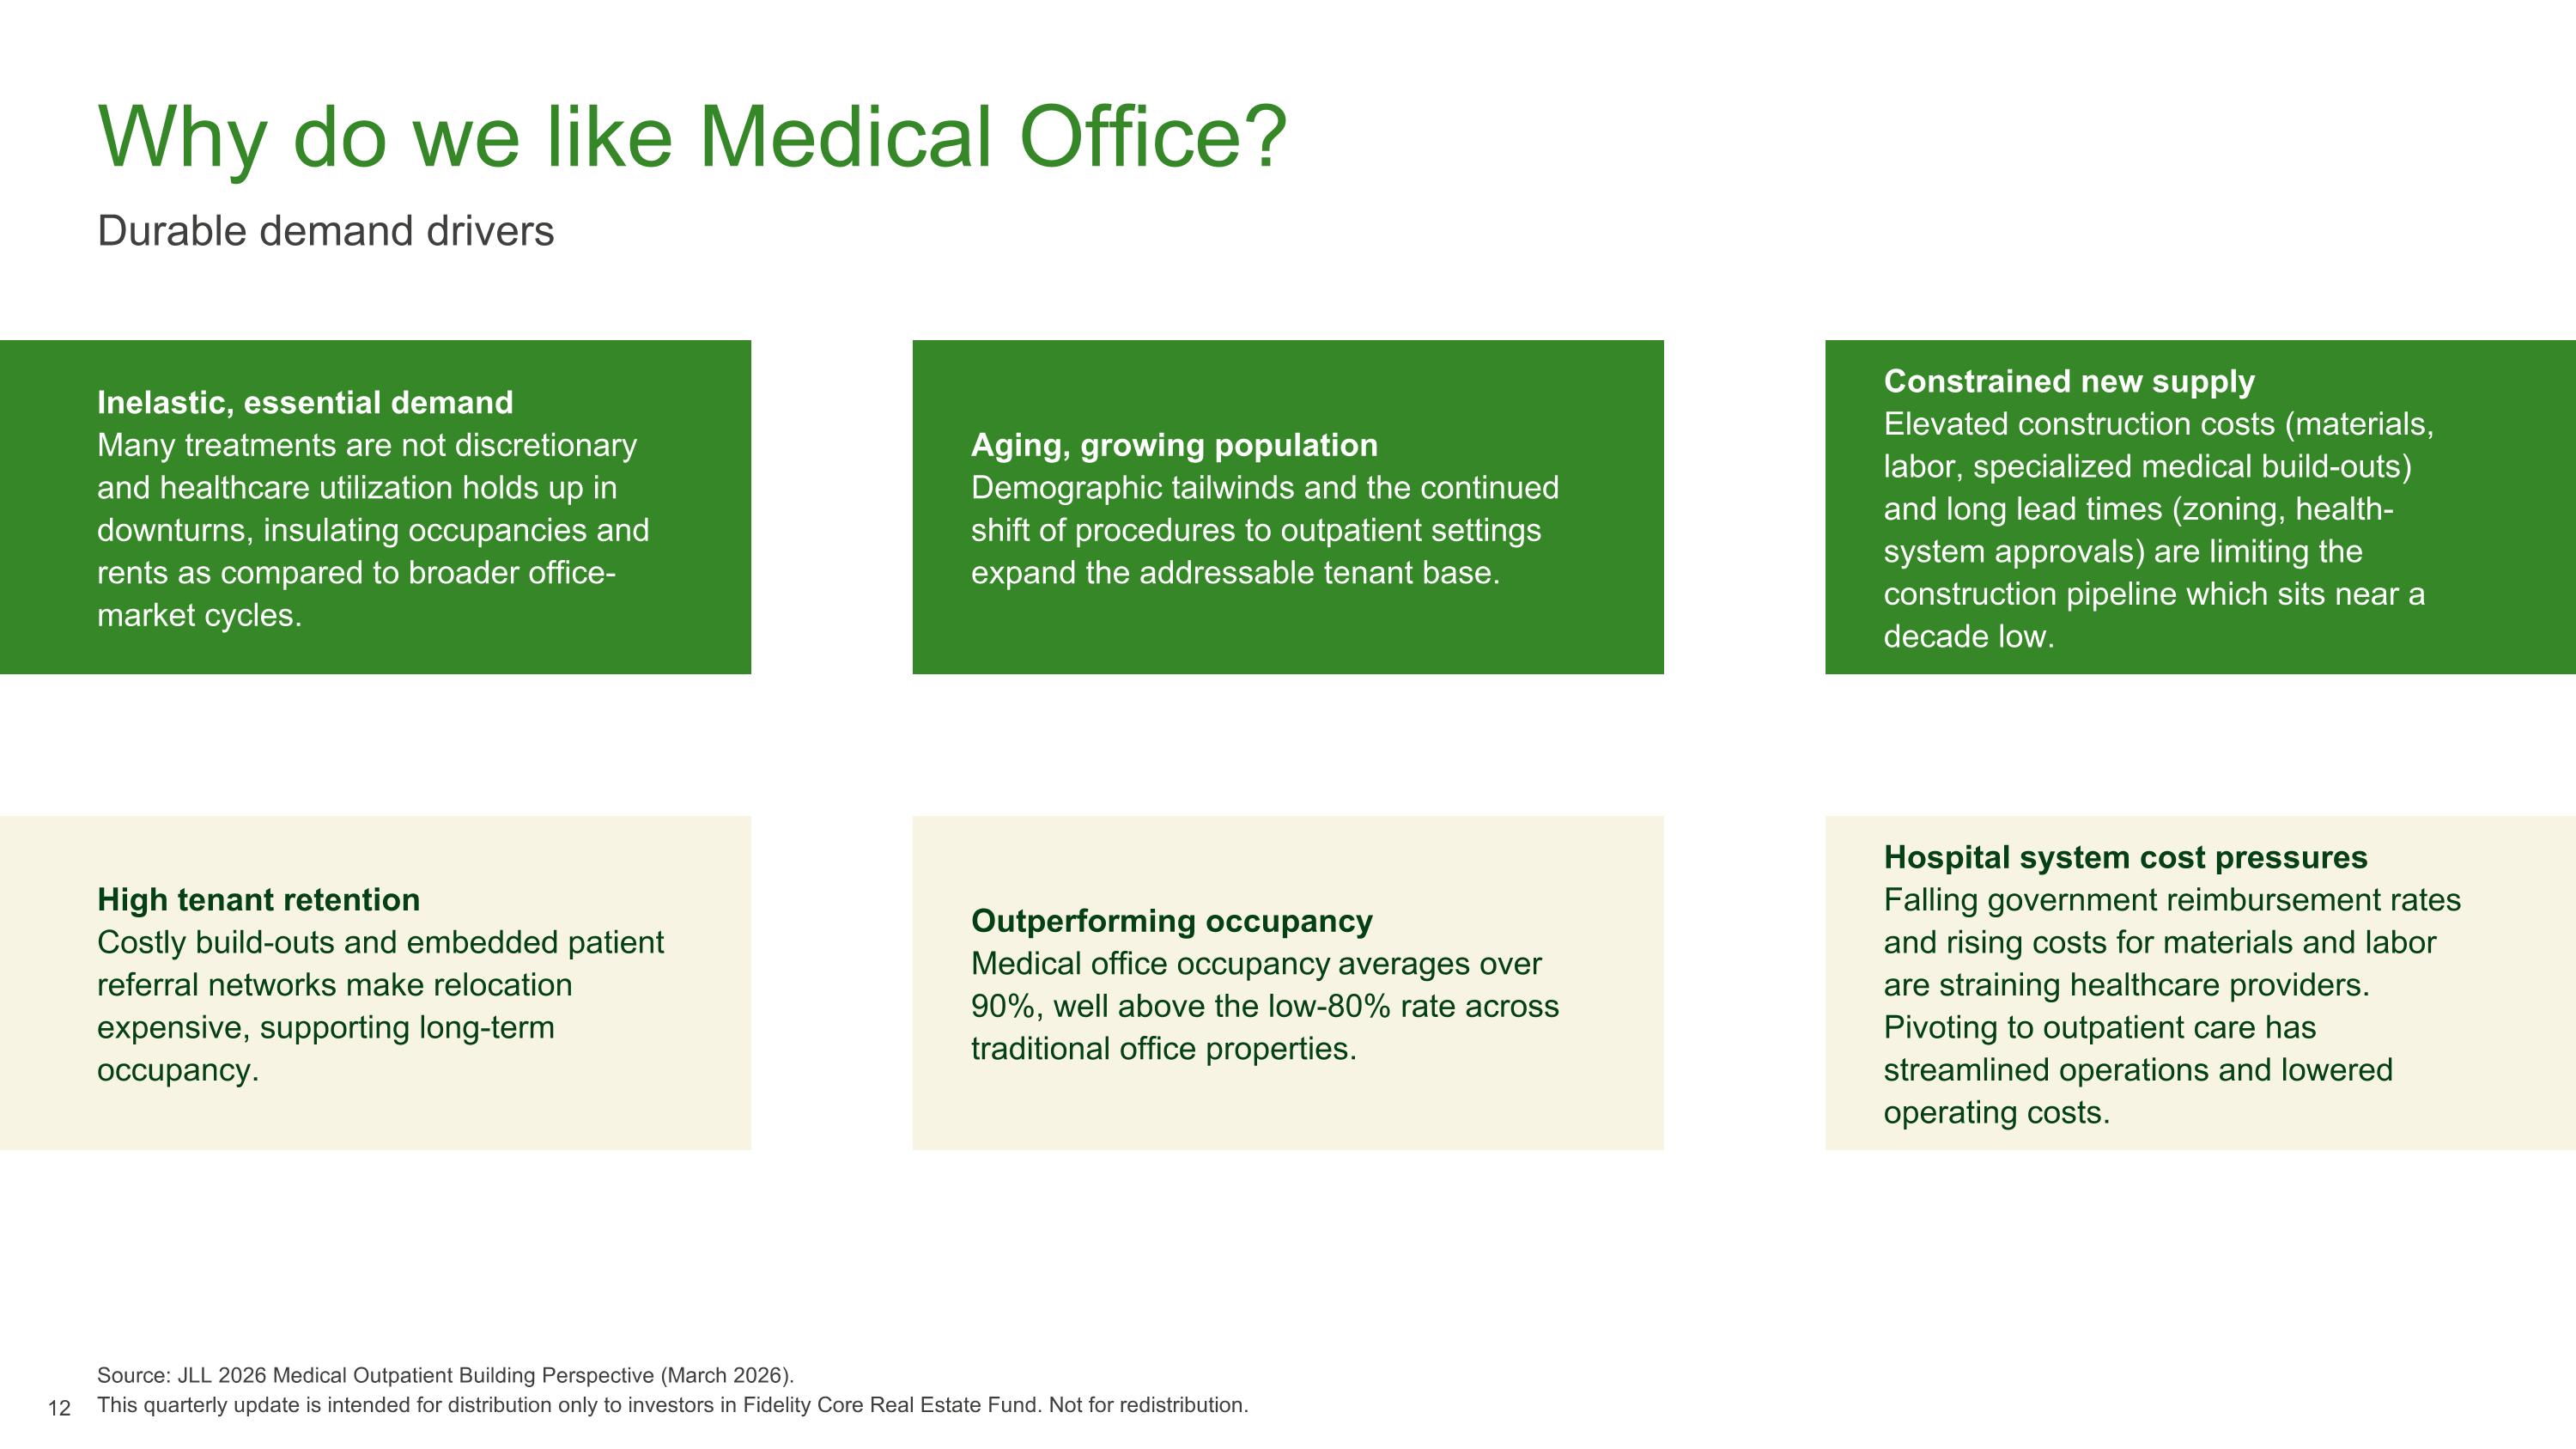
Why do we like Medical Office? Durable demand drivers Source: JLL 2026 Medical Outpatient Building Perspective (March 2026). This quarterly update is intended for distribution only to investors in Fidelity Core Real Estate Fund. Not for redistribution. Inelastic, essential demand Many treatments are not discretionary and healthcare utilization holds up in downturns, insulating occupancies and rents as compared to broader office-market cycles. Aging, growing population Demographic tailwinds and the continued shift of procedures to outpatient settings expand the addressable tenant base. Constrained new supply Elevated construction costs (materials, labor, specialized medical build-outs) and long lead times (zoning, health-system approvals) are limiting the construction pipeline which sits near a decade low. High tenant retention Costly build-outs and embedded patient referral networks make relocation expensive, supporting long-term occupancy. Outperforming occupancy Medical office occupancy averages over 90%, well above the low-80% rate across traditional office properties. Hospital system cost pressures Falling government reimbursement rates and rising costs for materials and labor are straining healthcare providers. Pivoting to outpatient care has streamlined operations and lowered operating costs.
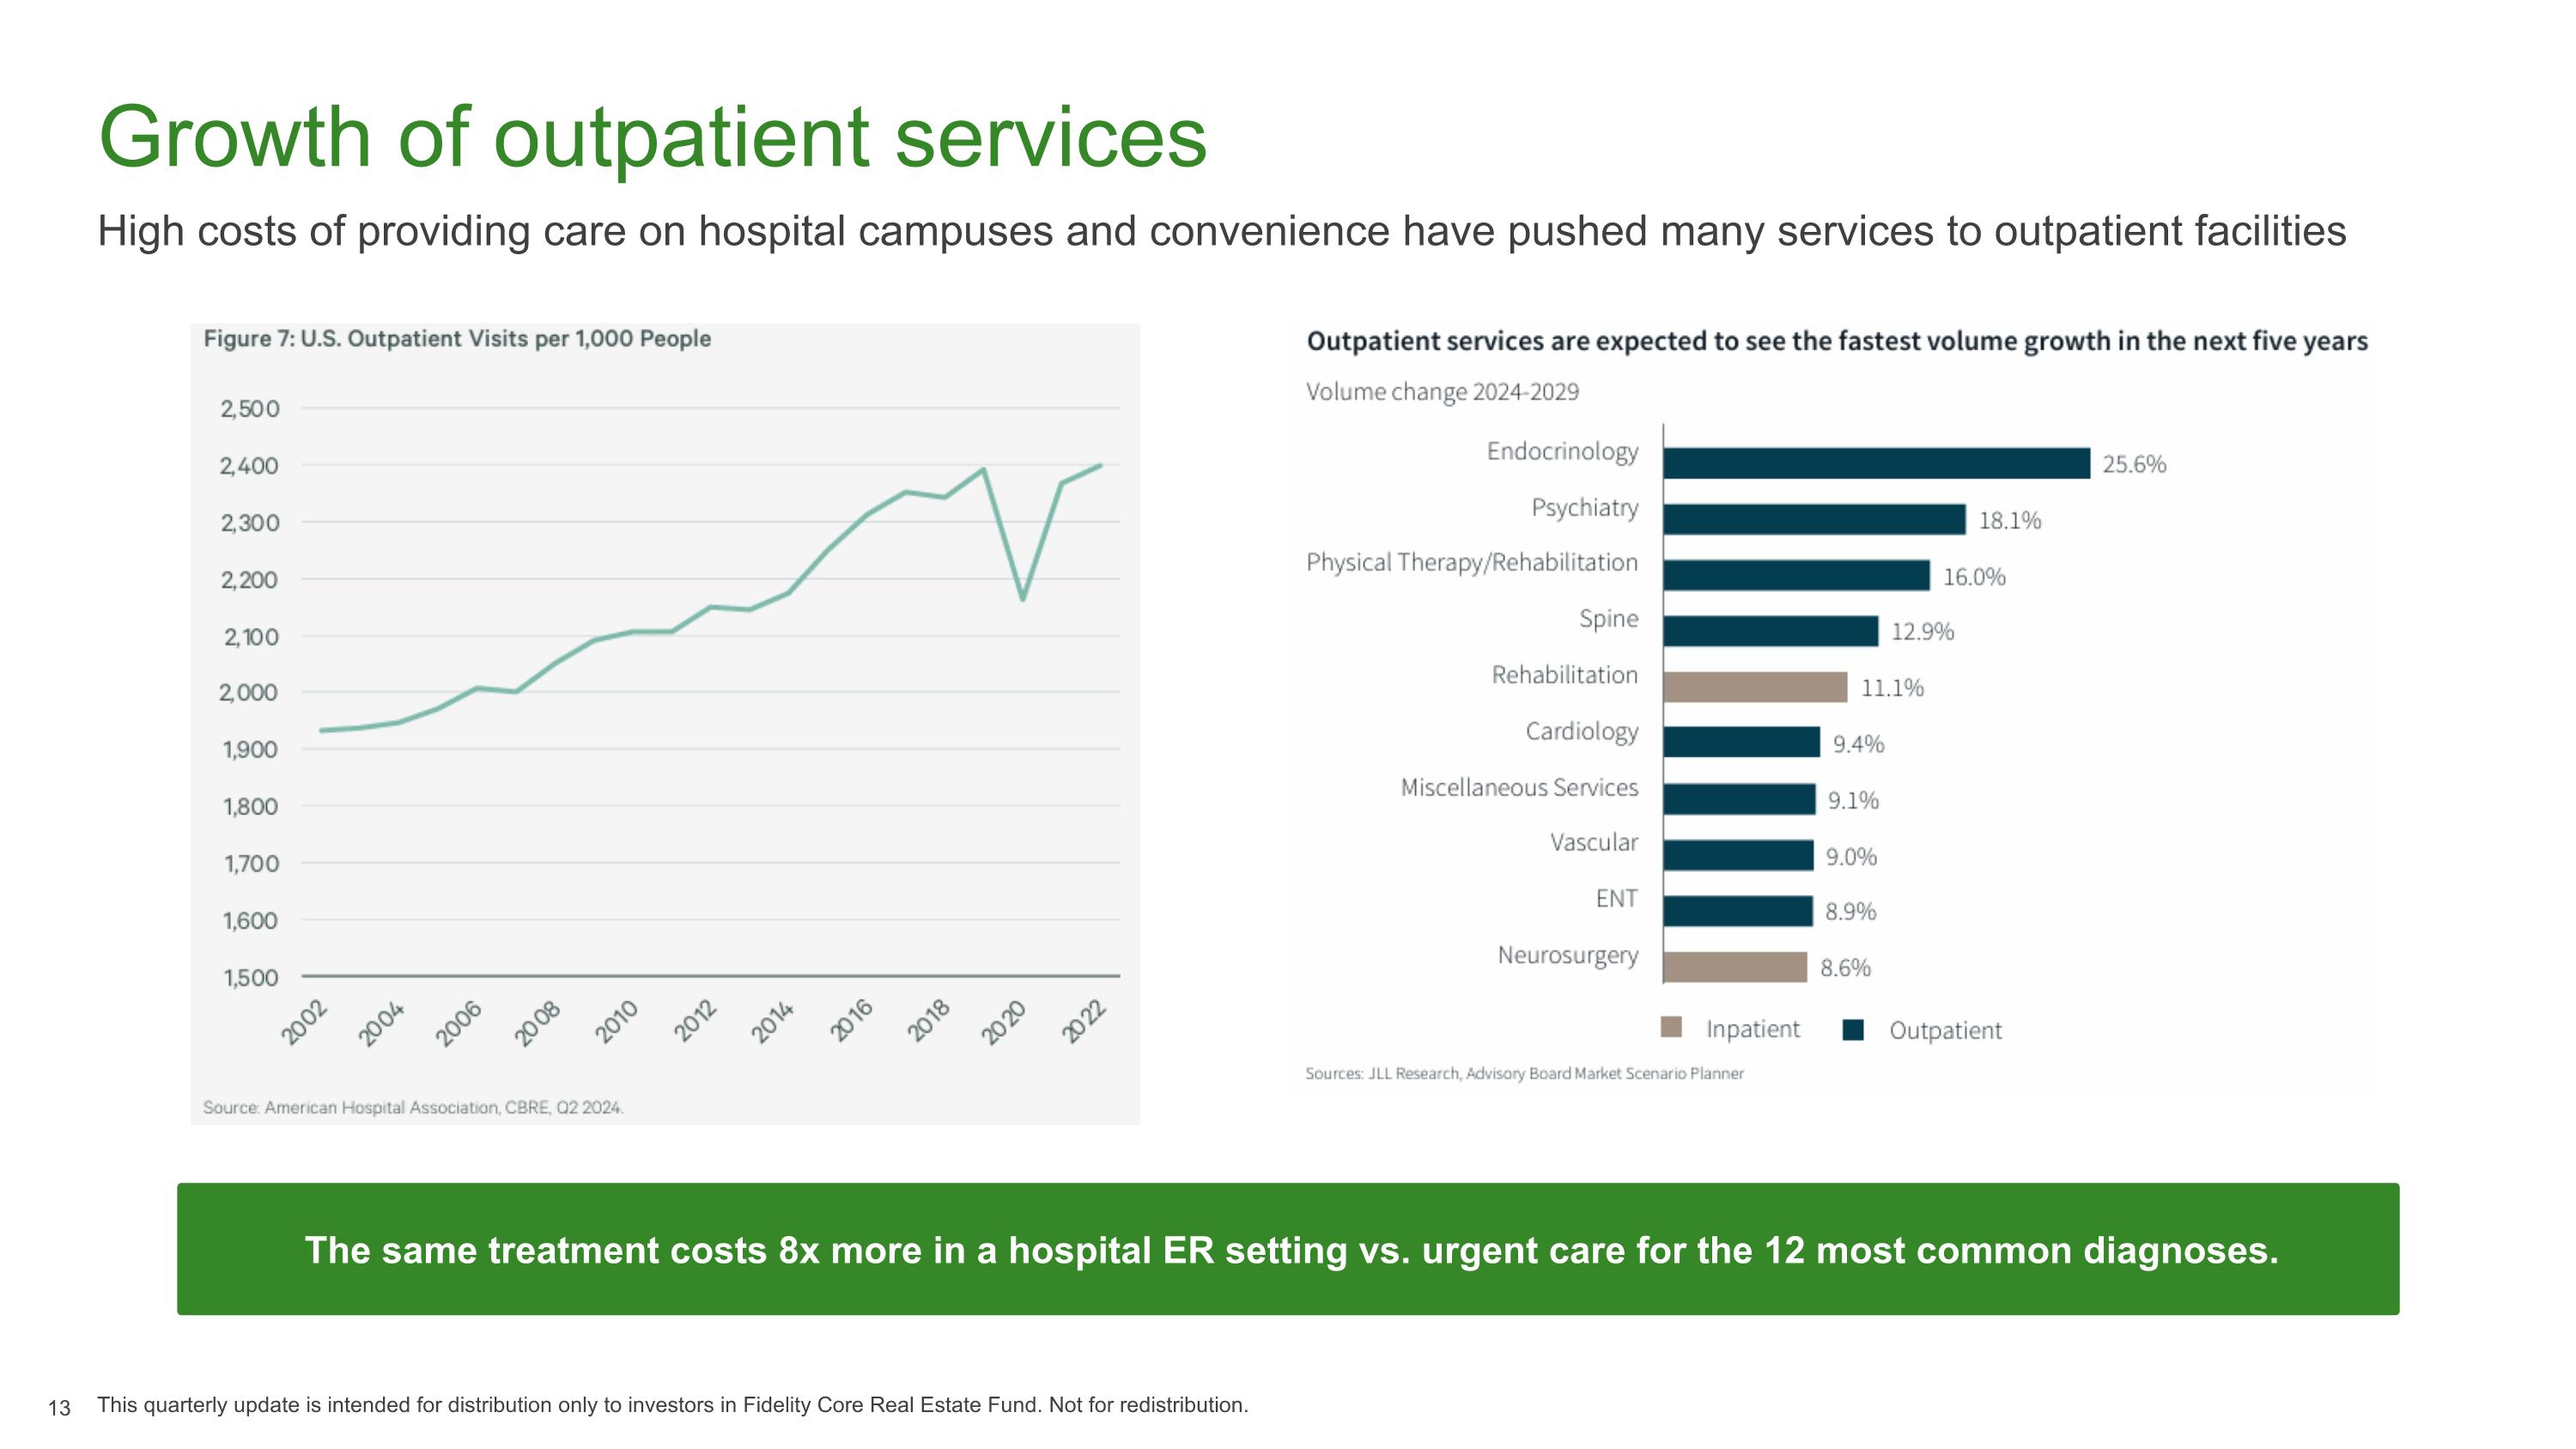
Growth of outpatient services High costs of providing care on hospital campuses and convenience have pushed many services to outpatient facilities This quarterly update is intended for distribution only to investors in Fidelity Core Real Estate Fund. Not for redistribution. The same treatment costs 8x more in a hospital ER setting vs. urgent care for the 12 most common diagnoses.
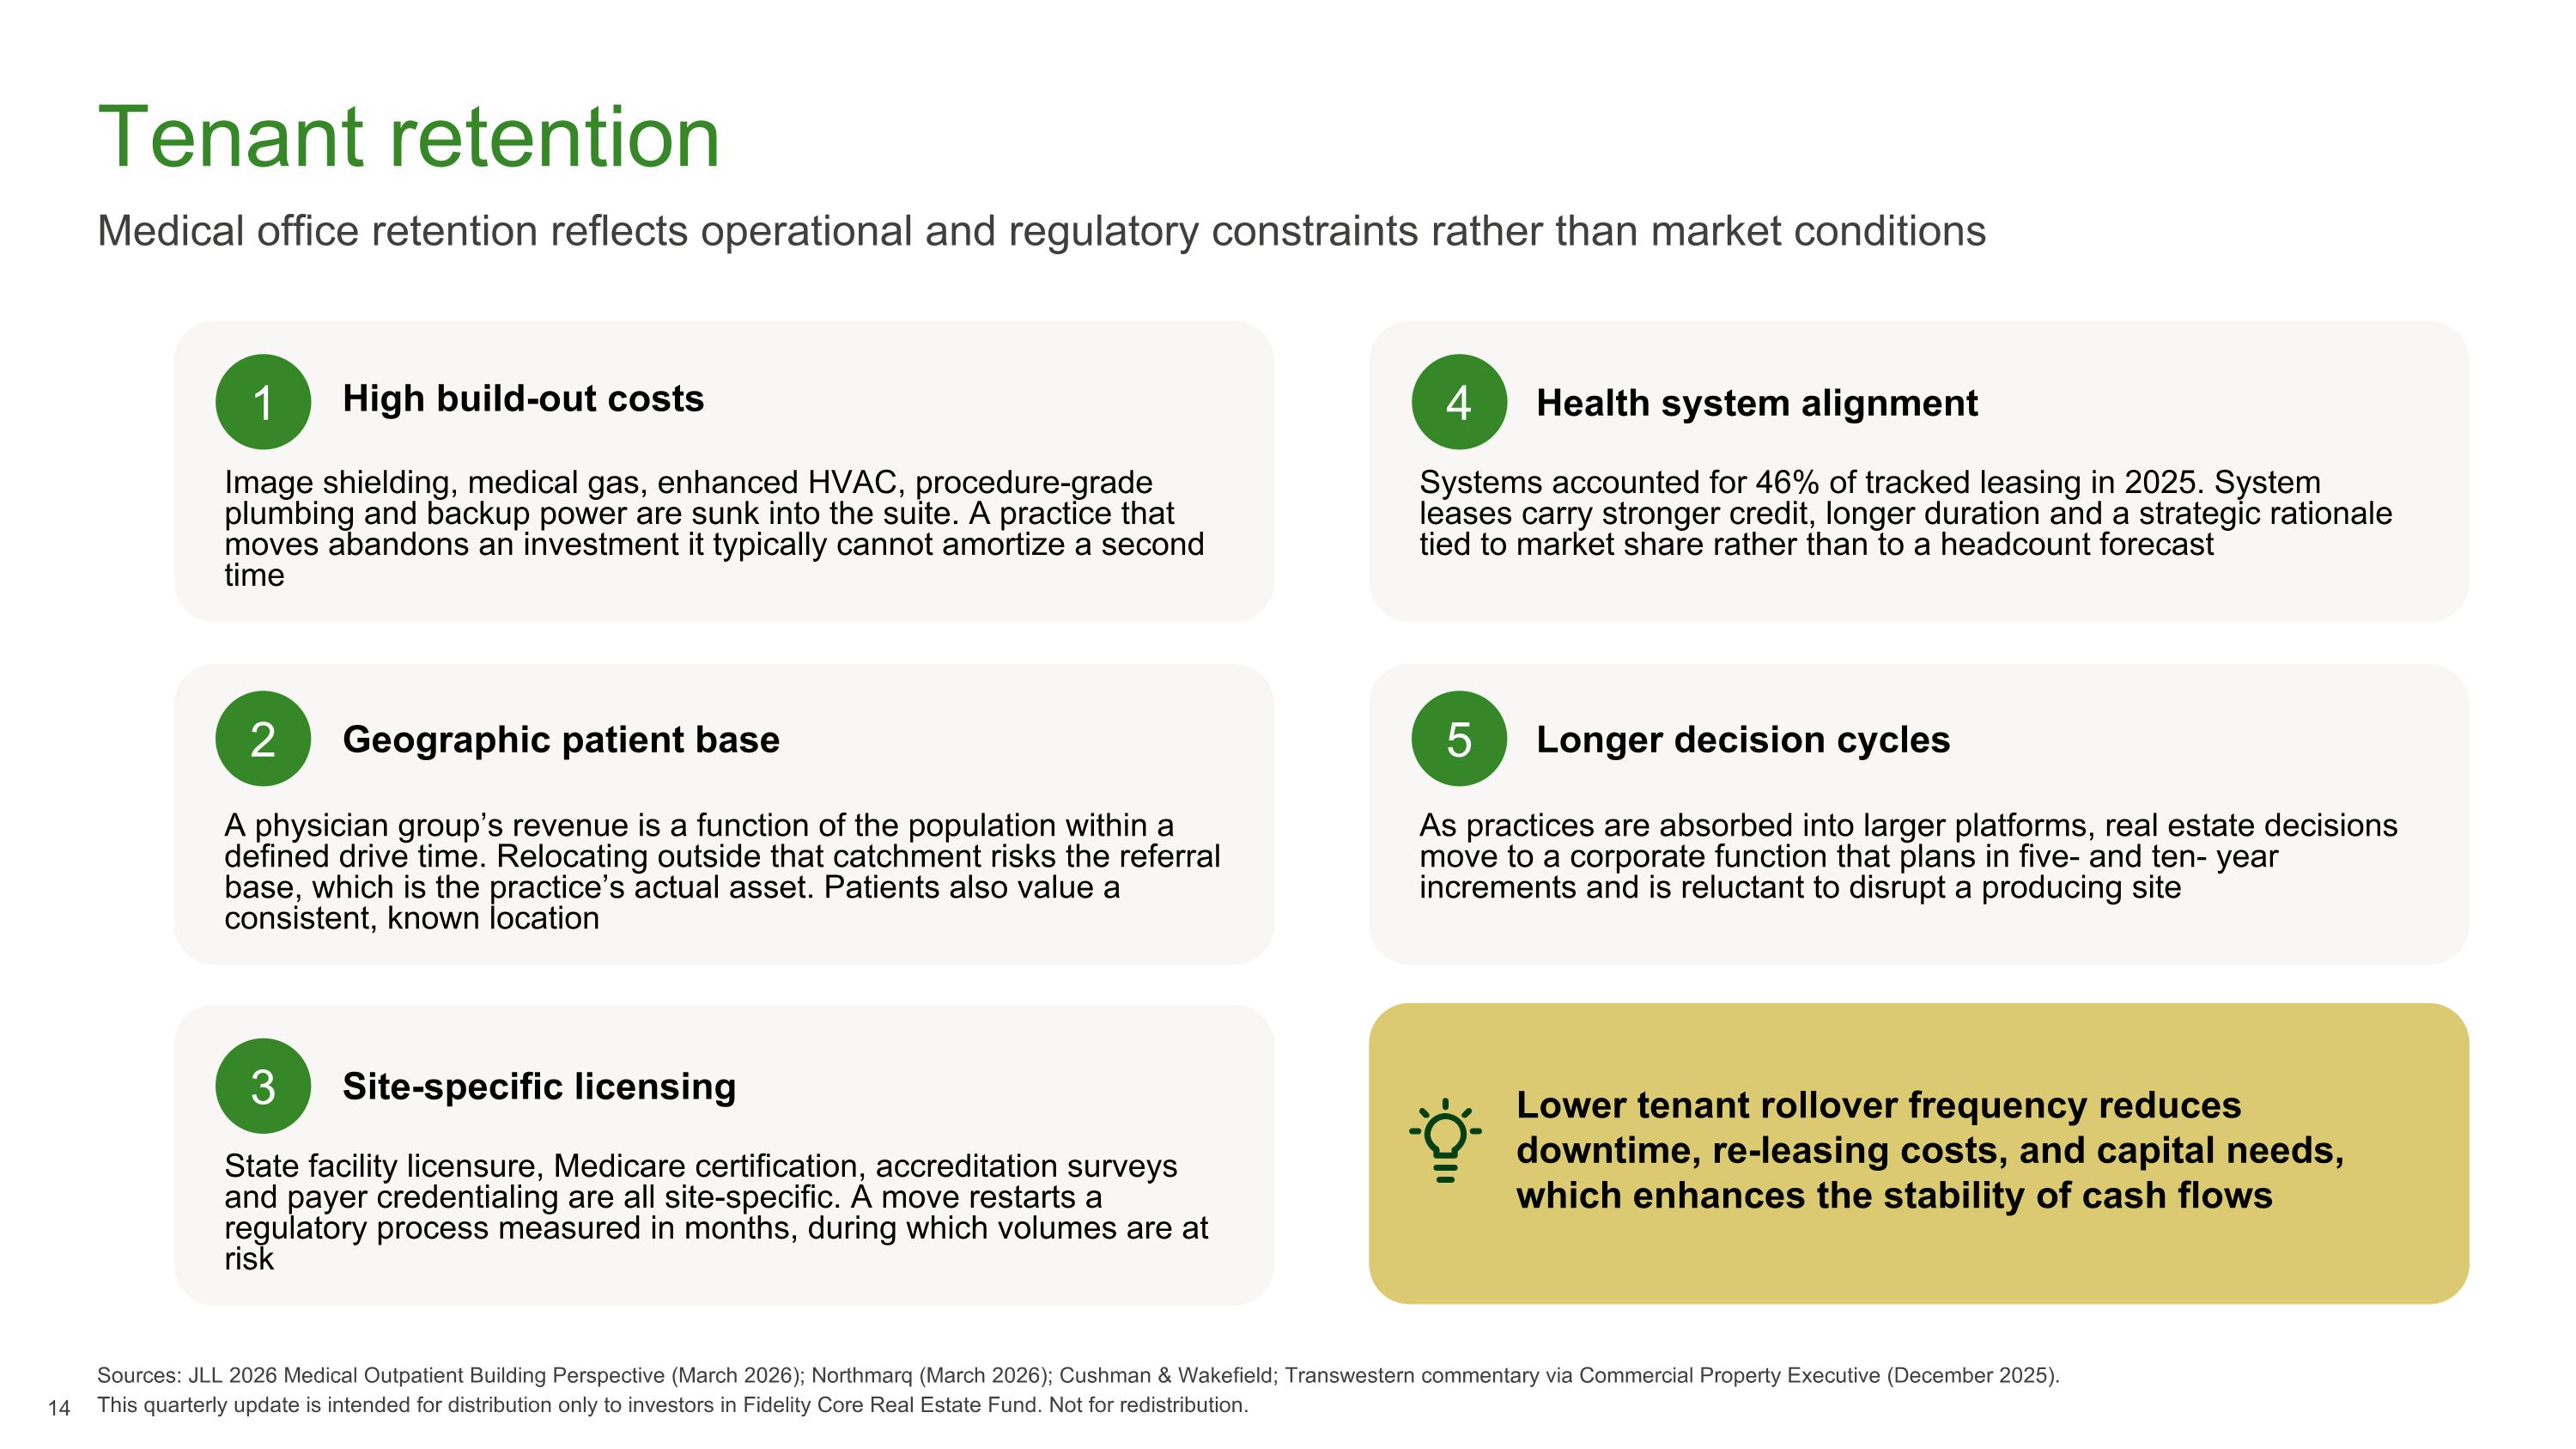
Tenant retention Medical office retention reflects operational and regulatory constraints rather than market conditions Sources: JLL 2026 Medical Outpatient Building Perspective (March 2026); Northmarq (March 2026); Cushman & Wakefield; Transwestern commentary via Commercial Property Executive (December 2025). This quarterly update is intended for distribution only to investors in Fidelity Core Real Estate Fund. Not for redistribution. Image shielding, medical gas, enhanced HVAC, procedure-grade plumbing and backup power are sunk into the suite. A practice that moves abandons an investment it typically cannot amortize a second time A physician group’s revenue is a function of the population within a defined drive time. Relocating outside that catchment risks the referral base, which is the practice’s actual asset. Patients also value a consistent, known location State facility licensure, Medicare certification, accreditation surveys and payer credentialing are all site-specific. A move restarts a regulatory process measured in months, during which volumes are at risk Systems accounted for 46% of tracked leasing in 2025. System leases carry stronger credit, longer duration and a strategic rationale tied to market share rather than to a headcount forecast As practices are absorbed into larger platforms, real estate decisions move to a corporate function that plans in five- and ten- year increments and is reluctant to disrupt a producing site 1 2 3 4 5 High build-out costs Geographic patient base Site-specific licensing Health system alignment Longer decision cycles Lower tenant rollover frequency reduces downtime, re-leasing costs, and capital needs, which enhances the stability of cash flows
Appendix This quarterly update is intended for distribution only to investors in Fidelity Core Real Estate Fund. Not for redistribution.
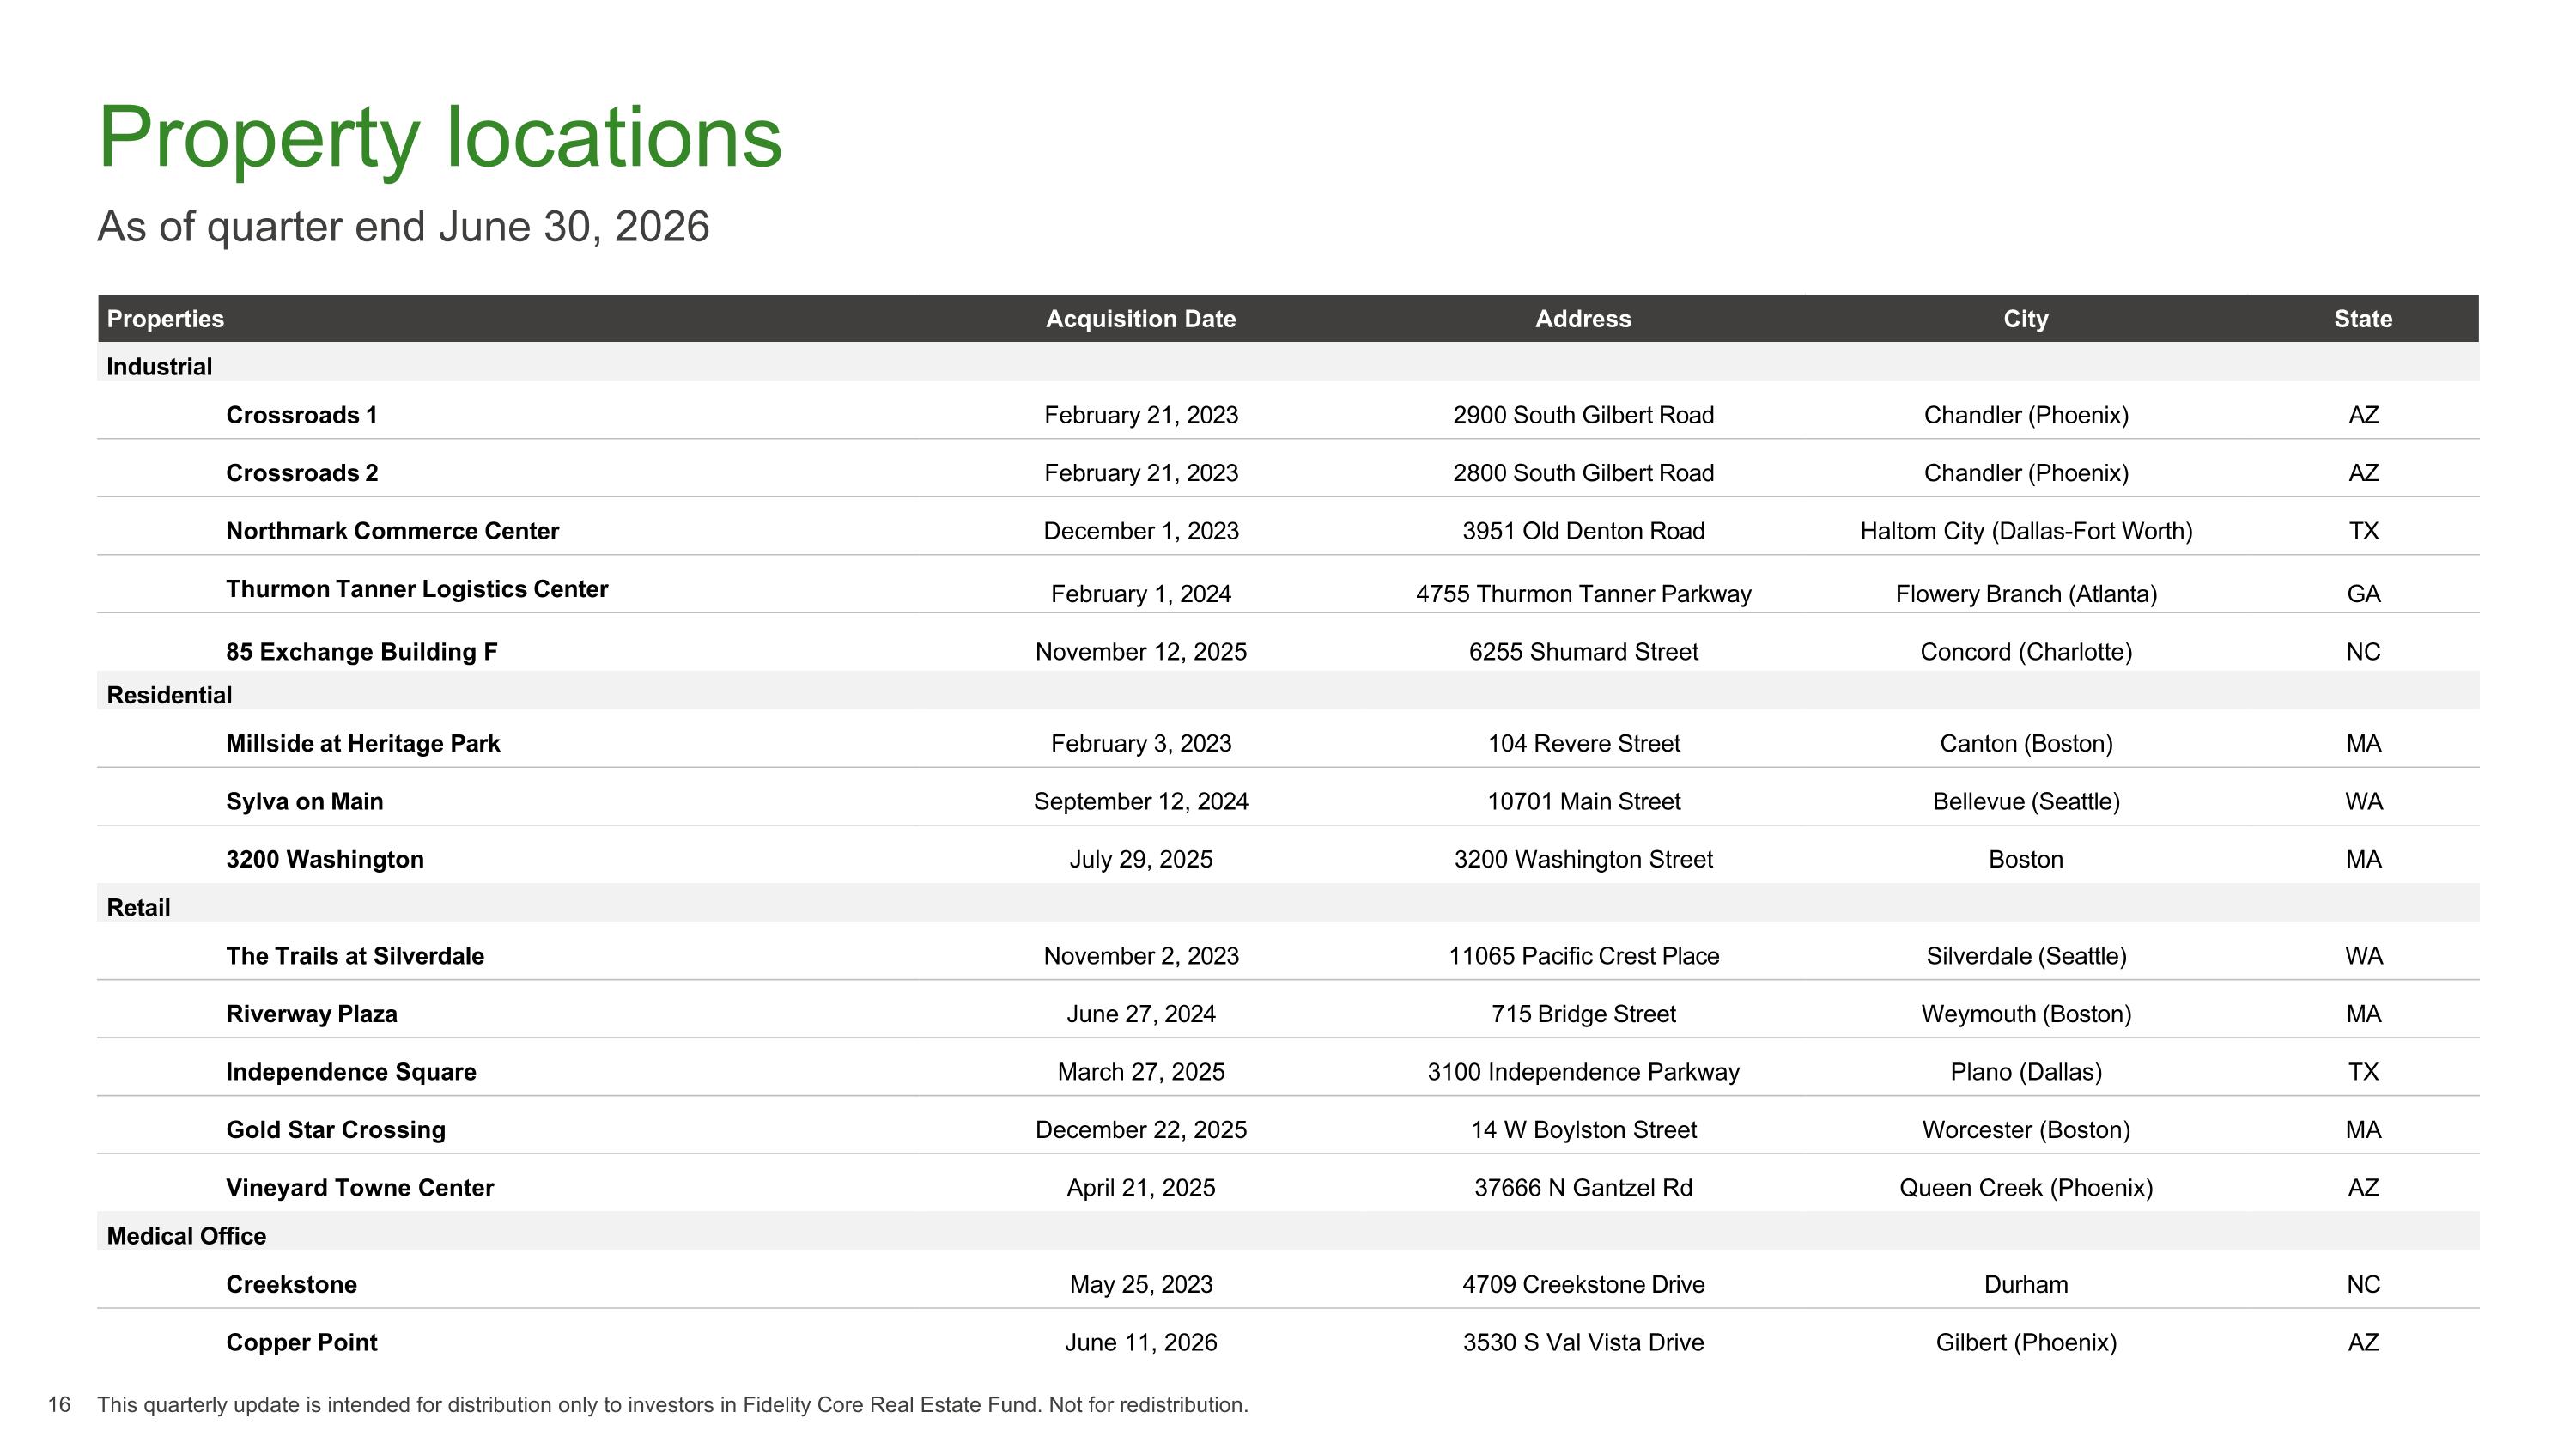
Property locations As of quarter end June 30, 2026 Properties Acquisition Date Address City State Industrial Crossroads 1 February 21, 2023 2900 South Gilbert Road Chandler (Phoenix) AZ Crossroads 2 February 21, 2023 2800 South Gilbert Road Chandler (Phoenix) AZ Northmark Commerce Center December 1, 2023 3951 Old Denton Road Haltom City (Dallas-Fort Worth) TX Thurmon Tanner Logistics Center February 1, 2024 4755 Thurmon Tanner Parkway Flowery Branch (Atlanta) GA 85 Exchange Building F November 12, 2025 6255 Shumard Street Concord (Charlotte) NC Residential Millside at Heritage Park February 3, 2023 104 Revere Street Canton (Boston) MA Sylva on Main September 12, 2024 10701 Main Street Bellevue (Seattle) WA 3200 Washington July 29, 2025 3200 Washington Street Boston MA Retail The Trails at Silverdale November 2, 2023 11065 Pacific Crest Place Silverdale (Seattle) WA Riverway Plaza June 27, 2024 715 Bridge Street Weymouth (Boston) MA Independence Square March 27, 2025 3100 Independence Parkway Plano (Dallas) TX Gold Star Crossing December 22, 2025 14 W Boylston Street Worcester (Boston) MA Vineyard Towne Center April 21, 2025 37666 N Gantzel Rd Queen Creek (Phoenix) AZ Medical Office Creekstone May 25, 2023 4709 Creekstone Drive Durham NC Copper Point June 11, 2026 3530 S Val Vista Drive Gilbert (Phoenix) AZ This quarterly update is intended for distribution only to investors in Fidelity Core Real Estate Fund. Not for redistribution. 16
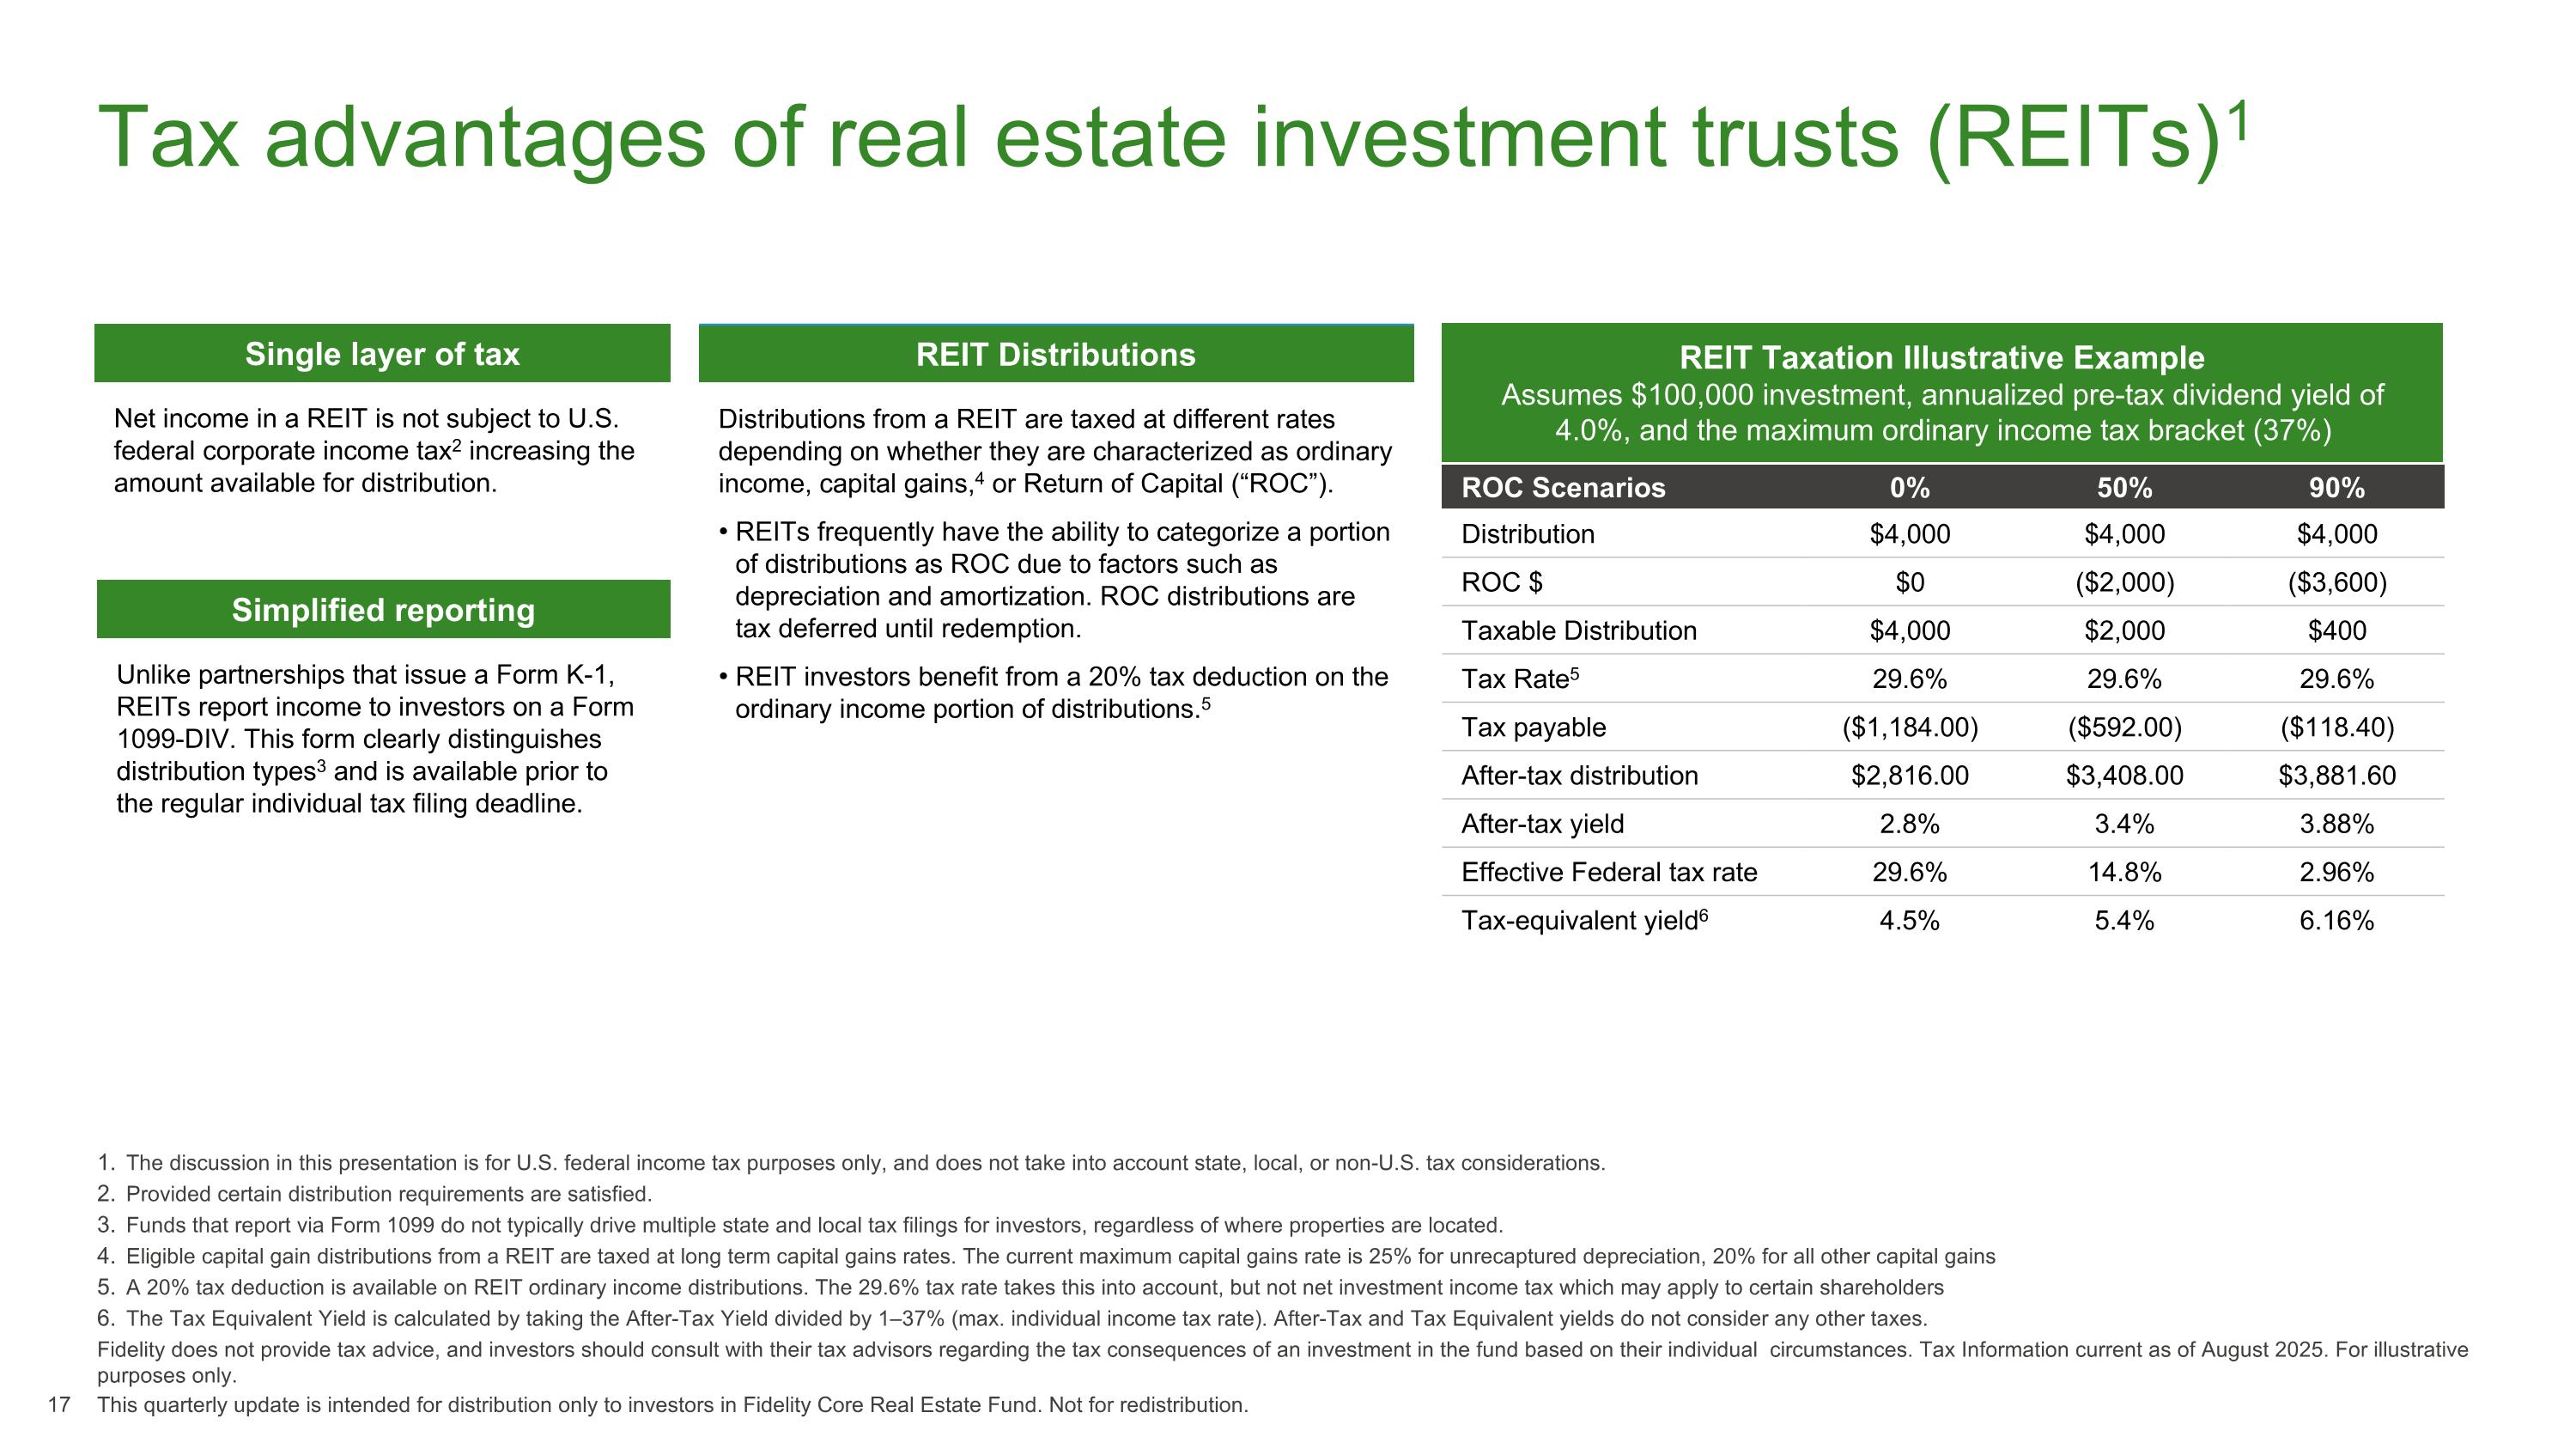
Tax advantages of real estate investment trusts (REITs) .1 The discussion in this presentation is for U.S. federal income tax purposes only, and does not take into account state, local, or non-U.S. tax considerations. Provided certain distribution requirements are satisfied. Funds that report via Form 1099 do not typically drive multiple state and local tax filings for investors, regardless of where properties are located. Eligible capital gain distributions from a REIT are taxed at long term capital gains rates. The current maximum capital gains rate is 25% for unrecaptured depreciation, 20% for all other capital gains A 20% tax deduction is available on REIT ordinary income distributions. The 29.6% tax rate takes this into account, but not net investment income tax which may apply to certain shareholders The Tax Equivalent Yield is calculated by taking the After-Tax Yield divided by 1–37% (max. individual income tax rate). After-Tax and Tax Equivalent yields do not consider any other taxes. Fidelity does not provide tax advice, and investors should consult with their tax advisors regarding the tax consequences of an investment in the fund based on their individual circumstances. Tax Information current as of August 2025. For illustrative purposes only. REIT Distributions Distributions from a REIT are taxed at different rates depending on whether they are characterized as ordinary income, capital gains,4 or Return of Capital (“ROC”). REITs frequently have the ability to categorize a portion of distributions as ROC due to factors such as depreciation and amortization. ROC distributions are tax deferred until redemption. REIT investors benefit from a 20% tax deduction on the ordinary income portion of distributions.5 REIT Taxation Illustrative Example Assumes $100,000 investment, annualized pre-tax dividend yield of 4.0%, and the maximum ordinary income tax bracket (37%) Single layer of tax Net income in a REIT is not subject to U.S. federal corporate income tax2 increasing the amount available for distribution. Simplified reporting Unlike partnerships that issue a Form K-1, REITs report income to investors on a Form 1099-DIV. This form clearly distinguishes distribution types3 and is available prior to the regular individual tax filing deadline. ROC Scenarios 0% 50% 90% Distribution $4,000 $4,000 $4,000 ROC $ $0 ($2,000) ($3,600) Taxable Distribution $4,000 $2,000 $400 Tax Rate5 29.6% 29.6% 29.6% Tax payable ($1,184.00) ($592.00) ($118.40) After-tax distribution $2,816.00 $3,408.00 $3,881.60 After-tax yield 2.8% 3.4% 3.88% Effective Federal tax rate 29.6% 14.8% 2.96% Tax-equivalent yield6 4.5% 5.4% 6.16% This quarterly update is intended for distribution only to investors in Fidelity Core Real Estate Fund. Not for redistribution. 17
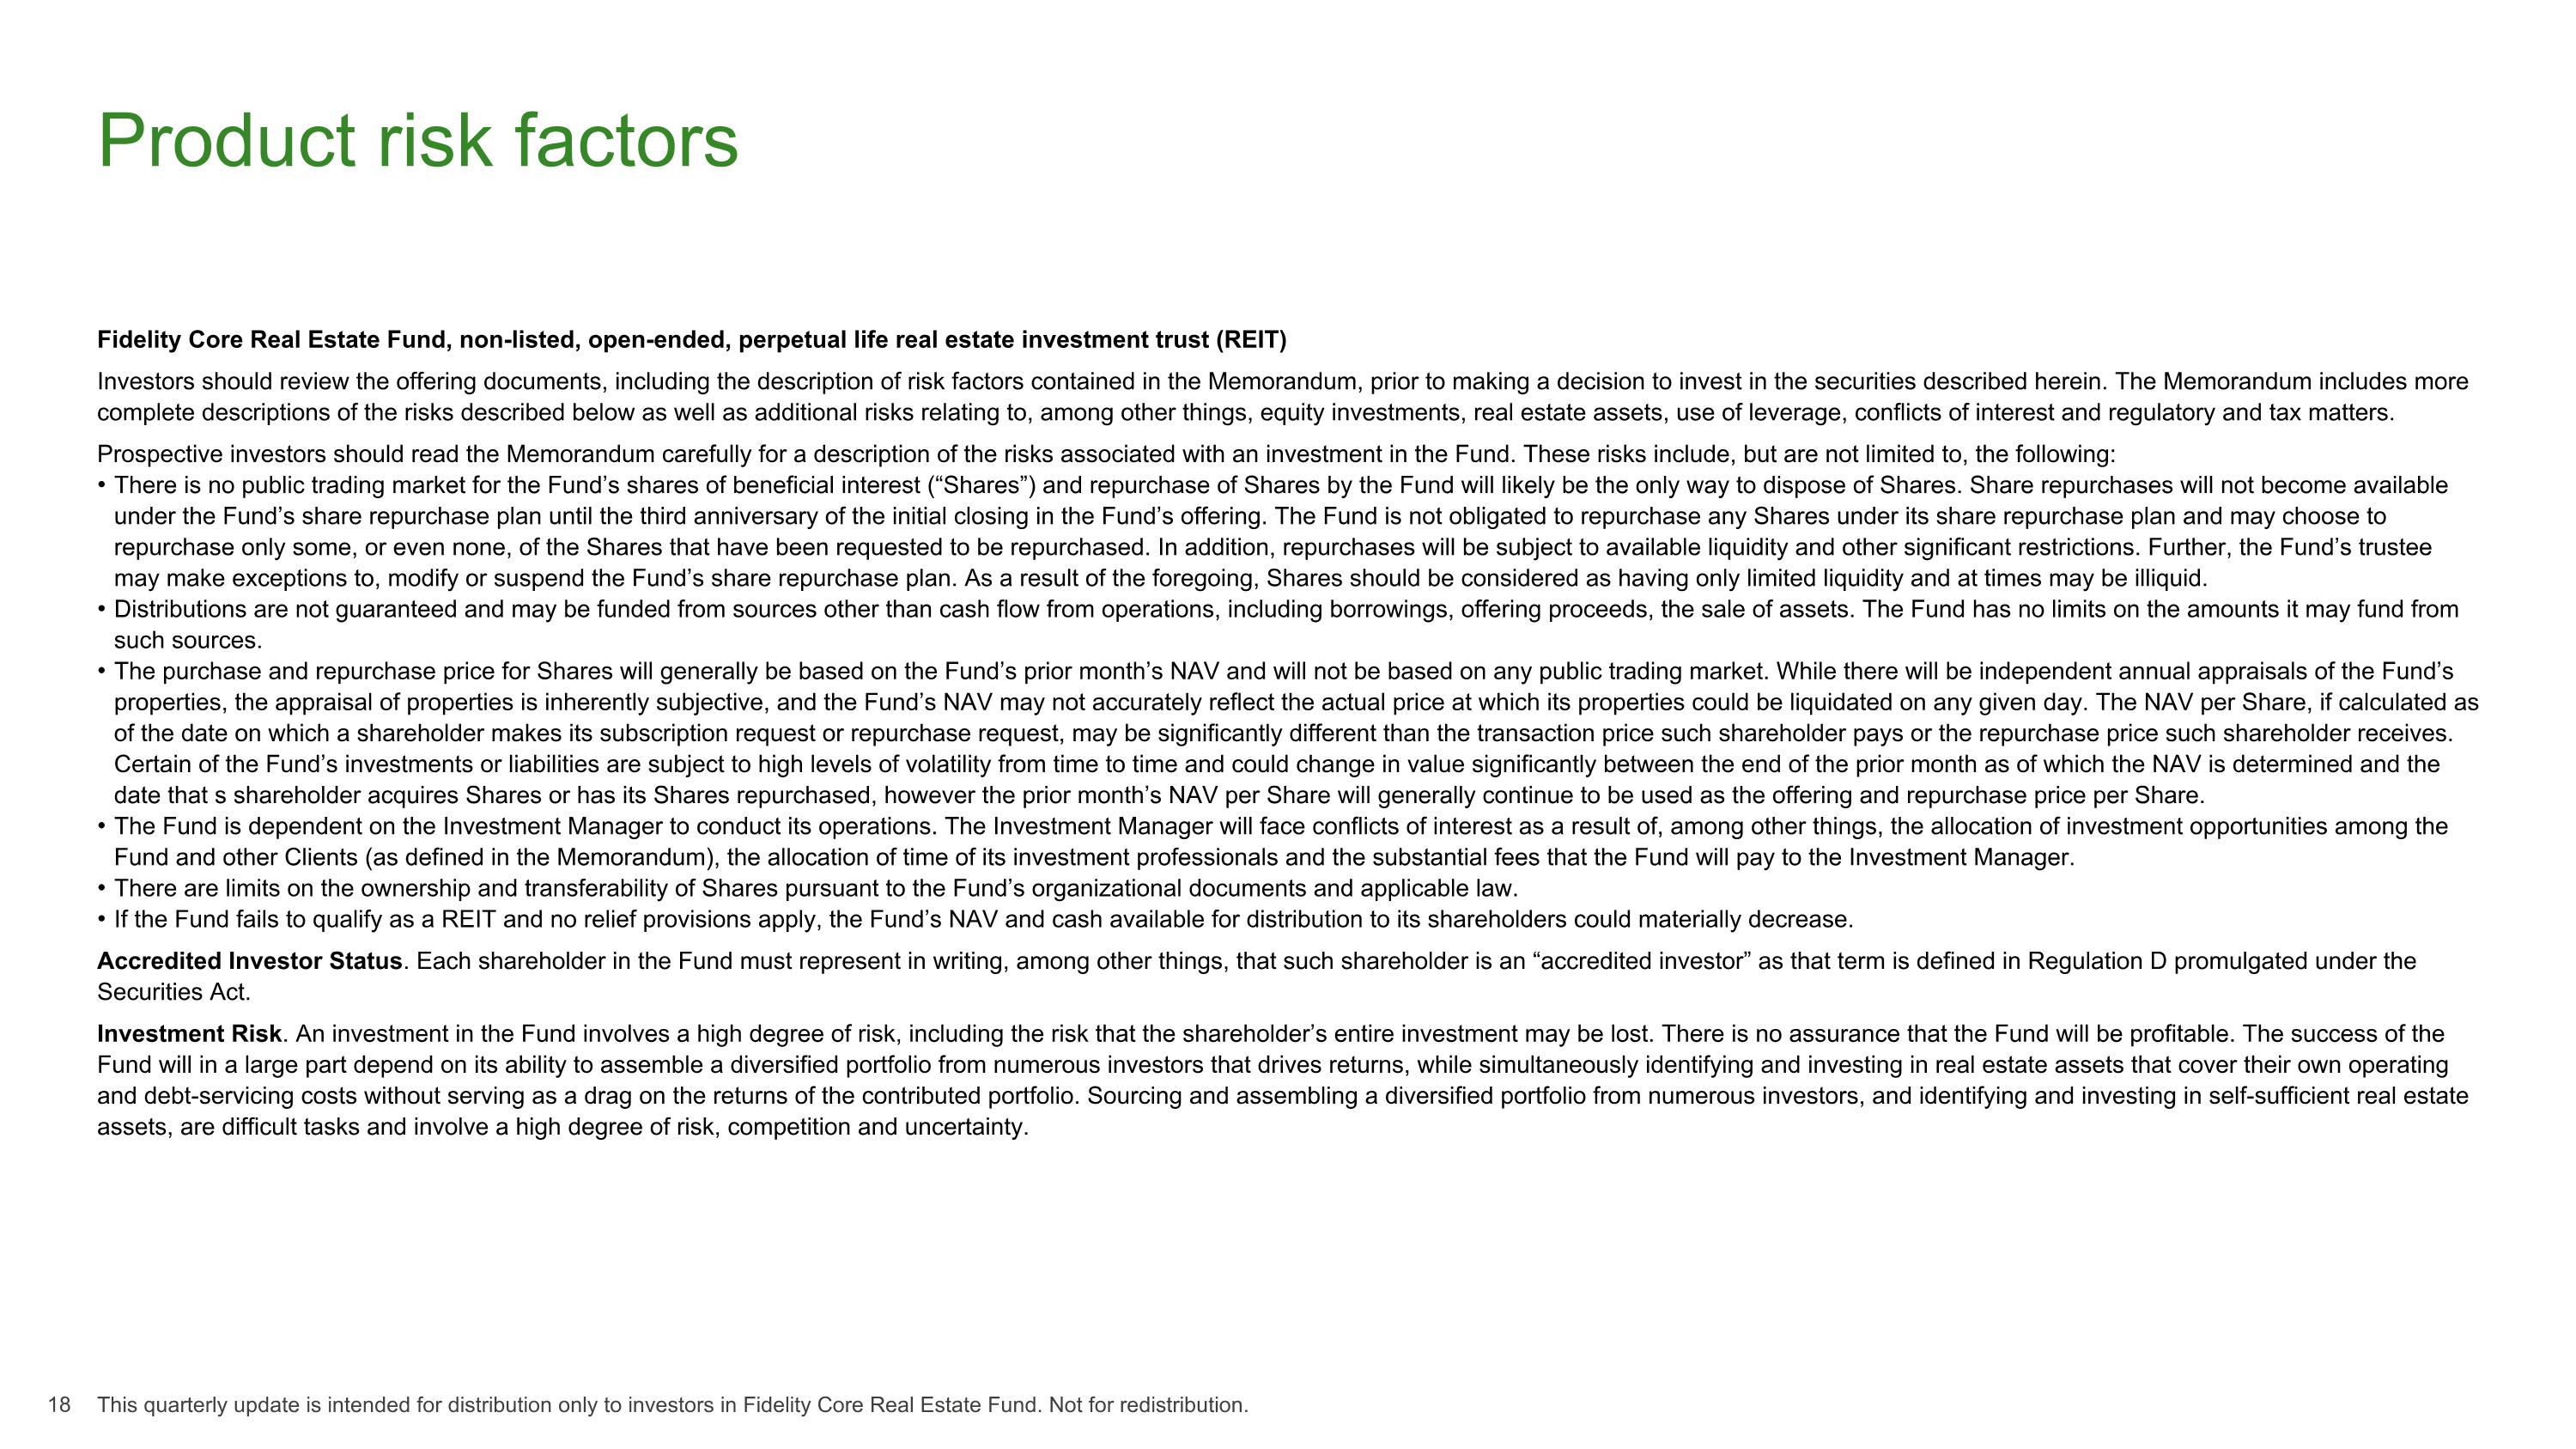
Product risk factors Fidelity Core Real Estate Fund, non-listed, open-ended, perpetual life real estate investment trust (REIT) Investors should review the offering documents, including the description of risk factors contained in the Memorandum, prior to making a decision to invest in the securities described herein. The Memorandum includes more complete descriptions of the risks described below as well as additional risks relating to, among other things, equity investments, real estate assets, use of leverage, conflicts of interest and regulatory and tax matters. Prospective investors should read the Memorandum carefully for a description of the risks associated with an investment in the Fund. These risks include, but are not limited to, the following: There is no public trading market for the Fund’s shares of beneficial interest (“Shares”) and repurchase of Shares by the Fund will likely be the only way to dispose of Shares. Share repurchases will not become available under the Fund’s share repurchase plan until the third anniversary of the initial closing in the Fund’s offering. The Fund is not obligated to repurchase any Shares under its share repurchase plan and may choose to repurchase only some, or even none, of the Shares that have been requested to be repurchased. In addition, repurchases will be subject to available liquidity and other significant restrictions. Further, the Fund’s trustee may make exceptions to, modify or suspend the Fund’s share repurchase plan. As a result of the foregoing, Shares should be considered as having only limited liquidity and at times may be illiquid. Distributions are not guaranteed and may be funded from sources other than cash flow from operations, including borrowings, offering proceeds, the sale of assets. The Fund has no limits on the amounts it may fund from such sources. The purchase and repurchase price for Shares will generally be based on the Fund’s prior month’s NAV and will not be based on any public trading market. While there will be independent annual appraisals of the Fund’s properties, the appraisal of properties is inherently subjective, and the Fund’s NAV may not accurately reflect the actual price at which its properties could be liquidated on any given day. The NAV per Share, if calculated as of the date on which a shareholder makes its subscription request or repurchase request, may be significantly different than the transaction price such shareholder pays or the repurchase price such shareholder receives. Certain of the Fund’s investments or liabilities are subject to high levels of volatility from time to time and could change in value significantly between the end of the prior month as of which the NAV is determined and the date that s shareholder acquires Shares or has its Shares repurchased, however the prior month’s NAV per Share will generally continue to be used as the offering and repurchase price per Share. The Fund is dependent on the Investment Manager to conduct its operations. The Investment Manager will face conflicts of interest as a result of, among other things, the allocation of investment opportunities among the Fund and other Clients (as defined in the Memorandum), the allocation of time of its investment professionals and the substantial fees that the Fund will pay to the Investment Manager. There are limits on the ownership and transferability of Shares pursuant to the Fund’s organizational documents and applicable law. If the Fund fails to qualify as a REIT and no relief provisions apply, the Fund’s NAV and cash available for distribution to its shareholders could materially decrease. Accredited Investor Status. Each shareholder in the Fund must represent in writing, among other things, that such shareholder is an “accredited investor” as that term is defined in Regulation D promulgated under the Securities Act. Investment Risk. An investment in the Fund involves a high degree of risk, including the risk that the shareholder’s entire investment may be lost. There is no assurance that the Fund will be profitable. The success of the Fund will in a large part depend on its ability to assemble a diversified portfolio from numerous investors that drives returns, while simultaneously identifying and investing in real estate assets that cover their own operating and debt-servicing costs without serving as a drag on the returns of the contributed portfolio. Sourcing and assembling a diversified portfolio from numerous investors, and identifying and investing in self-sufficient real estate assets, are difficult tasks and involve a high degree of risk, competition and uncertainty. 18 This quarterly update is intended for distribution only to investors in Fidelity Core Real Estate Fund. Not for redistribution.
Product risk factors Fidelity Core Real Estate Fund (continued) General Risks of Real Estate Assets. The success of real estate assets will depend in part on many factors related to the real estate market in general, and to the specific sub-markets in which the Fund's real estate assets are held. These factors include, without limitation, changes in general economic conditions; lease defaults; decreases in property values; unanticipated property capital requirements; changes in the financial resources of issuers/borrowers; natural disasters; changes in interest rates; changes in the availability of debt financing and/ or mortgage funds which may render the sale or refinancing of properties difficult or impracticable; negative developments in the economy and/or adverse changes in real estate values generally and other factors that are beyond the control of the Investment Manager. Use of Leverage. Although intended to add to returns, the borrowing of funds to purchase qualifying assets will expose the Fund to the risk that the returns achieved on the qualifying assets will be lower than the cost of borrowing to purchase such assets and that leveraging the Fund to buy such assets therefore diminishes the returns achieved by the Fund as a whole. In addition, there is a risk that the availability of financing will be interrupted at some future time, requiring asset sales to repay the outstanding borrowings or a portion thereof. Use of Leverage. Although intended to add to returns, the borrowing of funds to purchase qualifying assets will expose the Fund to the risk that the returns achieved on the qualifying assets will be lower than the cost of borrowing to purchase such assets and that leveraging the Fund to buy such assets therefore diminishes the returns achieved by the Fund as a whole. In addition, there is a risk that the availability of financing will be interrupted at some future time, requiring asset sales to repay the outstanding borrowings or a portion thereof. Availability of Suitable Investments. The pursuit of the Fund's investment strategy involves uncertainty. There can be no assurance that the Investment Manager will be able to locate and complete suitable investments or sufficiently diversify the Fund's portfolio in a manner that satisfies the Fund's objectives and that the Investment Manager believes will provide performance commensurate with the Fund's targets. No Operating History; Loss of Capital. The Fund has no operating history upon which prospective limited partners can evaluate performance. No guarantee or representation is made that the Fund will achieve its investment objective or that shareholders will not lose all or substantially all of their investment in the Fund. The past performance of the Investment Manager or its affiliates is no guarantee of the future performance of the Fund. Other Funds and Accounts Managed by Fidelity. The Fidelity personnel responsible for making investments on behalf of the Fund are also responsible for making investments on behalf of other funds and accounts. General Tax Risks. The Fund intends to operate so as to qualify as a REIT under the Internal Revenue Code of 1986 (the "Code"). However, qualification as a REIT involves the application of highly technical and complex provisions of the Code for which only a limited number of judicial or administrative interpretations exist. Notwithstanding the availability of cure provisions in the Code, various compliance requirements could be failed and could jeopardize the Fund's REIT status, which would cause the Fund to face serious tax consequences that will substantially reduce the funds available to satisfy its obligations, to implement its business strategy and to make distributions to shareholders for each of the years involved. 19 This quarterly update is intended for distribution only to investors in Fidelity Core Real Estate Fund. Not for redistribution.
Important information This quarterly update is intended for distribution only to investors in Fidelity Core Real Estate Fund. Not for redistribution. Past performance and dividend rates are historical and do not guarantee future results. Fidelity Diversifying Solutions LLC (“FDS”) is a U.S. registered investment adviser, a commodity pool operator and commodity trading adviser; it is a wholly owned subsidiary of FMR LLC. Certain information contained in this Presentation has been obtained from third-party sources. While such information is believed to be reliable for the purposes used herein, Fidelity has not independently verified such information and Fidelity makes no representation or warranty, express or implied, as to the accuracy or completeness of the information contained herein. Certain economic and market conditions contained herein have been obtained from published sources and/or prepared by third parties and in certain cases have not been updated through the date hereof. All information contained herein is subject to revision and the information set forth herein does not purport to be complete. Third-party marks are the property of their respective owners; all other marks are the property of FMR LLC. Third parties mentioned are independent entities and not affiliated with Fidelity Investments. © 2026 FMR LLC. All rights reserved. 1089514.16.0