ADDITIONAL INFORMATION
This contains important information about the Frank Value Fund – Investor Class – FRNKX (the “Fund”) for the period July 1, 2025 to June 30, 2026.
You can find additional information about the Fund at https://frankfunds.com. You can also request the fund's Statutory Prospectus, financial information, holdings, and proxy voting information by contacting us at 1-888-217-5426.
expense Information
What were the Fund costs for the past year?
(based on a hypothetical $10,000 investment)
| Fund Name | Costs of a $10,000 investment | Costs paid as a percentage of a $10,000 investment * |
| Frank Value Fund – Investor Class | $149 | 1.37% |
*Annualized
Management Discussion of Fund Performance
The Frank Value Fund Investor Class returned 17.48% in the year ended June 30, 2026, compared to 26.62% for its benchmark, the Russell Midcap Value Index. In the five years ending June 30, 2026 Frank Value Fund Institutional Class returned 12.37% annualized, compared to 9.48% for the Russell Midcap Value Index.
Strategy
Frank Capital Partners, LLC, the advisor to the Frank Value Fund, employs a high-conviction absolute value investing strategy building a portfolio of 20 to 35 US-listed s/mid cap value equities. The strategy favors catalysts such as material share repurchases or debt reduction to unlock value. With an unconstrained, benchmark agnostic strategy, the manager maintains flexibility with the ability to invest outside of indices and freedom in sector weightings.
Techniques
The advisor’s security selection approach demanding low-valuation, high-quality, and unlocking catalysts also contributed to returns. The information below provides detailed descriptions of catalyst-driven allocations employed during the year.
Cantaloupe
The advisor initiated a position in Cantaloupe in September 2024 at an initial price of $5.99. Cantaloupe is a payment processor for vending machines and other automated stores, and despite recurring high profitability, the company remained immaterial in stock market indices. Frank Value Fund’s concentrated position delivered shareholders an outsized benefit when the company received a takeover offer, and the advisor sold the position in July 2025 for $11 and a gain of 83% in 10 months.
Garrett Motion
The advisor initiated a position in Garrett Motion in February 2024 at an initial price of $9. The market valued the company at $2.1 billion while free cash flow production was $400 million. Since February 2024, the company’s share count has declined from 242 million shares to 193 million, catalyzing rapid earnings per share growth. On April 30, 2026, the advisor deemed Garrett Motion fairly-valued, and Frank Value Fund sold its position in Garrett Motion at $24.98 for a gain of 178% excluding dividends.
We sincerely thank you for being a shareholder of the Frank Value Fund and look forward to working for you in the future.
Performance graph
AVERAGE ANNUAL RETURNS
|
One Year |
Five Year |
Ten Year | |
| Frank Value Fund – Investor Class | 17.48% | 12.37% | 8.01% |
| Russell Mid Cap Value Index | 26.62% | 9.48% | 10.63% |
Cumulative Performance Comparison of $10,000 Investment
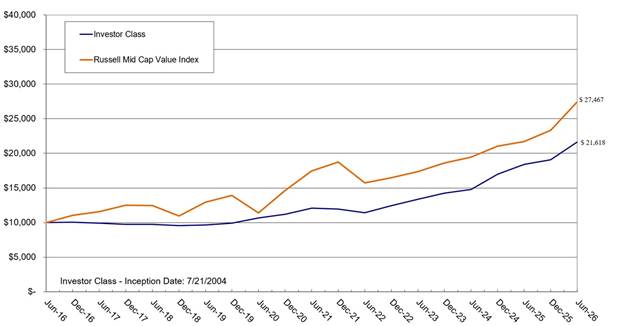
Past performance is not a good predictor of future performance. The returns shown do not reflect taxes that a shareholder would pay on Fund distributions or on the redemption of Fund shares. Updated performance data current to the most recent month-end can be obtained by calling 1-888-217-5426.
FUND STATISTICS
| PORTFOLIO | PORTFOLIO | ADVISORY FEES | |
| NET ASSETS: | HOLDINGS: | TURNOVER: | PAID BY FUND: |
| $35,659,512 | 26 | 95.89% | $286,712 |
PORTFOLIO ILLUSTRATION
The following chart gives a visual breakdown of the Fund by the sectors the underlying securities represent as a percentage of the portfolio of investments.
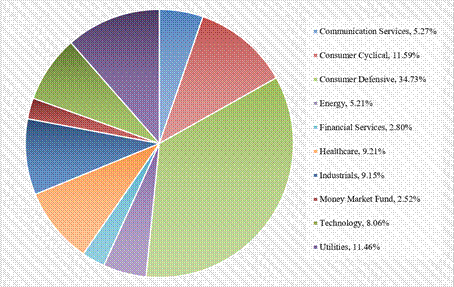
Sectors are based on Morningstar® classifications.
Portfolio composition subject to change.
top ten holdings
(% of Net Assets)
| 1. | Spectrum Brands Holdings, Inc. | 7.03% |
| 2. | United Natural Foods, Inc. | 6.70% |
| 3. | Icon PLC (Ireland) | 6.42% |
| 4. | Science Applications International Corp. | 5.56% |
| 5. | MPLX LP | 5.30% |
| 6. | Vistra Corp. | 5.18% |
| 7. | H&R Block, Inc. | 5.15% |
| 8. | The J.M. Smucker Co. | 4.71% |
| 9. | Hershey Co. | 4.21% |
| 10. | Pitney Bowes, Inc. | 4.19% |
| Total % of Net Assets | 54.45% |
ADDITIONAL INFORMATION
This contains important information about the Frank Value Fund - Class C – FNKCX (the “Fund”) for the period July 1, 2025 to June 30, 2026.
You can find additional information about the Fund at https://frankfunds.com. You can also request the fund's Statutory Prospectus, financial information, holdings, and proxy voting information by contacting us at 1-888-217-5426.
expense Information
What were the Fund costs for the past year?
(based on a hypothetical $10,000 investment)
| Fund Name | Costs of a $10,000 investment | Costs paid as a percentage of a $10,000 investment * |
| Frank Value Fund – Class C | $230 | 2.12% |
*Annualized
Management Discussion of Fund Performance
The Frank Value Fund Class C returned 16.52% in the year ended June 30, 2026, compared to 26.62% for its benchmark, the Russell Midcap Value Index. In the five years ending June 30, 2026 Frank Value Fund Class C returned 11.52% annualized, compared to 9.48% for the Russell Midcap Value Index.
Strategy
Frank Capital Partners, LLC, the advisor to the Frank Value Fund, employs a high-conviction absolute value investing strategy building a portfolio of 20 to 35 US-listed s/mid cap value equities. The strategy favors catalysts such as material share repurchases or debt reduction to unlock value. With an unconstrained, benchmark agnostic strategy, the manager maintains flexibility with the ability to invest outside of indices and freedom in sector weightings.
Techniques
The advisor’s security selection approach demanding low-valuation, high-quality, and unlocking catalysts also contributed to returns. The information below provides detailed descriptions of catalyst-driven allocations employed during the year.
Cantaloupe
The advisor initiated a position in Cantaloupe in September 2024 at an initial price of $5.99. Cantaloupe is a payment processor for vending machines and other automated stores, and despite recurring high profitability, the company remained immaterial in stock market indices. Frank Value Fund’s concentrated position delivered shareholders an outsized benefit when the company received a takeover offer, and the advisor sold the position in July 2025 for $11 and a gain of 83% in 10 months.
Garrett Motion
The advisor initiated a position in Garrett Motion in February 2024 at an initial price of $9. The market valued the company at $2.1 billion while free cash flow production was $400 million. Since February 2024, the company’s share count has declined from 242 million shares to 193 million, catalyzing rapid earnings per share growth. On April 30, 2026, the advisor deemed Garrett Motion fairly-valued, and Frank Value Fund sold its position in Garrett Motion at $24.98 for a gain of 178% excluding dividends.
We sincerely thank you for being a shareholder of the Frank Value Fund and look forward to working for you in the future.
Performance graph
AVERAGE ANNUAL RETURNS
|
One Year |
Five Year |
Ten Year | |
| Frank Value Fund – Class C | 16.52% | 11.52% | 7.21% |
| Russell Mid Cap Value Index | 26.62% | 9.48% | 10.63% |
Cumulative Performance Comparison of $10,000 Investment
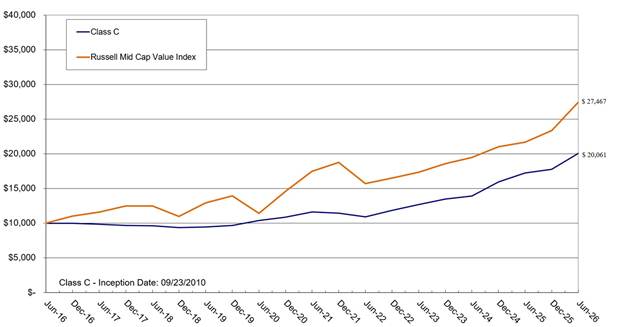
Past performance is not a good predictor of future performance. The returns shown do not reflect taxes that a shareholder would pay on Fund distributions or on the redemption of Fund shares. Updated performance data current to the most recent month-end can be obtained by calling 1-888-217-5426.
FUND STATISTICS
| PORTFOLIO | PORTFOLIO | ADVISORY FEES | |
| NET ASSETS: | HOLDINGS: | TURNOVER: | PAID BY FUND: |
| $35,659,512 | 26 | 95.89% | $286,712 |
PORTFOLIO ILLUSTRATION
The following chart gives a visual breakdown of the Fund by the sectors the underlying securities represent as a percentage of the portfolio of investments.
Sectors are based on Morningstar® classifications.
Portfolio composition subject to change.
top ten holdings
(% of Net Assets)
| 1. | Spectrum Brands Holdings, Inc. | 7.03% |
| 2. | United Natural Foods, Inc. | 6.70% |
| 3. | Icon PLC (Ireland) | 6.42% |
| 4. | Science Applications International Corp. | 5.56% |
| 5. | MPLX LP | 5.30% |
| 6. | Vistra Corp. | 5.18% |
| 7. | H&R Block, Inc. | 5.15% |
| 8. | The J.M. Smucker Co. | 4.71% |
| 9. | Hershey Co. | 4.21% |
| 10. | Pitney Bowes, Inc. | 4.19% |
| Total % of Net Assets | 54.45% |
ADDITIONAL INFORMATION
This contains important information about the Frank Value Fund – Institutional Class – FNKIX (the “Fund”) for the period July 1, 2025 to June 30, 2026.
You can find additional information about the Fund at https://frankfunds.com. You can also request the fund's Statutory Prospectus, financial information, holdings, and proxy voting information by contacting us at 1-888-217-5426.
expense Information
What were the Fund costs for the past year?
(based on a hypothetical $10,000 investment)
| Fund Name | Costs of a $10,000 investment | Costs paid as a percentage of a $10,000 investment * |
| Frank Value Fund – Institutional Class | $122 | 1.12% |
*Annualized
Management Discussion of Fund Performance
The Frank Value Fund Institutional Class returned 17.72% in the year ended June 30, 2026, compared to 26.62% for its benchmark, the Russell Midcap Value Index. In the five years ending June 30, 2026 Frank Value Fund Institutional Class returned 12.64% annualized, compared to 9.48% for the Russell Midcap Value Index.
Strategy
Frank Capital Partners, LLC, the advisor to the Frank Value Fund, employs a high-conviction absolute value investing strategy building a portfolio of 20 to 35 US-listed s/mid cap value equities. The strategy favors catalysts such as material share repurchases or debt reduction to unlock value. With an unconstrained, benchmark agnostic strategy, the manager maintains flexibility with the ability to invest outside of indices and freedom in sector weightings.
Techniques
The advisor’s security selection approach demanding low-valuation, high-quality, and unlocking catalysts also contributed to returns. The information below provides detailed descriptions of catalyst-driven allocations employed during the year.
Cantaloupe
The advisor initiated a position in Cantaloupe in September 2024 at an initial price of $5.99. Cantaloupe is a payment processor for vending machines and other automated stores, and despite recurring high profitability, the company remained immaterial in stock market indices. Frank Value Fund’s concentrated position delivered shareholders an outsized benefit when the company received a takeover offer, and the advisor sold the position in July 2025 for $11 and a gain of 83% in 10 months.
Garrett Motion
The advisor initiated a position in Garrett Motion in February 2024 at an initial price of $9. The market valued the company at $2.1 billion while free cash flow production was $400 million. Since February 2024, the company’s share count has declined from 242 million shares to 193 million, catalyzing rapid earnings per share growth. On April 30, 2026, the advisor deemed Garrett Motion fairly-valued, and Frank Value Fund sold its position in Garrett Motion at $24.98 for a gain of 178% excluding dividends.
We sincerely thank you for being a shareholder of the Frank Value Fund and look forward to working for you in the future.
Performance graph
AVERAGE ANNUAL RETURNS
|
One Year |
Five Year |
Ten Year | |
| Frank Value Fund – Institutional Class | 17.72% | 12.64% | 8.28% |
| Russell Mid Cap Value Index | 26.62% | 9.48% | 10.63% |
Cumulative Performance Comparison of $10,000 Investment
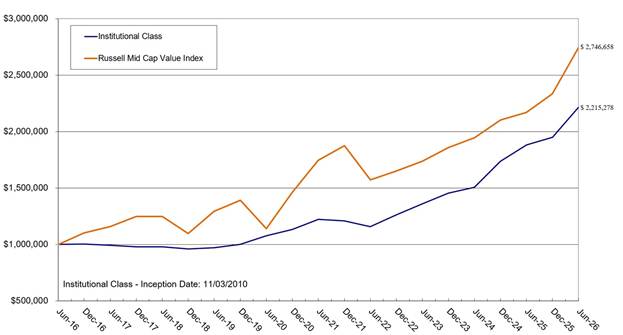
Past performance is not a good predictor of future performance. The returns shown do not reflect taxes that a shareholder would pay on Fund distributions or on the redemption of Fund shares. Updated performance data current to the most recent month-end can be obtained by calling 1-888-217-5426.
FUND STATISTICS
| PORTFOLIO | PORTFOLIO | ADVISORY FEES | |
| NET ASSETS: | HOLDINGS: | TURNOVER: | PAID BY FUND: |
| $35,659,512 | 26 | 95.89% | $286,712 |
PORTFOLIO ILLUSTRATION
The following chart gives a visual breakdown of the Fund by the sectors the underlying securities represent as a percentage of the portfolio of investments.
Sectors are based on Morningstar® classifications.
Portfolio composition subject to change.
top ten holdings
(% of Net Assets)
| 1. | Spectrum Brands Holdings, Inc. | 7.03% |
| 2. | United Natural Foods, Inc. | 6.70% |
| 3. | Icon PLC (Ireland) | 6.42% |
| 4. | Science Applications International Corp. | 5.56% |
| 5. | MPLX LP | 5.30% |
| 6. | Vistra Corp. | 5.18% |
| 7. | H&R Block, Inc. | 5.15% |
| 8. | The J.M. Smucker Co. | 4.71% |
| 9. | Hershey Co. | 4.21% |
| 10. | Pitney Bowes, Inc. | 4.19% |
| Total % of Net Assets | 54.45% |
ADDITIONAL INFORMATION
This contains important information about the Camelot Event-Driven Fund – Class A – EVDAX (the “Fund”) for the period July 1, 2025 to June 30, 2026.
You can find additional information about the Fund at https://www.cameloteventdrivenfund.com/prospectus-sec-filings. You can also request the fund's Statutory Prospectus, financial information, holdings, and proxy voting information by contacting us at 1-866-706-9790.
expense Information
What were the Fund costs for the past year?
(based on a hypothetical $10,000 investment)
| Fund Name | Costs of a $10,000 investment | Costs paid as a percentage of a $10,000 investment * |
| Camelot Event-Drive Fund – Class A | $217 | 2.12% |
*Annualized
Management Discussion of Fund Performance
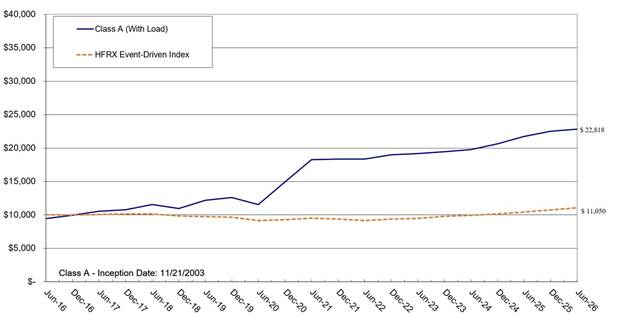
The Camelot Event-Driven Fund Class A returned 4.97% for the fiscal year ended June 30, 2026, compared to 5.78% for the HFRX Event-Driven Index.
The Fund maintained a cautious positioning throughout the year, employing hedges in its activist and special situations substrategy.
Strategy
Camelot Event-Driven Advisors, LLC, the advisor to the Camelot Event-Driven Fund, employs an event-driven strategy targeting pricing inefficiencies created by several types of company-specific events.
The fund continued to maintain its largest allocations to activist investments and special situations throughout the year. Activist activity was strong throughout the period. The fund initiated positions in Asian activist situations, specifically in Japan, which has seen an expansion of activist activity as the reforms initiated by former prime minister Abe are being implemented.
Merger arbitrage remains a relatively small allocation compared to allocations in the past. The fund has also exercised appraisal rights in a number of its portfolio holdings, which remain ongoing and take multiple years to complete.
As in recent years, distressed opportunities remain a small fraction of the portfolio. Restructurings of distressed bonds of Chinese real estate developers are ongoing. Despite its many announcements of measures to revive the housing market, follow-through by the Chinese government has been modest, validating the measured and cautious approach in sizing these investments.
I thank all of our investors for your continued support and investment and wish you a prosperous year.
Camelot Event-Driven Fund Portfolio Manager
Thomas Kirchner
Performance graph
AVERAGE ANNUAL RETURNS
|
One Year |
Five Year |
Ten Year | |
| Camelot Event Driven Fund - Class A (with load) | -0.80% | 3.39% | 8.60% |
| Camelot Event Driven Fund - Class A (without load) | 4.97% | 4.56% | 9.22% |
| HFRX Event-Driven Index | 5.78% | 3.06% | 1.00% |
Cumulative Performance Comparison of $10,000 Investment
Past performance is not a good predictor of future performance. The returns shown do not reflect taxes that a shareholder would pay on Fund distributions or on the redemption of Fund shares. Updated performance data current to the most recent month-end can be obtained by calling 1-866-706-9790.
FUND STATISTICS
| ADVISORY FEES | |||
| PORTFOLIO | PORTFOLIO | PAID BY FUND | |
| NET ASSETS: | HOLDINGS: | TURNOVER: | (NET OF WAIVERS): |
| $117,585,645 | 345 | 53.18% | $1,306,531 |
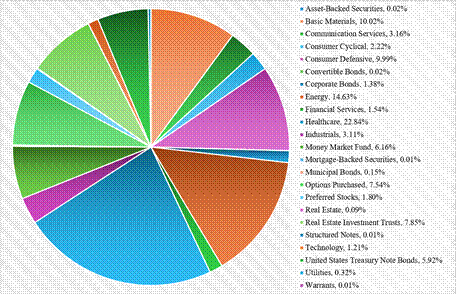
PORTFOLIO ILLUSTRATION
The following chart gives a visual breakdown of the Fund by the sectors or investment type, while the underlying securities represent as a percentage of the portfolio of investments.
Categorizations above are made using Morningstar® classifications.
Portfolio composition is subject to change.
Excludes written options and securities sold short.
top ten holdings
(% of Net Assets)
| 1. | Fidelity Investments Money Market Treasury Portfolio - Class III | 6.88% |
| 2. | Kimberly Clark Corp. | 5.32% |
| 3. | Crown Castle Inc. | 4.57% |
| 4. | Humana, Inc. | 4.56% |
| 5. | Medtronic PLC (Ireland) | 4.12% |
| 6. | BioMarin Pharmaceutical, Inc. | 3.57% |
| 7. | Occidental Petroleum Corp. | 3.51% |
| 8. | U.S. Treasury Note, 4.50%, 11/15/2033 | 3.44% |
| 9. | Newmont Corp. | 3.34% |
| 10. | Phillips 66 | 3.16% |
| Total % of Net Assets | 42.47% |
ADDITIONAL INFORMATION
This contains important information about the Camelot Event-Driven Fund – Institutional Class – EVDIX (the “Fund) for the period July 1, 2025 to June 30, 2026.
You can find additional information about the Fund at https://www.cameloteventdrivenfund.com/prospectus-sec-filings. You can also request the fund's Statutory Prospectus, financial information, holdings, and proxy voting information by contacting us at 1-866-706-9790.
expense Information
What were the Fund costs for the past year?
(based on a hypothetical $10,000 investment)
| Fund Name | Costs of a $10,000 investment | Costs paid as a percentage of a $10,000 investment * |
| Camelot Event-Drive Fund – Institutional Class | $192 | 1.87% |
*Annualized
Management Discussion of Fund Performance
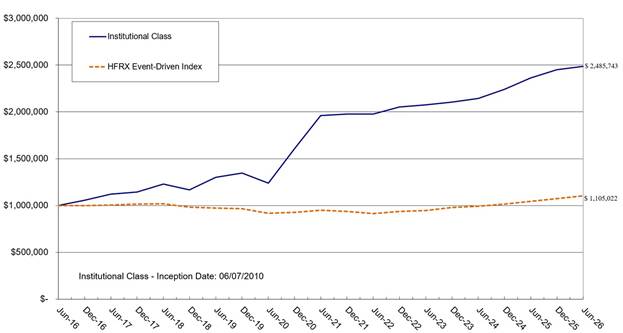
The Camelot Event-Driven Fund Institutional Class returned 5.24% for the fiscal year ended June 30, 2026, compared to 5.78% for the HFRX Event-Driven Index.
The Fund maintained a cautious positioning throughout the year, employing hedges in its activist and special situations substrategy.
Strategy
Camelot Event-Driven Advisors, LLC, the advisor to the Camelot Event-Driven Fund, employs an event-driven strategy targeting pricing inefficiencies created by several types of company-specific events.
The fund continued to maintain its largest allocations to activist investments and special situations throughout the year. Activist activity was strong throughout the period. The fund initiated positions in Asian activist situations, specifically in Japan, which has seen an expansion of activist activity as the reforms initiated by former prime minister Abe are being implemented.
Merger arbitrage remains a relatively small allocation compared to allocations in the past. The fund has also exercised appraisal rights in a number of its portfolio holdings, which remain ongoing and take multiple years to complete.
As in recent years, distressed opportunities remain a small fraction of the portfolio. Restructurings of distressed bonds of Chinese real estate developers are ongoing. Despite its many announcements of measures to revive the housing market, follow-through by the Chinese government has been modest, validating the measured and cautious approach in sizing these investments.
I thank all of our investors for your continued support and investment and wish you a prosperous year.
Camelot Event-Driven Fund Portfolio Manager
Thomas Kirchner
Performance graph
AVERAGE ANNUAL RETURNS
|
One Year |
Five Year |
Ten Year | |
| Camelot Event Driven Fund - Institutional Class | 5.24% | 4.84% | 9.53% |
| HFRX Event-Driven Index | 5.78% | 3.06% | 1.00% |
Cumulative Performance Comparison of $1,000,000 Investment
Past performance is not a good predictor of future performance. The returns shown do not reflect taxes that a shareholder would pay on Fund distributions or on the redemption of Fund shares. Updated performance data current to the most recent month-end can be obtained by calling 1-866-706-9790.
FUND STATISTICS
| ADVISORY FEES | |||
| PORTFOLIO | PORTFOLIO | PAID BY FUND | |
| NET ASSETS: | HOLDINGS: | TURNOVER: | (NET OF WAIVERS): |
| $117,585,645 | 345 | 53.18% | $1,306,531 |
PORTFOLIO ILLUSTRATION
The following chart gives a visual breakdown of the Fund by the sectors or investment type, while the underlying securities represent as a percentage of the portfolio of investments.
Categorizations above are made using Morningstar® classifications.
Portfolio composition is subject to change.
Excludes written options and securities sold short.
top ten holdings
(% of Net Assets)
| 1. | Fidelity Investments Money Market Treasury Portfolio - Class III | 6.88% |
| 2. | Kimberly Clark Corp. | 5.32% |
| 3. | Crown Castle Inc. | 4.57% |
| 4. | Humana, Inc. | 4.56% |
| 5. | Medtronic PLC (Ireland) | 4.12% |
| 6. | BioMarin Pharmaceutical, Inc. | 3.57% |
| 7. | Occidental Petroleum Corp. | 3.51% |
| 8. | U.S. Treasury Note, 4.50%, 11/15/2033 | 3.44% |
| 9. | Newmont Corp. | 3.34% |
| 10. | Phillips 66 | 3.16% |
| Total % of Net Assets | 42.47% |