Pay vs Performance Disclosure
|
12 Months Ended |
|
Jul. 03, 2026
USD ($)
|
Jun. 27, 2025
USD ($)
|
Jun. 28, 2024
USD ($)
|
Jun. 30, 2023
USD ($)
|
Jul. 01, 2022
USD ($)
|
| Pay vs Performance Disclosure |
|
|
|
|
|
| Pay vs Performance Disclosure, Table |
| | | | | | | | | | | | | | | | | | | | | | | | | | | | | | Year
(a) | Summary Compensation Table Total for William D. Mosley (1) (b) | Compensation Actually Paid to William D. Mosley (1)(2)(3) (c) | Average Summary Compensation
Table Total for
Non-PEO NEOs
(d) | Average Compensation Actually Paid to Non-PEO NEOs (2)(3) (e) | | Value of Initial Fixed $100 Investment Based On: (4) | Net Income ($)(m)
(h) | Company Selected Measure: ROIC (%)(5) (i) | | TSR
(f) | Peer Group TSR
(g) | | 2026 | $26,918,702 | $606,396,811 | $7,485,049 | $153,013,467 | | $1,094 | $250 | $3,184 | 146% | | 2025 | $17,176,927 | $57,393,073 | $5,546,701 | $14,650,182 | | $187 | $153 | $1,469 | 116% | | 2024 | $13,631,727 | $31,274,781 | $4,417,598 | $8,654,378 | | $133 | $157 | $335 | 64% | | 2023 | $11,436,208 | $4,811,598 | $3,270,494 | $171,402 | | $77 | $140 | $(529) | 16% | | 2022 | $13,210,318 | $3,559,186 | $6,482,662 | $3,153,551 | | $82 | $100 | $1,649 | 78% |
|
|
|
|
|
| Company Selected Measure Name |
return on invested capital
|
|
|
|
|
| Named Executive Officers, Footnote |
William D. Mosley was our PEO during all of our fiscal years 2022, 2023, 2024, 2025, and 2026. The individuals comprising the non-PEO NEOs for each fiscal year presented are: (i) in Fiscal Year 2026, Mr. Romano, Mr. Teh, Dr. Morris, and Mr. Lee, (ii) in Fiscal Year 2025, Mr. Romano, Mr. Teh, Dr. Morris, and Mr. Lee, (iii) in fiscal year 2024, Mr. Romano, Mr. Teh, Dr. Morris, and Mr. Chong, (iv) in fiscal year 2023, Mr. Romano, Mr. Teh, Ms. Katherine E. Schuelke, Mr. Jeffrey D. Nygaard, and Mr. Ravi Naik, (v) in fiscal year 2022, Mr. Romano, Mr. Nygaard, Mr. Naik, and Mr. Teh.
|
|
|
|
|
| Peer Group Issuers, Footnote |
The Peer Group TSR set forth in this table shows the cumulative total shareholder return with respect to the Dow Jones US Computer Hardware Index (“DJUSCR Index”), which we also utilized in the stock performance graph required by Item 201(e) of Regulation S-K included in our Annual Reports for the fiscal years 2022, 2023, 2024, 2025, and 2026. The Company’s TSR and the Peer Group TSR assume that a fixed amount of $100 was invested for the period starting July 2, 2021 (which is the last trading day of fiscal year 2021), through the end of the listed year in the company and in the DJUSCR Index, respectively. Historical stock performance is not necessarily indicative of future stock performance.
|
|
|
|
|
| PEO Total Compensation Amount |
$ 26,918,702
|
$ 17,176,927
|
$ 13,631,727
|
$ 11,436,208
|
$ 13,210,318
|
| PEO Actually Paid Compensation Amount |
$ 606,396,811
|
57,393,073
|
31,274,781
|
4,811,598
|
3,559,186
|
| Adjustment To PEO Compensation, Footnote |
The following provides additional information regarding the adjustments made to the amounts reported in the “Total” column of the Summary Compensation Table for our PEO and the non-PEO NEOs in order to determine Compensation Actually Paid. Fair Value amounts are calculated in accordance with FASB ASC Topic 718. | | | | | | | | | | | | | | | | | | | | | | | | | | | | | | | SCT (a) | Grant Date Value of New Awards (b) | Year-End Fair Value of New Awards (i) | Change in Value of Outstanding and Unvested Awards Granted in Prior Fiscal Years (ii) | Change in Value of Vested Awards Granted in Prior Fiscal Years (iii) | Fair Value of Vested Awards Granted and Vested in Current Fiscal Year (iv) | Fair Value at Start of Fiscal Year of Awards That Failed to Meet Vesting Conditions (v) | Total Equity Award Adjustments (c) = (i)+(ii)+(iii)+(iv)+(v) | CAP (a)-(b)+(c) | | | | PEO ($) | 26,918,702 | 25,636,115 | 251,303,928 | 313,798,003 | 40,012,293 | — | — | 605,114,224 | 606,396,811 | Non-PEO NEOs ($) | 7,485,049 | 6,856,991 | 63,401,476 | 78,784,865 | 10,199,068 | — | — | 152,385,409 | 153,013,467 |
|
|
|
|
|
| Non-PEO NEO Average Total Compensation Amount |
$ 7,485,049
|
5,546,701
|
4,417,598
|
3,270,494
|
6,482,662
|
| Non-PEO NEO Average Compensation Actually Paid Amount |
$ 153,013,467
|
14,650,182
|
8,654,378
|
171,402
|
3,153,551
|
| Adjustment to Non-PEO NEO Compensation Footnote |
The following provides additional information regarding the adjustments made to the amounts reported in the “Total” column of the Summary Compensation Table for our PEO and the non-PEO NEOs in order to determine Compensation Actually Paid. Fair Value amounts are calculated in accordance with FASB ASC Topic 718. | | | | | | | | | | | | | | | | | | | | | | | | | | | | | | | SCT (a) | Grant Date Value of New Awards (b) | Year-End Fair Value of New Awards (i) | Change in Value of Outstanding and Unvested Awards Granted in Prior Fiscal Years (ii) | Change in Value of Vested Awards Granted in Prior Fiscal Years (iii) | Fair Value of Vested Awards Granted and Vested in Current Fiscal Year (iv) | Fair Value at Start of Fiscal Year of Awards That Failed to Meet Vesting Conditions (v) | Total Equity Award Adjustments (c) = (i)+(ii)+(iii)+(iv)+(v) | CAP (a)-(b)+(c) | | | | PEO ($) | 26,918,702 | 25,636,115 | 251,303,928 | 313,798,003 | 40,012,293 | — | — | 605,114,224 | 606,396,811 | Non-PEO NEOs ($) | 7,485,049 | 6,856,991 | 63,401,476 | 78,784,865 | 10,199,068 | — | — | 152,385,409 | 153,013,467 |
|
|
|
|
|
| Compensation Actually Paid vs. Total Shareholder Return |
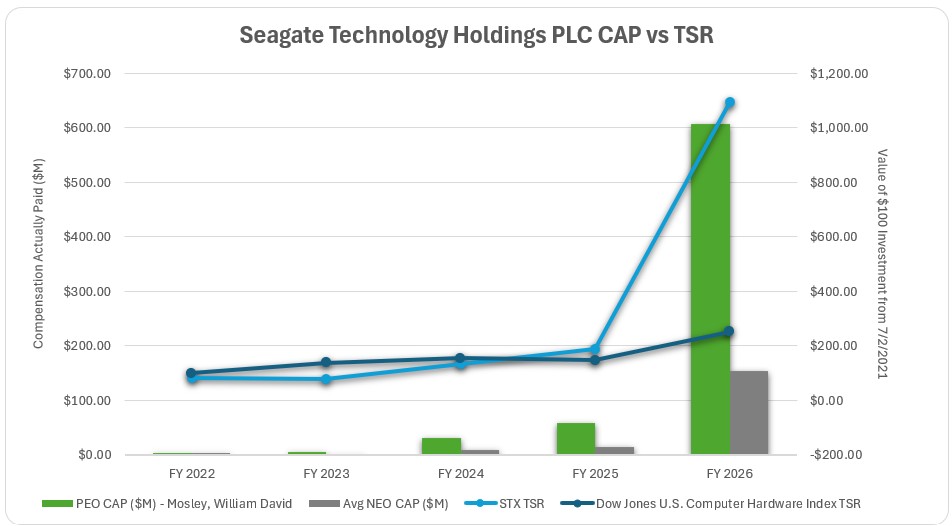
The following chart sets forth the relationship between Compensation Actually Paid to our PEO, the average of Compensation Actually Paid to our other NEOs, and the company’s and DJUSCR Index’s cumulative TSRs over the five most recently completed fiscal years. | | | | | | | | | | | | | | | | | | | Metric | FY 2022 | FY 2023 | FY 2024 | FY 2025 | FY 2026 | PEO CAP ($M) - Mosley, William D. | 3.56 | 4.81 | 31.27 | 57.39 | 606.40 | | Avg NEO CAP ($M) | 3.15 | 0.17 | 8.65 | 14.65 | 153.01 | | STX TSR ($) | 81.97 | 76.98 | 132.94 | 187.12 | 1,093.96 | | Dow Jones U.S. Computer Hardware Index TSR ($) | 99.77 | 140.36 | 157.38 | 152.95 | 250.43 |
|
|
|
|
|
| Compensation Actually Paid vs. Net Income |
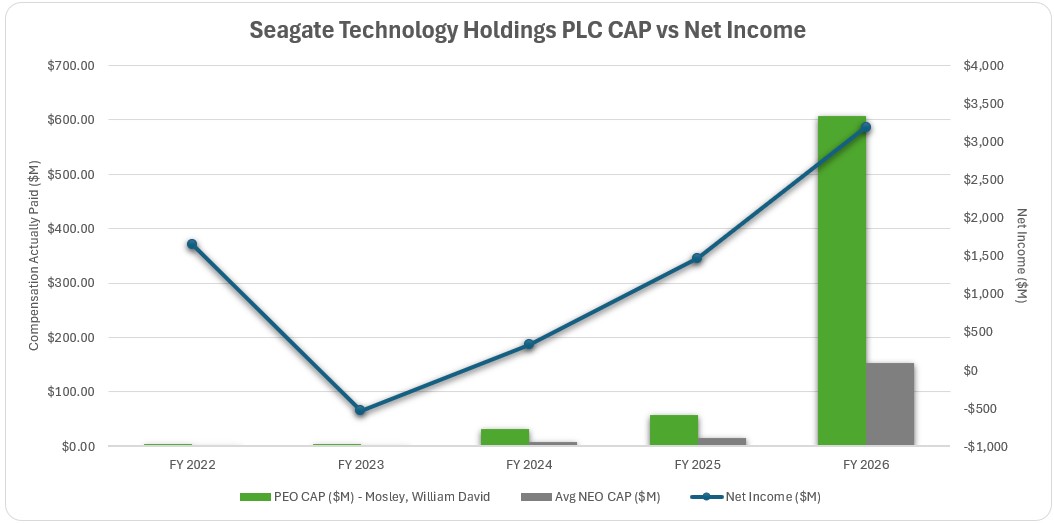
The following chart sets forth the relationship between Compensation Actually Paid to our PEO, the average of Compensation Actually Paid to our other NEOs, and our Net Income during the four most recently completed fiscal years. | | | | | | | | | | | | | | | | | | | Metric | FY 2022 | FY 2023 | FY 2024 | FY 2025 | FY 2026 | PEO CAP ($M) - Mosley, William D. | 3.56 | 4.81 | 31.27 | 57.39 | 606.40 | | Avg NEO CAP ($M) | 3.15 | 0.17 | 8.65 | 14.65 | 153.01 | | Net Income ($M) | 1,649 | (529) | 335 | 1,469 | 3,184 |
|
|
|
|
|
| Compensation Actually Paid vs. Company Selected Measure |
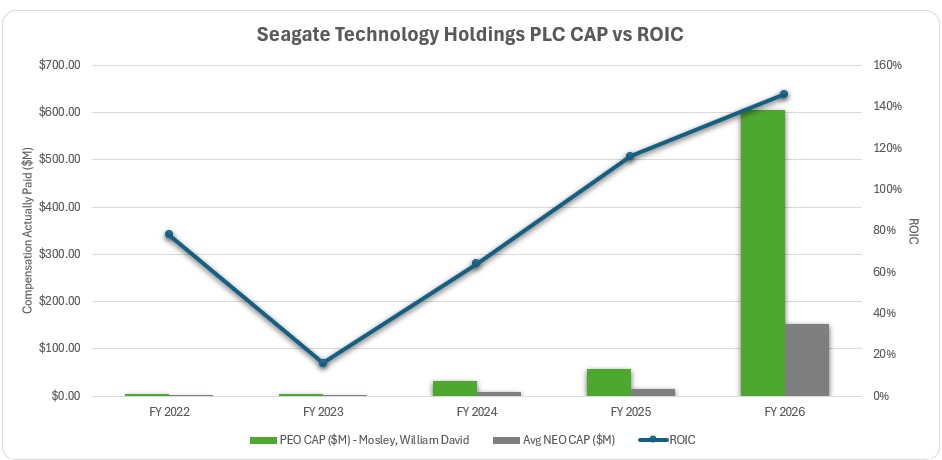
The following chart sets forth the relationship between Compensation Actually Paid to our PEO, the average of Compensation Actually Paid to our other NEOs, and our Company Selected Measure which was ROIC during the four most recently completed fiscal years. | | | | | | | | | | | | | | | | | | | Metric | FY 2022 | FY 2023 | FY 2024 | FY 2025 | FY 2026 | PEO CAP ($M) - Mosley, William D. | 3.56 | 4.81 | 31.27 | 57.39 | 606.40 | | Avg NEO CAP ($M) | 3.15 | 0.17 | 8.65 | 14.65 | 153.01 | | ROIC | 78% | 16% | 64% | 116% | 146% |
|
|
|
|
|
| Total Shareholder Return Vs Peer Group |
The following chart sets forth the relationship between Compensation Actually Paid to our PEO, the average of Compensation Actually Paid to our other NEOs, and the company’s and DJUSCR Index’s cumulative TSRs over the five most recently completed fiscal years. | | | | | | | | | | | | | | | | | | | Metric | FY 2022 | FY 2023 | FY 2024 | FY 2025 | FY 2026 | PEO CAP ($M) - Mosley, William D. | 3.56 | 4.81 | 31.27 | 57.39 | 606.40 | | Avg NEO CAP ($M) | 3.15 | 0.17 | 8.65 | 14.65 | 153.01 | | STX TSR ($) | 81.97 | 76.98 | 132.94 | 187.12 | 1,093.96 | | Dow Jones U.S. Computer Hardware Index TSR ($) | 99.77 | 140.36 | 157.38 | 152.95 | 250.43 |
|
|
|
|
|
| Tabular List, Table |
| | | | Performance Measures | | Relative TSR | Return on Invested Capital (“ROIC”) | Adjusted Operating Margin (“AOM”) | | Revenue | Total Customer Experience (“TCE”) |
|
|
|
|
|
| Total Shareholder Return Amount |
$ 1,094
|
187
|
133
|
77
|
82
|
| Peer Group Total Shareholder Return Amount |
250
|
153
|
157
|
140
|
100
|
| Net Income (Loss) |
$ 3,184,000,000
|
$ 1,469,000,000
|
$ 335,000,000
|
$ (529,000,000)
|
$ 1,649,000,000
|
| Company Selected Measure Amount |
1.46
|
1.16
|
0.64
|
0.16
|
0.78
|
| PEO Name |
William D. Mosley
|
|
|
|
|
| Additional 402(v) Disclosure |
The amounts shown for Compensation Actually Paid, or “CAP” have been calculated in accordance with Item 402(v) of Regulation S-K and do not reflect compensation actually earned, realized, or received by the Company’s NEOs during the applicable year. These amounts reflect the amounts reported in the “Total” column of the Summary Compensation Table with certain adjustments as described in footnote 3 below.We determined ROIC, or return on invested capital, to be the most important financial performance measure used to link company performance to Compensation Actually Paid to our PEOs and non-PEO NEOs in Fiscal Year 2026. This performance measure may not have been the most important financial performance measure for other fiscal years shown in the table above and we may determine a different financial performance measure to be the most important financial performance measure in future years. For Fiscal Years 2024, 2025, and 2026, ROIC is calculated as (i) adjusted operating income minus the non-GAAP tax expense (benefit), divided by (ii) (x) adjusted net plant, property, and equipment plus total current assets minus cash and cash equivalents, minus (y) total current liabilities excluding debt. For fiscal years 2022, and 2023, the calculation was determined using the same methodology, except for the numerator which was (i) adjusted operating income multiplied by (1 minus the average tax rate). All values represent U.S. GAAP results except adjusted operating income, non-GAAP tax expense (benefit), and adjusted net plant, property, and equipment. Adjusted operating income, used to determine ROIC, is operating income adjusted to exclude the impact of (a) share-based compensation expense and (b) material, unusual, or non-recurring gains and losses, accounting charges, or other extraordinary events that were not foreseen at the time the performance measure was established, in each case of (a) and (b), as publicly reported in the Company’s U.S. Non-GAAP financial measures each quarter. Adjusted net plant, property, and equipment includes net plant, property, and equipment and the net value of right of use assets acquired through finance leasing.
|
|
|
|
|
| Measure:: 1 |
|
|
|
|
|
| Pay vs Performance Disclosure |
|
|
|
|
|
| Name |
Relative TSR
|
|
|
|
|
| Measure:: 2 |
|
|
|
|
|
| Pay vs Performance Disclosure |
|
|
|
|
|
| Name |
Return on Invested Capital (“ROIC”)
|
|
|
|
|
| Measure:: 3 |
|
|
|
|
|
| Pay vs Performance Disclosure |
|
|
|
|
|
| Name |
Adjusted Operating Margin (“AOM”)
|
|
|
|
|
| Measure:: 4 |
|
|
|
|
|
| Pay vs Performance Disclosure |
|
|
|
|
|
| Name |
Revenue
|
|
|
|
|
| Measure:: 5 |
|
|
|
|
|
| Pay vs Performance Disclosure |
|
|
|
|
|
| Name |
Total Customer Experience (“TCE”)
|
|
|
|
|
| PEO |
|
|
|
|
|
| Pay vs Performance Disclosure |
|
|
|
|
|
| Adjustment to Compensation, Amount |
$ 605,114,224
|
|
|
|
|
| PEO | Aggregate Grant Date Fair Value of Equity Award Amounts Reported in Summary Compensation Table |
|
|
|
|
|
| Pay vs Performance Disclosure |
|
|
|
|
|
| Adjustment to Compensation, Amount |
(25,636,115)
|
|
|
|
|
| PEO | Year-end Fair Value of Equity Awards Granted in Covered Year that are Outstanding and Unvested |
|
|
|
|
|
| Pay vs Performance Disclosure |
|
|
|
|
|
| Adjustment to Compensation, Amount |
251,303,928
|
|
|
|
|
| PEO | Year-over-Year Change in Fair Value of Equity Awards Granted in Prior Years That are Outstanding and Unvested |
|
|
|
|
|
| Pay vs Performance Disclosure |
|
|
|
|
|
| Adjustment to Compensation, Amount |
313,798,003
|
|
|
|
|
| PEO | Vesting Date Fair Value of Equity Awards Granted and Vested in Covered Year |
|
|
|
|
|
| Pay vs Performance Disclosure |
|
|
|
|
|
| Adjustment to Compensation, Amount |
0
|
|
|
|
|
| PEO | Change in Fair Value as of Vesting Date of Prior Year Equity Awards Vested in Covered Year |
|
|
|
|
|
| Pay vs Performance Disclosure |
|
|
|
|
|
| Adjustment to Compensation, Amount |
40,012,293
|
|
|
|
|
| PEO | Prior Year End Fair Value of Equity Awards Granted in Any Prior Year that Fail to Meet Applicable Vesting Conditions During Covered Year |
|
|
|
|
|
| Pay vs Performance Disclosure |
|
|
|
|
|
| Adjustment to Compensation, Amount |
0
|
|
|
|
|
| Non-PEO NEO |
|
|
|
|
|
| Pay vs Performance Disclosure |
|
|
|
|
|
| Adjustment to Compensation, Amount |
152,385,409
|
|
|
|
|
| Non-PEO NEO | Aggregate Grant Date Fair Value of Equity Award Amounts Reported in Summary Compensation Table |
|
|
|
|
|
| Pay vs Performance Disclosure |
|
|
|
|
|
| Adjustment to Compensation, Amount |
(6,856,991)
|
|
|
|
|
| Non-PEO NEO | Year-end Fair Value of Equity Awards Granted in Covered Year that are Outstanding and Unvested |
|
|
|
|
|
| Pay vs Performance Disclosure |
|
|
|
|
|
| Adjustment to Compensation, Amount |
63,401,476
|
|
|
|
|
| Non-PEO NEO | Year-over-Year Change in Fair Value of Equity Awards Granted in Prior Years That are Outstanding and Unvested |
|
|
|
|
|
| Pay vs Performance Disclosure |
|
|
|
|
|
| Adjustment to Compensation, Amount |
78,784,865
|
|
|
|
|
| Non-PEO NEO | Vesting Date Fair Value of Equity Awards Granted and Vested in Covered Year |
|
|
|
|
|
| Pay vs Performance Disclosure |
|
|
|
|
|
| Adjustment to Compensation, Amount |
0
|
|
|
|
|
| Non-PEO NEO | Change in Fair Value as of Vesting Date of Prior Year Equity Awards Vested in Covered Year |
|
|
|
|
|
| Pay vs Performance Disclosure |
|
|
|
|
|
| Adjustment to Compensation, Amount |
10,199,068
|
|
|
|
|
| Non-PEO NEO | Prior Year End Fair Value of Equity Awards Granted in Any Prior Year that Fail to Meet Applicable Vesting Conditions During Covered Year |
|
|
|
|
|
| Pay vs Performance Disclosure |
|
|
|
|
|
| Adjustment to Compensation, Amount |
$ 0
|
|
|
|
|