What were the Value Fund costs for the year? (based on a hypothetical $10,000 investment)
| Costs of a $10,000 investment | Costs paid as a percentage of a $10,000 investment | |
| Institutional Class shares | $195 | 1.74% |
How did the Value Fund perform last year?
For the year ended June 30, 2026, the Value Fund returned 23.86%, outperforming the S&P 500® Total Return Index which returned 22.33%. The Value Fund outperformed the S&P 500 primarily because a small number of holdings produced exceptional gains — Applied Materials and Marvell Technology each appreciated more than 250%, Caterpillar more than 160%, and Alphabet nearly doubled — and because the Fund holds approximately 30 positions rather than 500, those gains carried far more weight in the portfolio than they did in the index. This was enough to overcome declines in Meta Platforms and Microsoft, the Value Fund's largest and third-largest holdings entering the year. The Value Fund's lower weighting in the very top index drivers, which had detracted from relative results in prior periods, was less costly this year as market gains were distributed more broadly across sectors.
What factors influenced performance during the past year?
| ● | The Fund benefitted from its semiconductor and semiconductor-equipment exposure, with Applied Materials, Marvell Technology, NVIDIA, and Broadcom driving gains on continued expansion of artificial-intelligence infrastructure spending. |
| ● | Additional strength came from Alphabet, the Fund's largest single contributor, and from industrials and health care, led by Caterpillar, General Electric, and UnitedHealth Group. |
| ● | These winners were partly offset by declines in Meta Platforms and Microsoft, the Fund's two largest detractors, with smaller weakness in Vistra Energy and Costco. |
| ● | Performance was shaped by a market that rewarded the suppliers of AI infrastructure more than the companies funding it, with shortages in memory and related components benefiting the Fund's semiconductor holdings. Rising long-term interest rates weighed on valuations for much of the year as inflation stayed above the Federal Reserve's target and expected rate cuts were deferred. Results were uneven: the Fund declined 5.8% in the March quarter, somewhat more than the index, as its larger holdings weighed on results, then returned 17.4% against 14.3% for the index in the June quarter, when leadership broadened toward health care, industrials, and financials. |
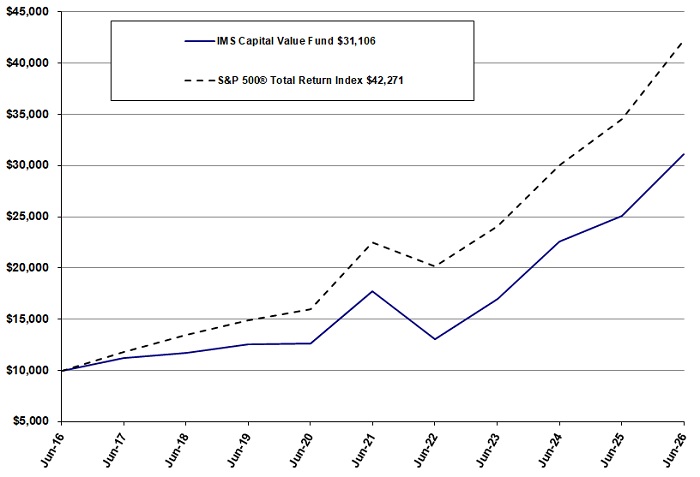
How has the Value Fund performed during the past 10 years?
| Cumulative Performance of a Hypothetical $10,000 Investment as-of June 30, 2026 |
| Average Annual Total Returns | ||||
| 1 Year | 5 Years | 10 Years | ||
| Institutional Class shares | 23.86% | 11.89% | 12.02% | |
| S&P 500® Total Return Index | 22.33% | 13.40% | 15.50% | |
What are some Value Fund statistics?
| Fund Statistics | |||
| Total Net Assets | $62,139,410 | Investment Advisory Fees Paid | $667,523 |
| Number of Portfolio Holdings | 28 | Portfolio Turnover Rate | 16.30% |
What did the Value Fund invest in?
| Sector Allocation (as a % of Portfolio) | |||
| Information Technology | 28.11% | Health Care | 6.70% |
| Financials | 16.71% | Consumer Staples | 3.35% |
| Communication Services | 16.51% | Utilities | 2.04% |
| Consumer Discretionary | 12.99% | Energy | 1.86% |
| Industrials | 10.78% | Cash & Cash Equivalents | 0.95% |
| Top Ten Holdings (as a % of Net Assets) | |||
| Alphabet, Inc. – Class C | 9.10% | UnitedHealth Group, Inc. | 5.07% |
| Meta Platforms, Inc. – Class A | 7.43% | Caterpillar, Inc. | 4.97% |
| NVIDIA Corp. | 6.44% | Broadcom, Inc. | 4.56% |
| Wells Fargo & Co. | 5.72% | Dutch Bros., Inc. – Class A | 4.39% |
| Amazon.com, Inc. | 5.58% | Apple, Inc. | 3.73% |
How has the Value Fund changed?
On August 26, 2025, Pinnacle Wealth Advisors, Inc. ("Pinnacle"), an Oregon corporation, agreed to acquire IMS Capital Management, Inc. ("IMS Capital"), an Oregon corporation and the former investment adviser to the Value Fund, effective as of September 30, 2025. Pinnacle now serves as the investment adviser to the Value Fund effective October 1, 2025.
During the reporting period, the Value Fund revised its principal investment strategy in connection with amendments to Rule 35d-1 under the Investment Company Act of 1940 (the 'Names Rule'), which now requires funds with terms like 'value' in their names to adopt a corresponding 80% investment policy. Effective October 28, 2025, the Value Fund revised its 80% policy to invest, under normal circumstances, at least 80% of its assets (net assets, plus the amount of any borrowings for investment purposes) in securities that Pinnacle considers having “value” characteristics. The Value Fund defines “value” as investments that appear to be undervalued relative to historical price, assets, earnings, growth potential, or cash flows. This is a summary of certain changes to the Value Fund since July 1, 2025. For more complete information, you may review the Value Fund's prospectus, dated October 28, 2025 at http://www.imsfunds.com/resources/or upon request at (877) 244-6235.
What were the Income Fund costs for the year? (based on a hypothetical $10,000 investment)
| Costs of a $10,000 investment | Costs paid as a percentage of a $10,000 investment | |
| Institutional Class shares | $202 | 1.96% |
How did the Income Fund perform last year?
For the year ended June 30, 2026, the Income Fund returned 5.63% with dividends reinvested, outperforming the Bloomberg Barclays U.S. Aggregate Bond Index which returned 3.79%. The Income Fund outperformed its benchmark because of its substantially higher income stream: the Fund paid monthly distributions totaling $0.16 per share against a beginning net asset value of $2.02, while net asset value declined $0.05 per share. That income was generate from investments in high-coupon corporate credit and from structured notes, which carry materially higher yields than the investment-grade bonds that dominate the index. Reducing the Fund's long-maturity Treasury holding by roughly half during the year also limited the effect of rising long-term rates.
What factors influenced performance during the past year?
| ● | Income, rather than price appreciation, produced substantially all of the Fund's return. Distributions totaled $0.16 per share, up from $0.15 per share in the prior fiscal year. |
| ● | Shorter-maturity, high-coupon credit was the most consistent positive contributor, including Staples, Service Properties Trust, Occidental Petroleum, and Bausch Health. Among common stock holdings, U.S. Bancorp appreciated approximately 32%. |
| ● | The largest detractors were longer-dated positions whose yields rose over the year: Paramount Global, Navient, and a JPMorgan Chase Financial structured note each declined 10% to 15%. |
| ● | Long-maturity exposure was again a drag, as inflation remained above the Federal Reserve's target and anticipated rate cuts were deferred, pushing the 30-year Treasury yield above 5% during the period. The Fund reduced its Treasury weighting from 15.5% to 7.6% of the portfolio, increased its structured note exposure, and raised its common stock allocation from 15.1% to 20.7%, rotating toward higher-yielding issuers. |
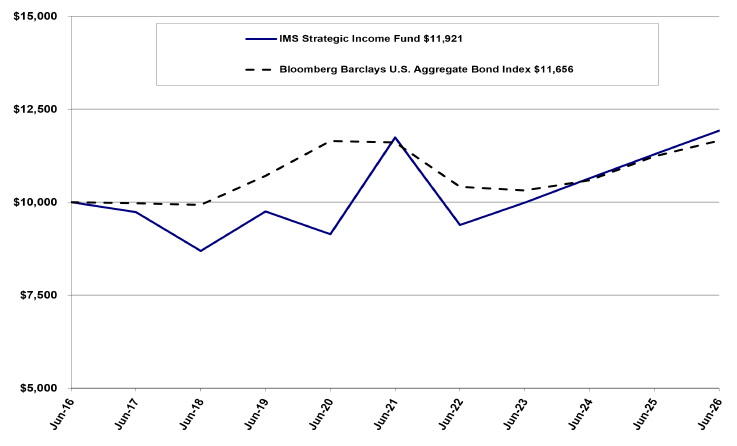
How has the Income Fund performed during the past 10 years?
| Cumulative Performance of a Hypothetical $10,000 Investment as-of June 30, 2026 |
| Average Annual Total Returns | ||||
| 1 Year | 5 Years | 10 Years | ||
| Institutional Class shares | 5.63% | 0.30% | 1.77% | |
| Bloomberg Barclays U.S. Aggregate Bond Index | 3.79% | 0.08% | 1.54% | |
What are some Income Fund statistics?
| Fund Statistics | |||
| Total Net Assets | $16,204,639 | Investment Advisory Fees Paid | $45,008 |
| Number of Portfolio Holdings | 32 | Portfolio Turnover Rate | 519.01% |
What did the Income Fund invest in?
| Investment Category Allocation (as a % of Portfolio) | |||
| Corporate Bonds | 40.04% | Government Bond | 7.63% |
| Structured Notes | 24.45% | Cash & Cash Equivalents | 7.36% |
| Common Stock | 20.52% | ||
| Top Ten Holdings (as a % of Net Assets) | |||
| United States Treasury Bond, 4.750%, due 02/15/2056 | 7.53% | Morgan Stanley Finance LLC, 7.760%, due 08/31/2036 | 4.10% |
| Federated Hermes Government Obligations Fund | 7.26% | Bank of Montreal, 6.000% due 07/17/2028 | 3.70% |
| Societe Generale SA, 10.000% due 05/01/2041 | 5.88% | UBS AG/London, 8.000%, due 03/09/2029 | 3.65% |
| Staples, Inc., 10.750%, due 04/15/2027 | 4.49% | Societe Generale SA, 10.000%, due 10/31/2038 | 3.52% |
| Service Properties Trust, 3.950%, due 01/15/2028 | 4.34% | Navient Corp., 5.625%, due 08/01/2033 | 3.45% |
How has the Income Fund changed?
On August 26, 2025, Pinnacle Wealth Advisors, Inc. ("Pinnacle"), an Oregon corporation, agreed to acquire IMS Capital Management, Inc. ("IMS Capital"), an Oregon corporation and the former investment adviser to the Income Fund, effective as of September 30, 2025. Pinnacle now serves as the investment adviser to the Income Fund effective October 1, 2025.