What were the Fund costs for the period?
(based on a hypothetical $10,000 investment)
|
Fund
Name |
Costs
of a $10,000 investment |
Costs
paid as a percentage of a $10,000 investment |
|---|---|---|
|
Golden
Eagle Dynamic Hypergrowth ETF |
$50 |
0.85%¹ |
| ¹ | Annualized. |
How did the Fund perform during the period?
For the period of January 1, 2026, to June 30, 2026, the Golden Eagle Dynamic Hypergrowth ETF (the “Fund”) returned 36.59%. Over the same period, the S&P 500® Index returned 10.21%.
What factors influenced performance?
The Fund systematically targets Hypergrowth Stocks, which are companies exhibiting extraordinary revenue growth. Unlike many traditional growth strategies that are often concentrated in large-cap technology stocks, the Fund employs a multi-sector, multi-cap approach, allowing portfolio exposures to shift as growth leadership changes across industries and market capitalizations. This dynamic approach contributed significantly to performance during the first half of 2026.
At the beginning of the period, the Fund maintained a significant allocation to metals and mining companies that met the strategy's stock selection criteria. As the period progressed, the Fund's systematic investment process identified stronger opportunities in other areas of the market, resulting in a reduction in metals and mining exposure. Overall, metals and mining holdings made a modest positive contribution to Fund performance during the period.
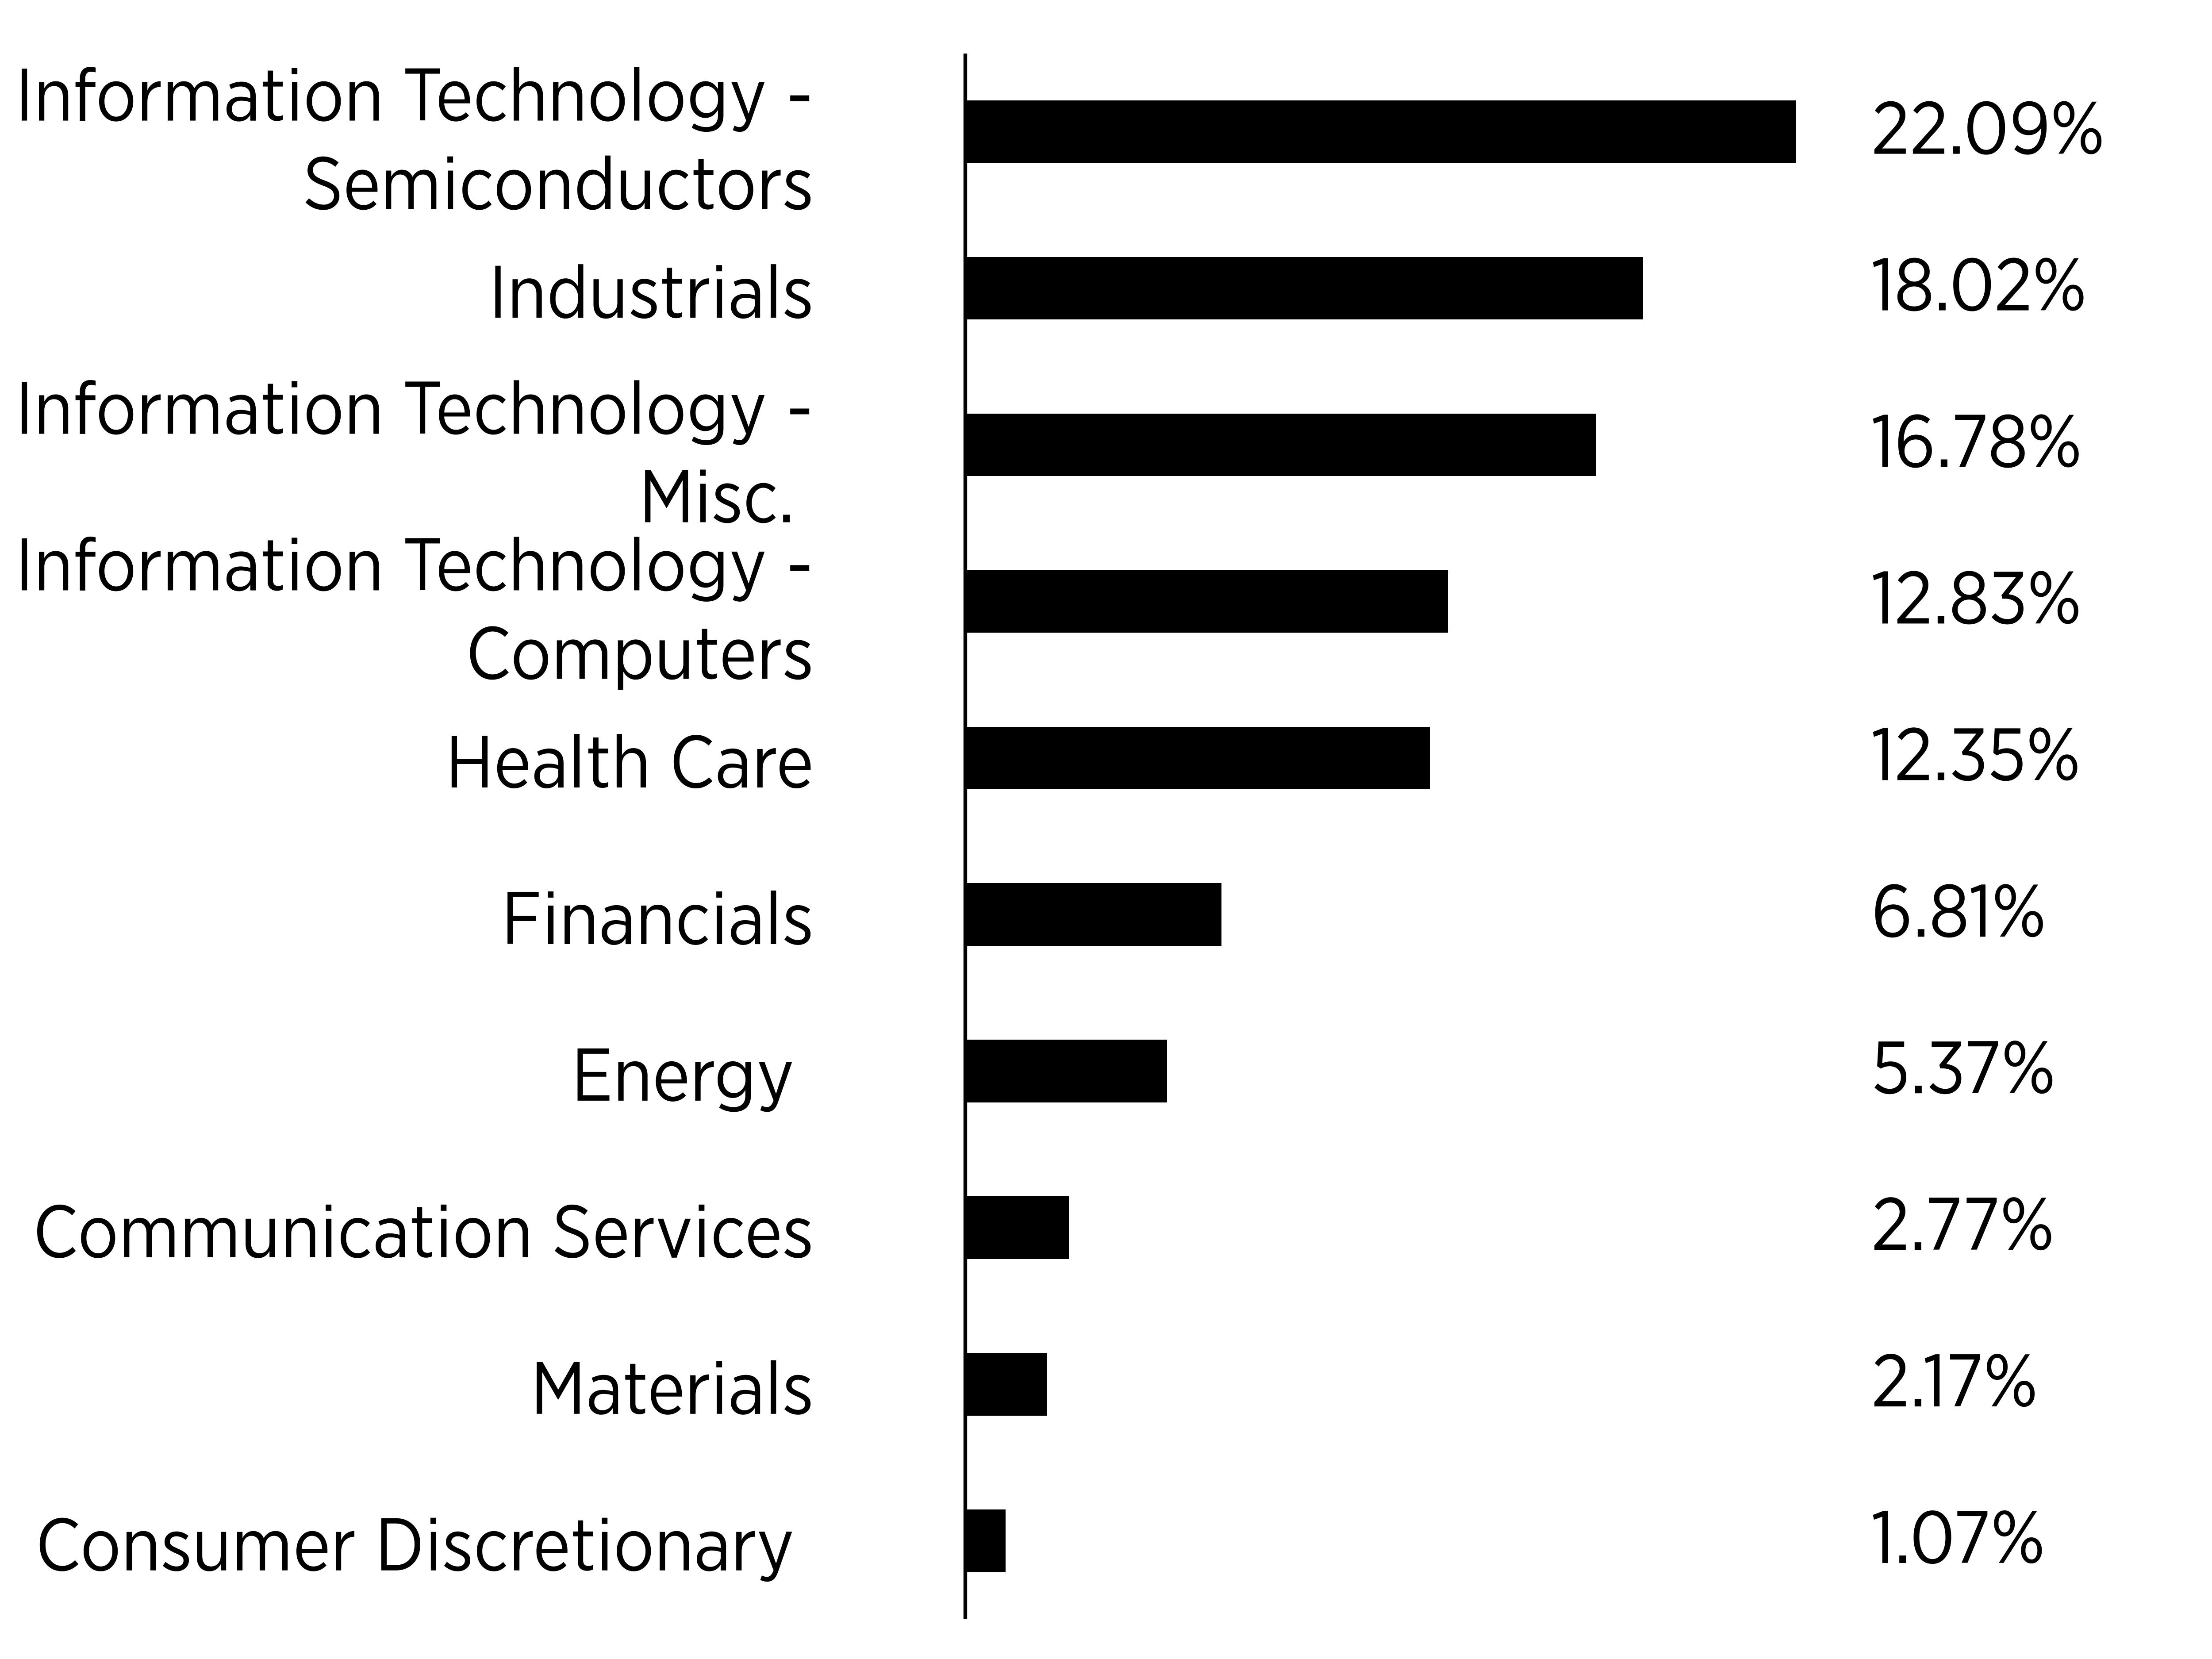
As exposure to metals and mining declined, the Fund's allocation to Information Technology increased, particularly semiconductor companies. This shift reflected changes in the companies meeting the Fund's growth criteria, resulting in a greater representation of technology-related businesses within the portfolio. The Information Technology sector generated the bulk of the Fund's gains during the first half of 2026. The Industrials sector was another modest contributor to performance during the first half while the aerospace and defense industry was the Fund’s only notable detractor during the period, producing a modest negative contribution to performance. As growth leadership evolved during the period, the portfolio adjusted accordingly.
Cumulative Performance
(based on a hypothetical $10,000 investment)
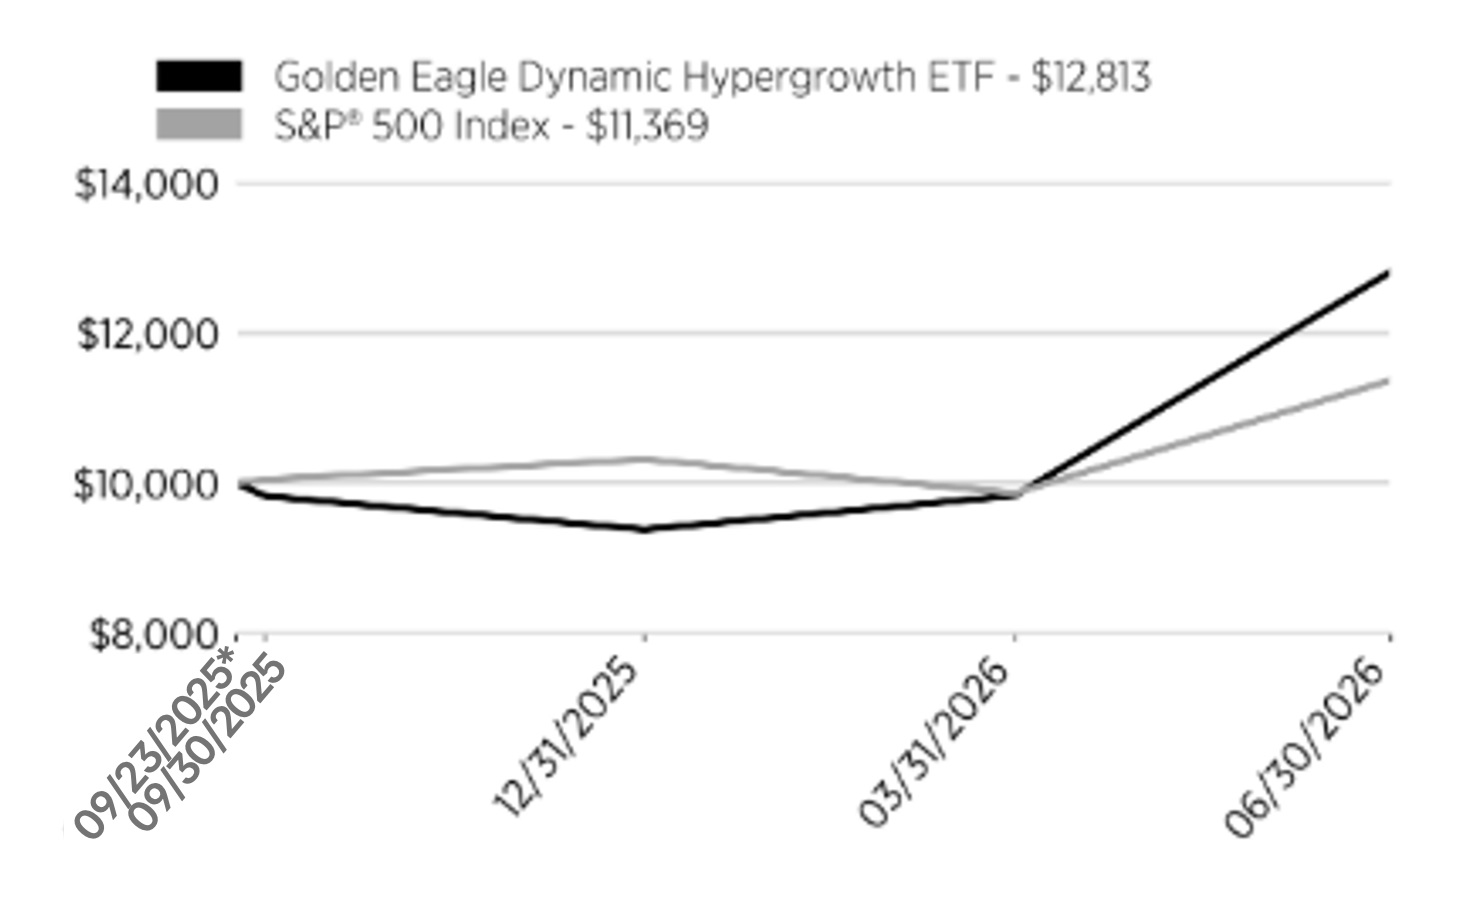
*Inception
Annual Performance
|
|
Total
Return
Since
Inception |
|---|---|
|
Golden
Eagle Dynamic Hypergrowth ETF |
28.13% |
|
S&P®
500 Index |
13.69% |
Key Fund Statistics
(as of June 30, 2026)
|
Fund
Net Assets |
$86,377,755 |
|
Number
of Holdings |
60 |
|
Total
Net Advisory Fee |
$123,359 |
|
Portfolio
Turnover Rate |
321.90% |
Sector Breakdown
|
Top
10 Holdings |
|
|---|---|
|
MaxLinear,
Inc. |
|
|
Argan,
Inc. |
|
|
Dell
Technologies |
|
|
Seagate
Technology Holdings plc |
|
|
Comfort
Systems USA, Inc. |
|
|
Modine
Manufacturing Co. |
|
|
Ouster,
Inc. |
|
|
AMN
Healthcare Services, Inc. |
|
|
Western
Digital Corp. |
|
|
Oscar
Health, Inc. |
| [1] | Annualized. |