
Exhibit 99.2
Member FDIC. © 2026 United Community Bank | ucbi.com Building a Stronger, More Resilient United September 8, 2026
Disclosures 2 CAUTIONARY STATEMENT This Investor Presentation contains “forward - looking statements” within the meaning of Section 27 A of the Securities Act of 1933 , as amended, and Section 21 E of the Securities Exchange Act of 1934 , as amended . In general, forward - looking statements usually may be identified through use of words such as “may,” “believe,” “expect,” “anticipate,” “intend,” “will,” “should,” “plan,” “estimate,” “predict,” “continue” and “potential,” or the negative of these terms or other comparable terminology . Forward - looking statements are not historical facts and represent management’s beliefs, based upon information available at the time the statements are made, with regard to the matters addressed; they are not guarantees of future performance . Actual results may prove to be materially different from the results expressed or implied by the forward - looking statements . Forward looking statements in this presentation include our statements about the effects of the acquisition of Peach State Bancshares, Inc . ("Peach State") and our balance sheet repositioning on our future earnings and earnings per share, risk profile, loan growth and certain operating ratios . Forward - looking statements are subject to numerous assumptions, risks and uncertainties that change over time and could cause actual results or financial condition to differ materially from those expressed in or implied by such statements . Factors that could cause or contribute to such differences include, but are not limited to ( 1 ) the risk that the financial benefits from the acquisition of Peach State, the sale of the Navitas equipment finance business (“Navitas”) or our balance sheet repositioning (each a “Transaction” and collectively, the “Transactions”) may not be realized or take longer than anticipated to be realized, ( 2 ) disruption from the Transactions of customer, supplier, employee or other business partner relationships, ( 3 ) differences between the actual and assumed timing, amount, pricing and composition of securities sold or purchased in connection with the balance sheet repositioning, ( 4 ) differences between actual and assumed reinvestment yields, ( 5 ) strategic, market, credit, operational, liquidity and interest rate risks associated with United’s business, ( 6 ) the possibility that the costs, fees, expenses and charges related to the Transactions may be greater than anticipated, ( 7 ) reputational risk and the reaction of each of the companies’ customers, suppliers, employees or other business partners to the Transactions, ( 8 ) the risks relating to the integration of Peach State’s operations into the operations of United, including the risk that such integration will be materially delayed or will be more costly or difficult than expected, ( 9 ) the risk of potential litigation or regulatory action related to the Transactions, ( 10 ) the risks associated with United’s pursuit of future acquisitions, ( 11 ) the risk of expansion into new geographic or product markets, and ( 12 ) general competitive, economic, political and market conditions . Further information regarding additional factors which could affect the forward - looking statements can be found in the cautionary language included under the headings “Cautionary Note Regarding Forward - Looking Statements” and “Risk Factors” in United’s Annual Report on Form 10 - K for the year ended December 31 , 2025 , and other documents subsequently filed by United with the U . S . Securities and Exchange Commission (“SEC”) . Many of these factors are beyond United’s ability to control or predict . If one or more events related to these or other risks or uncertainties materialize, or if the underlying assumptions prove to be incorrect, actual results may differ materially from the forward - looking statements . Accordingly, shareholders and investors should not place undue reliance on any such forward - looking statements . Any forward - looking statement speaks only as of the date of this communication, and United undertakes no obligation to update or revise any forward - looking statements, whether as a result of new information, future events or otherwise, except as required by law . New risks and uncertainties may emerge from time to time, and it is not possible for United to predict their occurrence or how they will affect United . United qualifies all forward - looking statements by these cautionary statements . NON - GAAP MEASURES This Investor Presentation includes financial information determined by methods other than in accordance with generally accepted accounting principles (“GAAP”) . This financial information includes certain operating performance measures, which exclude merger - related and other charges that are not considered part of recurring operations, such as “operating earnings per share,” “tangible book value per common share,” “operating return on assets,” and “tangible common equity to tangible assets . ” These non - GAAP measures are included because United believes they may provide useful supplemental information for evaluating United’s underlying performance trends . Further, United’s management uses these measures in managing and evaluating United’s business and intends to refer to them in discussions about United’s operations and performance . These measures should be viewed in addition to, and not as an alternative to or substitute for, measures determined in accordance with GAAP, and are not necessarily comparable to non - GAAP measures that may be presented by other companies . To the extent applicable, reconciliations of these non - GAAP measures to the most directly comparable measures as reported in accordance with GAAP are included with the accompanying financial statement tables .
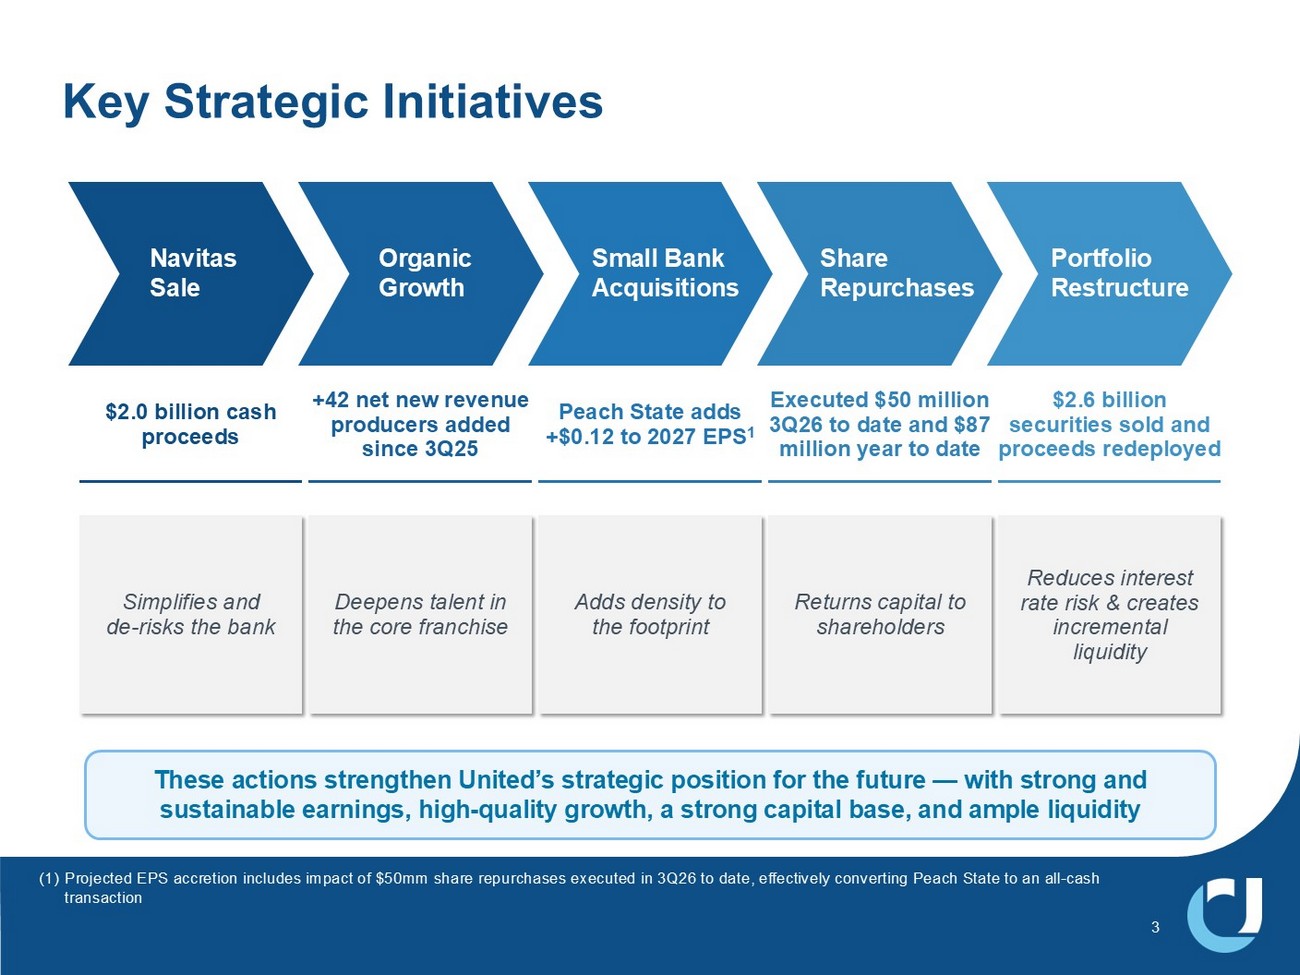
3 Key Strategic Initiatives These actions strengthen United’s strategic position for the future — with strong and sustainable earnings, high - quality growth, a strong capital base, and ample liquidity $2.0 billion cash proceeds Simplifies and de - risks the bank +42 net new revenue producers added since 3Q25 Deepens talent in the core franchise Peach State adds +$0.12 to 2027 EPS 1 Adds density to the footprint Executed $50 million 3Q26 to date and $87 million year to date Returns capital to shareholders $2.6 billion securities sold and proceeds redeployed Reduces interest rate risk & creates incremental liquidity Portfolio Restructure Share Repurchases Small Bank Acquisitions Organic Growth Navitas Sale (1) Projected EPS accretion includes impact of $50mm share repurchases executed in 3Q26 to date, effectively converting Peach Sta te to an all - cash transaction
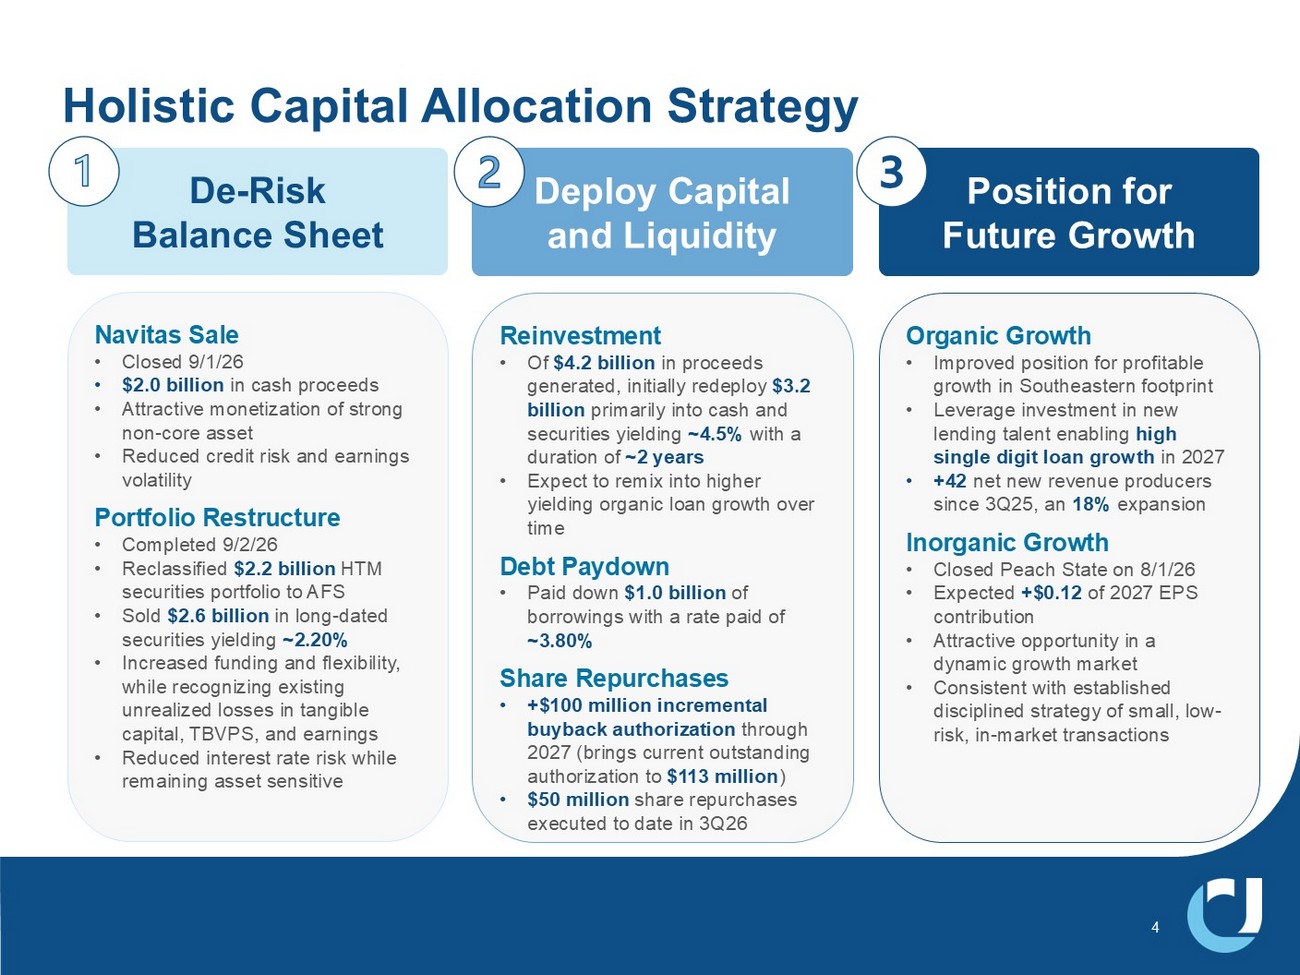
4 Holistic Capital Allocation Strategy De - Risk Balance Sheet Navitas Sale • Closed 9/1/26 • $2.0 billion in cash proceeds • Attractive monetization of strong non - core asset • Reduced credit risk and earnings volatility Portfolio Restructure • Completed 9/2/26 • Reclassified $2.2 billion HTM securities portfolio to AFS • Sold $2.6 billion in long - dated securities yielding ~2.20% • Increased funding and flexibility, while recognizing existing unrealized losses in tangible capital, TBVPS, and earnings • Reduced interest rate risk while remaining asset sensitive Deploy Capital and Liquidity Reinvestment • Of $4.2 billion in proceeds generated, initially redeploy $3.2 billion primarily into cash and securities yielding ~4.5% with a duration of ~2 years • Expect to remix into higher yielding organic loan growth over time Debt Paydown • Paid down $1.0 billion of borrowings with a rate paid of ~3.80% Share Repurchases • +$100 million incremental buyback authorization through 2027 (brings current outstanding authorization to $113 million ) • $50 million share repurchases executed to date in 3Q26 Position for Future Growth Organic Growth • Improved position for profitable growth in Southeastern footprint • Leverage investment in new lending talent enabling high single digit loan growth in 2027 • +42 net new revenue producers since 3Q25, an 18% expansion Inorganic Growth • Closed Peach State on 8/1/26 • Expected +$0.12 of 2027 EPS contribution • Attractive opportunity in a dynamic growth market • Consistent with established disciplined strategy of small, low - risk, in - market transactions
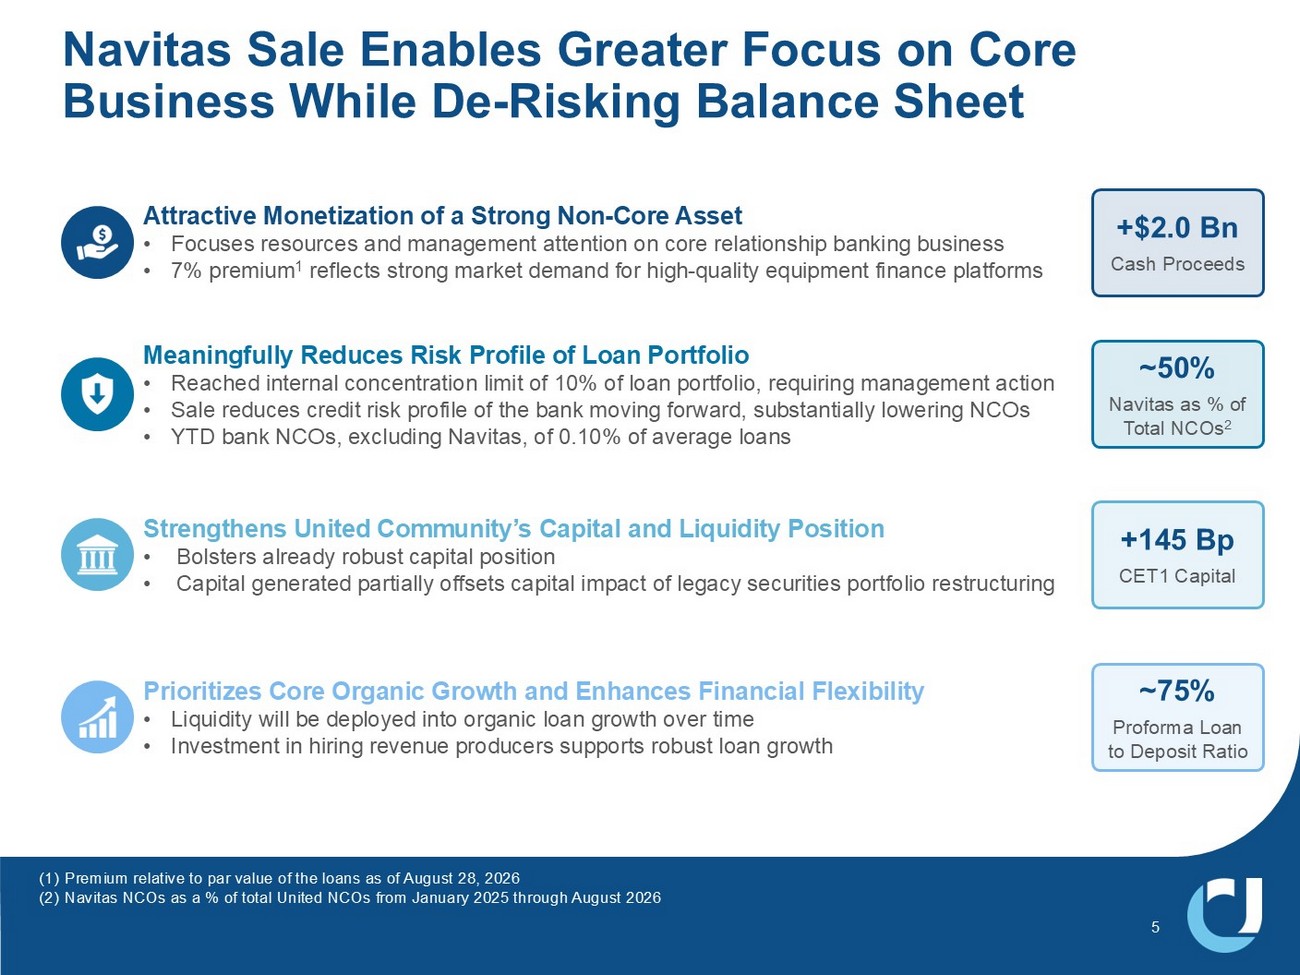
5 Navitas Sale Enables Greater Focus on Core Business While De - Risking Balance Sheet Meaningfully Reduces Risk Profile of Loan Portfolio • Reached internal concentration limit of 10% of loan portfolio, requiring management action • Sale reduces credit risk profile of the bank moving forward, substantially lowering NCOs • YTD bank NCOs, excluding Navitas, of 0.10% of average loans Strengthens United Community’s Capital and Liquidity Position • Bolsters already robust capital position • Capital generated partially offsets capital impact of legacy securities portfolio restructuring Prioritizes Core Organic Growth and Enhances Financial Flexibility • Liquidity will be deployed into organic loan growth over time • Investment in hiring revenue producers supports robust loan growth Attractive Monetization of a Strong Non - Core Asset • Focuses resources and management attention on core relationship banking business • 7% premium 1 reflects strong market demand for high - quality equipment finance platforms +$2.0 Bn Cash Proceeds ~50% Navitas as % of Total NCOs 2 +145 Bp CET1 Capital ~75% Proforma Loan to Deposit Ratio (1) Premium relative to par value of the loans as of August 28, 2026 (2) Navitas NCOs as a % of total United NCOs from January 2025 through August 2026
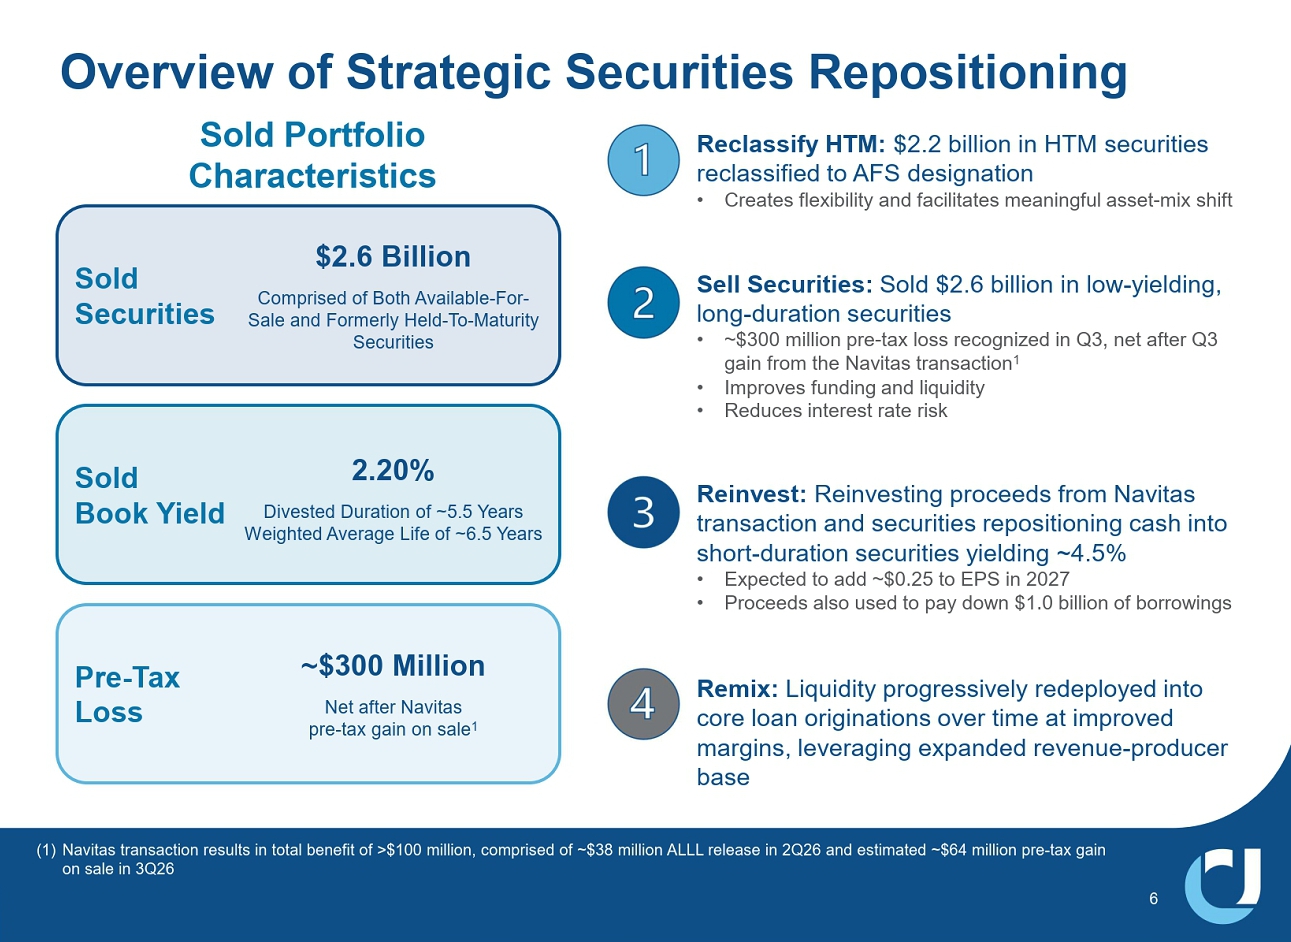
6 Overview of Strategic Securities Repositioning Sold Portfolio Characteristics Sold Securities Sold Book Yield Pre - Tax Loss 2.20% Divested Duration of ~5.5 Years Weighted Average Life of ~6.5 Years ~$300 Million Net after Navitas pre - tax gain on sale 1 $2.6 Billion Comprised of Both Available - For - Sale and Formerly Held - To - Maturity Securities (1) Navitas transaction results in total benefit of >$100 million, comprised of ~$38 million ALLL release in 2Q26 and estimated ~ $64 million pre - tax gain on sale in 3Q26 Reclassify HTM: $2.2 billion in HTM securities reclassified to AFS designation • Creates flexibility and facilitates meaningful asset - mix shift Reinvest: Reinvesting proceeds from Navitas transaction and securities repositioning cash into short - duration securities yielding ~4.5% • Expected to add approximately $0.24 to EPS in 2027 • Proceeds also used to pay down $1.0 billion of borrowings Sell Securities: Sold $2.6 billion in low - yielding, long - duration securities • ~$300 million pre - tax loss recognized in Q3, net after Q3 gain from the Navitas transaction 1 • Improves funding and liquidity • Reduces interest rate risk Remix: Liquidity progressively redeployed into core loan originations over time at improved margins, leveraging expanded revenue - producer base
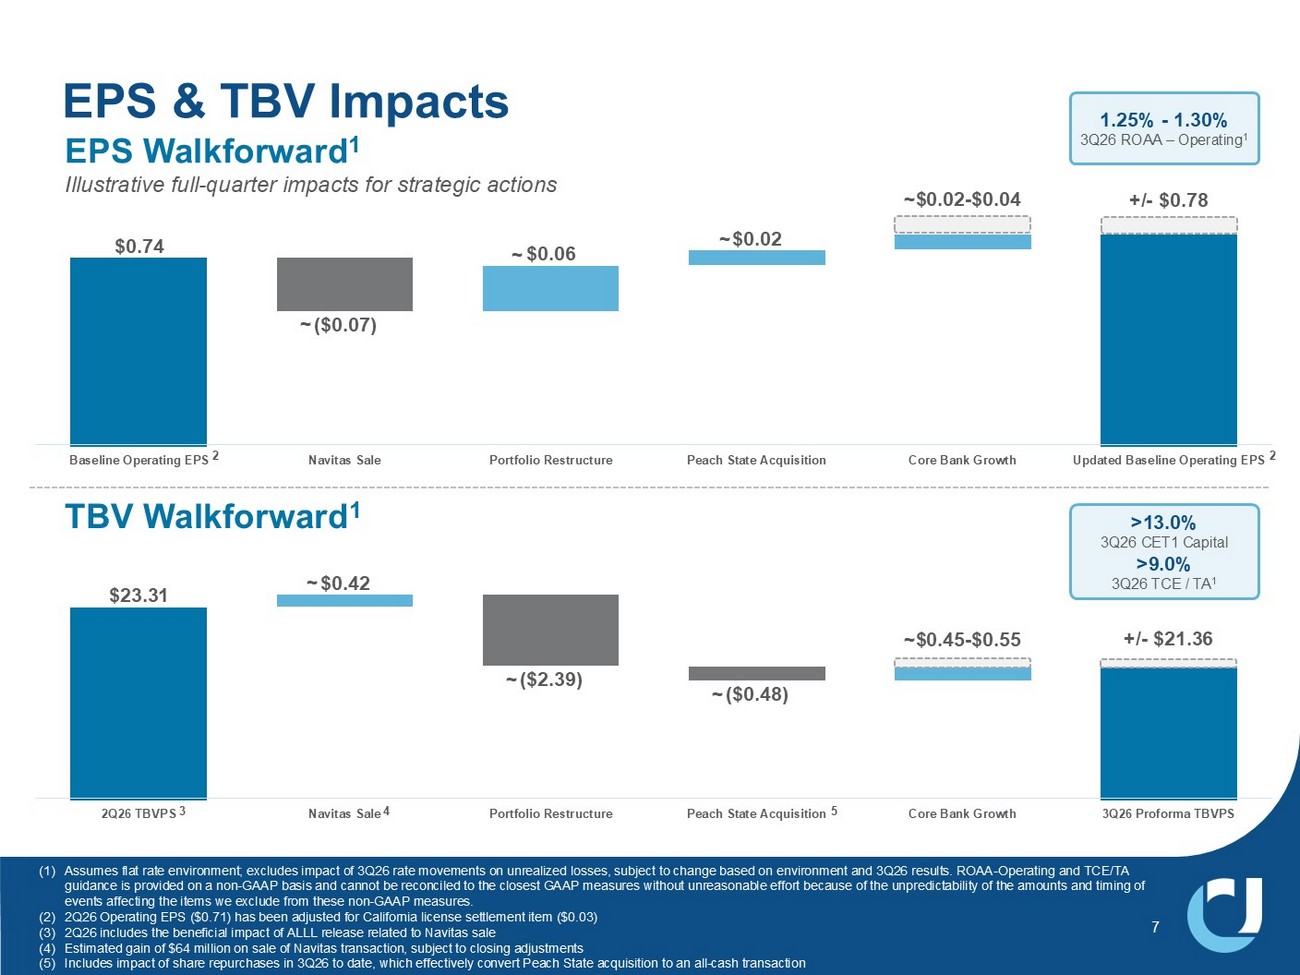
7 EPS & TBV Impacts $0.74 ($0.07) $0.06 $0.02 Baseline Operating EPS Navitas Sale Portfolio Restructure Peach State Acquisition Core Bank Growth Updated Baseline Operating EPS EPS Walkforward 1 Illustrative full - quarter impacts for strategic actions $23.31 $0.42 ($2.39) ($0.48) 2Q26 TBVPS Navitas Sale Portfolio Restructure Peach State Acquisition Core Bank Growth 3Q26 Proforma TBVPS TBV Walkforward 1 (1) Assumes flat rate environment; excludes impact of 3Q26 rate movements on unrealized losses, subject to change based on enviro nme nt and 3Q26 results. ROAA - Operating and TCE/TA guidance is provided on a non - GAAP basis and cannot be reconciled to the closest GAAP measures without unreasonable effort becau se of the unpredictability of the amounts and timing of events affecting the items we exclude from these non - GAAP measures. (2) 2Q26 Operating EPS ($0.71) has been adjusted for California license settlement item ($0.03) (3) 2Q26 includes the beneficial impact of ALLL release related to Navitas sale (4) Estimated gain of $64 million on sale of Navitas transaction, subject to closing adjustments (5) Includes impact of share repurchases in 3Q26 to date, which effectively convert Peach State acquisition to an all - cash transacti on 3 5 2 4 1.25% - 1.30% 3Q26 ROAA – Operating 1 >13.0% 3Q26 CET1 Capital >9.0% 3Q26 TCE / TA 1 ~ ~ ~ ~$0.02 - $0.04 +/ - $0.78 ~ ~ ~ ~$0.45 - $0.55 +/ - $21.36 2
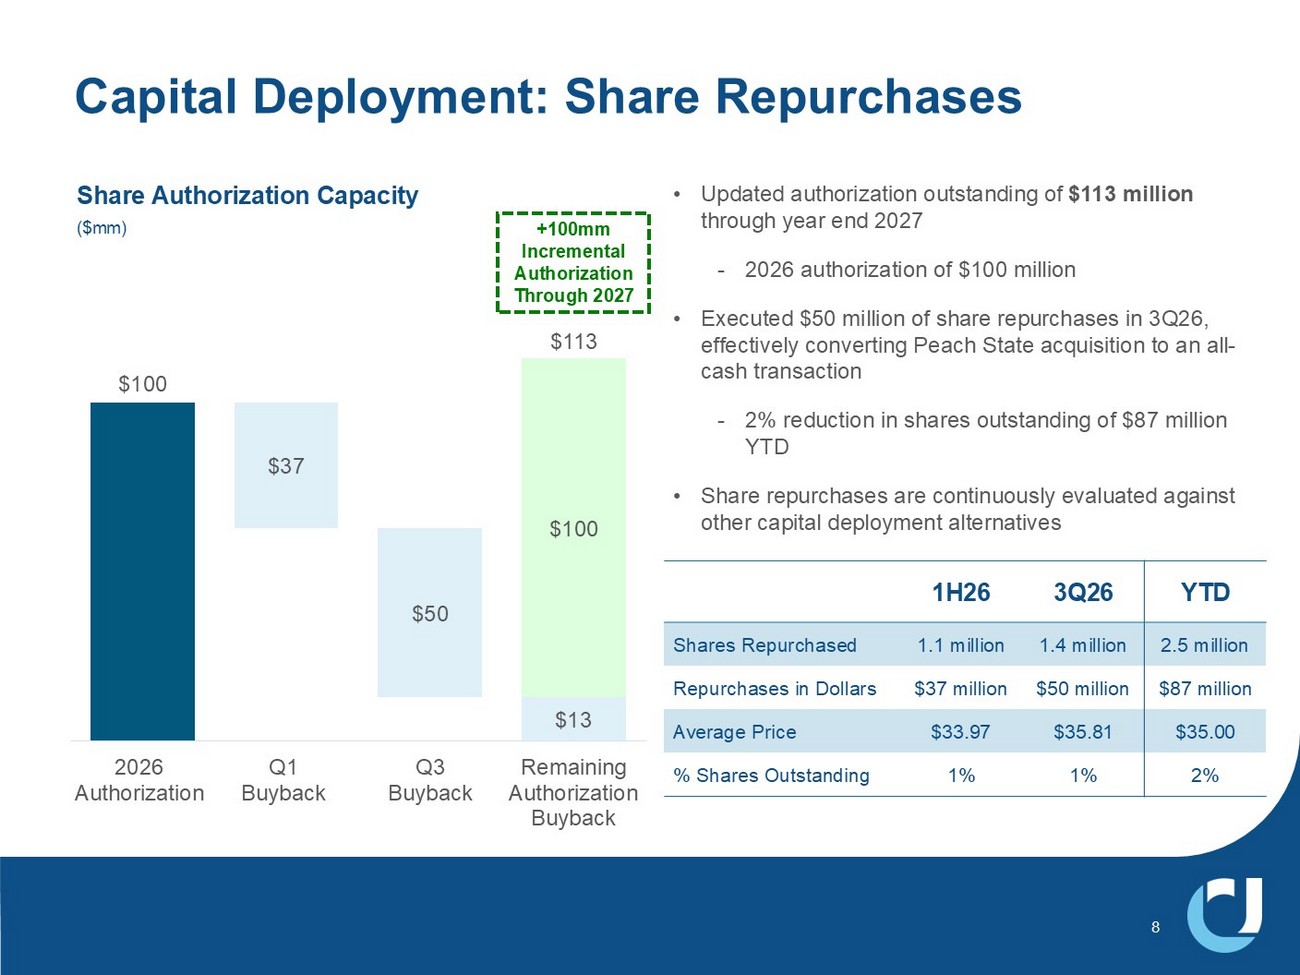
$100 $13 $37 $50 $100 $113 2026 Authorization Q1 Buyback Q3 Buyback Remaining Authorization Buyback Capital Deployment: Share Repurchases • Updated authorization outstanding of $113 million through year end 2027 - 2026 authorization of $100 million • Executed $50 million of share repurchases in 3Q26, effectively converting Peach State acquisition to an all - cash transaction - 2% reduction in shares outstanding of $87 million YTD • Share repurchases are continuously evaluated against other capital deployment alternatives +100mm Incremental Authorization Through 2027 Share Authorization Capacity ($mm) YTD 3Q26 1H26 2.5 million 1.4 million 1.1 million Shares Repurchased $87 million $50 million $37 million Repurchases in Dollars $35.00 $35.81 $33.97 Average Price 2% 1% 1% % Shares Outstanding 8
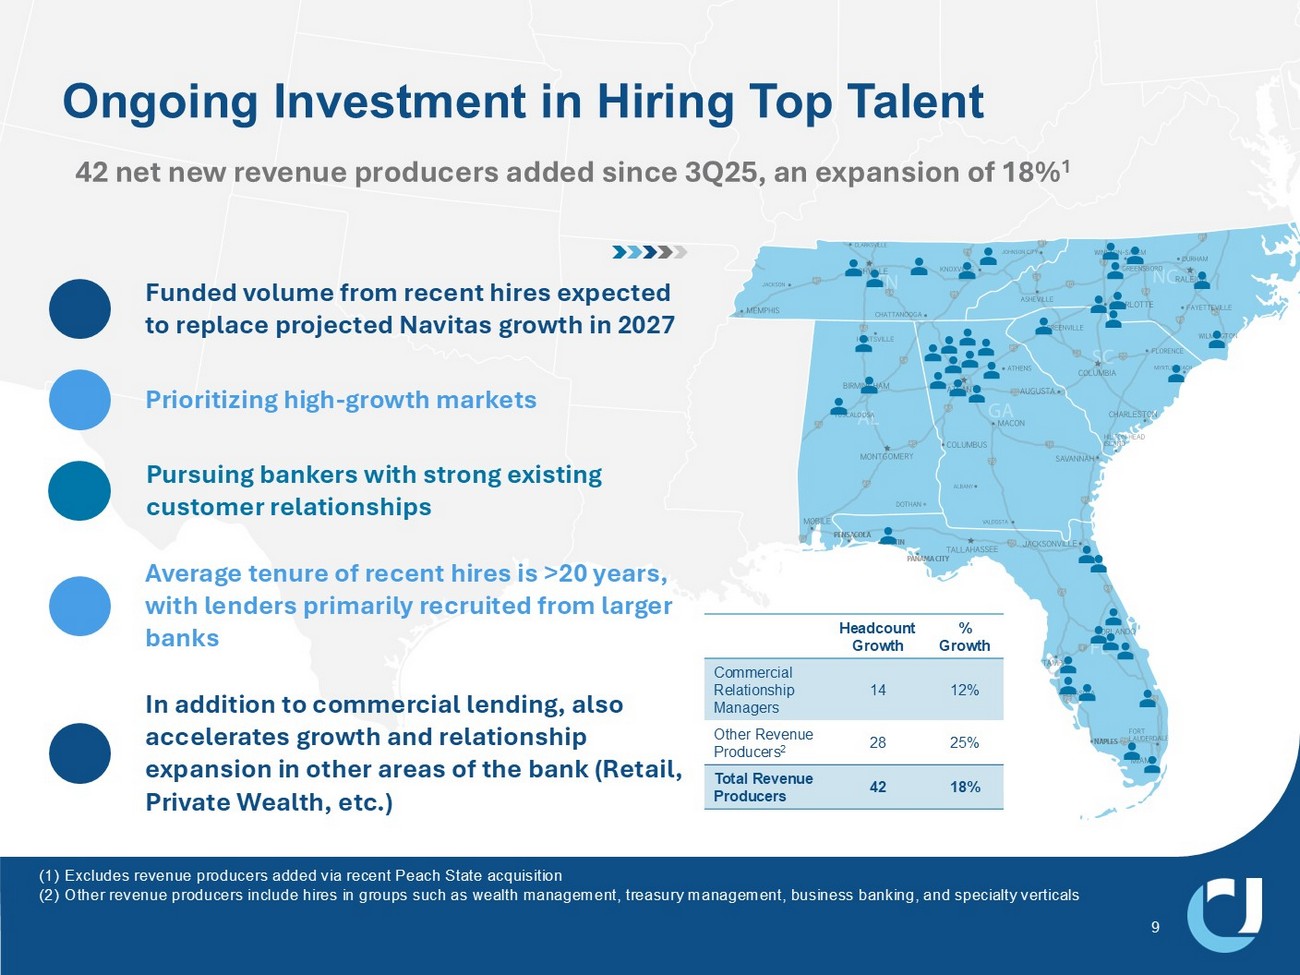
9 Ongoing Investment in Hiring Top Talent 42 net new revenue producers added since 3Q25, an expansion of 18% 1 Prioritizing high - growth markets Pursuing bankers with strong existing customer relationships In addition to commercial lending, also accelerates growth and relationship expansion in other areas of the bank (Retail, Private Wealth, etc.) Average tenure of recent hires is >20 years, with lenders primarily recruited from larger banks Funded volume from recent hires expected to replace projected Navitas growth in 2027 (1) Excludes revenue producers added via recent Peach State acquisition (2) Other revenue producers include hires in groups such as wealth management, treasury management, business banking, and special ty verticals % Growth Headcount Growth 12% 14 Commercial Relationship Managers 25% 28 Other Revenue Producers 2 18% 42 Total Revenue Producers
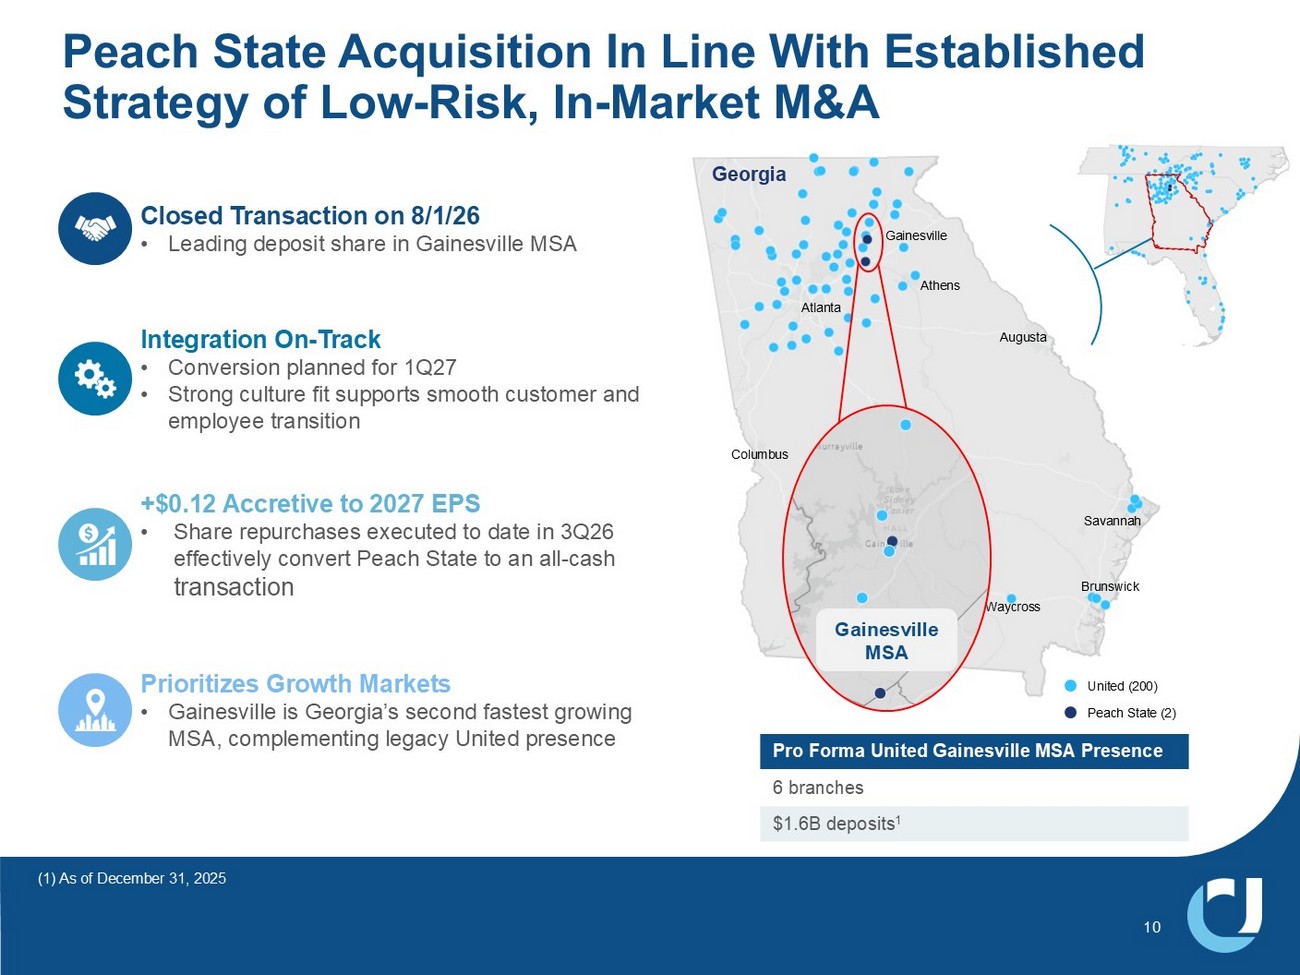
Georgia Columbus Waycross Augusta Gainesville Atlanta Macon Savannah Athens Brunswick 10 Peach State Acquisition In Line With Established Strategy of Low - Risk, In - Market M&A Peach State (2) United (200) Pro Forma United Gainesville MSA Presence 6 branches $1.6B deposits 1 (1) As of December 31, 2025 Gainesville MSA Integration On - Track • Conversion planned for 1Q27 • Strong culture fit supports smooth customer and employee transition +$0.12 Accretive to 2027 EPS • Share repurchases executed to date in 3Q26 effectively convert Peach State to an all - cash transaction Prioritizes Growth Markets • Gainesville is Georgia’s second fastest growing MSA, complementing legacy United presence Closed Transaction on 8/1/26 • Leading deposit share in Gainesville MSA
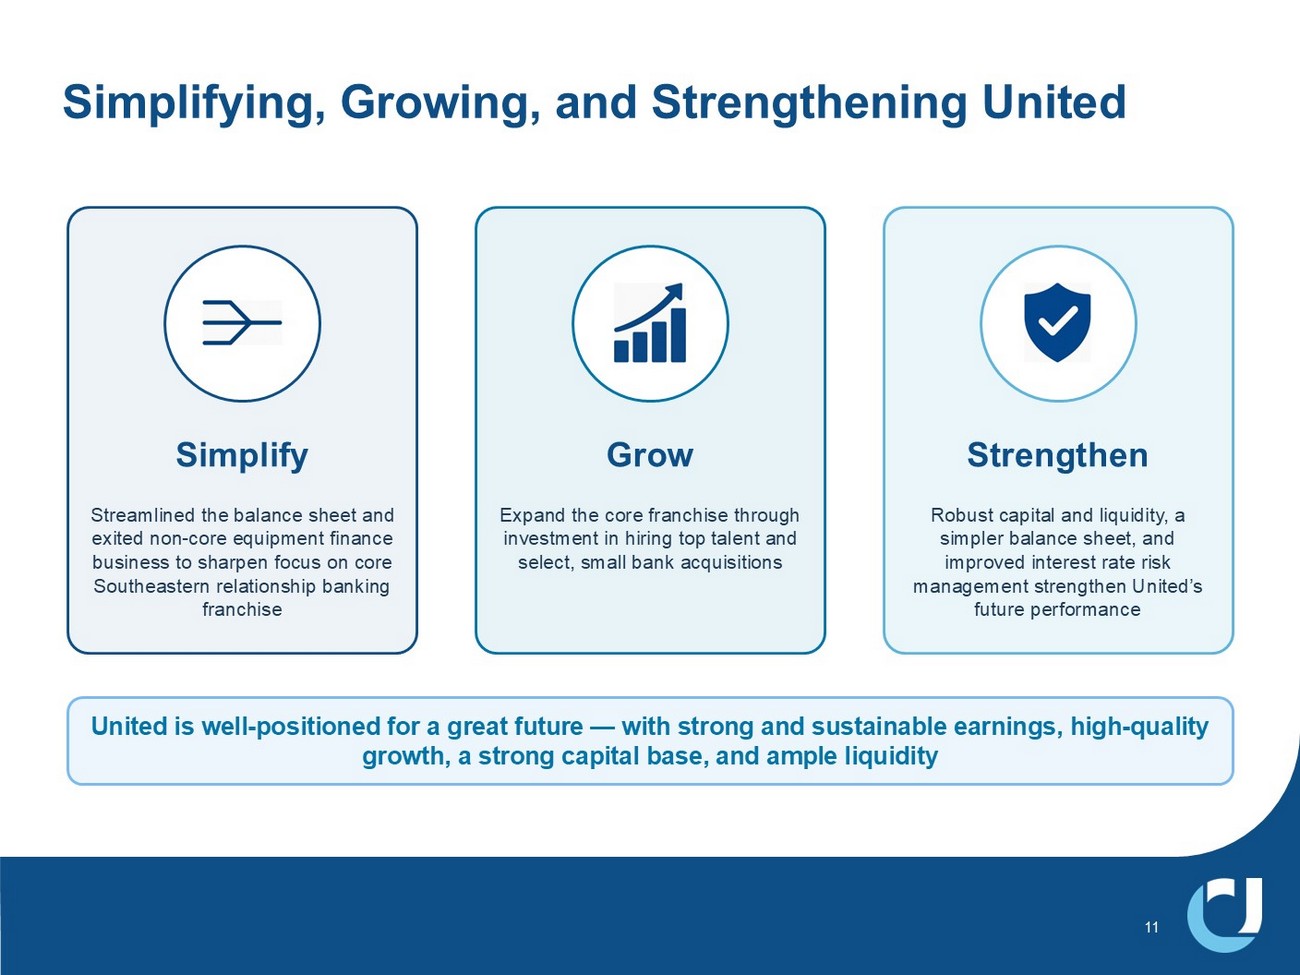
11 Simplifying, Growing, and Strengthening United Simplify Streamlined the balance sheet and exited non - core equipment finance business to sharpen focus on core Southeastern relationship banking franchise Grow Expand the core franchise through investment in hiring top talent and select, small bank acquisitions Strengthen Robust capital and liquidity, a simpler balance sheet, and improved interest rate risk management strengthen United’s future performance United is well - positioned for a great future — with strong and sustainable earnings, high - quality growth, a strong capital base, and ample liquidity

Member FDIC. © 2026 United Community Bank | ucbi.com Exhibits
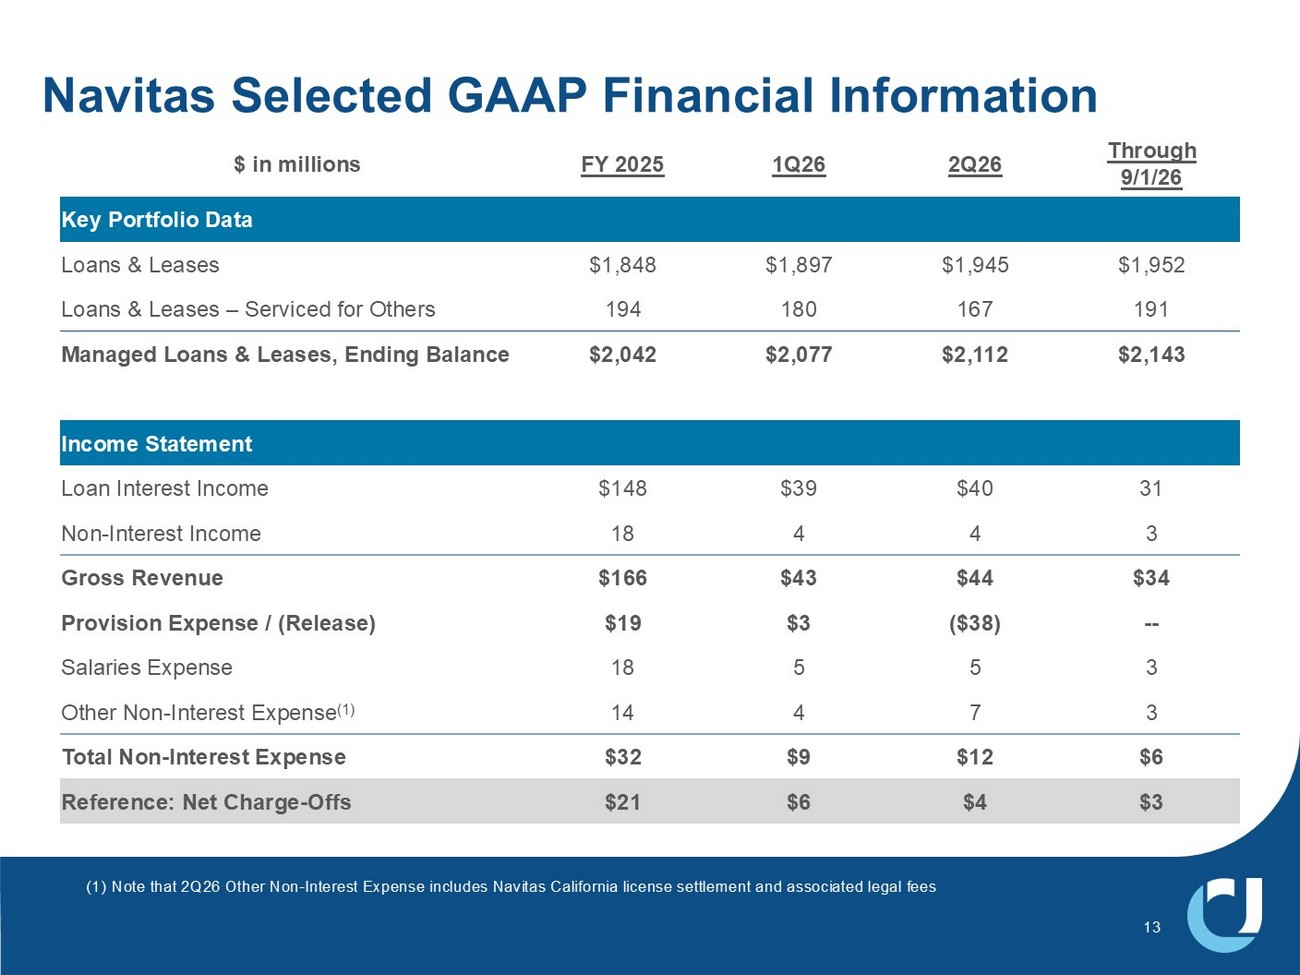
Navitas Selected GAAP Financial Information 13 Through 9/1/26 2Q26 1Q26 FY 2025 $ in millions Key Portfolio Data $1,952 $1,945 $1,897 $1,848 Loans & Leases 191 167 180 194 Loans & Leases – Serviced for Others $2,143 $2,112 $2,077 $2,042 Managed Loans & Leases, Ending Balance Income Statement 31 $40 $39 $148 Loan Interest Income 3 4 4 18 Non - Interest Income $34 $44 $43 $166 Gross Revenue -- ($38) $3 $19 Provision Expense / (Release) 3 5 5 18 Salaries Expense 3 7 4 14 Other Non - Interest Expense (1) $6 $12 $9 $32 Total Non - Interest Expense $3 $4 $6 $21 Reference: Net Charge - Offs (1) Note that 2Q26 Other Non - Interest Expense includes Navitas California license settlement and associated legal fees
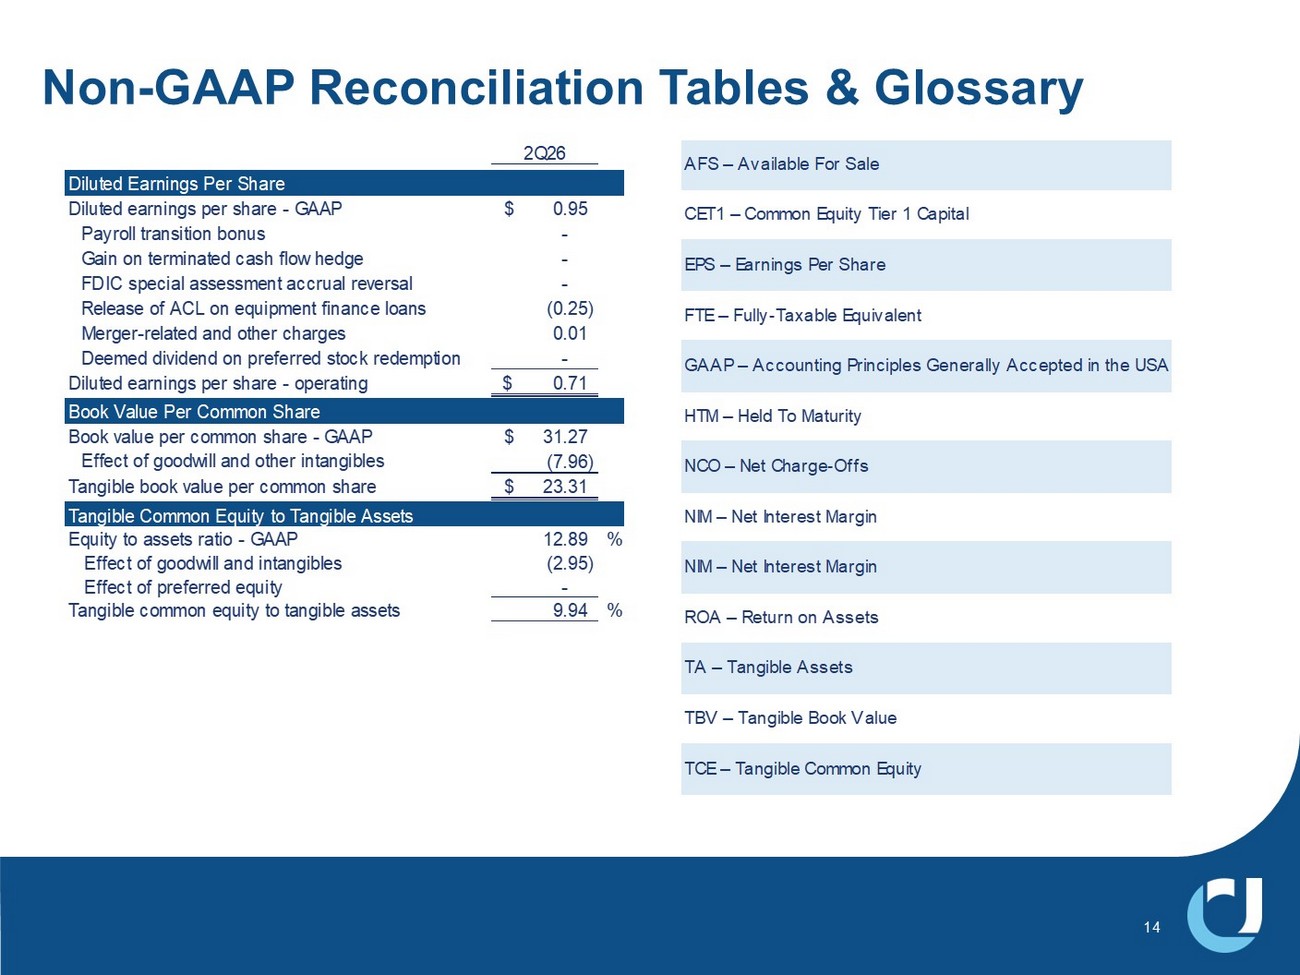
Non - GAAP Reconciliation Tables & Glossary 14 2Q26 Diluted Earnings Per Share Diluted earnings per share - GAAP 0.95$ Payroll transition bonus - Gain on terminated cash flow hedge - FDIC special assessment accrual reversal - Release of ACL on equipment finance loans (0.25) Merger-related and other charges 0.01 Deemed dividend on preferred stock redemption - Diluted earnings per share - operating 0.71$ Book Value Per Common Share Book value per common share - GAAP 31.27$ Effect of goodwill and other intangibles (7.96) Tangible book value per common share 23.31$ Tangible Common Equity to Tangible Assets Equity to assets ratio - GAAP 12.89 % Effect of goodwill and intangibles (2.95) Effect of preferred equity - Tangible common equity to tangible assets 9.94 % AFS – Available For Sale CET1 – Common Equity Tier 1 Capital EPS – Earnings Per Share FTE – Fully-Taxable Equivalent GAAP – Accounting Principles Generally Accepted in the USA HTM – Held To Maturity NCO – Net Charge-Offs NIM – Net Interest Margin NIM – Net Interest Margin ROA – Return on Assets TA – Tangible Assets TBV – Tangible Book Value TCE – Tangible Common Equity