Shareholder Report
|
12 Months Ended |
|
Jun. 30, 2026
USD ($)
Holding
|
|---|
| Shareholder Report [Line Items] |
|
|
| Document Type |
N-CSR
|
|
| Amendment Flag |
false
|
|
| Registrant Name |
Advisors Preferred Trust
|
|
| Entity Central Index Key |
0001556505
|
|
| Entity Investment Company Type |
N-1A
|
|
| Document Period End Date |
Jun. 30, 2026
|
|
| Shareholder Report Annual or Semi-Annual |
Annual Shareholder Report
|
|
| C000159198 |
|
|
| Shareholder Report [Line Items] |
|
|
| Fund Name |
Quantified Alternative Investment Fund
|
|
| Trading Symbol |
QALAX
|
|
| Additional Information Phone Number |
(855) 647-8268
|
|
| Expenses [Text Block] |
What were the Fund’s costs for the last year?(based on a hypothetical $10,000 investment) Table SummaryClass Name | Costs of a $10,000 investment | Costs paid as a percentage of a $10,000 investment |
|---|
Advisor | $223 | 2.08% |
|---|
|
|
| Expenses Paid, Amount |
$ 223
|
|
| Expense Ratio, Percent |
2.08%
|
|
| Factors Affecting Performance [Text Block] |
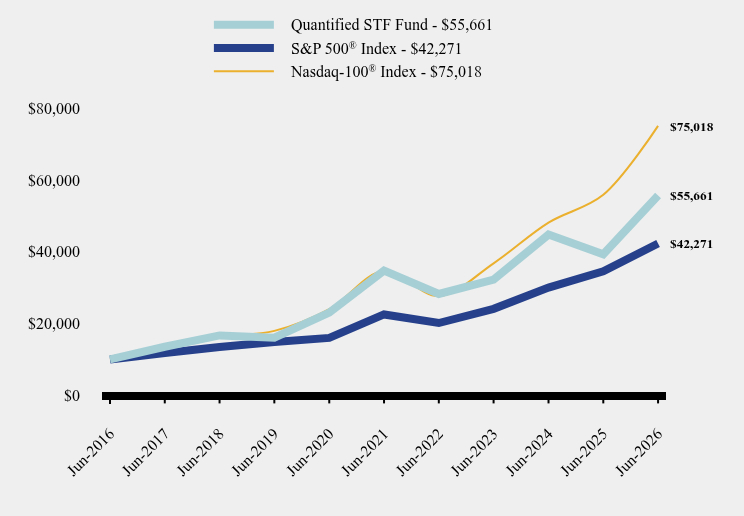
How did the Fund perform during the reporting period? The Fund returned 14.03% for the year ending June 30, 2026. The S&P 500 Index, the Fund’s benchmark, gained 22.32% for same period. Strategy The Quantified Alternative Investment Fund dynamically manages a ranked portfolio of alternative investments with the diversification and liquidity traditionally available only to hedge funds Techniques The Fund gained 7.16% for the third quarter of 2025. The Fund underperformed the S&P 500, which gained 8.12%. The Fund’s cash position declined from 12.08% at the beginning of July to 11.93% at the beginning of August and to 10.43% at the beginning of September. Both the Fund’s NASDAQ futures hedging exposure and its actively traded long-term government-bond futures contributed positively to performance for the quarter. The Fund gained 2.24% for the fourth quarter of 2025. The Fund underperformed the S&P 500, which gained 2.66%. The Fund’s cash position increased over the course of the quarter, moving from approximately 13% of the actively managed rotational portion of the Fund in early October to 22% in early November and 31% in early December. Both the Fund’s NASDAQ futures hedging exposure and its actively traded long-term government-bond futures detracted from performance for the quarter. In the first quarter of 2026, the Fund gained 3.98%. The Fund outperformed the Credit Suisse Liquid Alternative Index, which fell -0.12% and the S&P 500 TR Index which declined -4.33%. Throughout the period, the Fund held a sizable cash position, ranging from 15%-30% at the start of each month. Both the Fund’s NASDAQ futures exposure and its actively traded long-term government bond futures exposure detracted from performance for the quarter. The Fund gained 0.10% for the second quarter of 2026. It underperformed the Credit Suisse Liquid Alternative Index which gained 0.68%, and the S&P 500 TR Index which gained 15.20%. Throughout the quarter, the Fund held a sizable cash position ranging from 20%-30% at the start of each month. Both the Fund’s NASDAQ futures exposure and its actively traded long-term government bond futures exposure added to the performance for the quarter. |
|
| Performance Past Does Not Indicate Future [Text] |
The Fund’s past performance is not a good predictor of how the Fund will perform in the future.
|
|
| Average Annual Return [Table Text Block] |
Table Summary | 1 Year | 5 Years | 10 Years |
|---|
Quantified Alternative Investment Fund | 14.03% | 3.15% | 3.57% |
|---|
S&P 500 Index TR | 22.32% | 13.41% | 15.51% |
|---|
|
|
| No Deduction of Taxes [Text Block] |
The graph and table do not reflect the deduction of taxes that a shareholder would pay on fund distributions or redemption of fund shares.
|
|
| AssetsNet |
$ 23,051,406
|
|
| Holdings Count | Holding |
48
|
|
| Advisory Fees Paid, Amount |
$ 107,577
|
|
| InvestmentCompanyPortfolioTurnover |
872.00%
|
|
| Additional Fund Statistics [Text Block] |
- Net Assets$23,051,406
- Number of Portfolio Holdings48
- Advisory Fee $107,577
- Portfolio Turnover872%
|
|
| Holdings [Text Block] |
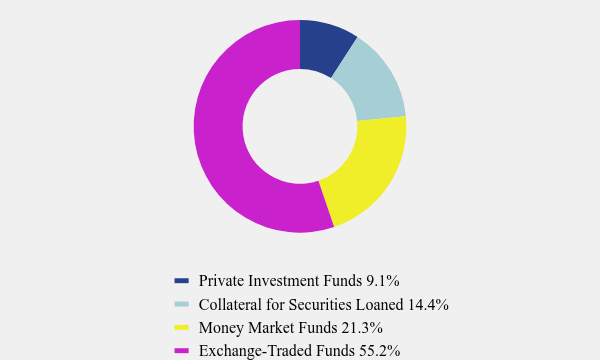
Asset Weighting (% of total investments)Table SummaryValue | Value |
|---|
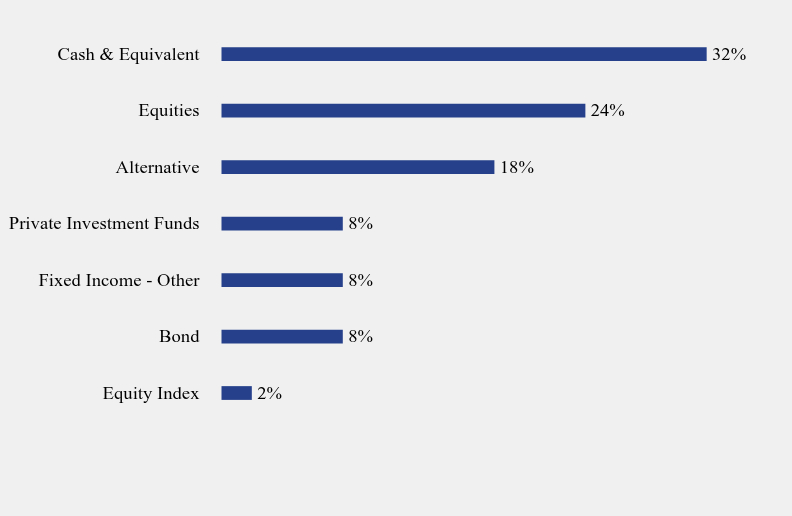
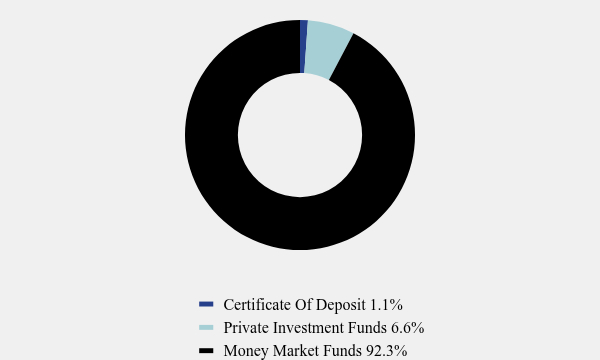
Private Investment Funds | 9.1% | Collateral for Securities Loaned | 14.4% | Money Market Funds | 21.3% | Exchange-Traded Funds | 55.2% | Instrument Type Weighting (% of total (including notional) exposure)Table SummaryValue | Value |
|---|
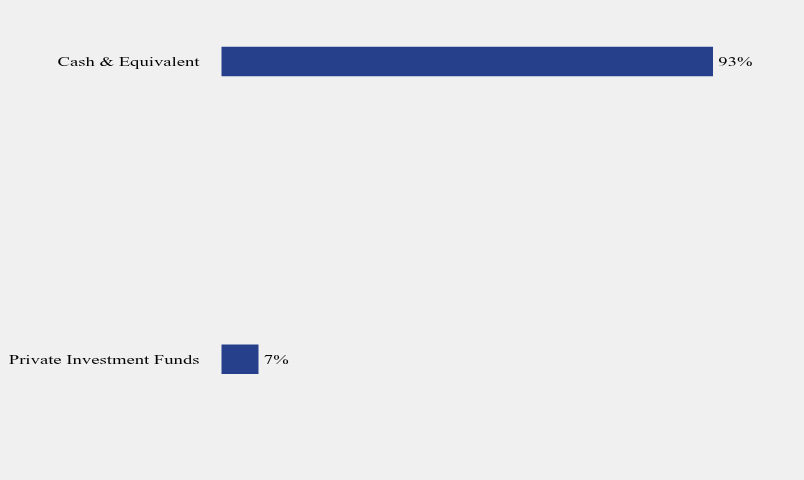
Equity Index | 2% | Bond | 8% | Fixed Income - Other | 8% | Private Investment Funds | 8% | Alternative | 18% | Equities | 24% | Cash & Equivalent | 32% | |
|
| Largest Holdings [Text Block] |
Top 10 Holdings (% of net assets)Table SummaryHolding Name | % of Net Assets |
|---|
Mount Vernon Liquid Assets Portfolio, LLC | 16.7% |
|---|
First American Government Obligations Fund, Class Z | 12.4% |
|---|
Fidelity Government Portfolio, Class I | 12.3% |
|---|
Hyperion Fund LLC | 10.6% |
|---|
iMGP DBi Managed Futures Strategy ETF | 7.0% |
|---|
iShares Convertible Bond ETF | 5.6% |
|---|
State Street SPDR Bloomberg Convertible Securities ETF | 4.6% |
|---|
Harbor Commodity All Weather Strategy ETF | 4.4% |
|---|
VanEck Natural Resources ETF | 3.7% |
|---|
First Trust Alternative Absolute Return Strategy ETF | 3.1% |
|---|
|
|
| Material Fund Change [Text Block] |
This is a summary of certain changes to the Fund since July 1, 2025. For more complete information, you may review the Fund's prospectus dated April 3, 2026, which is available at www.quantifiedfunds.com/fund-documents or by emailing orderquantifiedfunds@ultimusfundsolutions.com or upon telephone request at (855) 647-8268. Principal Investment Strategy Changes: The Fund expanded its cryptocurrency investments beyond Bitcoin and expanded its indirect exposure to more types of futures contracts through commodity pools. Principal Investment Risk Changes: Related to the strategy change, the Fund’s additional risks include an expansion of futures contract risk to address currency futures, debt futures, equity futures, energy futures, metals futures, and agriculture commodity futures; as well as an expansion of cryptocurrency risk. |
|
| C000129685 |
|
|
| Shareholder Report [Line Items] |
|
|
| Fund Name |
Quantified Alternative Investment Fund
|
|
| Trading Symbol |
QALTX
|
|
| Additional Information Phone Number |
(855) 647-8268
|
|
| Expenses [Text Block] |
What were the Fund’s costs for the last year?(based on a hypothetical $10,000 investment) Table SummaryClass Name | Costs of a $10,000 investment | Costs paid as a percentage of a $10,000 investment |
|---|
Investor | $151 | 1.41% |
|---|
|
|
| Expenses Paid, Amount |
$ 151
|
|
| Expense Ratio, Percent |
1.41%
|
|
| Factors Affecting Performance [Text Block] |
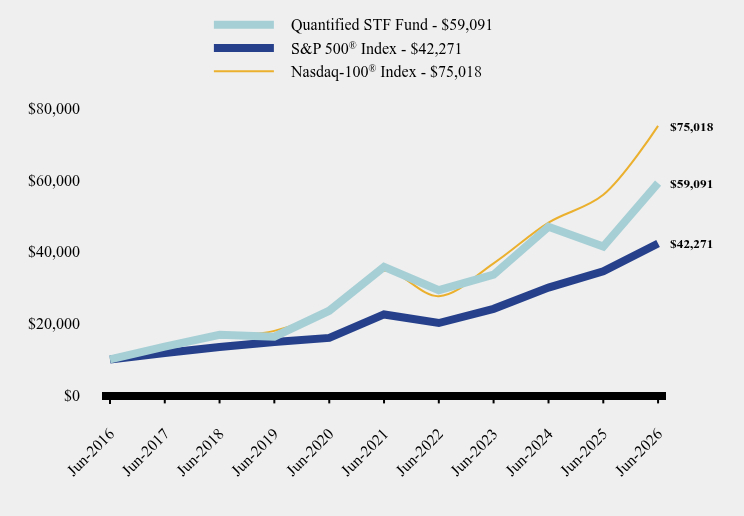
How did the Fund perform during the reporting period? The Fund returned 14.70% for the year ending June 30, 2026. The S&P 500 Index, the Fund’s benchmark, gained 22.32% for the same period. Strategy The Quantified Alternative Investment Fund dynamically manages a ranked portfolio of alternative investments with the diversification and liquidity traditionally available only to hedge funds Techniques The Fund gained 7.38% for the third quarter of 2025. The Fund underperformed the S&P 500, which gained 8.12%. The Fund’s cash position declined from 12.08% at the beginning of July to 11.93% at the beginning of August and to 10.43% at the beginning of September. Both the Fund’s NASDAQ futures hedging exposure and its actively traded long-term government-bond futures contributed positively to performance for the quarter. The Fund gained 2.29% for the fourth quarter of 2025. The Fund underperformed the S&P 500, which gained 2.66%. The Fund’s cash position increased over the course of the quarter, moving from approximately 13% of the actively managed rotational portion of the Fund in early October to 22% in early November and 31% in early December. Both the Fund’s NASDAQ futures hedging exposure and its actively traded long-term government-bond futures detracted from performance for the quarter. In the first quarter of 2026, the Fund gained 4.13%. The Fund outperformed the Credit Suisse Liquid Alternative Index, which fell -0.12% and the S&P 500 TR Index which declined -4.33%. Throughout the period, the Fund held a sizable cash position, ranging from 15%-30% at the start of each month. Both the Fund’s NASDAQ futures exposure and its actively traded long-term government bond futures exposure detracted from performance for the quarter. The Fund gained 0.28% for the second quarter of 2026. It underperformed the Credit Suisse Liquid Alternative Index which gained 0.68%, and the S&P 500 TR Index which gained 15.20%. Throughout the quarter, the Fund held a sizable cash position ranging from 20%-30% at the start of each month. Both the Fund’s NASDAQ futures exposure and its actively traded long-term government bond futures exposure added to the performance for the quarter. |
|
| Performance Past Does Not Indicate Future [Text] |
The Fund’s past performance is not a good predictor of how the Fund will perform in the future.
|
|
| Average Annual Return [Table Text Block] |
Table Summary | 1 Year | 5 Years | 10 Years |
|---|
Quantified Alternative Investment Fund | 14.70% | 3.74% | 4.18% |
|---|
S&P 500 Index TR | 22.32% | 13.41% | 15.51% |
|---|
|
|
| No Deduction of Taxes [Text Block] |
The graph and table do not reflect the deduction of taxes that a shareholder would pay on fund distributions or redemption of fund shares.
|
|
| AssetsNet |
$ 23,051,406
|
|
| Holdings Count | Holding |
48
|
|
| Advisory Fees Paid, Amount |
$ 107,577
|
|
| InvestmentCompanyPortfolioTurnover |
872.00%
|
|
| Additional Fund Statistics [Text Block] |
- Net Assets$23,051,406
- Number of Portfolio Holdings48
- Advisory Fee $107,577
- Portfolio Turnover872%
|
|
| Holdings [Text Block] |
Asset Weighting (% of total investments)Table SummaryValue | Value |
|---|
Private Investment Funds | 9.1% | Collateral for Securities Loaned | 14.4% | Money Market Funds | 21.3% | Exchange-Traded Funds | 55.2% | Instrument Type Weighting (% of total (including notional) exposure)Table SummaryValue | Value |
|---|
Equity Index | 2% | Bond | 8% | Fixed Income - Other | 8% | Private Investment Funds | 8% | Alternative | 18% | Equities | 24% | Cash & Equivalent | 32% | |
|
| Largest Holdings [Text Block] |
Top 10 Holdings (% of net assets)Table SummaryHolding Name | % of Net Assets |
|---|
Mount Vernon Liquid Assets Portfolio, LLC | 16.7% |
|---|
First American Government Obligations Fund, Class Z | 12.4% |
|---|
Fidelity Government Portfolio, Class I | 12.3% |
|---|
Hyperion Fund LLC | 10.6% |
|---|
iMGP DBi Managed Futures Strategy ETF | 7.0% |
|---|
iShares Convertible Bond ETF | 5.6% |
|---|
State Street SPDR Bloomberg Convertible Securities ETF | 4.6% |
|---|
Harbor Commodity All Weather Strategy ETF | 4.4% |
|---|
VanEck Natural Resources ETF | 3.7% |
|---|
First Trust Alternative Absolute Return Strategy ETF | 3.1% |
|---|
|
|
| Material Fund Change [Text Block] |
This is a summary of certain changes to the Fund since July 1, 2025. For more complete information, you may review the Fund's prospectus dated April 3, 2026, which is available at www.quantifiedfunds.com/fund-documents or by emailing orderquantifiedfunds@ultimusfundsolutions.com or upon telephone request at (855) 647-8268. Principal Investment Strategy Changes: The Fund expanded its cryptocurrency investments beyond Bitcoin and expanded its indirect exposure to more types of futures contracts through commodity pools. Principal Investment Risk Changes: Related to the strategy change, the Fund’s additional risks include an expansion of futures contract risk to address currency futures, debt futures, equity futures, energy futures, metals futures, and agriculture commodity futures; as well as an expansion of cryptocurrency risk. |
|
| C000213661 |
|
|
| Shareholder Report [Line Items] |
|
|
| Fund Name |
Quantified Common Ground Fund
|
|
| Trading Symbol |
QCGAX
|
|
| Additional Information Phone Number |
(855) 647-8268
|
|
| Expenses [Text Block] |
What were the Fund’s costs for the last year?(based on a hypothetical $10,000 investment) Table SummaryClass Name | Costs of a $10,000 investment | Costs paid as a percentage of a $10,000 investment |
|---|
Advisor | $239 | 2.19% |
|---|
|
|
| Expenses Paid, Amount |
$ 239
|
|
| Expense Ratio, Percent |
2.19%
|
|
| Factors Affecting Performance [Text Block] |
How did the Fund perform during the reporting period? The Fund rose by 18.55% for the year ending June 30, 2026. The S&P Composite 1500 Total Return Index, the Fund’s benchmark, gained 22.87% for same period. Strategy The Quantified Common Ground Fund invests in securities of issuers that can be considered compliant with both ESG (Environmental, Social and Governance) and BRI (Biblically Responsible Investing) standards and is actively managed. Techniques The Fund rose 2.27 % for the third quarter, underperforming the S&P 1500 TR Index, which gained 8.01%. The Fund remained defensive at the start of the quarter following the volatility seen in April. At the beginning of July, the Fund’s combined cash and bond positions totaled 34.19%. Cash exposure was 24.44% in August and rose slightly to 25.42% in September. Utilities remained the most significant sector allocation throughout the quarter. The Fund rose 1.37% for the fourth quarter, underperforming the S&P 1500 TR Index again, which gained 2.58%. The Fund remained defensive in October, maintaining an approximately 18% allocation to cash. The sectors with the largest exposure in October were Real Estate and Utilities. In November, the Fund went fully risk-on, dropping the cash allocation to 2.5%. The largest holdings in November were in Health Care and Information Technology. December saw similarly aggressive positioning, with the largest exposures in Financial and Real Estate. In the first quarter of 2026, the Fund rose 5.47%, outperforming the S&P 1500 TR Index which fell -3.81%. The Fund remained heavily invested in equities throughout the quarter, holding no bond position and a cash position of about 2.5% each month. The sectors with the largest exposure in January and February were Financials and Materials. In March, the largest sector exposures were Financials and Health Care. Stock selection contributed to outperformance for the quarter. The Fund rose 8.41% for the second quarter of 2026, underperforming the S&P 1500 Total Return Index which gained 15.28%. The Fund remained heavily invested in equities throughout the quarter, holding no bond positions and a cash position of less than 3% each month. In April, the fund’s largest sector exposures were Consumer Staples and Financials, shifting to Financials and Information Technology in May, and to Information Technology and Industrials in June. |
|
| Performance Past Does Not Indicate Future [Text] |
The Fund’s past performance is not a good predictor of how the Fund will perform in the future.
|
|
| Line Graph [Table Text Block] |
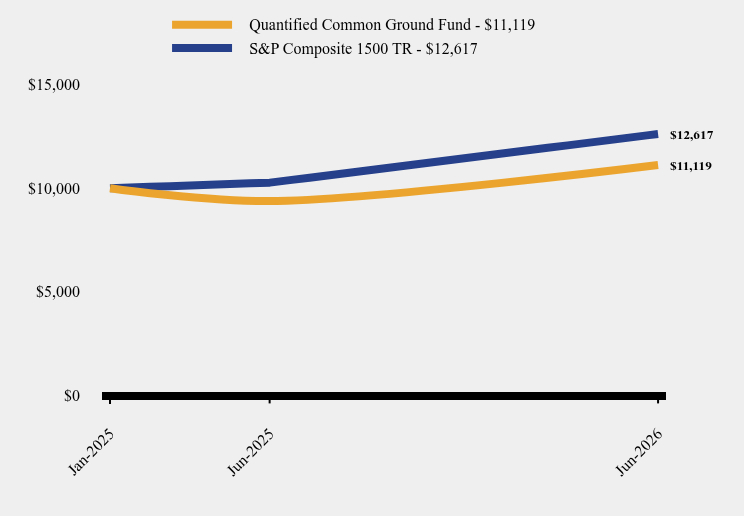
Table Summary | Quantified Common Ground Fund | S&P Composite 1500 TR |
|---|
Jan-2025 | $10,000 | $10,000 |
|---|
Jun-2025 | $9,379 | $10,268 |
|---|
Jun-2026 | $11,119 | $12,617 |
|---|
|
|
| Average Annual Return [Table Text Block] |
Table Summary | 1 Year | Since Inception (January 31, 2025) |
|---|
Quantified Common Ground Fund | 18.55% | 7.81% |
|---|
S&P Composite 1500® Index | 22.87% | 17.91% |
|---|
|
|
| Performance Inception Date |
Jan. 31, 2025
|
|
| No Deduction of Taxes [Text Block] |
The graph and table do not reflect the deduction of taxes that a shareholder would pay on fund distributions or redemption of fund shares.
|
|
| AssetsNet |
$ 119,899,663
|
|
| Holdings Count | Holding |
48
|
|
| Advisory Fees Paid, Amount |
$ 1,189,709
|
|
| InvestmentCompanyPortfolioTurnover |
742.00%
|
|
| Additional Fund Statistics [Text Block] |
Table SummaryNet Assets | $119,899,663 |
|---|
Number of Portfolio Holdings | 48 |
|---|
Advisory Fee | $1,189,709 |
|---|
Portfolio Turnover | 742% |
|---|
|
|
| Holdings [Text Block] |
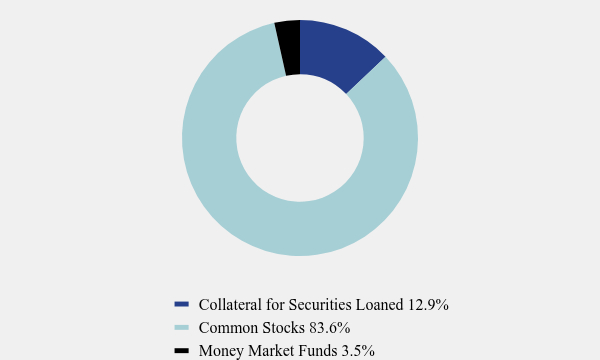
Asset Weighting (% of total investments)Table SummaryValue | Value |
|---|
Collateral for Securities Loaned | 12.9% | Common Stocks | 83.6% | Money Market Funds | 3.5% | Sector Weighting (% of total investments)Table SummaryValue | Value |
|---|
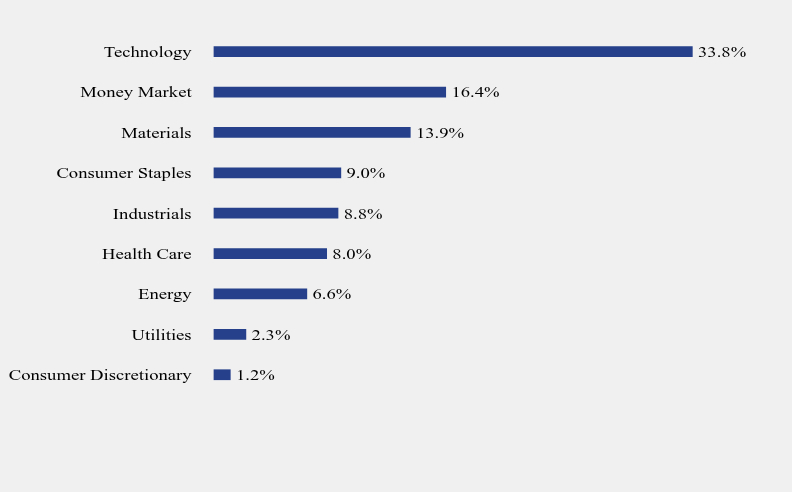
Consumer Discretionary | 1.2% | Utilities | 2.3% | Energy | 6.6% | Health Care | 8.0% | Industrials | 8.8% | Consumer Staples | 9.0% | Materials | 13.9% | Money Market | 16.4% | Technology | 33.8% | |
|
| Largest Holdings [Text Block] |
Top 10 Holdings (% of net assets)Table SummaryHolding Name | % of Net Assets |
|---|
Mount Vernon Liquid Assets Portfolio, LLC | 14.9% |
|---|
Broadcom, Inc. | 10.5% |
|---|
Darling Ingredients, Inc. | 7.0% |
|---|
Microchip Technology, Inc. | 5.6% |
|---|
Western Digital Corporation | 5.3% |
|---|
Seagate Technology Holdings PLC | 5.0% |
|---|
Jazz Pharmaceuticals PLC | 4.2% |
|---|
Neurocrine Biosciences, Inc. | 3.8% |
|---|
GE Vernova, Inc. | 3.0% |
|---|
Smurfit WestRock plc | 2.9% |
|---|
|
|
| Material Fund Change [Text Block] |
This is a summary of certain changes to the Fund since July 1, 2025. For more complete information, you may review the Fund's prospectus dated April 3, 2026, which is available at www.quantifiedfunds.com/fund-documents or by emailing orderquantifiedfunds@ultimusfundsolutions.com or upon telephone request at (855) 647-8268. Principal Investment Strategy Changes: The Fund formed a wholly owned subsidiary for the purpose of housing certain commodity pool investments in conformity with the tax regulations that apply to the Fund. Principal Investment Risk Changes: Related to the strategy change, the Fund’s additional risks include an expansion of futures contract risk to address currency futures, debt futures, equity futures, energy futures, metals futures, and agriculture commodity futures; as well as taxation risk; and wholly owned subsidiary risk. |
|
| C000213660 |
|
|
| Shareholder Report [Line Items] |
|
|
| Fund Name |
Quantified Common Ground Fund
|
|
| Trading Symbol |
QCGDX
|
|
| Additional Information Phone Number |
(855) 647-8268
|
|
| Expenses [Text Block] |
What were the Fund’s costs for the last year?(based on a hypothetical $10,000 investment) Table SummaryClass Name | Costs of a $10,000 investment | Costs paid as a percentage of a $10,000 investment |
|---|
Investor | $174 | 1.59% |
|---|
|
|
| Expenses Paid, Amount |
$ 174
|
|
| Expense Ratio, Percent |
1.59%
|
|
| Factors Affecting Performance [Text Block] |
How did the Fund perform during the reporting period? The Fund rose by 19.25% for the year ending June 30, 2026. The S&P Composite 1500 Total Return Index, the Fund’s benchmark, gained 22.87% for same period. Strategy The Quantified Common Ground Fund invests in securities of issuers that can be considered compliant with both ESG (Environmental, Social and Governance) and BRI (Biblically Responsible Investing) standards and is actively managed. Techniques The Fund rose 2.41% for the third quarter of 2025, underperforming the S&P 1500 TR Index, which gained 8.01%. The Fund remained defensive at the start of the quarter following the volatility seen in April. At the beginning of July, the Fund’s combined cash and bond positions totaled 34.19%. Cash exposure was 24.44% in August and rose slightly to 25.42% in September. Utilities remained the most significant sector allocation throughout the quarter. The Fund rose 1.57% for the fourth quarter of 2025, underperforming the S&P 1500 TR Index again, which gained 2.58%. The Fund remained defensive in October, maintaining an approximately 18% allocation to cash. The sectors with the largest exposure in October were Real Estate and Utilities. In November, the Fund went fully risk-on, dropping the cash allocation to 2.5%. The largest holdings in November were in Health Care and Information Technology. December saw similarly aggressive positioning, with the largest exposures in Financial and Real Estate. In the first quarter of 2026, the Fund rose 5.59%, outperforming the S&P 1500 TR Index which fell -3.81%. The Fund remained heavily invested in equities throughout the quarter, holding no bond position and a cash position of about 2.5% each month. The sectors with the largest exposure in January and February were Financials and Materials. In March, the largest sector exposures were Financials and Health Care. Stock selection contributed to outperformance for the quarter. The Fund rose 8.58% for the second quarter of 2026, underperforming the S&P 1500 Total Return Index which gained 15.28%. The Fund remained heavily invested in equities throughout the quarter, holding no bond positions and a cash position of less than 3% each month. In April, the fund’s largest sector exposures were Consumer Staples and Financials, shifting to Financials and Information Technology in May, and to Information Technology and Industrials in June. |
|
| Performance Past Does Not Indicate Future [Text] |
The Fund’s past performance is not a good predictor of how the Fund will perform in the future.
|
|
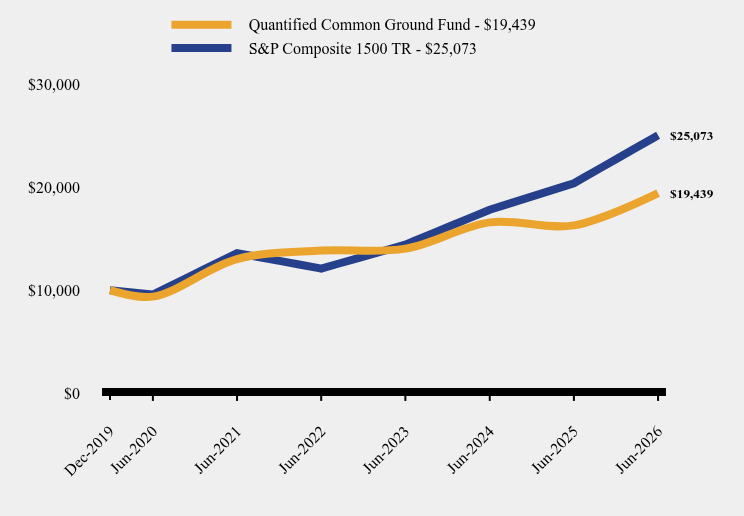
| Line Graph [Table Text Block] |
Table Summary | Quantified Common Ground Fund | S&P Composite 1500 TR |
|---|
Dec-2019 | $10,000 | $10,000 |
|---|
Jun-2020 | $9,370 | $9,570 |
|---|
Jun-2021 | $13,023 | $13,601 |
|---|
Jun-2022 | $13,851 | $12,103 |
|---|
Jun-2023 | $14,044 | $14,431 |
|---|
Jun-2024 | $16,599 | $17,826 |
|---|
Jun-2025 | $16,302 | $20,406 |
|---|
Jun-2026 | $19,439 | $25,073 |
|---|
|
|
| Average Annual Return [Table Text Block] |
Table Summary | 1 Year | 5 Years | Since Inception (December 27, 2019) |
|---|
Quantified Common Ground Fund | 19.25% | 8.34% | 10.75% |
|---|
S&P Composite 1500® Index | 22.87% | 13.01% | 15.17% |
|---|
|
|
| Performance Inception Date |
Dec. 27, 2019
|
|
| No Deduction of Taxes [Text Block] |
The graph and table do not reflect the deduction of taxes that a shareholder would pay on fund distributions or redemption of fund shares.
|
|
| AssetsNet |
$ 119,899,663
|
|
| Holdings Count | Holding |
48
|
|
| Advisory Fees Paid, Amount |
$ 1,189,709
|
|
| InvestmentCompanyPortfolioTurnover |
742.00%
|
|
| Additional Fund Statistics [Text Block] |
Table SummaryNet Assets | $119,899,663 |
|---|
Number of Portfolio Holdings | 48 |
|---|
Advisory Fee | $1,189,709 |
|---|
Portfolio Turnover | 742% |
|---|
|
|
| Holdings [Text Block] |
Asset Weighting (% of total investments)Table SummaryValue | Value |
|---|
Collateral for Securities Loaned | 12.9% | Common Stocks | 83.6% | Money Market Funds | 3.5% | Sector Weighting (% of total investments)Table SummaryValue | Value |
|---|
Consumer Discretionary | 1.2% | Utilities | 2.3% | Energy | 6.6% | Health Care | 8.0% | Industrials | 8.8% | Consumer Staples | 9.0% | Materials | 13.9% | Money Market | 16.4% | Technology | 33.8% | |
|
| Largest Holdings [Text Block] |
Top 10 Holdings (% of net assets)Table SummaryHolding Name | % of Net Assets |
|---|
Mount Vernon Liquid Assets Portfolio, LLC | 14.9% |
|---|
Broadcom, Inc. | 10.5% |
|---|
Darling Ingredients, Inc. | 7.0% |
|---|
Microchip Technology, Inc. | 5.6% |
|---|
Western Digital Corporation | 5.3% |
|---|
Seagate Technology Holdings PLC | 5.0% |
|---|
Jazz Pharmaceuticals PLC | 4.2% |
|---|
Neurocrine Biosciences, Inc. | 3.8% |
|---|
GE Vernova, Inc. | 3.0% |
|---|
Smurfit WestRock plc | 2.9% |
|---|
|
|
| Material Fund Change [Text Block] |
This is a summary of certain changes to the Fund since July 1, 2025. For more complete information, you may review the Fund's prospectus dated April 3, 2026, which is available at www.quantifiedfunds.com/fund-documents or by emailing orderquantifiedfunds@ultimusfundsolutions.com or upon telephone request at (855) 647-8268. Principal Investment Strategy Changes: The Fund formed a wholly owned subsidiary for the purpose of housing certain commodity pool investments in conformity with the tax regulations that apply to the Fund. Principal Investment Risk Changes: Related to the strategy change, the Fund’s additional risks include an expansion of futures contract risk to address currency futures, debt futures, equity futures, energy futures, metals futures, and agriculture commodity futures; as well as taxation risk; and wholly owned subsidiary risk. |
|
| C000253434 |
|
|
| Shareholder Report [Line Items] |
|
|
| Fund Name |
Quantified Eckhardt Managed Futures Strategy Fund
|
|
| Trading Symbol |
QETAX
|
|
| Annual or Semi-Annual Statement [Text Block] |
This annual shareholder report contains important information about Quantified Eckhardt Managed Futures Strategy Fund (the "Fund") for the period of July 1, 2025 to June 30, 2026.
|
|
| Additional Information [Text Block] |
You can find additional information about the Fund at www.quantifiedfunds.com/fund-documents. You can also request this information by contacting us at (855) 647-8268.
|
|
| Additional Information Phone Number |
(855) 647-8268
|
|
| Additional Information Website |
www.quantifiedfunds.com/fund-documents
|
|
| Expenses [Text Block] |
What were the Fund’s costs for the last year?(based on a hypothetical $10,000 investment) Table SummaryClass Name | Costs of a $10,000 investment | Costs paid as a percentage of a $10,000 investment |
|---|
Advisor | $212 | 2.21% |
|---|
|
|
| Expenses Paid, Amount |
$ 212
|
|
| Expense Ratio, Percent |
2.21%
|
|
| Performance Past Does Not Indicate Future [Text] |
The Fund’s past performance is not a good predictor of how the Fund will perform in the future.
|
|
| Average Annual Return [Table Text Block] |
Average Annual Total Returns Table Summary | 1 Year | Since Inception (January 31, 2025) |
|---|
Quantified Eckhardt Managed Futures Strategy Fund | -8.09% | -14.49% |
|---|
S&P 500 Index TR | 22.32% | 18.06% |
|---|
The Fund’s past performance is not a good predictor of how the Fund will perform in the future. The graph and table do not reflect the deduction of taxes that a shareholder would pay on fund distributions or redemption of fund shares. For updated performance call (855) 647-8268. |
|
| Performance Inception Date |
Jan. 31, 2025
|
|
| No Deduction of Taxes [Text Block] |
The graph and table do not reflect the deduction of taxes that a shareholder would pay on fund distributions or redemption of fund shares.
|
|
| AssetsNet |
$ 49,183,858
|
|
| Holdings Count | Holding |
4
|
|
| Advisory Fees Paid, Amount |
$ 469,575
|
|
| InvestmentCompanyPortfolioTurnover |
197.00%
|
|
| Additional Fund Statistics [Text Block] |
Table SummaryNet Assets | $49,183,858 |
|---|
Number of Portfolio Holdings | 4 |
|---|
Advisory Fee | $469,575 |
|---|
Portfolio Turnover | 197% |
|---|
|
|
| Holdings [Text Block] |
Asset Weighting (% of total investments)Table SummaryValue | Value |
|---|
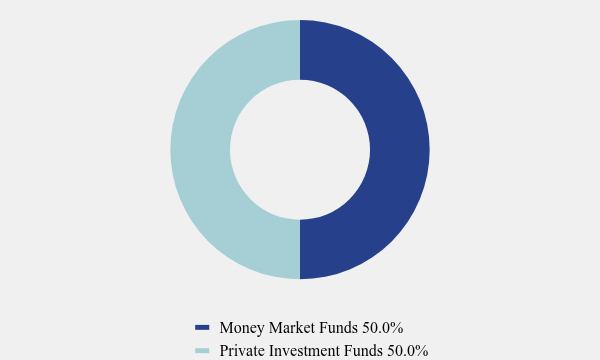
Money Market Funds | 50.0% | Private Investment Funds | 50.0% | Sector Weighting (% of total investments)Table SummaryValue | Value |
|---|
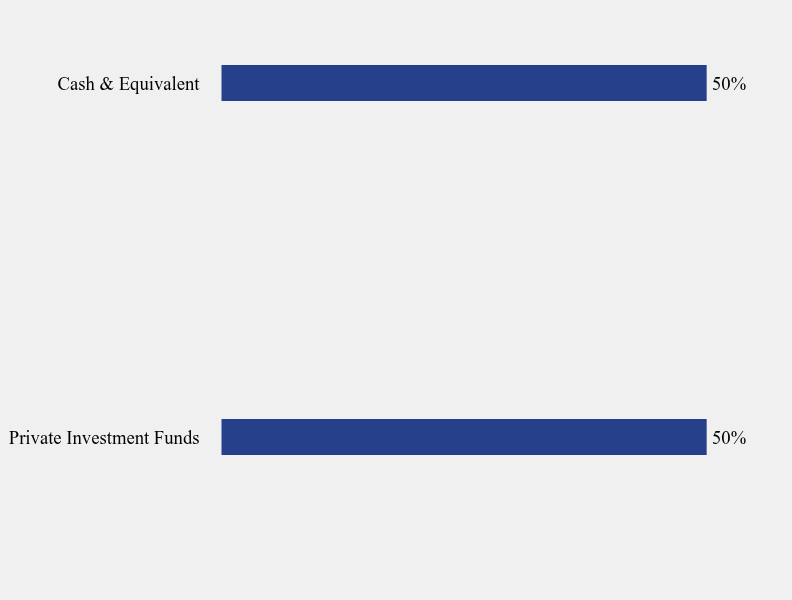
Private Investment Funds | 50% | Cash & Equivalent | 50% | Top 10 Holdings (% of net assets)Table SummaryHolding Name | % of Net Assets |
|---|
Fidelity Government Portfolio, Class I | 40.9% |
|---|
Galaxy Plus Fund LLC Evolution Strategy Financials Feeder Fund | 35.6% |
|---|
Galaxy Plus Fund Evolution Strategy Commodities Offshore Feeder Fund | 14.4% |
|---|
First American Government Obligations Fund, Class X | 9.1% |
|---|
|
|
| C000253435 |
|
|
| Shareholder Report [Line Items] |
|
|
| Fund Name |
Quantified Eckhardt Managed Futures Strategy Fund
|
|
| Trading Symbol |
QETCX
|
|
| Annual or Semi-Annual Statement [Text Block] |
This annual shareholder report contains important information about Quantified Eckhardt Managed Futures Strategy Fund (the "Fund") for the period of July 1, 2025 to June 30, 2026.
|
|
| Additional Information [Text Block] |
You can find additional information about the Fund at www.quantifiedfunds.com/fund-documents. You can also request this information by contacting us at (855) 647-8268.
|
|
| Additional Information Phone Number |
(855) 647-8268
|
|
| Additional Information Website |
www.quantifiedfunds.com/fund-documents
|
|
| Expenses [Text Block] |
What were the Fund’s costs for the last year?(based on a hypothetical $10,000 investment) Table SummaryClass Name | Costs of a $10,000 investment | Costs paid as a percentage of a $10,000 investment |
|---|
Investor | $154 | 1.60% |
|---|
|
|
| Expenses Paid, Amount |
$ 154
|
|
| Expense Ratio, Percent |
1.60%
|
|
| Performance Past Does Not Indicate Future [Text] |
The Fund’s past performance is not a good predictor of how the Fund will perform in the future.
|
|
| Average Annual Return [Table Text Block] |
Average Annual Total Returns Table Summary | 1 Year | Since Inception (October 16, 2024) |
|---|
Quantified Eckhardt Managed Futures Strategy Fund | -7.51% | -10.69% |
|---|
S&P 500 Index TR | 22.32% | 17.24% |
|---|
The Fund’s past performance is not a good predictor of how the Fund will perform in the future. The graph and table do not reflect the deduction of taxes that a shareholder would pay on fund distributions or redemption of fund shares. For updated performance call (855) 647-8268. |
|
| Performance Inception Date |
Oct. 16, 2024
|
|
| No Deduction of Taxes [Text Block] |
The graph and table do not reflect the deduction of taxes that a shareholder would pay on fund distributions or redemption of fund shares.
|
|
| AssetsNet |
$ 49,183,858
|
|
| Holdings Count | Holding |
4
|
|
| Advisory Fees Paid, Amount |
$ 469,575
|
|
| InvestmentCompanyPortfolioTurnover |
197.00%
|
|
| Additional Fund Statistics [Text Block] |
Table SummaryNet Assets | $49,183,858 |
|---|
Number of Portfolio Holdings | 4 |
|---|
Advisory Fee | $469,575 |
|---|
Portfolio Turnover | 197% |
|---|
|
|
| Holdings [Text Block] |
Asset Weighting (% of total investments)Table SummaryValue | Value |
|---|
Money Market Funds | 50.0% | Private Investment Funds | 50.0% | Sector Weighting (% of total investments)Table SummaryValue | Value |
|---|
Private Investment Funds | 50% | Cash & Equivalent | 50% | Top 10 Holdings (% of net assets)Table SummaryHolding Name | % of Net Assets |
|---|
Fidelity Government Portfolio, Class I | 40.9% |
|---|
Galaxy Plus Fund LLC Evolution Strategy Financials Feeder Fund | 35.6% |
|---|
Galaxy Plus Fund Evolution Strategy Commodities Offshore Feeder Fund | 14.4% |
|---|
First American Government Obligations Fund, Class X | 9.1% |
|---|
|
|
| C000213663 |
|
|
| Shareholder Report [Line Items] |
|
|
| Fund Name |
Quantified Evolution Plus Fund
|
|
| Trading Symbol |
QEVAX
|
|
| Annual or Semi-Annual Statement [Text Block] |
This annual shareholder report contains important information about the Quantified Evolution Plus Fund for the period of May 18, 2026 (commencement of operations) to June 30, 2026.
|
|
| Additional Information [Text Block] |
You can find additional information about the Fund at www.quantifiedfunds.com/fund-documents. You can also request this information by contacting us at (855) 647-8268.
|
|
| Additional Information Phone Number |
(855) 647-8268
|
|
| Additional Information Website |
www.quantifiedfunds.com/fund-documents
|
|
| Expenses [Text Block] |
What were the Fund’s costs for the last year?(based on a hypothetical $10,000 investment) Table SummaryClass Name | Costs of a $10,000 investment | Costs paid as a percentage of a $10,000 investment |
|---|
Advisor | $26 | 2.26%Footnote Reference* |
|---|
| Footnote | Description | Footnote* | Annualized. Expenses would be higher if the Fund had been in operations for the full twelve-month reporting period. |
|
|
| Expenses Paid, Amount |
$ 26
|
|
| Expense Ratio, Percent |
2.26%
|
[1] |
| Factors Affecting Performance [Text Block] |
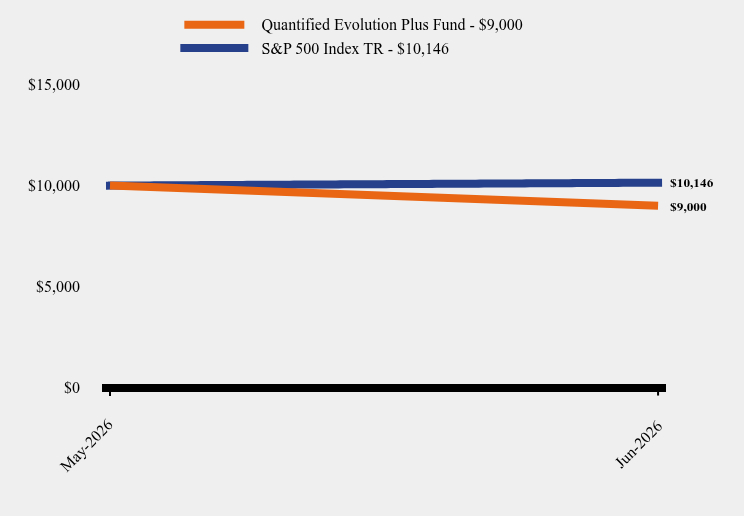
How did the Fund perform during the reporting period? The Fund declined -10% since its inception on May 18, 2026. The S&P 500 Total Return Index, the Fund’s benchmark, gained 1.46% for same period. Strategy The Quantified Evolution Plus Fund utilizes a strategy that seeks strong absolute risk-adjusted returns on a wide variety of asset classes. Techniques The Fund underperformed the S&P 500 Total Return Index in May, remaining in commodities for much of the month with additional allocations to equities, gold and real estate. The Fund also underperformed in June, with allocations spread across domestic equities, emerging market equities and gold. |
|
| Performance Past Does Not Indicate Future [Text] |
The Fund’s past performance is not a good predictor of how the Fund will perform in the future.
|
|
| Line Graph [Table Text Block] |
Table Summary | Quantified Evolution Plus Fund | S&P 500 Index TR |
|---|
May-2026 | $10,000 | $10,000 |
|---|
Jun-2026 | $9,000 | $10,146 |
|---|
|
|
| Average Annual Return [Table Text Block] |
Table Summary | Since Inception (May 18, 2026) |
|---|
Quantified Evolution Plus Fund | -10.00% |
|---|
S&P 500 Index TR | 1.46% |
|---|
|
|
| Performance Inception Date |
May 18, 2026
|
|
| No Deduction of Taxes [Text Block] |
The graph and table do not reflect the deduction of taxes that a shareholder would pay on fund distributions or redemption of fund shares.
|
|
| AssetsNet |
$ 26,109,696
|
|
| Holdings Count | Holding |
23
|
|
| Advisory Fees Paid, Amount |
$ 252,437
|
|
| InvestmentCompanyPortfolioTurnover |
1202.00%
|
|
| Additional Fund Statistics [Text Block] |
Table SummaryNet Assets | $26,109,696 |
|---|
Number of Portfolio Holdings | 23 |
|---|
Advisory Fee | $252,437 |
|---|
Portfolio Turnover | 1,202% |
|---|
|
|
| Holdings [Text Block] |
Asset Weighting (% of total investments)Table SummaryValue | Value |
|---|
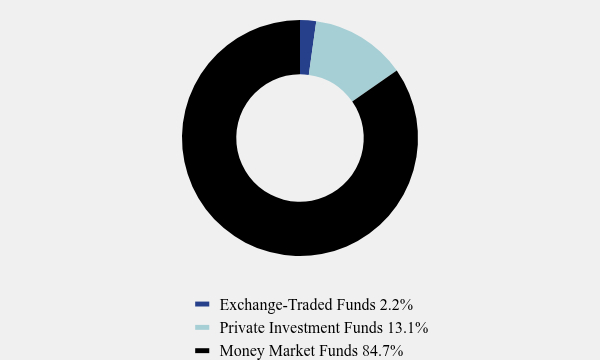
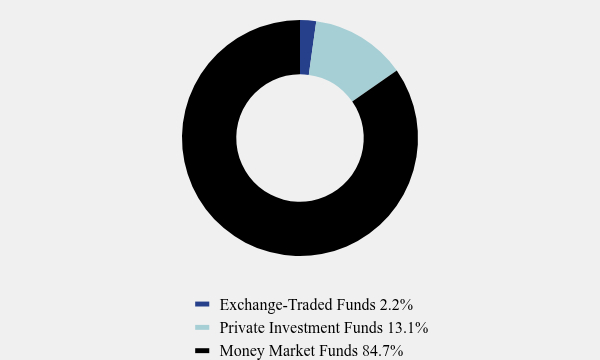
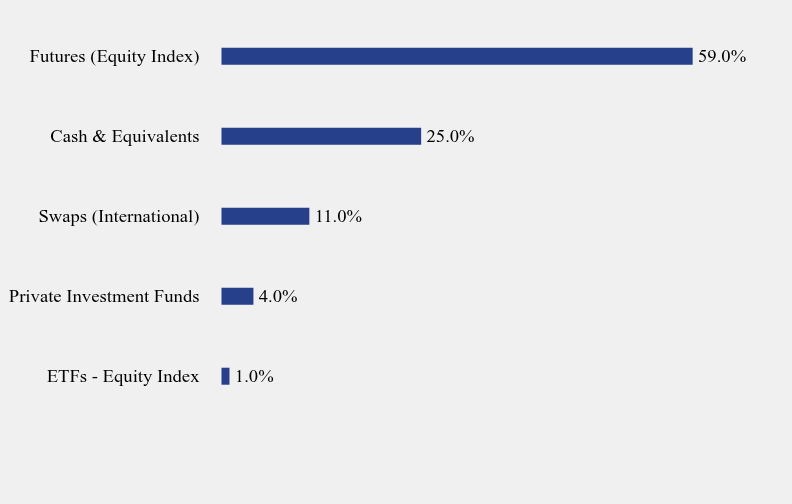
Exchange-Traded Funds | 2.2% | Private Investment Funds | 13.1% | Money Market Funds | 84.7% | Security Type Weighting (% of total (including notional) exposure)Table SummaryValue | Value |
|---|
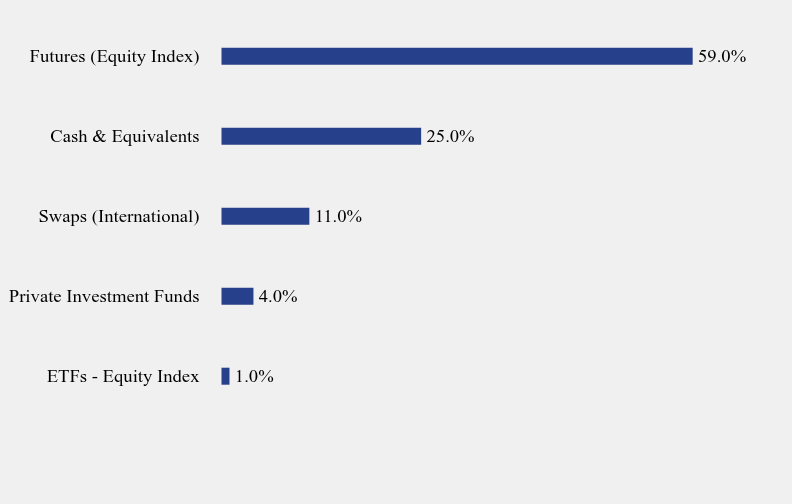
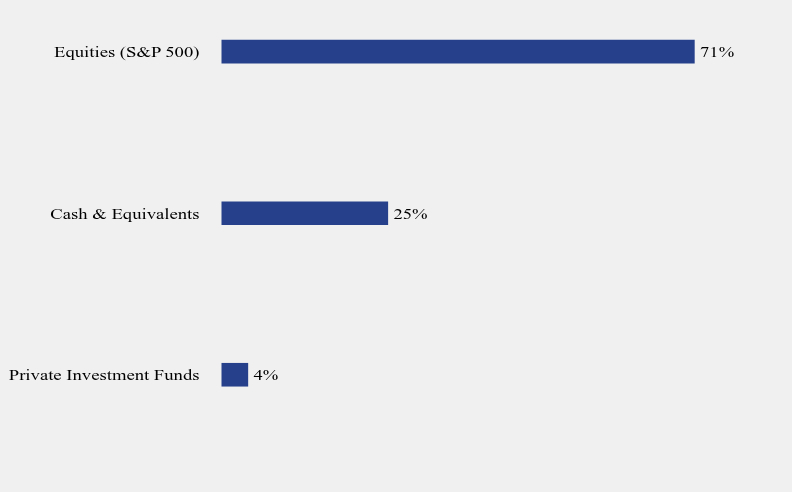
ETFs - Equity Index | 1.0% | Private Investment Funds | 4.0% | Swaps (International) | 11.0% | Cash & Equivalents | 25.0% | Futures (Equity Index) | 59.0% | |
|
| Largest Holdings [Text Block] |
Top 10 Holdings (% of net assets)Table SummaryHolding Name | % of Net Assets |
|---|
Fidelity Government Portfolio Class I, 3.520%,
| 32.9% |
|---|
First American Government Obligations Fund Class Z, 3.519%,
| 32.9% |
|---|
Hyperion Fund LLC | 8.5% |
|---|
First American Government Obligations Fund Class X, 3.559%,
| 6.0% |
|---|
Galaxy Plus Fund LLC - Icon Market Neutral Feeder Fund | 2.6% |
|---|
Invesco QQQ Trust Series 1 | 1.3% |
|---|
State Street SPDR S&P 500 ETF | 0.6% |
|---|
iShares Russell 2000 ETF | 0.1% |
|---|
|
|
| Material Fund Change [Text Block] |
This is a summary of certain changes to the Fund since July 1, 2025. For more complete information, you may review the Fund's prospectus dated April 3, 2026, which is available at www.quantifiedfunds.com/fund-documents or by emailing orderquantifiedfunds@ultimusfundsolutions.com or upon telephone request at (855) 647-8268. Principal Investment Strategy Changes: The Fund expanded its cryptocurrency investments beyond Bitcoin and expanded its indirect exposure to more types of futures contracts through commodity pools. Principal Investment Risk Changes: Related to the strategy change, the Fund’s additional risks include an expansion of futures contract risk to address currency futures, debt futures, equity futures, energy futures, metals futures, and agriculture commodity futures; as well as an expansion of cryptocurrency risk. |
|
| C000213662 |
|
|
| Shareholder Report [Line Items] |
|
|
| Fund Name |
Quantified Evolution Plus Fund
|
|
| Trading Symbol |
QEVOX
|
|
| Additional Information Phone Number |
(855) 647-8268
|
|
| Expenses [Text Block] |
What were the Fund’s costs for the last year?(based on a hypothetical $10,000 investment) Table SummaryClass Name | Costs of a $10,000 investment | Costs paid as a percentage of a $10,000 investment |
|---|
Investor | $223 | 1.66% |
|---|
|
|
| Expenses Paid, Amount |
$ 223
|
|
| Expense Ratio, Percent |
1.66%
|
|
| Factors Affecting Performance [Text Block] |
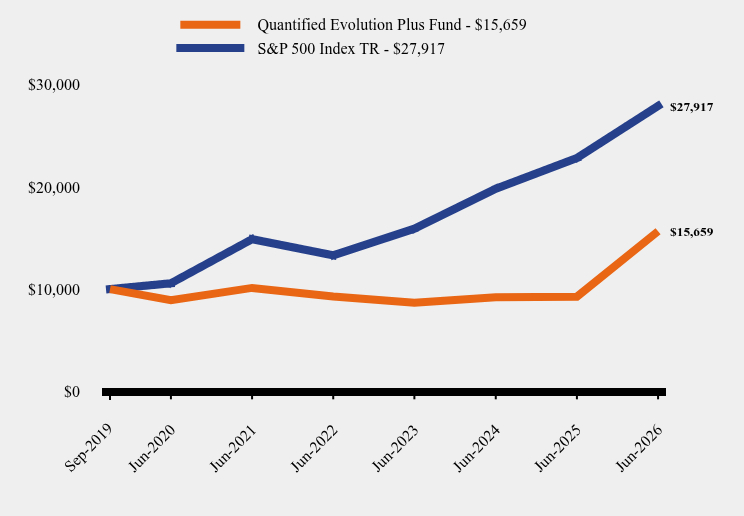
How did the Fund perform during the reporting period? The Fund rose 69.20% for the year ending June 30, 2026. The S&P 500 Total Return Index, the Fund’s benchmark, gained 22.32% for same period. Strategy The Quantified Evolution Plus Fund utilizes a strategy that seeks strong absolute risk-adjusted returns on a wide variety of asset classes. Techniques The Fund returned 3.62% for the third quarter of 2025. It outperformed the Credit Suisse Liquid Alternative Index, which gained 3.50%, but underperformed the S&P 500 Total Return Index, which gained 8.12%. The Fund remained defensive for most of the quarter. In July, it was primarily invested in Treasury bonds, which led to underperformance for the month. In mid-August, it shifted into equities, contributing to outperformance for the month. In September, the Fund was broadly diversified across the S&P 500, Real Estate, and European equities, and performance lagged the S&P 500 for the month. The Fund rose 8.86% for the fourth quarter. It outperformed the Credit Suisse Liquid Alternative Index, which gained 1.67%, and outperformed the S&P 500 TR Index, which gained 2.65%. In October, the Fund allocated heavily to gold, commodities, emerging market equities, and European equities. In November, the largest allocations were to gold and emerging market equities. December saw similarly heavy allocations to gold and emerging market equities. For the first quarter of 2026, the Fund rose 40.3%. It outperformed the Credit Suisse Liquid Alternative Index, which lost -0.12%, and the S&P 500 TR Index which lost -4.33%. In January, the Fund allocated heavily to gold, along with exposure to U.S., international, and emerging market stocks. In February, the Fund reduced its gold position by month-end and adjusted exposures to U.S., international, and emerging market stocks. A large commodities exposure was also established near the end of the month. Domestic equity exposure was extremely limited in March, with the Fund focusing on commodities, including smaller gold exposures, as well as international and emerging market stocks. The Fund gained 6.91% for the second quarter of 2026. It outperformed the Credit Suisse Liquid Alternative Index, which gained 0.68%, but underperformed the S&P 500 TR Index, which gained 15.20%. The Fund outperformed the S&P 500 TR Index in April, supported by a heavy commodities position. It underperformed the Index in May, remaining in commodities for much of the month with additional allocations to equities, gold and real estate. The Fund also underperformed in June, with allocations spread across domestic equities, emerging market equities and gold. |
|
| Performance Past Does Not Indicate Future [Text] |
The Fund’s past performance is not a good predictor of how the Fund will perform in the future.
|
|
| Line Graph [Table Text Block] |
Table Summary | Quantified Evolution Plus Fund | S&P 500 Index TR |
|---|
Sep-2019 | $10,000 | $10,000 |
|---|
Jun-2020 | $8,913 | $10,571 |
|---|
Jun-2021 | $10,116 | $14,883 |
|---|
Jun-2022 | $9,275 | $13,303 |
|---|
Jun-2023 | $8,676 | $15,910 |
|---|
Jun-2024 | $9,212 | $19,817 |
|---|
Jun-2025 | $9,255 | $22,822 |
|---|
Jun-2026 | $15,659 | $27,917 |
|---|
|
|
| Average Annual Return [Table Text Block] |
Table Summary | 1 Year | 5 Years | Since Inception (September 30, 2019) |
|---|
Quantified Evolution Plus Fund | 69.20% | 9.13% | 6.87% |
|---|
S&P 500 Index TR | 22.32% | 13.41% | 16.43% |
|---|
|
|
| Performance Inception Date |
Sep. 30, 2019
|
|
| No Deduction of Taxes [Text Block] |
The graph and table do not reflect the deduction of taxes that a shareholder would pay on fund distributions or redemption of fund shares.
|
|
| AssetsNet |
$ 26,109,696
|
|
| Holdings Count | Holding |
23
|
|
| Advisory Fees Paid, Amount |
$ 252,437
|
|
| InvestmentCompanyPortfolioTurnover |
1202.00%
|
|
| Additional Fund Statistics [Text Block] |
Table SummaryNet Assets | $26,109,696 |
|---|
Number of Portfolio Holdings | 23 |
|---|
Advisory Fee | $252,437 |
|---|
Portfolio Turnover | 1,202% |
|---|
|
|
| Holdings [Text Block] |
Asset Weighting (% of total investments)Table SummaryValue | Value |
|---|
Exchange-Traded Funds | 2.2% | Private Investment Funds | 13.1% | Money Market Funds | 84.7% | Security Type Weighting (% of total (including notional) exposure)Table SummaryValue | Value |
|---|
ETFs - Equity Index | 1.0% | Private Investment Funds | 4.0% | Swaps (International) | 11.0% | Cash & Equivalents | 25.0% | Futures (Equity Index) | 59.0% | |
|
| Largest Holdings [Text Block] |
Top 10 Holdings (% of net assets)Table SummaryHolding Name | % of Net Assets |
|---|
Fidelity Government Portfolio Class I, 3.520%,
| 32.9% |
|---|
First American Government Obligations Fund Class Z, 3.519%,
| 32.9% |
|---|
Hyperion Fund LLC | 8.5% |
|---|
First American Government Obligations Fund Class X, 3.559%,
| 6.0% |
|---|
Galaxy Plus Fund LLC - Icon Market Neutral Feeder Fund | 2.6% |
|---|
Invesco QQQ Trust Series 1 | 1.3% |
|---|
State Street SPDR S&P 500 ETF | 0.6% |
|---|
iShares Russell 2000 ETF | 0.1% |
|---|
|
|
| Material Fund Change [Text Block] |
This is a summary of certain changes to the Fund since July 1, 2025. For more complete information, you may review the Fund's prospectus dated April 3, 2026, which is available at www.quantifiedfunds.com/fund-documents or by emailing orderquantifiedfunds@ultimusfundsolutions.com or upon telephone request at (855) 647-8268. Principal Investment Strategy Changes: The Fund expanded its cryptocurrency investments beyond Bitcoin and expanded its indirect exposure to more types of futures contracts through commodity pools. Principal Investment Risk Changes: Related to the strategy change, the Fund’s additional risks include an expansion of futures contract risk to address currency futures, debt futures, equity futures, energy futures, metals futures, and agriculture commodity futures; as well as an expansion of cryptocurrency risk. |
|
| C000245743 |
|
|
| Shareholder Report [Line Items] |
|
|
| Fund Name |
Quantified Global Fund
|
|
| Trading Symbol |
QGBLX
|
|
| Annual or Semi-Annual Statement [Text Block] |
This annual shareholder report contains important information about Quantified Global Fund (the "Fund") for the period of July 1, 2025 to June 30, 2026.
|
|
| Additional Information [Text Block] |
You can find additional information about the Fund at www.quantifiedfunds.com/fund-documents. You can also request this information by contacting us at (855) 647-8268.
|
|
| Additional Information Phone Number |
(855) 647-8268
|
|
| Additional Information Website |
www.quantifiedfunds.com/fund-documents
|
|
| Expenses [Text Block] |
What were the Fund’s costs for the last year?(based on a hypothetical $10,000 investment) Table SummaryClass Name | Costs of a $10,000 investment | Costs paid as a percentage of a $10,000 investment |
|---|
Investor | $167 | 1.61% |
|---|
|
|
| Expenses Paid, Amount |
$ 167
|
|
| Expense Ratio, Percent |
1.61%
|
|
| Factors Affecting Performance [Text Block] |
How did the Fund perform during the reporting period? The Fund rose by 7.99% for the year ending June 30, 2026. The MSCI ACWI, the Fund’s benchmark, gained 23.67% for same period. Strategy The Quantified Global Fund seeks to provide foreign exposure (at least 40% under normal circumstances) using a dynamic tactical strategy. Techniques The Fund gained 6.76% in the third quarter of 2025, underperforming the MSCI ACWI Index, which gained 7.62%. In actively seeking the best opportunities in the then prevailing market environment, the Fund favored Financials in July, Energy in August, and Financials again in September. Its cash allocation rose from 10.78% in July to 18.10% in August, then declined to 15.66% in September. U.S. equity exposure was 0% in both July and August, rising to 0.44% in
September. The Fund returned -0.29% in the fourth quarter, underperforming the MSCI ACWI Index, which gained 3.29%. The Fund favored Financials and Energy as its two largest sector exposures in each month of the quarter. The Fund held a larger cash position of approximately 20% in October, which declined to below 10% in November and December. U.S. equity exposure was near 0% in October, above 5% in November, and above 10% in December. In the first quarter of 2026, the Fund returned 3.95%, outperforming the MSCI ACWI Index, which lost -3.2%. It remained heavily invested in equities throughout the period, holding no bonds and maintaining a cash position below 10%. The Fund favored Financials and Consumer Discretionary as its two largest sector exposures in January. In February, the largest sector exposures were to Financials and Energy. In March, the largest sector exposures were to Financials and Consumer Discretionary. The Fund returned -2.41% in the second quarter of 2026, underperforming the MSCI ACWI Index, which gained 14.93%. It remained heavily invested in equities throughout the quarter, holding no bonds and maintaining a cash position below 10%. In April the Fund’s largest sector exposures were Consumer Staples and Financials, shifting to Consumer Staples and Energy in May and to Energy and Health Care in June. The Fund increased its exposure to domestic equities over the course of the quarter, from 0% in April to 8.6% in May and 48.14% in June. |
|
| Performance Past Does Not Indicate Future [Text] |
The Fund’s past performance is not a good predictor of how the Fund will perform in the future.
|
|
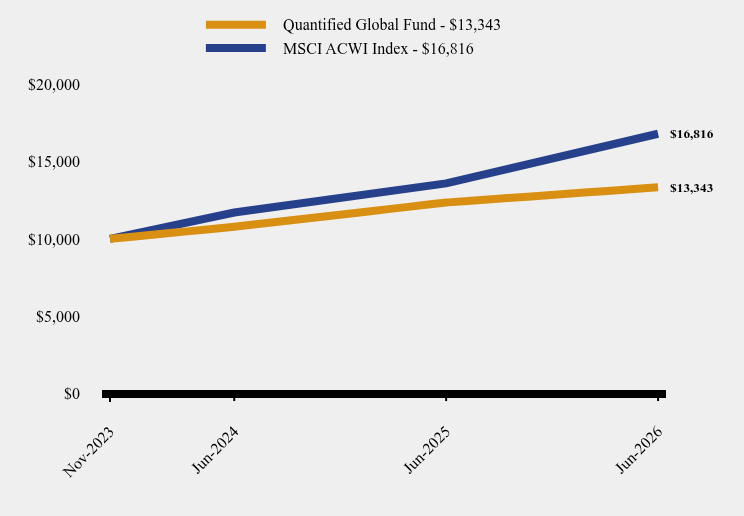
| Line Graph [Table Text Block] |
Table Summary | Quantified Global Fund | MSCI ACWI Index |
|---|
Nov-2023 | $10,000 | $10,000 |
|---|
Jun-2024 | $10,780 | $11,705 |
|---|
Jun-2025 | $12,356 | $13,597 |
|---|
Jun-2026 | $13,343 | $16,816 |
|---|
|
|
| Average Annual Return [Table Text Block] |
Table Summary | 1 Year | Since Inception (November 29, 2023) |
|---|
Quantified Global Fund | 7.99% | 11.80% |
|---|
MSCI ACWI Index | 23.67% | 22.26% |
|---|
|
|
| Performance Inception Date |
Nov. 29, 2023
|
|
| No Deduction of Taxes [Text Block] |
The graph and table do not reflect the deduction of taxes that a shareholder would pay on fund distributions or redemption of fund shares.
|
|
| AssetsNet |
$ 7,658,392
|
|
| Holdings Count | Holding |
41
|
|
| Advisory Fees Paid, Amount |
$ 252,841
|
|
| InvestmentCompanyPortfolioTurnover |
857.00%
|
|
| Additional Fund Statistics [Text Block] |
Table SummaryNet Assets | $7,658,392 |
|---|
Number of Portfolio Holdings | 41 |
|---|
Advisory Fee | $252,841 |
|---|
Portfolio Turnover | 857% |
|---|
|
|
| Holdings [Text Block] |
Asset Weighting (% of total investments)Table SummaryValue | Value |
|---|
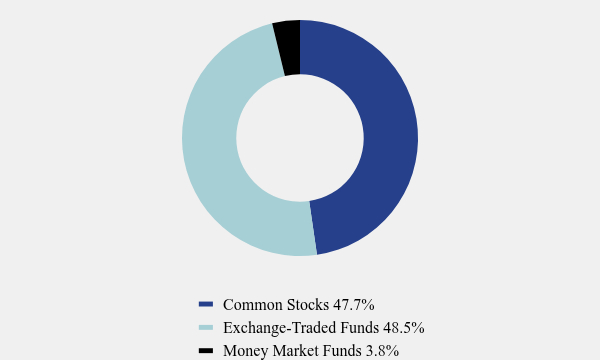
Common Stocks | 47.7% | Exchange-Traded Funds | 48.5% | Money Market Funds | 3.8% | Country Weighting (% of net assets)Table SummaryValue | Value |
|---|
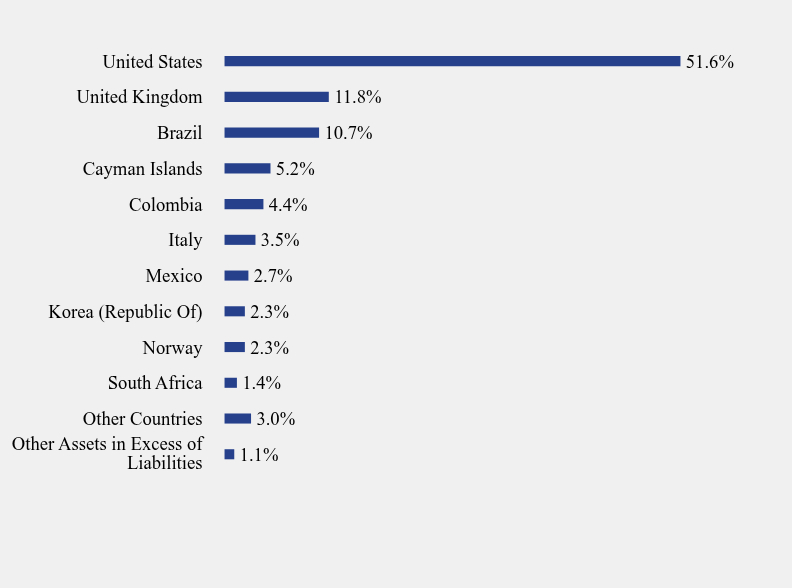
Other Assets in Excess of Liabilities | 1.1% | Other Countries | 3.0% | South Africa | 1.4% | Norway | 2.3% | Korea (Republic Of) | 2.3% | Mexico | 2.7% | Italy | 3.5% | Colombia | 4.4% | Cayman Islands | 5.2% | Brazil | 10.7% | United Kingdom | 11.8% | United States | 51.6% | |
|
| Largest Holdings [Text Block] |
Top 10 Holdings (% of net assets)Table SummaryHolding Name | % of Net Assets |
|---|
State Street SPDR S&P 500 ETF Trust | 33.0% |
|---|
Invesco QQQ Trust Series 1 | 15.0% |
|---|
Petroleo Brasileiro S.A. | 5.9% |
|---|
Haleon plc | 3.9% |
|---|
Eni SpA | 3.5% |
|---|
Shell PLC | 3.5% |
|---|
Ecopetrol S.A. | 3.3% |
|---|
BP PLC | 2.7% |
|---|
Equinor ASA | 2.3% |
|---|
Vista Energy S.A.B. de C.V. | 2.1% |
|---|
|
|
| Material Fund Change [Text Block] |
No material changes occurred during the year ended June 30, 2026. |
|
| C000226634 |
|
|
| Shareholder Report [Line Items] |
|
|
| Fund Name |
Quantified Government Income Tactical Fund
|
|
| Trading Symbol |
QGITX
|
|
| Additional Information Phone Number |
(855) 647-8268
|
|
| Expenses [Text Block] |
What were the
Fund’s costs for the last year?(based on a hypothetical $10,000 investment) Table SummaryClass Name | Costs of a $10,000 investment | Costs paid as a percentage of a $10,000 investment |
|---|
Investor | $158 | 1.60% |
|---|
|
|
| Expenses Paid, Amount |
$ 158
|
|
| Expense Ratio, Percent |
1.60%
|
|
| Factors Affecting Performance [Text Block] |
How did the Fund perform during the reporting period? The Fund returned -2.64% for the year ending June 30, 2026. The Fund’s benchmark, the Bloomberg U.S. Aggregate Bond Index returned 3.79% for the same period. Strategy The Quantified Government Tactical Income Fund is designed for investors seeking aggressive growth using U.S. government bond vehicles for trading. Techniques The Fund rose 2.87% for the third quarter of 2025, outperforming the Bloomberg U.S. Treasury 20+ Year Index, which gained 2.45%. Of the sub-strategies used in the Fund, 60% beat the benchmark and 60% delivered positive performance. The Fund switched exposure between inverse and long positions throughout the quarter. The Fund returned -0.51% for the fourth quarter of 2025, slightly underperforming the Bloomberg U.S. Treasury 20+ Year Index, which lost -0.48%. Of the sub-strategies used in the Fund, 60% beat the benchmark, and 20% delivered positive performance. The Fund shifted exposure between inverse and long positions throughout the quarter. In the first quarter of 2026, the Fund fell -1.43%, underperforming the Bloomberg Treasury 20+ Year index, which lost -0.30%. Of the sub-strategies used in the Fund, 20% posted gains, outperforming the benchmark. The Fund changed between inverse and long positions throughout the quarter. It declined -3.49% in the second quarter of 2026, underperforming the Bloomberg U.S. Treasury 20+ Year Index, which gained 0.88%. Of the sub-strategies used in the Fund, 60% had positive returns while 20% outperformed the benchmark. The Fund moved between inverse and leverage positions throughout the period. |
|
| Performance Past Does Not Indicate Future [Text] |
The Fund’s past performance is not a good predictor of how the Fund will perform in the future.
|
|
| Line Graph [Table Text Block] |
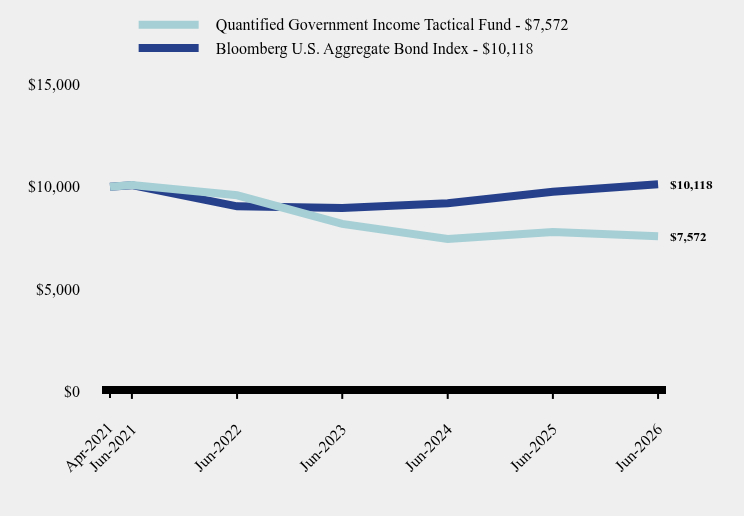
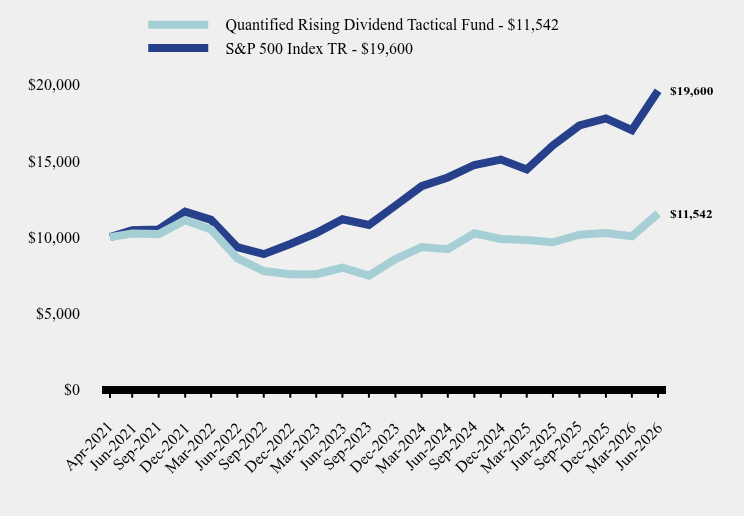
Table Summary | Quantified Government Income Tactical Fund | Bloomberg U.S. Aggregate Bond Index |
|---|
Apr-2021 | $10,000 | $10,000 |
|---|
Jun-2021 | $10,090 | $10,076 |
|---|
Jun-2022 | $9,581 | $9,039 |
|---|
Jun-2023 | $8,183 | $8,955 |
|---|
Jun-2024 | $7,445 | $9,190 |
|---|
Jun-2025 | $7,777 | $9,749 |
|---|
Jun-2026 | $7,572 | $10,118 |
|---|
|
|
| Average Annual Return [Table Text Block] |
Table Summary | 1 Year | 5 Years | Since Inception (April 15, 2021) |
|---|
Quantified Government Income Tactical Fund | -2.64% | -5.58% | -5.20% |
|---|
Bloomberg U.S. Aggregate Bond Index | 3.79% | 0.08% | 0.23% |
|---|
|
|
| Performance Inception Date |
Apr. 15, 2021
|
|
| No Deduction of Taxes [Text Block] |
The graph and table do not reflect the deduction of taxes that a shareholder would pay on fund distributions or redemption of fund shares.
|
|
| AssetsNet |
$ 24,416,809
|
|
| Holdings Count | Holding |
4
|
|
| Advisory Fees Paid, Amount |
$ 443,051
|
|
| InvestmentCompanyPortfolioTurnover |
9422.00%
|
|
| Additional Fund Statistics [Text Block] |
Table SummaryNet Assets | $24,416,809 |
|---|
Number of Portfolio Holdings | 4 |
|---|
Advisory Fee | $443,051 |
|---|
Portfolio Turnover | 9,422% |
|---|
|
|
| Holdings [Text Block] |
Asset Weighting (% of total investments)Table SummaryValue | Value |
|---|
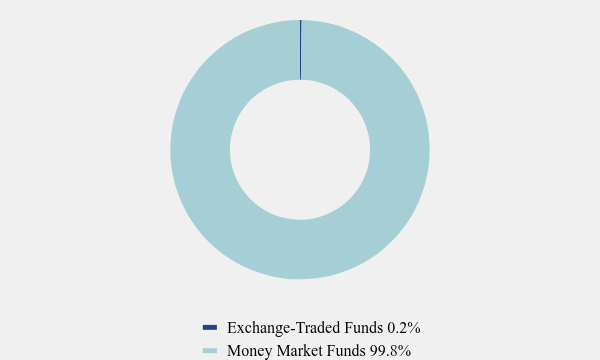
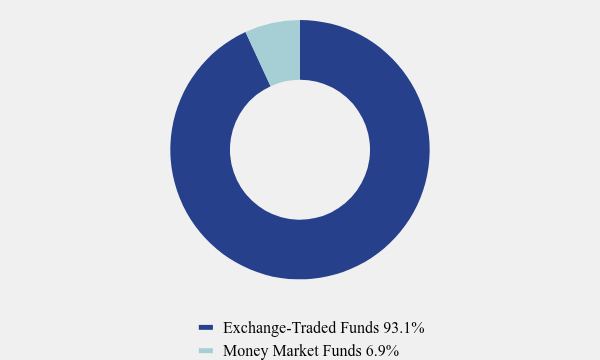
Exchange-Traded Funds | 0.2% | Money Market Funds | 99.8% | Security Type Weighting (% of total (including notional) exposure)Table SummaryValue | Value |
|---|
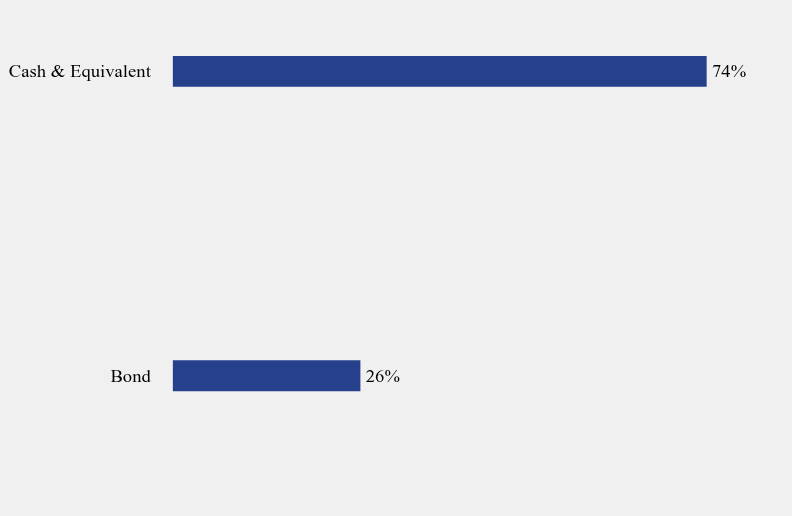
Bond | 26% | Cash & Equivalent | 74% | |
|
| Largest Holdings [Text Block] |
Top 10 Holdings (% of net assets)Table SummaryHolding Name | % of Net Assets |
|---|
Fidelity Government Portfolio Class I, 3.520%,
| 48.0% |
|---|
First American Government Obligations Fund Class Z, 3.519%,
| 48.0% |
|---|
iShares 20+ Year Treasury Bond ETF | 0.2% |
|---|
|
|
| Material Fund Change [Text Block] |
This is a summary of certain changes to the Fund since July 1, 2025. For more complete information, you may review the Fund's prospectus dated April 3, 2026, which is available at www.quantifiedfunds.com/fund-documents or by emailing orderquantifiedfunds@ultimusfundsolutions.com or upon telephone request at (855) 647-8268. Principal Investment Strategy Changes: The Fund formed a wholly owned subsidiary for the purpose of housing certain commodity pool investments in conformity with the tax regulations that apply to the Fund. Principal Investment Risk Changes: Related to the strategy change, the Fund’s additional risks include an expansion of futures contract risk to address currency futures, debt futures, equity futures, energy futures, metals futures, and agriculture commodity futures; as well as taxation risk; and wholly owned subsidiary risk. |
|
| C000159195 |
|
|
| Shareholder Report [Line Items] |
|
|
| Fund Name |
Quantified Managed Income Fund
|
|
| Trading Symbol |
QBDAX
|
|
| Additional Information Phone Number |
(855) 647-8268
|
|
| Expenses [Text Block] |
What were the Fund’s costs for the last year?(based on a hypothetical $10,000 investment) Table SummaryClass Name | Costs of a $10,000 investment | Costs paid as a percentage of a $10,000 investment |
|---|
Advisor | $194 | 1.95% |
|---|
|
|
| Expenses Paid, Amount |
$ 194
|
|
| Expense Ratio, Percent |
1.95%
|
|
| Factors Affecting Performance [Text Block] |
How did the Fund perform during the reporting period? The Fund returned -0.68 % for the year ending June 30, 2026. The Fund’s benchmark, the Bloomberg U.S. Aggregate Bond Index, returned 3.79 % for the same period. Strategy The Quantified Managed Income Fund selects income investments from a universe of bond, equity, REIT and MLP investments to create an optimized risk adjusted portfolio that is actively managed. Techniques The Fund rose 1.31 % for the third quarter of 2025, underperforming the Bloomberg U.S. Aggregate Bond Index, which gained 2.03%. The Fund’s actively traded long-term government-bond futures overlay was its best-performing component, significantly outperforming the benchmark; the dividend-paying stock sleeve was the worst performing component for the quarter. The Fund built up a sizable cash position in August, was reduced in September. It returned -0.98 % for the fourth quarter, underperforming the Bloomberg U.S. Aggregate Bond Index, which gained 1.10%. The Fund’s high-yield bond sleeve was its best-performing component; the dividend-paying stock sleeve was again the worst performing component for the quarter. The Fund’s cash position ranged between 20% and 25% for most of the quarter. For the first quarter of 2026, the Fund returned -0.50 %, underperforming the Bloomberg U.S. Aggregate Bond Index, which lost -0.05%. The Fund’s rotational sleeve was its best-performing component; while the long-term government bond futures sleeve was the worst performing component. The Fund’s cash allocation varied from 5%-25% during the quarter. The Fund returned -0.50 % for the second quarter of 2026, underperforming the Bloomberg U.S. Aggregate Bond Index, which gained 0.67%. The Fund’s dividend paying stock sleeve was its best-performing component; the high yield bond sleeve was the worst performing component. The Fund’s cash allocation ranged from 10%-20% throughout the quarter. |
|
| Performance Past Does Not Indicate Future [Text] |
The Fund’s past performance is not a good predictor of how the Fund will perform in the future.
|
|
| Average Annual Return [Table Text Block] |
Table Summary | 1 Year | 5 Years | 10 Years |
|---|
Quantified Managed Income Fund | -0.68% | 0.00% | -0.11% |
|---|
Bloomberg U.S. Aggregate Bond Index | 3.79% | 0.08% | 1.54% |
|---|
|
|
| No Deduction of Taxes [Text Block] |
The graph and table do not reflect the deduction of taxes that a shareholder would pay on fund distributions or redemption of fund shares.
|
|
| AssetsNet |
$ 110,099,442
|
|
| Holdings Count | Holding |
46
|
|
| Advisory Fees Paid, Amount |
$ 741,413
|
|
| InvestmentCompanyPortfolioTurnover |
1148.00%
|
|
| Additional Fund Statistics [Text Block] |
Table SummaryNet Assets | $110,099,442 |
|---|
Number of Portfolio Holdings | 46 |
|---|
Advisory Fee | $741,413 |
|---|
Portfolio Turnover | 1,148% |
|---|
|
|
| Holdings [Text Block] |
Asset Weighting (% of total investments)Table SummaryValue | Value |
|---|
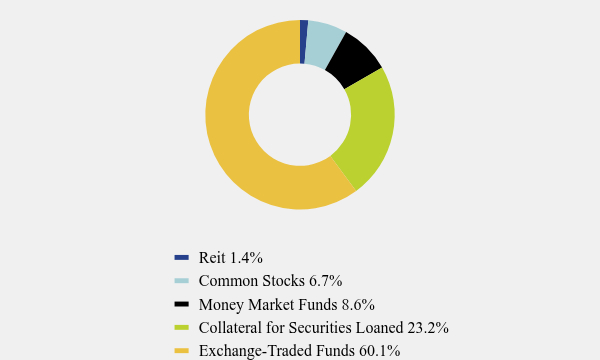
Reit | 1.4% | Common Stocks | 6.7% | Money Market Funds | 8.6% | Collateral for Securities Loaned | 23.2% | Exchange-Traded Funds | 60.1% | Security Type Weighting (% of total (including notional) exposure)Table SummaryValue | Value |
|---|
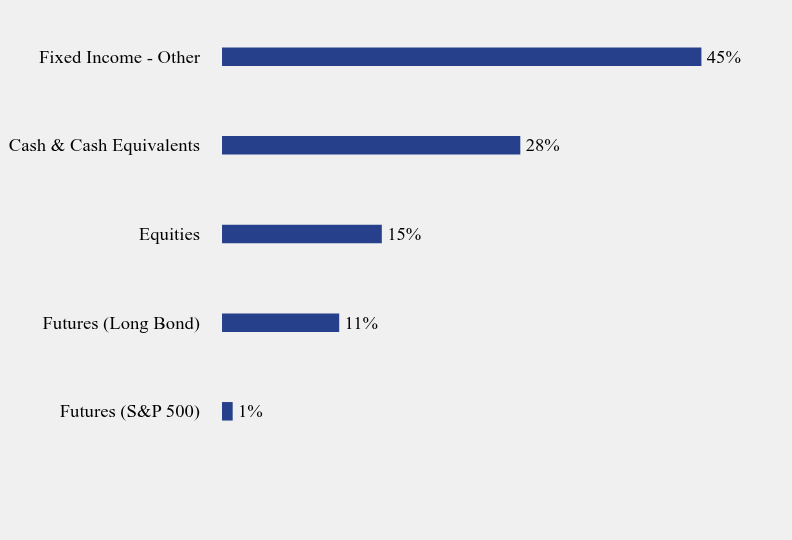
Futures (S&P 500) | 1% | Futures (Long Bond) | 11% | Equities | 15% | Cash & Cash Equivalents | 28% | Fixed Income - Other | 45% | |
|
| Largest Holdings [Text Block] |
Top 10 Holdings (% of net assets)Table SummaryHolding Name | % of Net Assets |
|---|
Mount Vernon Liquid Assets Portfolio, LLC | 30.1% |
|---|
iShares 1-3 Year Treasury Bond ETF | 27.3% |
|---|
State Street SPDR Bloomberg Convertible Securities ETF | 7.2% |
|---|
Invesco Emerging Markets Sovereign Debt ETF | 7.0% |
|---|
iShares MBS ETF | 7.0% |
|---|
Alerian MLP ETF | 6.8% |
|---|
iShares 20+ Year Treasury Bond ETF | 6.3% |
|---|
Fidelity Government Portfolio - Class I | 5.6% |
|---|
First American Government Obligations Fund - Class Z | 5.6% |
|---|
WisdomTree US LargeCap Dividend Fund | 5.1% |
|---|
|
|
| Material Fund Change [Text Block] |
This is a summary of certain changes to the Fund since July 1, 2025. For more complete information, you may review the Fund's prospectus dated April 3, 2026, which is available at www.quantifiedfunds.com/fund-documents or by emailing orderquantifiedfunds@ultimusfundsolutions.com or upon telephone request at (855) 647-8268. Principal Investment Strategy Changes: The Fund formed a wholly owned subsidiary for the purpose of housing certain commodity pool investments in conformity with the tax regulations that apply to the Fund. Principal Investment Risk Changes: Related to the strategy change, the Fund’s additional risks include an expansion of futures contract risk to address currency futures, debt futures, equity futures, energy futures, metals futures, and agriculture commodity futures; as well as taxation risk; and wholly owned subsidiary risk. |
|
| C000129682 |
|
|
| Shareholder Report [Line Items] |
|
|
| Fund Name |
Quantified Managed Income Fund
|
|
| Trading Symbol |
QBDSX
|
|
| Additional Information Phone Number |
(855) 647-8268
|
|
| Expenses [Text Block] |
What were the Fund’s costs for the last year?(based on a hypothetical $10,000 investment) Table SummaryClass Name | Costs of a $10,000 investment | Costs paid as a percentage of a $10,000 investment |
|---|
Investor | $135 | 1.35% |
|---|
|
|
| Expenses Paid, Amount |
$ 135
|
|
| Expense Ratio, Percent |
1.35%
|
|
| Factors Affecting Performance [Text Block] |
How did the Fund perform during the reporting period? The Fund returned -0.12% for the year ending June 30, 2026. The Fund’s benchmark, the Bloomberg U.S. Aggregate Bond Index, returned 3.79 % for the same period. Strategy The Quantified Managed Income Fund selects income investments from a universe of bond, equity, REIT and MLP investments to create an optimized risk adjusted portfolio that is actively managed. Techniques The Fund rose 1.46% for the third quarter of 2025, underperforming the Bloomberg U.S. Aggregate Bond Index, which gained 2.03%. The Fund’s actively traded long-term government-bond futures overlay was its best-performing component, significantly outperforming the benchmark; the dividend-paying stock sleeve was the worst performing component for the quarter. The Fund built up a sizable cash position in August, which was reduced in September. It returned -0.80% for the fourth quarter of 2025, underperforming the Bloomberg U.S. Aggregate Bond Index, which gained 1.10%. The Fund’s high-yield bond sleeve was its best-performing component; the dividend-paying stock sleeve was again the worst performing component for the quarter. The Fund’s cash position ranged between 20% and 25% for most of the quarter. For the first quarter of 2026, the Fund returned -0.38%, underperforming the Bloomberg U.S. Aggregate Bond Index, which returned -0.05%. The Fund’s rotational sleeve was its best-performing component; while the long-term government bond futures sleeve was the worst performing component. The Fund’s cash allocation varied from 5%-25% during the quarter. The Fund returned -0.38% for the second quarter of 2026, underperforming the Bloomberg U.S. Aggregate Bond Index, which gained 0.67%. The Fund’s dividend paying stock sleeve was its best-performing component; the high yield bond sleeve was the worst performing component. The Fund’s cash allocation ranged from 10%-20% throughout the quarter. |
|
| Performance Past Does Not Indicate Future [Text] |
The Fund’s past performance is not a good predictor of how the Fund will perform in the future.
|
|
| Average Annual Return [Table Text Block] |
Table Summary | 1 Year | 5 Years | 10 Years |
|---|
Quantified Managed Income Fund | -0.12% | 0.60% | 0.54% |
|---|
Bloomberg U.S. Aggregate Bond Index | 3.79% | 0.08% | 1.54% |
|---|
|
|
| No Deduction of Taxes [Text Block] |
The graph and table do not reflect the deduction of taxes that a shareholder would pay on fund distributions or redemption of fund shares.
|
|
| AssetsNet |
$ 110,099,442
|
|
| Holdings Count | Holding |
46
|
|
| Advisory Fees Paid, Amount |
$ 741,413
|
|
| InvestmentCompanyPortfolioTurnover |
1148.00%
|
|
| Additional Fund Statistics [Text Block] |
Table SummaryNet Assets | $110,099,442 |
|---|
Number of Portfolio Holdings | 46 |
|---|
Advisory Fee | $741,413 |
|---|
Portfolio Turnover | 1,148% |
|---|
|
|
| Holdings [Text Block] |
Asset Weighting (% of total investments)Table SummaryValue | Value |
|---|
Reit | 1.4% | Common Stocks | 6.7% | Money Market Funds | 8.6% | Collateral for Securities Loaned | 23.2% | Exchange-Traded Funds | 60.1% | Security Type Weighting (% of total (including notional) exposure)Table SummaryValue | Value |
|---|
Futures (S&P 500) | 1% | Futures (Long Bond) | 11% | Equities | 15% | Cash & Cash Equivalents | 28% | Fixed Income - Other | 45% | |
|
| Largest Holdings [Text Block] |
Top 10 Holdings (% of net assets)Table SummaryHolding Name | % of Net Assets |
|---|
Mount Vernon Liquid Assets Portfolio, LLC | 30.1% |
|---|
iShares 1-3 Year Treasury Bond ETF | 27.3% |
|---|
State Street SPDR Bloomberg Convertible Securities ETF | 7.2% |
|---|
Invesco Emerging Markets Sovereign Debt ETF | 7.0% |
|---|
iShares MBS ETF | 7.0% |
|---|
Alerian MLP ETF | 6.8% |
|---|
iShares 20+ Year Treasury Bond ETF | 6.3% |
|---|
Fidelity Government Portfolio - Class I | 5.6% |
|---|
First American Government Obligations Fund - Class Z | 5.6% |
|---|
WisdomTree US LargeCap Dividend Fund | 5.1% |
|---|
|
|
| Material Fund Change [Text Block] |
This is a summary of certain changes to the Fund since July 1, 2025. For more complete information, you may review the Fund's prospectus dated April 3, 2026, which is available at www.quantifiedfunds.com/fund-documents or by emailing orderquantifiedfunds@ultimusfundsolutions.com or upon telephone request at (855) 647-8268. Principal Investment Strategy Changes: The Fund formed a wholly owned subsidiary for the purpose of housing certain commodity pool investments in conformity with the tax regulations that apply to the Fund. Principal Investment Risk Changes: Related to the strategy change, the Fund’s additional risks include an expansion of futures contract risk to address currency futures, debt futures, equity futures, energy futures, metals futures, and agriculture commodity futures; as well as taxation risk; and wholly owned subsidiary risk. |
|
| C000159197 |
|
|
| Shareholder Report [Line Items] |
|
|
| Fund Name |
Quantified Market Leaders Fund
|
|
| Trading Symbol |
QMLAX
|
|
| Annual or Semi-Annual Statement [Text Block] |
This annual shareholder report contains important information about Quantified Market Leaders Fund (the "Fund") for the period of July 1, 2025 to June 30, 2026.
|
|
| Additional Information [Text Block] |
You can find additional information about the Fund at www.quantifiedfunds.com/fund-documents. You can also request this information by contacting us at (855) 647-8268.
|
|
| Additional Information Phone Number |
(855) 647-8268
|
|
| Additional Information Website |
www.quantifiedfunds.com/fund-documents
|
|
| Expenses [Text Block] |
What were the Fund’s costs for the last year?(based on a hypothetical $10,000 investment) Table SummaryClass Name | Costs of a $10,000 investment | Costs paid as a percentage of a $10,000 investment |
|---|
Advisor | $225 | 1.95% |
|---|
|
|
| Expenses Paid, Amount |
$ 225
|
|
| Expense Ratio, Percent |
1.95%
|
|
| Factors Affecting Performance [Text Block] |
How did the Fund perform during the reporting period? The Fund returned 30.65% for the year ending June 30, 2026. The MSCI ACWI (All Country World Index), the Fund’s benchmark, rose 23.67%, while the Morningstar Aggressive Target Risk Index, the Fund’s secondary benchmark was up 22.60% for the same period. Strategy The Fund pursues an active asset allocation strategy designed to overweight portfolio investments into the top-performing asset classes while eliminating exposure to under-performing assets. Techniques The Fund rose 10.86% in the third quarter of 2025, outperforming the MSCI ACWI (All Country World Index) which gained 7.62%. The Fund traded infrequently throughout the quarter, identifying the market’s strong upward trend and maintaining leveraged exposure throughout the period. The Fund fell -1.85 % in the fourth quarter, underperforming the MSCI ACWI (All Country World Index) which gained 3.29%. The Fund traded infrequently throughout the quarter, maintaining leveraged exposure. The sideways movement in equity markets over the quarter led to underperformance. In the first quarter of 2026, the Fund fell -1.54%, slightly underperforming the MSCI ACWI which declined -1.51%. The Fund adjusted its exposure multiple times throughout the quarter, reducing it considerably at the end of March in response to market weakness. Tactical movements between equity segments, combined with exposure adjustments, contributed to the Fund’s outperformance. The Fund rose 21.95% in the second quarter of 2026, outperforming the MSCI ACWI which gained 14.93%. The Fund maintained more than 100% market exposure from mid-April through the end of the quarter. Tactical movements across equity segments, combined with the use of leverage, also contributed to outperformance for the quarter. |
|
| Performance Past Does Not Indicate Future [Text] |
The Fund’s past performance is not a good predictor of how the Fund will perform in the future.
|
|
| Line Graph [Table Text Block] |
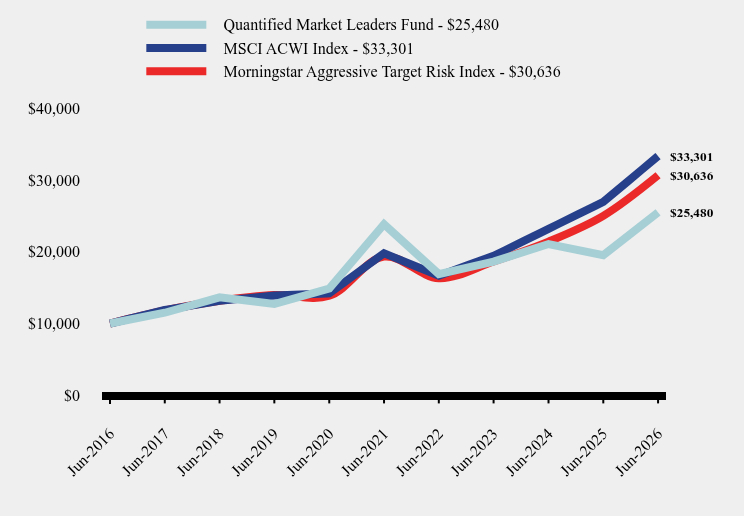
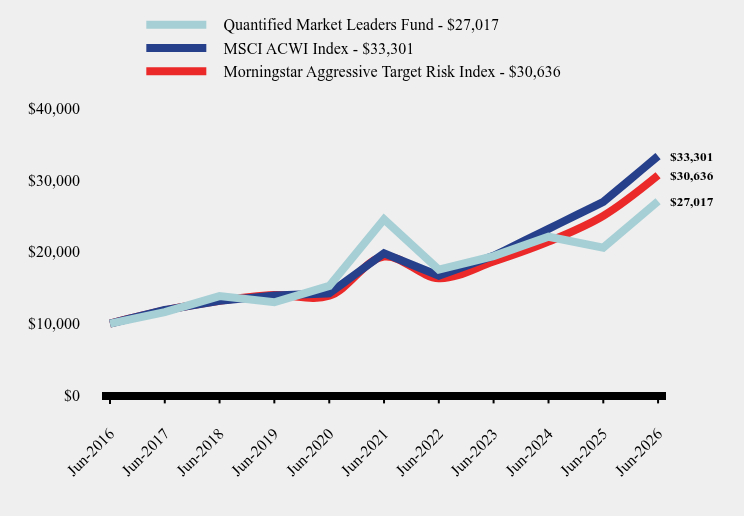
Table Summary | Quantified Market Leaders Fund | MSCI ACWI Index | Morningstar Aggressive Target Risk Index |
|---|
Jun-2016 | $10,000 | $10,000 | $10,000 |
|---|
Jun-2017 | $11,505 | $11,879 | $11,823 |
|---|
Jun-2018 | $13,642 | $13,153 | $13,173 |
|---|
Jun-2019 | $12,719 | $13,908 | $13,973 |
|---|
Jun-2020 | $14,866 | $14,202 | $13,860 |
|---|
Jun-2021 | $23,819 | $19,778 | $19,324 |
|---|
Jun-2022 | $16,890 | $16,663 | $16,309 |
|---|
Jun-2023 | $18,620 | $19,417 | $18,632 |
|---|
Jun-2024 | $21,067 | $23,179 | $21,403 |
|---|
Jun-2025 | $19,503 | $26,927 | $24,989 |
|---|
Jun-2026 | $25,480 | $33,301 | $30,636 |
|---|
|
|
| Average Annual Return [Table Text Block] |
Table Summary | 1 Year | 5 Years | 10 Years |
|---|
Quantified Market Leaders Fund | 30.65% | 1.36% | 9.80% |
|---|
MSCI ACWI Index | 23.67% | 10.98% | 12.78% |
|---|
Morningstar Aggressive Target Risk Index | 22.60% | 9.66% | 11.85% |
|---|
|
|
| No Deduction of Taxes [Text Block] |
The graph and table do not reflect the deduction of taxes that a shareholder would pay on fund distributions or redemption of fund shares.
|
|
| AssetsNet |
$ 75,287,202
|
|
| Holdings Count | Holding |
24
|
|
| Advisory Fees Paid, Amount |
$ 825,059
|
|
| InvestmentCompanyPortfolioTurnover |
860.00%
|
|
| Additional Fund Statistics [Text Block] |
Table SummaryNet Assets | $75,287,202 |
|---|
Number of Portfolio Holdings | 24 |
|---|
Advisory Fee | $825,059 |
|---|
Portfolio Turnover | 860% |
|---|
|
|
| Holdings [Text Block] |
Asset Weighting (% of total investments)Table SummaryValue | Value |
|---|
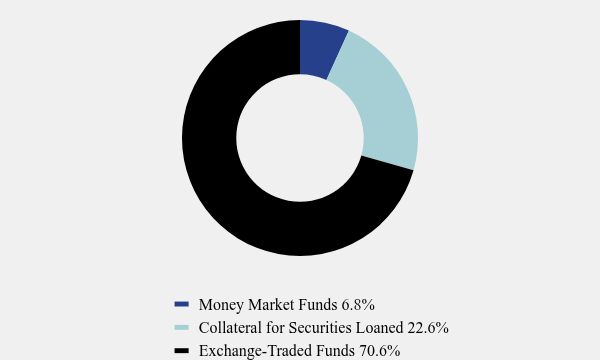
Money Market Funds | 6.8% | Collateral for Securities Loaned | 22.6% | Exchange-Traded Funds | 70.6% | Security Type Weighting (% of total (including notional) exposure)Table SummaryValue | Value |
|---|
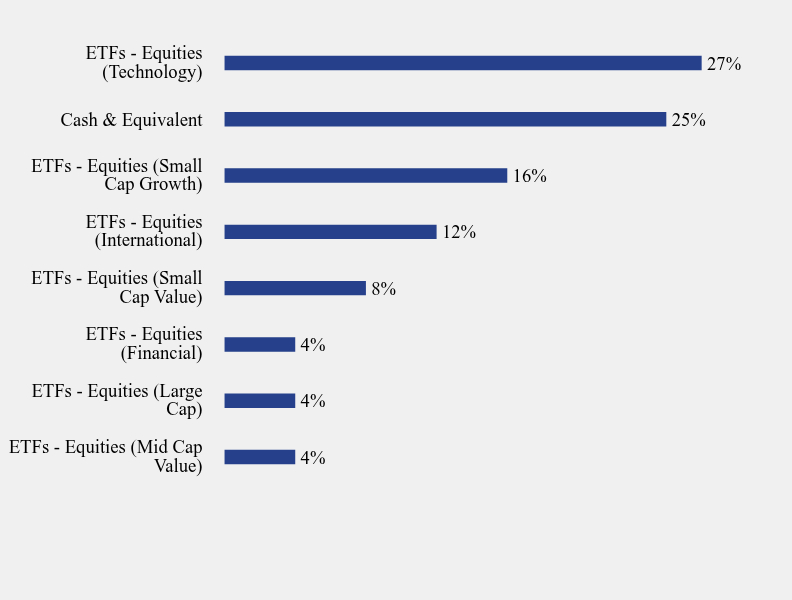
ETFs - Equities (Mid Cap Value) | 4% | ETFs - Equities (Large Cap) | 4% | ETFs - Equities (Financial) | 4% | ETFs - Equities (Small Cap Value) | 8% | ETFs - Equities (International) | 12% | ETFs - Equities (Small Cap Growth) | 16% | Cash & Equivalent | 25% | ETFs - Equities (Technology) | 27% | |
|
| Largest Holdings [Text Block] |
Top 10 Holdings (% of net assets)Table SummaryHolding Name | % of Net Assets |
|---|
Mount Vernon Liquid Assets Portfolio, LLC | 28.0% |
|---|
iShares MSCI Emerging Markets ETF | 19.9% |
|---|
ProShares Ultra QQQ | 16.0% |
|---|
iShares Russell 2000 Value ETF | 13.2% |
|---|
Direxion Daily S&P 500 Bull 2X Shares | 10.3% |
|---|
State Street Financial Select Sector SPDR ETF | 7.2% |
|---|
iShares Russell Mid-Cap Value ETF | 6.5% |
|---|
iShares 1-3 Year Treasury Bond ETF | 5.1% |
|---|
First American Government Obligations Fund, Class Z | 4.2% |
|---|
Fidelity Government Portfolio, Class I | 4.2% |
|---|
|
|
| Material Fund Change [Text Block] |
No material changes occurred during the year ended June 30, 2026. |
|
| C000129684 |
|
|
| Shareholder Report [Line Items] |
|
|
| Fund Name |
Quantified Market Leaders Fund
|
|
| Trading Symbol |
QMLFX
|
|
| Annual or Semi-Annual Statement [Text Block] |
This annual shareholder report contains important information about Quantified Market Leaders Fund (the "Fund") for the period of July 1, 2025 to June 30, 2026.
|
|
| Additional Information [Text Block] |
You can find additional information about the Fund at www.quantifiedfunds.com/fund-documents. You can also request this information by contacting us at (855) 647-8268.
|
|
| Additional Information Phone Number |
(855) 647-8268
|
|
| Additional Information Website |
www.quantifiedfunds.com/fund-documents
|
|
| Expenses [Text Block] |
What were the Fund’s costs for the last year?(based on a hypothetical $10,000 investment) Table SummaryClass Name | Costs of a $10,000 investment | Costs paid as a percentage of a $10,000 investment |
|---|
Investor | $156 | 1.35% |
|---|
|
|
| Expenses Paid, Amount |
$ 156
|
|
| Expense Ratio, Percent |
1.35%
|
|
| Factors Affecting Performance [Text Block] |
How did the Fund perform during the reporting period? The Fund returned 31.42% for the year ending June 30, 2026. The MSCI ACWI (All Country World Index), the Fund’s benchmark, rose 23.67%, while the Morningstar Aggressive Target Risk Index, the Fund’s secondary benchmark was up 22.60% for the same period. Strategy The Fund pursues an active asset allocation strategy designed to overweight portfolio investments into the top-performing asset classes while eliminating exposure to under-performing assets. Techniques The Fund rose 11.13% in the third quarter of 2025, outperforming the MSCI ACWI (All Country World Index) which gained 7.62%. The Fund traded infrequently throughout the quarter, identifying the market’s strong upward trend and maintaining leveraged exposure throughout the period. The Fund fell -1.79% in the fourth quarter, underperforming the MSCI which gained 3.29%. The Fund traded infrequently throughout the quarter, maintaining leveraged exposure. The sideways movement in equity markets over the quarter led to underperformance. In the first quarter of 2026, the Fund fell -1.41%, outperforming the MSCI ACWI which declined -1.51%. The Fund adjusted its exposure multiple times throughout the quarter, reducing it considerably at the end of March in response to market weakness. Tactical movements between equity segments, combined with exposure adjustments, contributed to the Fund’s outperformance. The Fund rose 22.13% in the second quarter of 2026, outperforming the MSCI ACWI which gained 14.93%. The Fund maintained more than 100% market exposure from mid-April through the end of the quarter. Tactical movements across equity segments, combined with the use of leverage, also contributed to outperformance for the quarter. |
|
| Performance Past Does Not Indicate Future [Text] |
The Fund’s past performance is not a good predictor of how the Fund will perform in the future.
|
|
| Line Graph [Table Text Block] |
Table Summary | Quantified Market Leaders Fund | MSCI ACWI Index | Morningstar Aggressive Target Risk Index |
|---|
Jun-2016 | $10,000 | $10,000 | $10,000 |
|---|
Jun-2017 | $11,580 | $11,879 | $11,823 |
|---|
Jun-2018 | $13,820 | $13,153 | $13,173 |
|---|
Jun-2019 | $12,966 | $13,908 | $13,973 |
|---|
Jun-2020 | $15,233 | $14,202 | $13,860 |
|---|
Jun-2021 | $24,515 | $19,778 | $19,324 |
|---|
Jun-2022 | $17,493 | $16,663 | $16,309 |
|---|
Jun-2023 | $19,392 | $19,417 | $18,632 |
|---|
Jun-2024 | $22,084 | $23,179 | $21,403 |
|---|
Jun-2025 | $20,558 | $26,927 | $24,989 |
|---|
Jun-2026 | $27,017 | $33,301 | $30,636 |
|---|
|
|
| Average Annual Return [Table Text Block] |
Table Summary | 1 Year | 5 Years | 10 Years |
|---|
Quantified Market Leaders Fund | 31.42% | 1.96% | 10.45% |
|---|
MSCI ACWI Index | 23.67% | 10.98% | 12.78% |
|---|
Morningstar Aggressive Target Risk Index | 22.60% | 9.66% | 11.85% |
|---|
|
|
| No Deduction of Taxes [Text Block] |
The graph and table do not reflect the deduction of taxes that a shareholder would pay on fund distributions or redemption of fund shares.
|
|
| AssetsNet |
$ 75,287,202
|
|
| Holdings Count | Holding |
24
|
|
| Advisory Fees Paid, Amount |
$ 825,059
|
|
| InvestmentCompanyPortfolioTurnover |
860.00%
|
|
| Additional Fund Statistics [Text Block] |
Table SummaryNet Assets | $75,287,202 |
|---|
Number of Portfolio Holdings | 24 |
|---|
Advisory Fee | $825,059 |
|---|
Portfolio Turnover | 860% |
|---|
|
|
| Holdings [Text Block] |
Asset Weighting (% of total investments)Table SummaryValue | Value |
|---|
Money Market Funds | 6.8% | Collateral for Securities Loaned | 22.6% | Exchange-Traded Funds | 70.6% | Security Type Weighting (% of total (including notional) exposure)Table SummaryValue | Value |
|---|
ETFs - Equities (Mid Cap Value) | 4% | ETFs - Equities (Large Cap) | 4% | ETFs - Equities (Financial) | 4% | ETFs - Equities (Small Cap Value) | 8% | ETFs - Equities (International) | 12% | ETFs - Equities (Small Cap Growth) | 16% | Cash & Equivalent | 25% | ETFs - Equities (Technology) | 27% | |
|
| Largest Holdings [Text Block] |
Top 10 Holdings (% of net assets)Table SummaryHolding Name | % of Net Assets |
|---|
Mount Vernon Liquid Assets Portfolio, LLC | 28.0% |
|---|
iShares MSCI Emerging Markets ETF | 19.9% |
|---|
ProShares Ultra QQQ | 16.0% |
|---|
iShares Russell 2000 Value ETF | 13.2% |
|---|
Direxion Daily S&P 500 Bull 2X Shares | 10.3% |
|---|
State Street Financial Select Sector SPDR ETF | 7.2% |
|---|
iShares Russell Mid-Cap Value ETF | 6.5% |
|---|
iShares 1-3 Year Treasury Bond ETF | 5.1% |
|---|
First American Government Obligations Fund, Class Z | 4.2% |
|---|
Fidelity Government Portfolio, Class I | 4.2% |
|---|
|
|
| Material Fund Change [Text Block] |
No material changes occurred during the year ended June 30, 2026. |
|
| C000213664 |
|
|
| Shareholder Report [Line Items] |
|
|
| Fund Name |
Quantified Pattern Recognition Fund
|
|
| Trading Symbol |
QSPMX
|
|
| Additional Information Phone Number |
(855) 647-8268
|
|
| Expenses [Text Block] |
What were the Fund’s costs for the last year?(based on a hypothetical $10,000 investment) Table SummaryClass Name | Costs of a $10,000 investment | Costs paid as a percentage of a $10,000 investment |
|---|
Investor | $173 | 1.61% |
|---|
|
|
| Expenses Paid, Amount |
$ 173
|
|
| Expense Ratio, Percent |
1.61%
|
|
| Factors Affecting Performance [Text Block] |
How did the Fund perform during the reporting period? The Fund returned 15.19% for the year ending June 30. 2026. The S&P 500 Total Return Index, the Fund’s primary benchmark, returned 22.32% for the same period. The Fund’s secondary benchmark, a blended index of 50% of the S&P 500 Total Return Index and the Bloomberg U.S. Aggregate Bond Index, was up 12.90% for the year. Strategy The Quantified Pattern Recognition Fund seeks out daily patterns in the stock market that have been found to be determinative of probable future price direction. Techniques The Fund rose 9.85% for the third quarter of 2025, outperforming the S&P 500, which gained 8.12%. In July, the Fund was primarily inverse, resulting in underperformance. In August, it turned to long leverage positions, contributing to outperformance for the month. In September, the Fund shifted between neutral and long exposures, leading to slight underperformance that month. The Fund rose 9.97% for the fourth quarter, outperforming the S&P 500, which gained 2.65%. The Fund was long for most of October, though it underperformed for the month. The Fund was defensive in the first half of November and aggressive in the second half, outperforming significantly for the month. The Fund followed a similar pattern in December, being much more aggressive in the second half of the month, outperforming again. For the first quarter of 2026, the Fund fell -7.18%, underperforming the S&P 500 TR Index which declined -4.33%. While the Fund maintained long S&P 500 exposure throughout the quarter, the level fluctuated. Outperformance in January was offset by setbacks in February and March resulting in underperformance for the quarter. The Fund rose 2.73% for the second quarter of 2026, underperforming the S&P 500 TR Index, which gained 15.20%. The Fund moved between inverse and leveraged positions throughout the quarter. Outperformance in June was offset by underperformance in April and May. |
|
| Performance Past Does Not Indicate Future [Text] |
The Fund’s past performance is not a good predictor of how the Fund will perform in the future.
|
|
| Line Graph [Table Text Block] |
Table Summary | Quantified Pattern Recognition Fund | S&P 500 Index TR | 50/50 S&P 500/Bloomberg Aggregate Bond |
|---|
Aug-2019 | $10,000 | $10,000 | $10,000 |
|---|
Jun-2020 | $10,890 | $10,769 | $10,729 |
|---|
Jun-2021 | $13,962 | $15,162 | $12,752 |
|---|
Jun-2022 | $10,962 | $13,552 | $11,452 |
|---|
Jun-2023 | $14,829 | $16,208 | $12,503 |
|---|
Jun-2024 | $15,340 | $20,188 | $14,155 |
|---|
Jun-2025 | $17,264 | $23,249 | $15,672 |
|---|
Jun-2026 | $19,886 | $28,439 | $17,694 |
|---|
|
|
| Average Annual Return [Table Text Block] |
Table Summary | 1 Year | 5 Years | Since Inception (August 30, 2019) |
|---|
Quantified Pattern Recognition Fund | 15.19% | 7.33% | 10.58% |
|---|
S&P 500 Index TR | 22.32% | 13.41% | 16.52% |
|---|
50/50 S&P 500/Bloomberg Aggregate Bond | 12.90% | 6.77% | 8.72% |
|---|
|
|
| Performance Inception Date |
Aug. 30, 2019
|
|
| No Deduction of Taxes [Text Block] |
The graph and table do not reflect the deduction of taxes that a shareholder would pay on fund distributions or redemption of fund shares.
|
|
| AssetsNet |
$ 46,476,929
|
|
| Holdings Count | Holding |
5
|
|
| Advisory Fees Paid, Amount |
$ 527,653
|
|
| InvestmentCompanyPortfolioTurnover |
294.00%
|
|
| Additional Fund Statistics [Text Block] |
Table SummaryNet Assets | $46,476,929 |
|---|
Number of Portfolio Holdings | 5 |
|---|
Advisory Fee | $527,653 |
|---|
Portfolio Turnover | 294% |
|---|
|
|
| Holdings [Text Block] |
Asset Weighting (% of total investments)Table SummaryValue | Value |
|---|
Exchange-Traded Funds | 0.4% | Private Investment Funds | 12.7% | Money Market Funds | 86.9% | Security Type Weighting (% of total (including notional) exposure)Table SummaryValue | Value |
|---|
Private Investment Funds | 4% | Cash & Equivalents | 25% | Equities (S&P 500) | 71% | |
|
| Largest Holdings [Text Block] |
Top 10 Holdings (% of net assets)Table SummaryHolding Name | % of Net Assets |
|---|
Fidelity Government Portfolio Class I, 3.520%,
| 35.5% |
|---|
First American Government Obligations Fund Class Z, 3.519%,
| 35.4% |
|---|
Hyperion Fund LLC | 10.4% |
|---|
State Street SPDR S&P 500 ETF Trust | 0.3% |
|---|
|
|
| Material Fund Change [Text Block] |
This is a summary of certain changes to the Fund since July 1, 2025. For more complete information, you may review the Fund's prospectus dated April 3, 2026, which is available at www.quantifiedfunds.com/fund-documents or by emailing orderquantifiedfunds@ultimusfundsolutions.com or upon telephone request at (855) 647-8268. Principal Investment Strategy Changes: The Fund formed a wholly owned subsidiary for the purpose of housing certain commodity pool investments in conformity with the tax regulations that apply to the Fund. Principal Investment Risk Changes: Related to the strategy change, the Fund’s additional risks include an expansion of futures contract risk to address currency futures, debt futures, equity futures, energy futures, metals futures, and agriculture commodity futures; as well as taxation risk; and wholly owned subsidiary risk. |
|
| C000226637 |
|
|
| Shareholder Report [Line Items] |
|
|
| Fund Name |
Quantified Rising Dividend Tactical Fund
|
|
| Trading Symbol |
QRDTX
|
|
| Annual or Semi-Annual Statement [Text Block] |
This annual shareholder report contains important information about Quantified Rising Dividend Tactical Fund (the "Fund") for the period of July 1, 2025 to June 30, 2026.
|
|
| Additional Information [Text Block] |
You can find additional information about the Fund at www.quantifiedfunds.com/fund-documents. You can also request this information by contacting us at (855) 647-8268.
|
|
| Additional Information Phone Number |
(855) 647-8268
|
|
| Additional Information Website |
www.quantifiedfunds.com/fund-documents
|
|
| Expenses [Text Block] |
What were the Fund’s costs for the last year?(based on a hypothetical $10,000 investment) Table SummaryClass Name | Costs of a $10,000 investment | Costs paid as a percentage of a $10,000 investment |
|---|
Investor | $179 | 1.63% |
|---|
|
|
| Expenses Paid, Amount |
$ 179
|
|
| Expense Ratio, Percent |
1.63%
|
|
| Factors Affecting Performance [Text Block] |
How did the Fund perform during the reporting period? The Fund returned 19.43% for the year ending June 30. 2026. The S&P 500 Total Return Index, the Fund’s benchmark, returned 22.32% for the same period. Strategy The Quantified Rising Dividend Tactical Fund strives to build a portfolio of domestic and international ETF’s that hold strong companies with rising dividends which are actively managed. Techniques The Fund rose 5.16% in the third quarter of 2025, underperforming the S&P 500, which gained 8.12%. The Fund held leveraged equity exposure throughout the quarter. However, its specific mix of equity holdings did not keep pace with the mega-cap-heavy S&P 500. It rose 1.07% in the fourth quarter of 2025, underperforming the S&P 500, which gained 2.66%. The Fund held leveraged equity exposure throughout the quarter; however, sideways market movements limited opportunities to capture gains through leverage, resulting in slight underperformance. In the first quarter of 2026, the Fund lost -2.03%, outperforming the S&P 500 Index which declined -4.33%. For most of the quarter, the Fund was leveraged, which contributed to its outperformance vis-à-vis its benchmark. The Fund rose 14.70% in the second quarter of 2026, underperforming the S&P 500 Index, which gained 15.20%. It held leveraged equity exposure throughout the quarter, but its equity mix contributed to its underperformance compared to its benchmark. |
|
| Performance Past Does Not Indicate Future [Text] |
The Fund’s past performance is not a good predictor of how the Fund will perform in the future.
|
|
| Line Graph [Table Text Block] |
Table Summary | Quantified Rising Dividend Tactical Fund | S&P 500 Index TR |
|---|
Apr-2021 | $10,000 | $10,000 |
|---|
Jun-2021 | $10,240 | $10,449 |
|---|
Sep-2021 | $10,200 | $10,510 |
|---|
Dec-2021 | $11,114 | $11,669 |
|---|
Mar-2022 | $10,501 | $11,133 |
|---|
Jun-2022 | $8,622 | $9,340 |
|---|
Sep-2022 | $7,778 | $8,884 |
|---|
Dec-2022 | $7,571 | $9,556 |
|---|
Mar-2023 | $7,571 | $10,272 |
|---|
Jun-2023 | $7,994 | $11,170 |
|---|
Sep-2023 | $7,478 | $10,805 |
|---|
Dec-2023 | $8,565 | $12,068 |
|---|
Mar-2024 | $9,354 | $13,342 |
|---|
Jun-2024 | $9,208 | $13,913 |
|---|
Sep-2024 | $10,257 | $14,732 |
|---|
Dec-2024 | $9,883 | $15,087 |
|---|
Mar-2025 | $9,810 | $14,443 |
|---|
Jun-2025 | $9,665 | $16,023 |
|---|
Sep-2025 | $10,163 | $17,325 |
|---|
Dec-2025 | $10,272 | $17,785 |
|---|
Mar-2026 | $10,063 | $17,014 |
|---|
Jun-2026 | $11,542 | $19,600 |
|---|
|
|
| Average Annual Return [Table Text Block] |
Table Summary | 1 Year | 5 Years | Since Inception (April 14, 2021) |
|---|
Quantified Rising Dividend Tactical Fund | 19.43% | 2.42% | 2.79% |
|---|
S&P 500 Index TR | 22.32% | 13.41% | 13.79% |
|---|
|
|
| Performance Inception Date |
Apr. 14, 2021
|
|
| No Deduction of Taxes [Text Block] |
The graph and table do not reflect the deduction of taxes that a shareholder would pay on fund distributions or redemption of fund shares.
|
|
| AssetsNet |
$ 18,931,555
|
|
| Holdings Count | Holding |
41
|
|
| Advisory Fees Paid, Amount |
$ 185,857
|
|
| InvestmentCompanyPortfolioTurnover |
61.00%
|
|
| Additional Fund Statistics [Text Block] |
Table SummaryNet Assets | $18,931,555 |
|---|
Number of Portfolio Holdings | 41 |
|---|
Advisory Fee | $185,857 |
|---|
Portfolio Turnover | 61% |
|---|
|
|
| Holdings [Text Block] |
Asset Weighting (% of total investments)Table SummaryValue | Value |
|---|
Exchange-Traded Funds | 93.1% | Money Market Funds | 6.9% | Security Type Weighting (% of total (including notional) exposure)Table SummaryValue | Value |
|---|
Cash & Cash Equivalents | 4.0% | ETFs - Equities (Technology) | 10.0% | ETFs - Equities (Large Cap Income) | 31.0% | ETFs - Equities (S&P 500) | 55.0% | |
|
| Largest Holdings [Text Block] |
Top 10 Holdings (% of net assets)Table SummaryHolding Name | % of Net Assets |
|---|
Vanguard Dividend Appreciation ETF | 22.5% |
|---|
Invesco S&P 500 Equal Weight ETF | 18.1% |
|---|
Invesco S&P 500 Low Volatility ETF | 17.9% |
|---|
Vanguard International Dividend Appreciation ETF | 17.6% |
|---|
Invesco QQQ Trust Series 1 | 12.5% |
|---|
Fidelity Government Portfolio, Class I | 3.3% |
|---|
First American Government Obligations Fund, Class Z | 3.3% |
|---|
|
|
| Material Fund Change [Text Block] |
No material changes occurred during the year ended June 30, 2026. |
|
| C000161884 |
|
|
| Shareholder Report [Line Items] |
|
|
| Fund Name |
Quantified STF Fund
|
|
| Trading Symbol |
QSTAX
|
|
| Additional Information Phone Number |
(855) 647-8268
|
|
| Expenses [Text Block] |
What were the Fund’s costs for the last year?(based on a hypothetical $10,000 investment) Table SummaryClass Name | Costs of a $10,000 investment | Costs paid as a percentage of a $10,000 investment |
|---|
Advisor | $265 | 2.19% |
|---|
|
|
| Expenses Paid, Amount |
$ 265
|
|
| Expense Ratio, Percent |
2.19%
|
|
| Factors Affecting Performance [Text Block] |
How did the Fund perform during the reporting period? The Fund returned 41.76% for the year ending June 30, 2026. The NASDAQ 100 Total Return Index, the Fund’s secondary benchmark, gained 34.38% for same period. Strategy The Quantified STF follows easily identifiable up and down trends in the market based solely on the price action of the NASDAQ 100. It uses futures to achieve leverage and establish inverse positions. Techniques The Fund gained 15.91% for the third quarter of 2025, outperforming the NASDAQ 100 Index, which gained 9.01%. The Fund held a 2X position against the NASDAQ 100 for most of the quarter, leading to its outperformance. The Fund fell -2.39% for the fourth quarter, underperforming the NASDAQ 100 Index, which gained 2.47%. The Fund actively reduced market exposure throughout October and November as the market rally faltered and volatility returned following the quieter third quarter. In the first quarter of 2026, the Fund fell -11.91 %, underperforming the NASDAQ 100 Index which declined -5.82%. The Fund followed a 200% net long signal for most of January, before tactically adjusting exposure throughout the remainder of the quarter. Outperformance in January was offset by setbacks in February and March, resulting in underperformance for the quarter. The Fund rose 42.25% for the second quarter of 2026, outperforming the NASDAQ 100 Index, which gained 27.74% for the period. The Fund tactically shifted between neutral and leveraged positions, helping it outperform the benchmark in each month of the quarter. |
|
| Performance Past Does Not Indicate Future [Text] |
The Fund’s past performance is not a good predictor of how the Fund will perform in the future.
|
|
| Line Graph [Table Text Block] |
Table Summary | Quantified STF Fund | S&P 500® Index | Nasdaq-100® Index |
|---|
Jun-2016 | $10,000 | $10,000 | $10,000 |
|---|
Jun-2017 | $13,532 | $11,790 | $12,939 |
|---|
Jun-2018 | $16,686 | $13,484 | $16,304 |
|---|
Jun-2019 | $16,076 | $14,889 | $17,961 |
|---|
Jun-2020 | $23,035 | $16,006 | $24,028 |
|---|
Jun-2021 | $34,754 | $22,536 | $34,685 |
|---|
Jun-2022 | $28,247 | $20,144 | $27,617 |
|---|
Jun-2023 | $32,234 | $24,091 | $36,767 |
|---|
Jun-2024 | $44,755 | $30,006 | $48,080 |
|---|
Jun-2025 | $39,264 | $34,556 | $55,823 |
|---|
Jun-2026 | $55,661 | $42,271 | $75,018 |
|---|
|
|
| Average Annual Return [Table Text Block] |
Table Summary | 1 Year | 5 Years | 10 Years |
|---|
Quantified STF Fund | 41.76% | 9.88% | 18.73% |
|---|
S&P 500® Index | 22.32% | 13.41% | 15.51% |
|---|
Nasdaq-100® Index | 34.38% | 16.68% | 22.33% |
|---|
|
|
| No Deduction of Taxes [Text Block] |
The graph and table do not reflect the deduction of taxes that a shareholder would pay on fund distributions or redemption of fund shares.
|
|
| AssetsNet |
$ 354,507,836
|
|
| Holdings Count | Holding |
7
|
|
| Advisory Fees Paid, Amount |
$ 2,462,745
|
|
| InvestmentCompanyPortfolioTurnover |
98.00%
|
|
| Additional Fund Statistics [Text Block] |
Table SummaryNet Assets | $354,507,836 |
|---|
Number of Portfolio Holdings | 7 |
|---|
Advisory Fee | $2,462,745 |
|---|
Portfolio Turnover | 98% |
|---|
|
|
| Holdings [Text Block] |
Asset Weighting (% of total investments)Table SummaryValue | Value |
|---|
Certificate Of Deposit | 1.1% | Private Investment Funds | 6.6% | Money Market Funds | 92.3% | Security Type Weighting (% of total (including notional) exposure)Table SummaryValue | Value |
|---|
Private Investment Funds | 7% | Cash & Equivalent | 93% | |
|
| Largest Holdings [Text Block] |
Top 10 Holdings (% of net assets)Table SummaryHolding Name | % of Net Assets |
|---|
Fidelity Government Portfolio Class I, 3.520%,
| 46.0% |
|---|
First American Government Obligations Fund Class Z, 3.519%,
| 46.0% |
|---|
Galaxy Plus Fund LLC - Profit Score Regime - Adaptive Equity Feeder Fund | 6.5% |
|---|
ESSA Bank & Trust, 3.700%, 09/25/26
| 0.3% |
|---|
Axos Bank, 3.800%, 04/02/27
| 0.3% |
|---|
Texas Exchange Bank SSB, 3.650%, 03/26/27
| 0.3% |
|---|
Ally Bank, 3.750%, 09/27/27
| 0.3% |
|---|
|
|
| Material Fund Change [Text Block] |
This is a summary of certain changes to the Fund since July 1, 2025. For more complete information, you may review the Fund's prospectus dated April 3, 2026, which is available at www.quantifiedfunds.com/fund-documents or by emailing orderquantifiedfunds@ultimusfundsolutions.com or upon telephone request at (855) 647-8268. Principal Investment Strategy Changes: The Fund formed a wholly owned subsidiary for the purpose of housing certain commodity pool investments in conformity with the tax regulations that apply to the Fund. Principal Investment Risk Changes: Related to the strategy change, the Fund’s additional risks include an expansion of futures contract risk to address currency futures, debt futures, equity futures, energy futures, metals futures, and agriculture commodity futures; as well as taxation risk; and wholly owned subsidiary risk. |
|
| C000161885 |
|
|
| Shareholder Report [Line Items] |
|
|
| Fund Name |
Quantified STF Fund
|
|
| Trading Symbol |
QSTFX
|
|
| Additional Information Phone Number |
(855) 647-8268
|
|
| Expenses [Text Block] |
What were the Fund’s costs for the last year?(based on a hypothetical $10,000 investment) Table SummaryClass Name | Costs of a $10,000 investment | Costs paid as a percentage of a $10,000 investment |
|---|
Investor | $193 | 1.59% |
|---|
|
|
| Expenses Paid, Amount |
$ 193
|
|
| Expense Ratio, Percent |
1.59%
|
|
| Factors Affecting Performance [Text Block] |
How did the Fund perform during the reporting period? The Fund returned 42.64% for the year ending June 30, 2026. The NASDAQ 100 Total Return Index, the Fund’s secondary benchmark, gained 34.38% for same period. Strategy The Quantified STF follows easily identifiable up and down trends in the market based solely on the price action of the NASDAQ 100. It uses futures to achieve leverage and establish inverse positions. Techniques The Fund gained 16.06% for the third quarter of 2025, outperforming the NASDAQ 100 Index, which gained 9.01%. The Fund held a 2X position against the NASDAQ 100 for most of the quarter, leading to its outperformance. The Fund fell -2.25% for the fourth quarter, underperforming the NASDAQ 100 Index, which gained 2.47%. The Fund actively reduced market exposure throughout October and November as the market rally faltered and volatility returned following the quieter third quarter. In the first quarter of 2026, the Fund fell -11.76%, underperforming the NASDAQ 100 Index which declined -5.82%. The Fund followed a 200% net long signal for most of January, before tactically adjusting exposure throughout the remainder of the quarter. Outperformance in January was offset by setbacks in February and March, resulting in underperformance for the quarter. The Fund rose 42.48% for the second quarter of 2026, outperforming the NASDAQ 100 Index, which gained 27.74% for the period. The Fund tactically shifted between neutral and leveraged positions, helping it outperform the benchmark in each month of the quarter. |
|
| Performance Past Does Not Indicate Future [Text] |
The Fund’s past performance is not a good predictor of how the Fund will perform in the future.
|
|
| Line Graph [Table Text Block] |
Table Summary | Quantified STF Fund | S&P 500® Index | Nasdaq-100® Index |
|---|
Jun-2016 | $10,000 | $10,000 | $10,000 |
|---|
Jun-2017 | $13,601 | $11,790 | $12,939 |
|---|
Jun-2018 | $16,874 | $13,484 | $16,304 |
|---|
Jun-2019 | $16,348 | $14,889 | $17,961 |
|---|
Jun-2020 | $23,568 | $16,006 | $24,028 |
|---|
Jun-2021 | $35,791 | $22,536 | $34,685 |
|---|
Jun-2022 | $29,291 | $20,144 | $27,617 |
|---|
Jun-2023 | $33,609 | $24,091 | $36,767 |
|---|
Jun-2024 | $46,941 | $30,006 | $48,080 |
|---|
Jun-2025 | $41,428 | $34,556 | $55,823 |
|---|
Jun-2026 | $59,091 | $42,271 | $75,018 |
|---|
|
|
| Average Annual Return [Table Text Block] |
Table Summary | 1 Year | 5 Years | 10 Years |
|---|
Quantified STF Fund | 42.64% | 10.55% | 19.44% |
|---|
S&P 500® Index | 22.32% | 13.41% | 15.51% |
|---|
Nasdaq-100® Index | 34.38% | 16.68% | 22.33% |
|---|
|
|
| No Deduction of Taxes [Text Block] |
The graph and table do not reflect the deduction of taxes that a shareholder would pay on fund distributions or redemption of fund shares.
|
|
| AssetsNet |
$ 354,507,836
|
|
| Holdings Count | Holding |
7
|
|
| Advisory Fees Paid, Amount |
$ 2,462,745
|
|
| InvestmentCompanyPortfolioTurnover |
98.00%
|
|
| Additional Fund Statistics [Text Block] |
Table SummaryNet Assets | $354,507,836 |
|---|
Number of Portfolio Holdings | 7 |
|---|
Advisory Fee | $2,462,745 |
|---|
Portfolio Turnover | 98% |
|---|
|
|
| Holdings [Text Block] |
Asset Weighting (% of total investments)Table SummaryValue | Value |
|---|
Certificate Of Deposit | 1.1% | Private Investment Funds | 6.6% | Money Market Funds | 92.3% | Security Type Weighting (% of total (including notional) exposure)Table SummaryValue | Value |
|---|
Private Investment Funds | 7% | Cash & Equivalent | 93% | |
|
| Largest Holdings [Text Block] |
Top 10 Holdings (% of net assets)Table SummaryHolding Name | % of Net Assets |
|---|
Fidelity Government Portfolio Class I, 3.520%,
| 46.0% |
|---|
First American Government Obligations Fund Class Z, 3.519%,
| 46.0% |
|---|
Galaxy Plus Fund LLC - Profit Score Regime - Adaptive Equity Feeder Fund | 6.5% |
|---|
ESSA Bank & Trust, 3.700%, 09/25/26
| 0.3% |
|---|
Axos Bank, 3.800%, 04/02/27
| 0.3% |
|---|
Texas Exchange Bank SSB, 3.650%, 03/26/27
| 0.3% |
|---|
Ally Bank, 3.750%, 09/27/27
| 0.3% |
|---|
|
|
| Material Fund Change [Text Block] |
This is a summary of certain changes to the Fund since July 1, 2025. For more complete information, you may review the Fund's prospectus dated April 3, 2026, which is available at www.quantifiedfunds.com/fund-documents or by emailing orderquantifiedfunds@ultimusfundsolutions.com or upon telephone request at (855) 647-8268. Principal Investment Strategy Changes: The Fund formed a wholly owned subsidiary for the purpose of housing certain commodity pool investments in conformity with the tax regulations that apply to the Fund. Principal Investment Risk Changes: Related to the strategy change, the Fund’s additional risks include an expansion of futures contract risk to address currency futures, debt futures, equity futures, energy futures, metals futures, and agriculture commodity futures; as well as taxation risk; and wholly owned subsidiary risk. |
|
| C000225736 |
|
|
| Shareholder Report [Line Items] |
|
|
| Fund Name |
Quantified Tactical Sectors Fund
|
|
| Trading Symbol |
QTSSX
|
|
| Annual or Semi-Annual Statement [Text Block] |
This annual shareholder report contains important information about Quantified Tactical Sectors Fund (the "Fund") for the period of July 1, 2025 to June 30, 2026.
|
|
| Additional Information [Text Block] |
You can find additional information about the Fund at www.quantifiedfunds.com/fund-documents. You can also request this information by contacting us at (855) 647-8268.
|
|
| Additional Information Phone Number |
(855) 647-8268
|
|
| Additional Information Website |
www.quantifiedfunds.com/fund-documents
|
|
| Expenses [Text Block] |
What were the Fund’s costs for the last year?(based on a hypothetical $10,000 investment) Table SummaryClass Name | Costs of a $10,000 investment | Costs paid as a percentage of a $10,000 investment |
|---|
Investor | $185 | 1.61% |
|---|
|
|
| Expenses Paid, Amount |
$ 185
|
|
| Expense Ratio, Percent |
1.61%
|
|
| Factors Affecting Performance [Text Block] |
How did the Fund perform during the reporting period? The Fund returned 29.78% for the year ending June 30, 2026. The S&P 500 Total Return Index, the Fund’s benchmark, returned 22.32% for the period. Strategy The Quantified Tactical Sectors Fund is an aggressive active asset allocation strategy designed to overweight portfolio investments into the top-performing asset classes while eliminating exposure to underperforming assets. Techniques The Fund rose 13.11% in the third quarter of 2025, outperforming the S&P 500, which gained 8.12%. The Fund also traded infrequently, maintaining leveraged equity exposure throughout the quarter to capitalize on substantial market gains. The Fund fell 2.07% in the fourth quarter of 2025, underperforming the S&P 500, which gained 2.66%. The Fund again traded infrequently throughout the quarter, maintaining leveraged exposure. The sideways movement in equity markets over the quarter led to underperformance. In the first quarter of 2026, the Fund fell -4.19%, outperforming the S&P 500 TR Index which declined -4.33%. The Fund was in a leveraged position for most of the quarter, contributing to performance until the leverage was removed toward the end of March. Rotating among equity segments throughout the period also contributed to the Fund’s outperformance. The Fund rose 22.28% in the second quarter of 2026, outperforming the S&P 500 TR Index which gained 15.20% for the period. The Fund maintained more than 100% market exposure for much of the quarter. Tactical movements across equity segments combined with the use of leverage contributed to outperformance for the quarter. |
|
| Performance Past Does Not Indicate Future [Text] |
The Fund’s past performance is not a good predictor of how the Fund will perform in the future.
|
|
| Line Graph [Table Text Block] |
Table Summary | Quantified Tactical Sectors Fund | S&P 500 Index TR |
|---|
Mar-2021 | $10,000 | $10,000 |
|---|
Jun-2021 | $10,560 | $11,456 |
|---|
Jun-2022 | $6,031 | $10,240 |
|---|
Jun-2023 | $6,911 | $12,246 |
|---|
Jun-2024 | $7,642 | $15,253 |
|---|
Jun-2025 | $7,368 | $17,566 |
|---|
Jun-2026 | $9,562 | $21,487 |
|---|
|
|
| Average Annual Return [Table Text Block] |
Table Summary | 1 Year | 5 Years | Since Inception (March 4, 2021) |
|---|
Quantified Tactical Sectors Fund | 29.78% | -1.97% | -0.84% |
|---|
S&P 500 Index TR | 22.32% | 13.41% | 15.45% |
|---|
|
|
| Performance Inception Date |
Mar. 04, 2021
|
|
| No Deduction of Taxes [Text Block] |
The graph and table do not reflect the deduction of taxes that a shareholder would pay on fund distributions or redemption of fund shares.
|
|
| AssetsNet |
$ 67,798,749
|
|
| Holdings Count | Holding |
13
|
|
| Advisory Fees Paid, Amount |
$ 671,777
|
|
| InvestmentCompanyPortfolioTurnover |
842.00%
|
|
| Additional Fund Statistics [Text Block] |
Table SummaryNet Assets | $67,798,749 |
|---|
Number of Portfolio Holdings | 13 |
|---|
Advisory Fee | $671,777 |
|---|
Portfolio Turnover | 842% |
|---|
|
|
| Holdings [Text Block] |
Asset Weighting (% of total investments)Table SummaryValue | Value |
|---|
Collateral for Securities Loaned | 13.8% | Money Market Funds | 18.1% | Exchange-Traded Funds | 68.1% | Security Type Weighting (% of total (including notional) exposure)Table SummaryValue | Value |
|---|
ETFs - Equities (Financial) | 13% | ETFs - Equities (Industrials) | 13% | Cash & Equivalent | 19% | ETFs - Equities (Technology) | 26% | ETFs - Equities (S&P 500) | 29% | |
|
| Largest Holdings [Text Block] |
Top 10 Holdings (% of net assets)Table SummaryHolding Name | % of Net Assets |
|---|
State Street Industrial Select Sector SPDR ETF | 15.7% |
|---|
State Street Technology Select Sector SPDR ETF | 15.6% |
|---|
Mount Vernon Liquid Assets Portfolio, LLC | 15.6% |
|---|
Vanguard Information Technology ETF | 15.6% |
|---|
Invesco S&P 500 Equal Weight ETF | 15.4% |
|---|
State Street Financial Select Sector SPDR ETF | 15.1% |
|---|
First American Government Obligations Fund, Class Z | 10.3% |
|---|
Fidelity Government Portfolio, Class I | 10.2% |
|---|
|
|
| Material Fund Change [Text Block] |
No material changes occurred during the year ended June 30, 2026. |
|
|
|