| N A B O R S . C O M 1 Technology. Expertise. Performance. Drilling for a better tomorrow. NYSE: NBR www.nabors.com DELIVERING ENERGY. ADVANCING THE WORLD. SEPTEMBER 2026 INVESTOR MEETINGS |

| N A B O R S . C O M We often discuss expectations regarding our future markets, demand for our products and services, and our performance in our annual, quarterly, and current reports, press releases, and other written and oral statements. Such statements, including statements in this document that relate to matters that are not historical facts, are “forward-looking statements” within the meaning of the safe harbor provisions of Section 27A of the U.S. Securities Act of 1933 and Section 21E of the U.S. Securities Exchange Act of 1934. These “forward-looking statements” are based on our analysis of currently available competitive, financial and economic data and our operating plans. They are inherently uncertain, and investors should recognize that events and actual results could turn out to be significantly different from our expectations. Factors to consider when evaluating these forward-looking statements include, but are not limited to: • geopolitical events, pandemics and other macro-events and their respective and collective impact on our operations as well as oil and gas markets and prices; • fluctuations and volatility in worldwide prices of and demand for oil and natural gas; • fluctuations in levels of oil and natural gas exploration and development activities; • fluctuations in the demand for our services; • competitive and technological changes and other developments in the oil and gas and oilfield services industries; • our ability to renew customer contracts in order to maintain competitiveness; • the existence of operating risks inherent in the oil and gas and oilfield services industries; • the possibility of the loss of one or a number of our large customers; • the amount and nature of our future capital expenditures and how we expect to fund our capital expenditures; • the occurrence of cybersecurity incidents, attacks and other breaches to our information technology systems; • the impact of long-term indebtedness and other financial commitments on our financial and operating flexibility; • our access to and the cost of capital, including the impact of a further downgrade in our credit rating, covenant restrictions, availability under our revolving credit facility, and future issuances of debt or equity securities and the global interest rate environment; • our dependence on our operating subsidiaries and investments to meet our financial obligations; FORWARD-LOOKING STATEMENTS NABORS INDUSTRIES 2 • our ability to retain skilled employees; • our ability to realize the expected benefits of strategic transactions we may undertake; • changes in tax laws and the possibility of changes in other laws and regulation; • global views on and the regulatory environment related to energy transition and our ability to implement our energy transition initiatives; • potential long-lived asset impairments • the possibility of changes to U.S. trade policies and regulations including the imposition of trade embargoes, sanctions or tariffs, by either the U.S. or any other country in which we operate or have supply lines; • general economic conditions, including the capital and credit markets; • our ability to utilize NOLs. Our businesses depend, to a large degree, on the level of spending by oil and gas companies for exploration, development and production activities. Therefore, sustained lower oil or natural gas prices that have a material impact on exploration, development or production activities could also materially affect our financial position, results of operations and cash flows. The above description of risks and uncertainties is by no means all-inclusive but is designed to highlight what we believe are important factors to consider. For a discussion of these factors and other risks and uncertainties, please refer to our filings with the Securities and Exchange Commission ("SEC"), including those contained in our Annual Reports on Form 10-K and Quarterly Reports on Form 10-Q, which are available at the SEC's website at www.sec.gov. We undertake no obligation to publicly update or revise any forward-looking statement as a result of new information, future events or otherwise, except as otherwise required by law. Non-GAAP Financial Measures This presentation refers to certain “non-GAAP” financial measures, such as adjusted EBITDA, net debt, adjusted gross margin and adjusted free cash flow. The components of these non-GAAP measures are computed by using amounts that are determined in accordance with accounting principles generally accepted in the United States of America (“GAAP”). Other companies in our industry may compute these metrics differently. These measures have limitations and should not be used in isolation or as a substitute for the amounts reported in accordance with GAAP. |
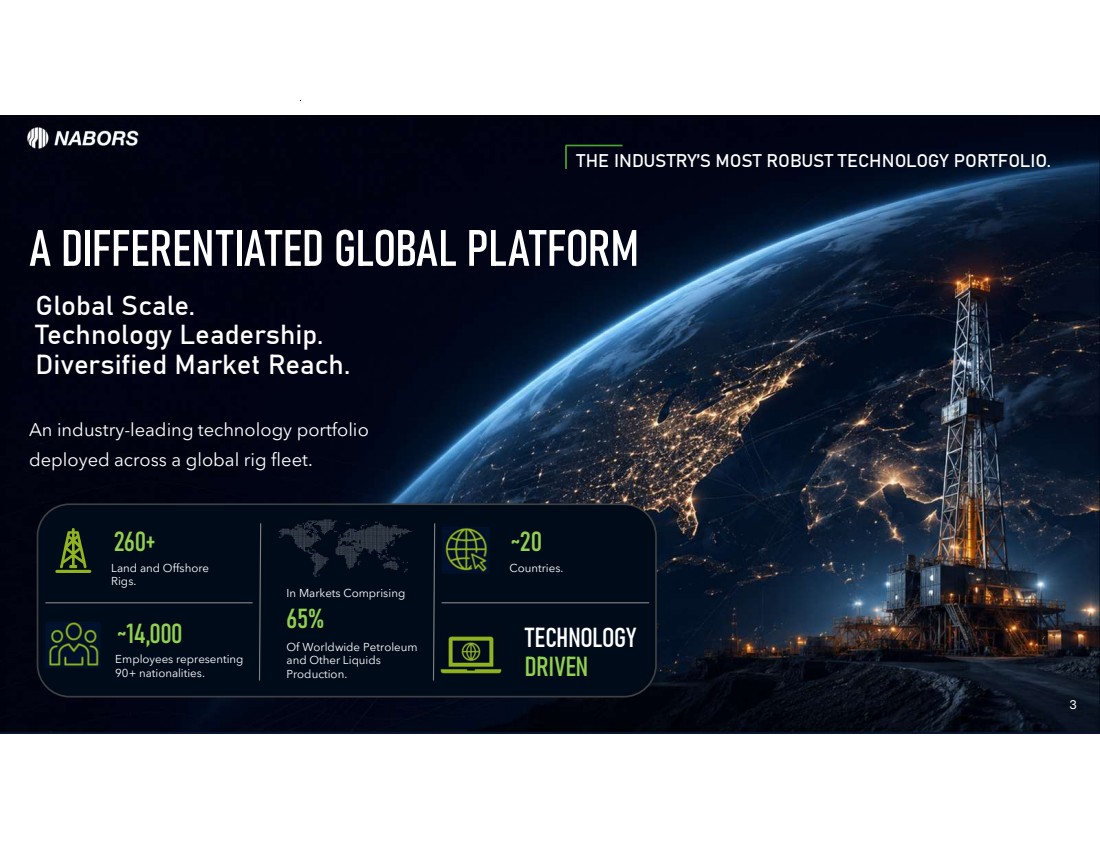
| A DIFFERENTIATED GLOBAL PLATFORM Land and Offshore Rigs. THE INDUSTRY’S MOST ROBUST TECHNOLOGY PORTFOLIO. 3 Global Scale. Technology Leadership. Diversified Market Reach. An industry-leading technology portfolio deployed across a global rig fleet. 260+ Employees representing 90+ nationalities. ~14,000 In Markets Comprising 65% Of Worldwide Petroleum and Other Liquids Production. Countries. ~20 TECHNOLOGY DRIVEN |
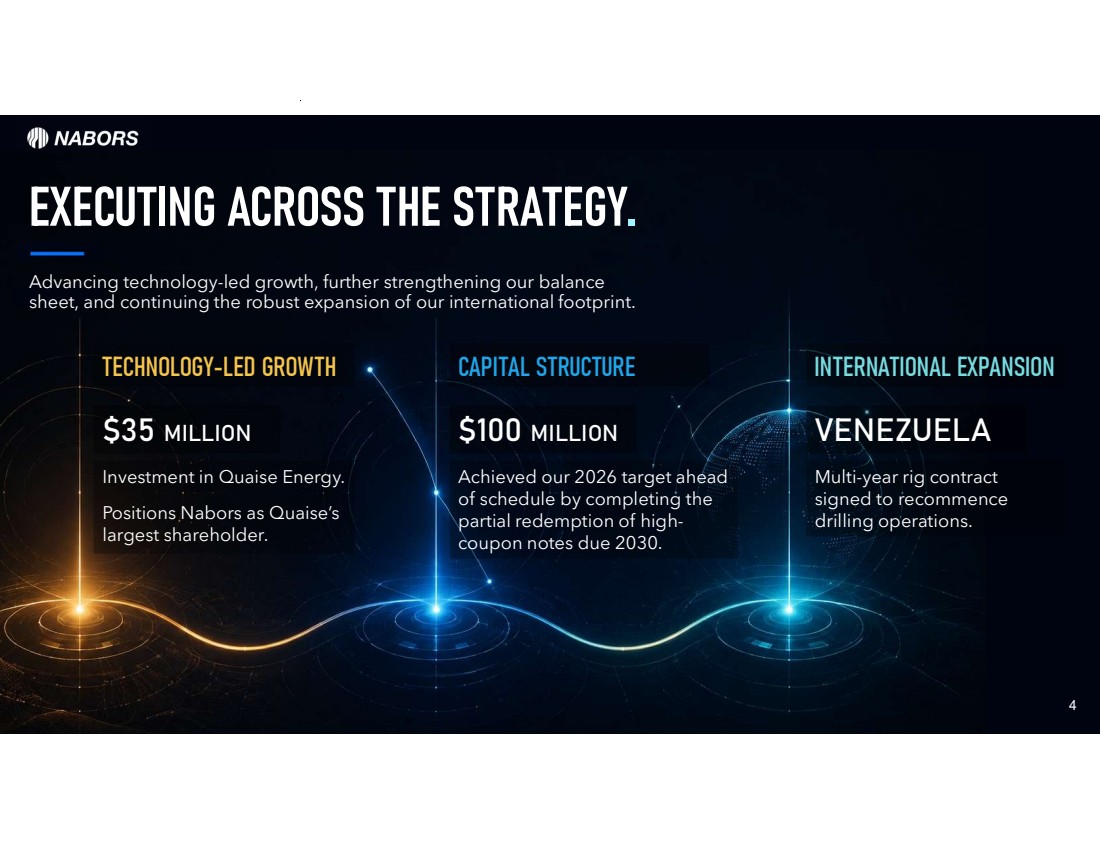
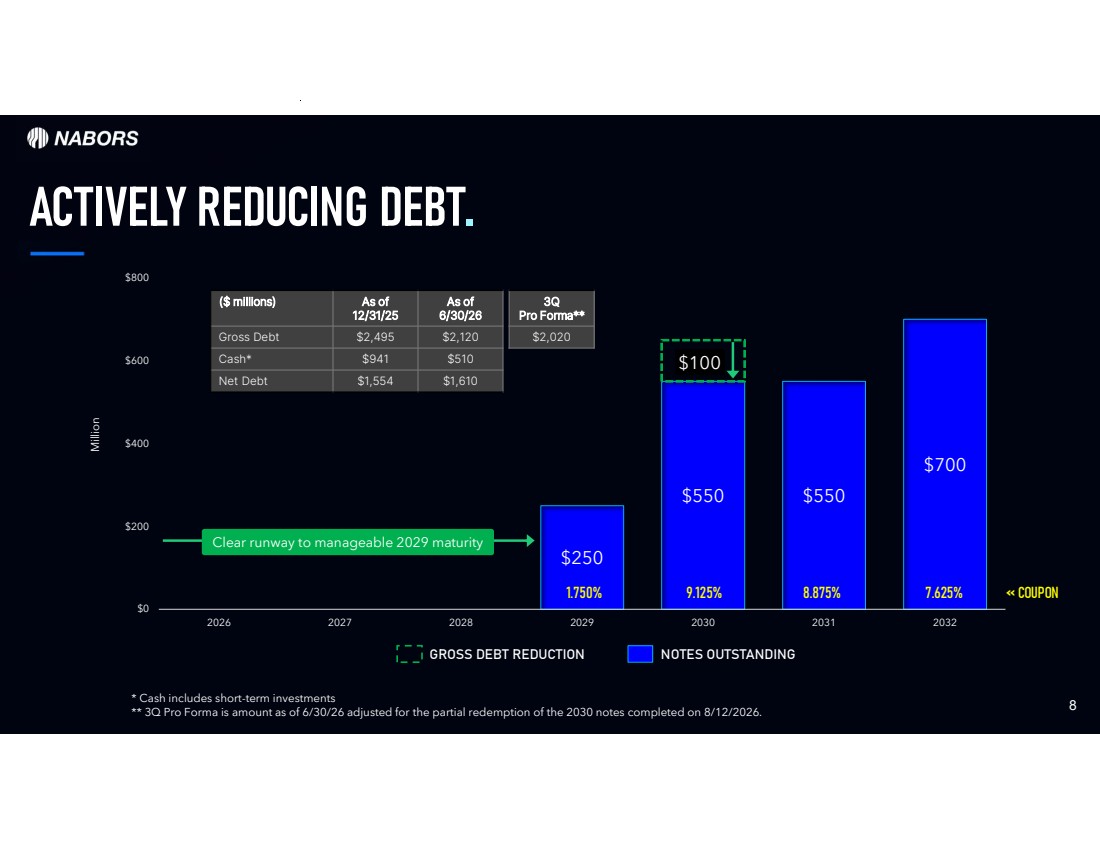
| 4 EXECUTING ACROSS THE STRATEGY. Advancing technology-led growth, further strengthening our balance sheet, and continuing the robust expansion of our international footprint. TECHNOLOGY-LED GROWTH ˚35 MILLION Investment in Quaise Energy. Positions Nabors as Quaise’s largest shareholder. CAPITAL STRUCTURE ˚100 MILLION Achieved our 2026 target ahead of schedule by completing the partial redemption of high-coupon notes due 2030. INTERNATIONAL EXPANSION VENEZUELA Multi-year rig contract signed to recommence drilling operations. |
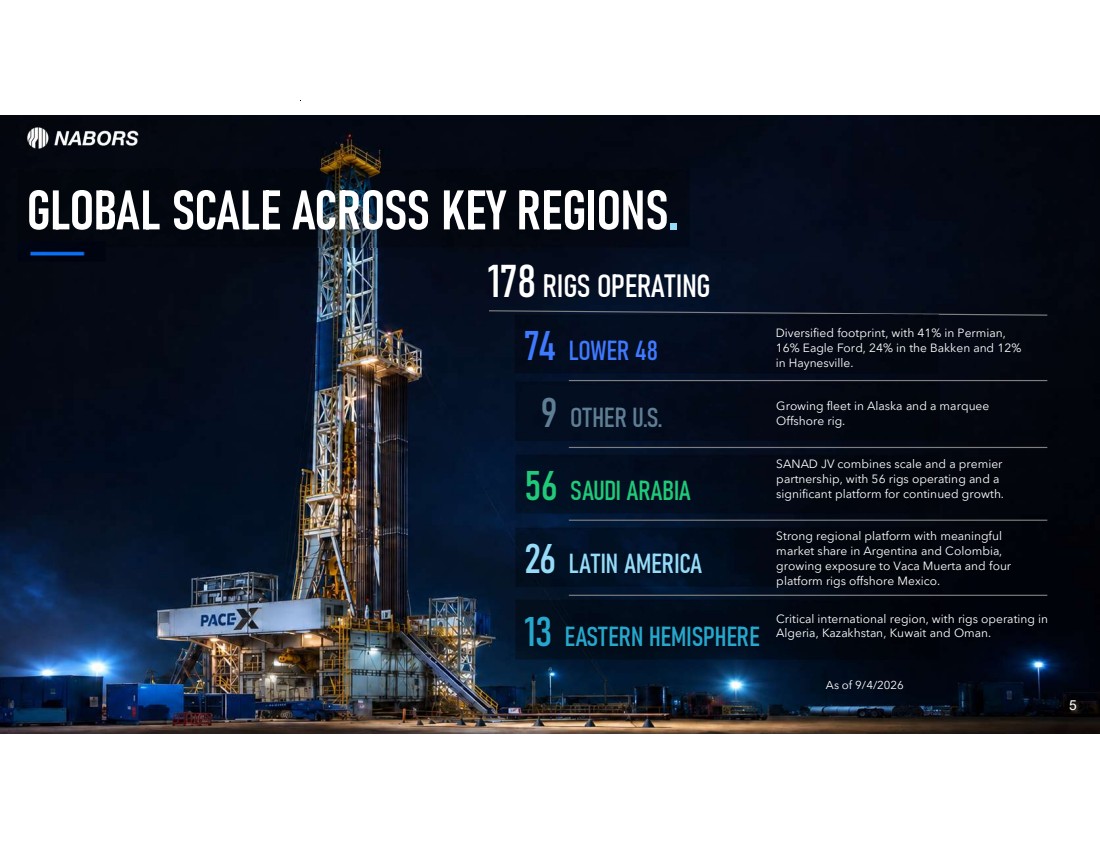
| 5 GLOBAL SCALE ACROSS KEY REGIONS. 178 RIGS OPERATING 13 EASTERN HEMISPHERE 26 LATIN AMERICA 9 OTHER U.S. 56 SAUDI ARABIA Growing fleet in Alaska and a marquee Offshore rig. SANAD JV combines scale and a premier partnership, with 56 rigs operating and a significant platform for continued growth. Strong regional platform with meaningful market share in Argentina and Colombia, growing exposure to Vaca Muerta and four platform rigs offshore Mexico. Critical international region, with rigs operating in Algeria, Kazakhstan, Kuwait and Oman. As of 9/4/2026 74 LOWER 48 Diversified footprint, with 41% in Permian, 16% Eagle Ford, 24% in the Bakken and 12% in Haynesville. |
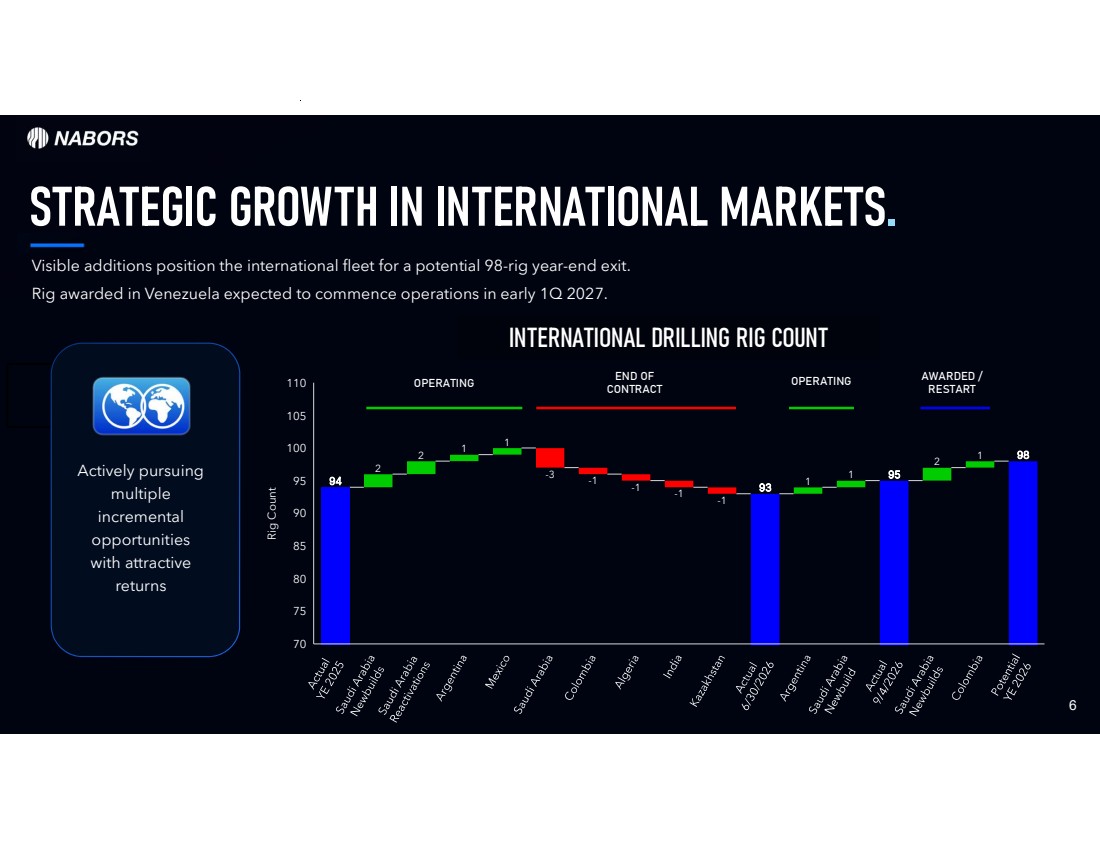
| 6 STRATEGIC GROWTH IN INTERNATIONAL MARKETS. INTERNATIONAL DRILLING RIG COUNT 2 2 1 1 -3 -1 -1 -1 -1 1 1 2 1 94 93 95 98 Rig Count 70 75 80 85 90 95 100 105 110 AWARDED / RESTART OPERATING END OF CONTRACT OPERATING Actively pursuing multiple incremental opportunities with attractive returns Visible additions position the international fleet for a potential 98-rig year-end exit. Rig awarded in Venezuela expected to commence operations in early 1Q 2027. |
| 7 The deployment of a Nabors PACE®-B rig at Project Obsidian in Oregon marks an important step in advancing our geothermal investment strategy and unlocking a compelling long-term growth opportunity in an attractive adjacent energy market. FROM VENTURE INVESTMENT TO FIELD DEPLOYMENT. INITIAL PHASE PHASE I OF III 50 MW PHASE I CAPACITY 300–500°C SUPERHOT ROCK FIRST-OF-ITS-KIND SUPERHOT GEOTHERMAL PROJECT Project Obsidian is targeted to be a 1+ GW power plant using a combination of Quaise’s millimeter wave drilling technology and proven conventional drilling. |

| $250 $550 $550 $700 $100 $0 $200 $400 $600 $800 2026 2027 2028 2029 2030 2031 2032 Million 8 ACTIVELY REDUCING DEBT. NOTES OUTSTANDING As of 6/30/26 As of 12/31/25 ($ millions) Gross Debt $2,495 $2,120 Cash* $941 $510 Net Debt $1,554 $1,610 * Cash includes short-term investments ** 3Q Pro Forma is amount as of 6/30/26 adjusted for the partial redemption of the 2030 notes completed on 8/12/2026. Clear runway to manageable 2029 maturity 3Q Pro Forma** $2,020 GROSS DEBT REDUCTION 1.750% 9.125% 8.875% 7.625% << COUPON |
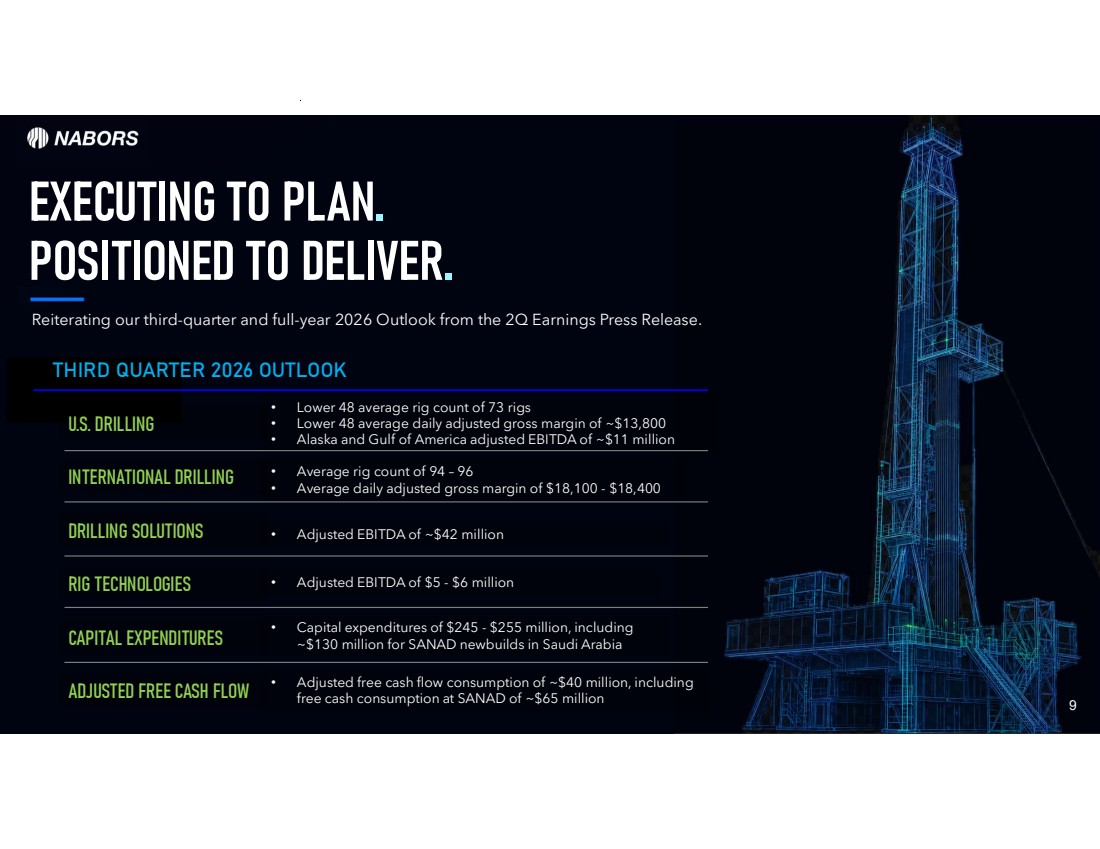
| 9 EXECUTING TO PLAN. POSITIONED TO DELIVER. Reiterating our third-quarter and full-year 2026 Outlook from the 2Q Earnings Press Release. U.S. DRILLING • Lower 48 average rig count of 73 rigs • Lower 48 average daily adjusted gross margin of ~$13,800 • Alaska and Gulf of America adjusted EBITDA of ~$11 million INTERNATIONAL DRILLING • Average rig count of 94 – 96 • Average daily adjusted gross margin of $18,100 - $18,400 DRILLING SOLUTIONS • Adjusted EBITDA of ~$42 million RIG TECHNOLOGIES • Adjusted EBITDA of $5 - $6 million CAPITAL EXPENDITURES • Capital expenditures of $245 - $255 million, including ~$130 million for SANAD newbuilds in Saudi Arabia ADJUSTED FREE CASH FLOW THIRD QUARTER 2026 OUTLOOK • Adjusted free cash flow consumption of ~$40 million, including free cash consumption at SANAD of ~$65 million |
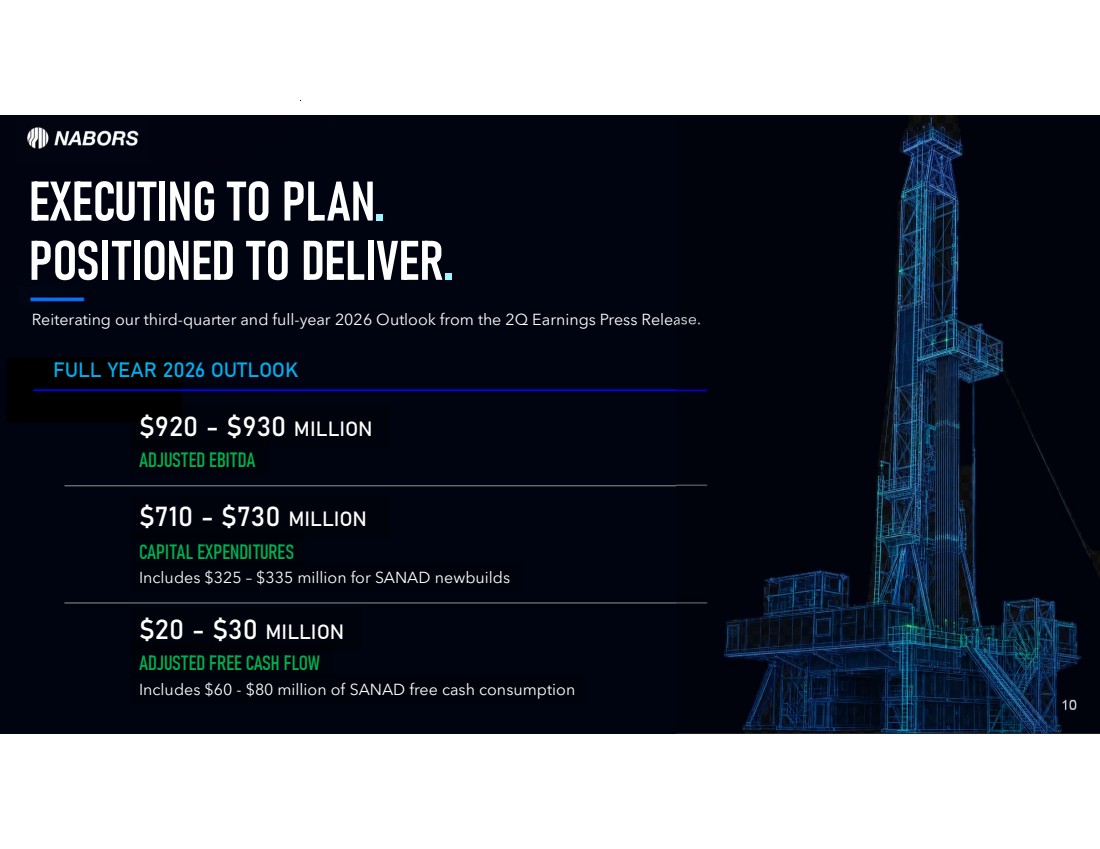
| 10 EXECUTING TO PLAN. POSITIONED TO DELIVER. Reiterating our third-quarter and full-year 2026 Outlook from the 2Q Earnings Press Release. FULL YEAR 2026 OUTLOOK ˚920 - ˚930 MILLION CAPITAL EXPENDITURES ˚710 - ˚730 MILLION ADJUSTED EBITDA ˚20 - ˚30 MILLION ADJUSTED FREE CASH FLOW Includes $60 - $80 million of SANAD free cash consumption Includes $325 – $335 million for SANAD newbuilds |
| FOOTNOTES, FINANCIAL DEFINITIONS & DISCLAIMERS 11 |
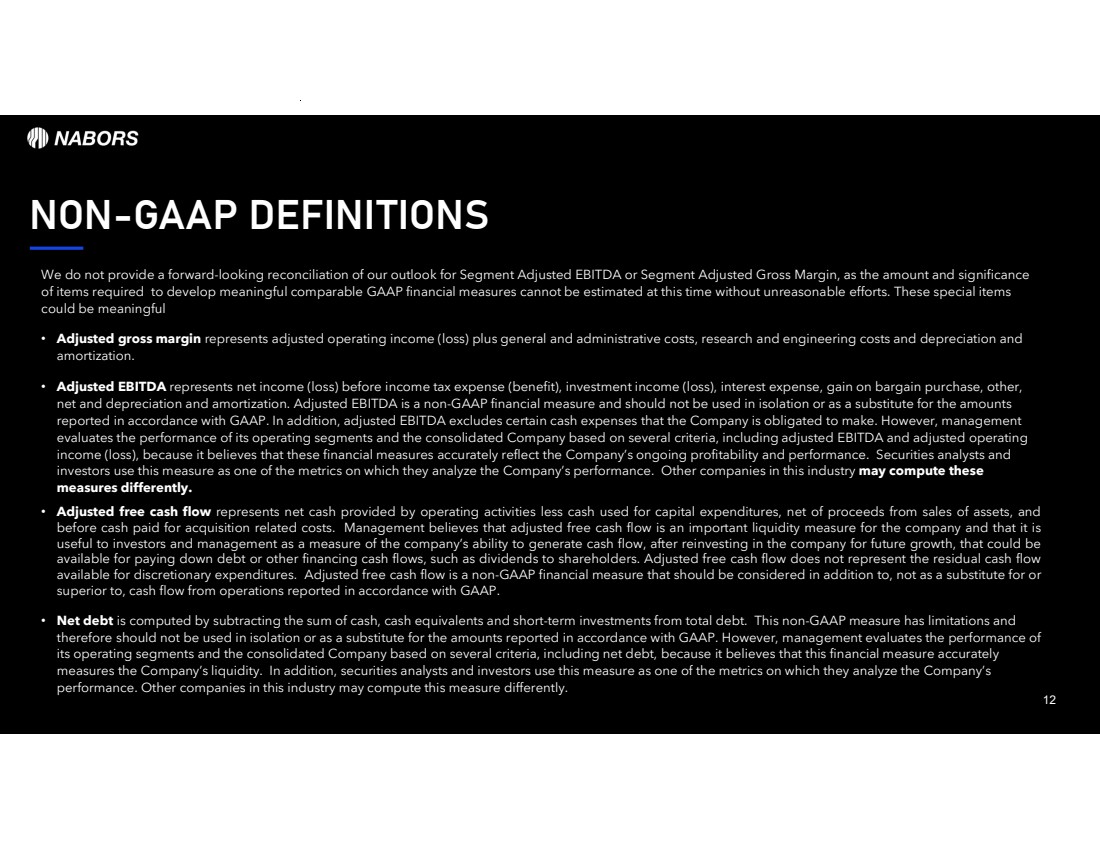
| NON-GAAP DEFINITIONS 12 We do not provide a forward-looking reconciliation of our outlook for Segment Adjusted EBITDA or Segment Adjusted Gross Margin, as the amount and significance of items required to develop meaningful comparable GAAP financial measures cannot be estimated at this time without unreasonable efforts. These special items could be meaningful • Adjusted gross margin represents adjusted operating income (loss) plus general and administrative costs, research and engineering costs and depreciation and amortization. • Adjusted EBITDA represents net income (loss) before income tax expense (benefit), investment income (loss), interest expense, gain on bargain purchase, other, net and depreciation and amortization. Adjusted EBITDA is a non-GAAP financial measure and should not be used in isolation or as a substitute for the amounts reported in accordance with GAAP. In addition, adjusted EBITDA excludes certain cash expenses that the Company is obligated to make. However, management evaluates the performance of its operating segments and the consolidated Company based on several criteria, including adjusted EBITDA and adjusted operating income (loss), because it believes that these financial measures accurately reflect the Company’s ongoing profitability and performance. Securities analysts and investors use this measure as one of the metrics on which they analyze the Company’s performance. Other companies in this industry may compute these measures differently. • Adjusted free cash flow represents net cash provided by operating activities less cash used for capital expenditures, net of proceeds from sales of assets, and before cash paid for acquisition related costs. Management believes that adjusted free cash flow is an important liquidity measure for the company and that it is useful to investors and management as a measure of the company’s ability to generate cash flow, after reinvesting in the company for future growth, that could be available for paying down debt or other financing cash flows, such as dividends to shareholders. Adjusted free cash flow does not represent the residual cash flow available for discretionary expenditures. Adjusted free cash flow is a non-GAAP financial measure that should be considered in addition to, not as a substitute for or superior to, cash flow from operations reported in accordance with GAAP. • Net debt is computed by subtracting the sum of cash, cash equivalents and short-term investments from total debt. This non-GAAP measure has limitations and therefore should not be used in isolation or as a substitute for the amounts reported in accordance with GAAP. However, management evaluates the performance of its operating segments and the consolidated Company based on several criteria, including net debt, because it believes that this financial measure accurately measures the Company’s liquidity. In addition, securities analysts and investors use this measure as one of the metrics on which they analyze the Company’s performance. Other companies in this industry may compute this measure differently. |
| NABORS INDUSTRIES LTD. NABORS.COM NABORS CORPORATE SERVICES 515 W. Greens Road Suite 1200 Houston, TX 77067-4525 @ n a b o r s g l o b a l CONTACT US: William C. Conroy, CFA VP - Corporate Development and Investor Relations William.Conroy@nabors.com Kara K. Peak Director - Corporate Development and Investor Relations Kara.Peak@nabors.com |