ADDITIONAL INFORMATION
This contains important information about the Pinnacle Value Fund - PVFIX for Jan. 1, 2026 to June 30, 2026.
You can find additional information at www.pinnaclevaluefund.com or by calling (877) 369-3705 X111.
expense Information
What were the Fund costs for the past six months?
(based on a hypothetical $10,000 investment)
| Fund Name | Costs of a $10,000 investment | Costs paid as a percentage of a $10,000 investment* |
| Pinnacle Value Fund | $65 | 1.24% |
*Annualized
management’s discussion of fund performance
Our Fund’s NAV rose 11.2% in the first six months, well behind the benchmark R2000 which rose 22.6%. While our stock selections generally did well, our performance was impacted by the absence of momentum, AI or tech stocks which lead the market to new highs. We were also limited by our large cash balance which is earning 3.5% in a government money market fund. Adjusted for cash, our stock performance was closer to the R2000 benchmark. We are optimistic that our portfolio is well positioned for the future.
As shown on the next page, contributors to performance outweighed detractors. Our results were helped significantly by machine tool maker Hurco which showed much improved results and a growing order book. Electronic component maker Diodes also showed strong results benefitting from automotive, industrial and server related applications. Unifi’s cost reduction efforts are finally paying off leading to diminished losses and hopefully higher profits. Ingles Markets saw the election of an activist shareholder to its board which may help unlock shareholder value. Heartland Express results benefitted from higher trucking freight rates and debt paydown.
Major detractors to performance included San Juan Basin Royalty Trust and PetMed Express. San Juan is a New Mexico based oil & gas royalty trust where results were hurt by low natural gas prices due to limited pipeline capacity. New pipeline capacity is currently being built. PetMed Express is a struggling online pet pharmacy where poor operating fundamentals overshadow an asset rich balance sheet including real estate holdings in Delray Beach Florida.
As the market rose, we did more selling than buying. We trimmed Bristow, Diodes, Dorian LPG, Seaboard and Weyco on valuations, all were sold for long term capital gains. Gulf Island Fabrication was acquired in January by a strategic buyer at $12/sh. cash (average cost $3.88). In May, Tri Point Homes was acquired by a strategic buyer for $47/sh. cash (average cost $15.24). Much of the proceeds went to cash but we took advantage of price weakness to add to PetMed Express, San Juan Royalty Trust and Shoe Station.
Outlook & Current Positioning
US equities remain near all-time highs, risk premiums are minimal and strong corporate earnings are supporting (for now) robust equity valuations. AI-fueled exuberance continued through most of the first half and will likely lead to mega IPOs of Anthropic and Open AI. There appears to be no fear in today’s market as evidenced by margin debt at record levels, aggressive equity trades (often in meme stocks), esoteric ETFs and robust option and prediction market trading. The Iran war has had minimal impact on the markets but the ultimate impact remains unclear.
All this has led to an increasingly frothy market where complacency runs high on the belief that markets only go one way, up. Market sentiment is dominated by FOMO (fear or missing out), BTD (buy the dip) and YOLO (you only live once). Rarely heard are the terms “margin of safety” or “capital preservation” or “risk minimization”.
Against this backdrop we are concerned about persistent above-target inflation, massive deficits driving up U.S. debt and consumer sentiment near record lows. Higher gasoline and grocery prices are leaving consumers stretched while rising credit card and auto loan delinquency rates indicate trouble in credit land. The new Fed Chairman is an inflation hawk and may be less likely to cut interest rates soon. To add more uncertainty, November’s midterm elections could see the Republicans lose control of Congress which may stall their pro-market agenda.
While our crystal ball is no better than others, we believe inflation and interest rates will remain higher for longer than people think. We feel most optimistic scenarios are already priced into the market with no room for error. So, we’ll stay conservative, let valuations be our guide and be attentive to any market dislocations. We continue to seek targets with strong balance sheets, viable business models and capable management selling at reasonable valuations.
Please be advised that we will most likely make a distribution of net realized capital gains in December most of which we expect to be long-term. We’ll post an estimate in late November on our website for your tax planning.
By now you should have received your June statement. Should you have any questions about your account or the Fund, don’t hesitate to call or write. We are positioned to invest our cash as opportunities appear and are searching diligently for situations where good things are happening below the surface. Your portfolio manager remains a major Fund shareholder.
John E. Deysher Pinnacle Value Fund
President & Portfolio Manager
745 Fifth Ave.- 500
New York, NY 10151
212-725-0805
Performance graph
AVERAGE ANNUAL RETURNS
|
One Year |
Five Year |
Ten Year | |
| Pinnacle Value Fund | 20.58% | 9.84% | 7.68% |
| Russell 2000 Index | 40.78% | 6.99% | 11.63% |
Cumulative Performance Comparison of $10,000 Investment
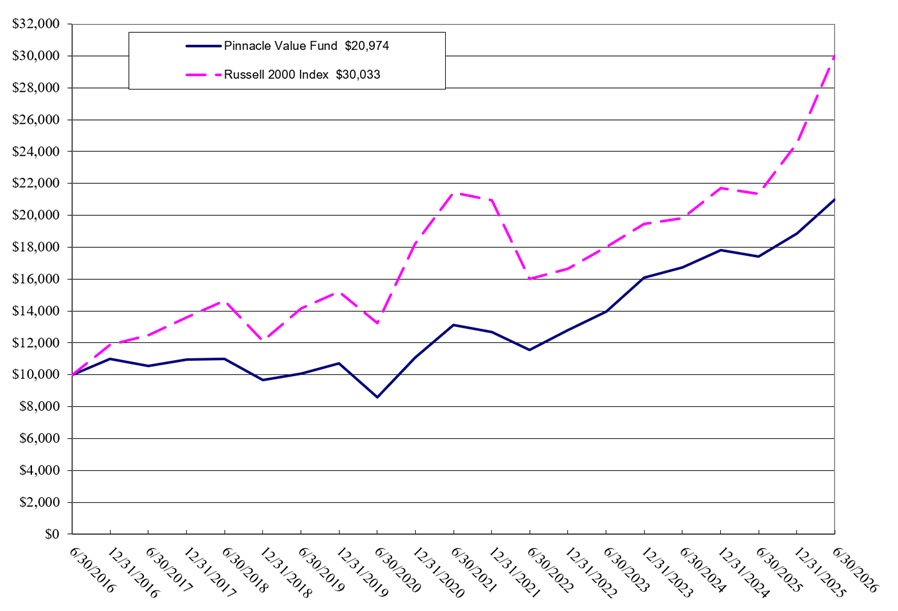
Past performance is not a good predictor of future performance. The returns shown do not reflect taxes that a shareholder would pay on Fund distributions or on the redemption of Fund shares held in taxable accounts. Updated performance data current to the most recent month-end can be obtained by visiting www.pinnaclevaluefund.com.
Fund statistics
| PORTFOLIO | PORTFOLIO | ADVISORY FEES | |
| NET ASSETS: | HOLDINGS: | TURNOVER: | PAID BY FUND: |
| $38,764,768 | 38 | 5.84% | $177,083 |
| SECURITY CLASSIFICATIONS | |
| Government Money Market Funds | 44.4% |
| Consumer Goods & Services | 13.9 |
| Industrial Good & Services | 9.7 |
| Energy | 9.1 |
| Transportation | 7.5 |
| Apparel & Textiles | 7.4 |
| Banks & Thrifts | 3.8 |
| Insurance | 3.2 |
| Technology | 1.0 |
| Total | 100.0% |
| TOP 10 POSITIONS | % net assets |
| 1.Hurco Cos.- machine tool maker w/ worldwide distribution | 6.3 |
| 2. Ingles Markets- regional supermarket chain | 4.3 |
| 3 Unifi- texturized nylon/polyester yarn used in fabric production | 4.1 |
| 4. First Acceptance- nonstandard auto insurer | 3.2 |
| 5. Weyco Group- wholesale & retail men’s shoes | 2.9 |
| 6. Culp- fabrics for furniture & mattress coverings | 2.9 |
| 7. Seacor Marine- offshore supply vessels | 2.8 |
| 8. Shoe Station- retail shoe store | 2.7 |
| 9. Aersale- aviation services | 2.2 |
| 10. San Juan Royalty Trust- oil & gas royalty trust | 2.1 |
| Total | 33.5% |
| YTD TOP 5 Contributors (includes dividends) | |
| 1.Hurco | 2.1% |
| 2.Diodes | 1.2 |
| 3.Unifi | 1.2 |
| 4. Ingles Markets | 1.0 |
| 5. Heartland Express | 0.8% |
| YTD TOP 5 Detractors (includes dividends) | |
| 1.San Juan Royalty Trust | -1.1% |
| 2. PetMed Express | -0.8 |
| 3. Culp | -0.4 |
| 4. Shoe Station | -0.3 |
| 5. Aersale | -0.3% |