Shareholder Report
|
12 Months Ended |
|
Jun. 30, 2026
USD ($)
Holding
|
|---|
| Shareholder Report [Line Items] |
|
| Document Type |
N-CSR
|
| Amendment Flag |
false
|
| Registrant Name |
Mutual Fund Series Trust
|
| Entity Central Index Key |
0001355064
|
| Entity Investment Company Type |
N-1A
|
| Document Period End Date |
Jun. 30, 2026
|
| Shareholder Report Annual or Semi-Annual |
Annual Shareholder Report
|
| C000157835 |
|
| Shareholder Report [Line Items] |
|
| Fund Name |
Eventide Balanced Fund
|
| Class Name |
Class A
|
| Trading Symbol |
ETAMX
|
| Annual or Semi-Annual Statement [Text Block] |
This annual shareholder report contains important information about Eventide Balanced Fund for the period of July 1, 2025 to June 30, 2026.
|
| Additional Information [Text Block] |
You can find additional information about the Fund at https://www.eventidefunds.com. You can also request this information by contacting us at 1-877-771-3836.
|
| Additional Information Phone Number |
1-877-771-3836
|
| Additional Information Website |
https://www.eventidefunds.com
|
| Expenses [Text Block] |
What were the Fund’s costs for the last year?(based on a hypothetical $10,000 investment) Table SummaryClass Name | Costs of a $10,000 investment | Costs paid as a percentage of a $10,000 investment |
|---|
Class A | $115 | 1.07% |
|---|
|
| Expenses Paid, Amount |
$ 115
|
| Expense Ratio, Percent |
1.07%
|
| Factors Affecting Performance [Text Block] |
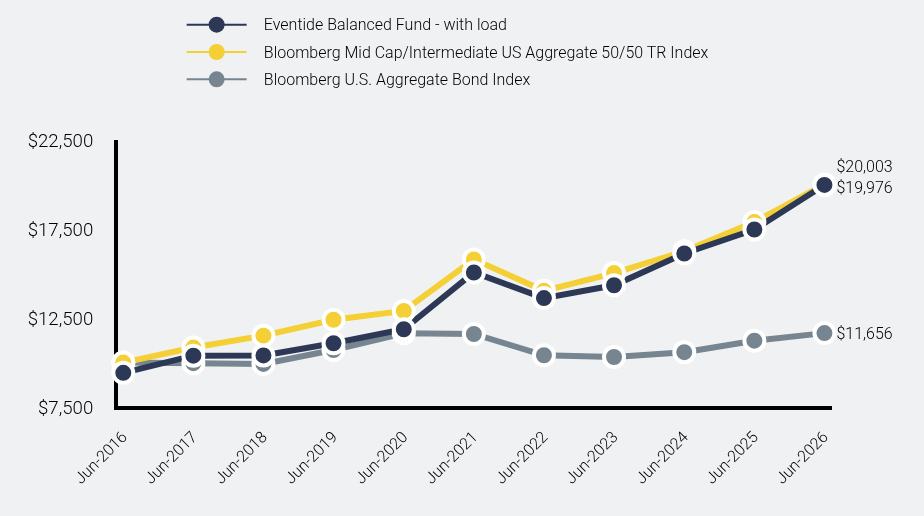
How did the Fund perform during the reporting period? The Fund’s equity positions and fixed income positions outperformed its broad based benchmark. The Fund’s equity positions, which are focused on high-quality dividend growth companies, outperformed fixed income during this time period. The Fund’s fixed income positions outperformed its benchmark also due to the strength of corporate bonds versus Treasury's from an allocation and selection perspective. Our focus remains on resilient growth, strong financials, idiosyncratic risk, and the overarching theme of human flourishing. Our experience underpins our confidence that these high-quality dividend growth companies, within this balanced equity and fixed income strategy, will continue to serve their customers, stakeholders, and shareholders effectively. Visit https://www.eventidefunds.com for more recent performance information. |
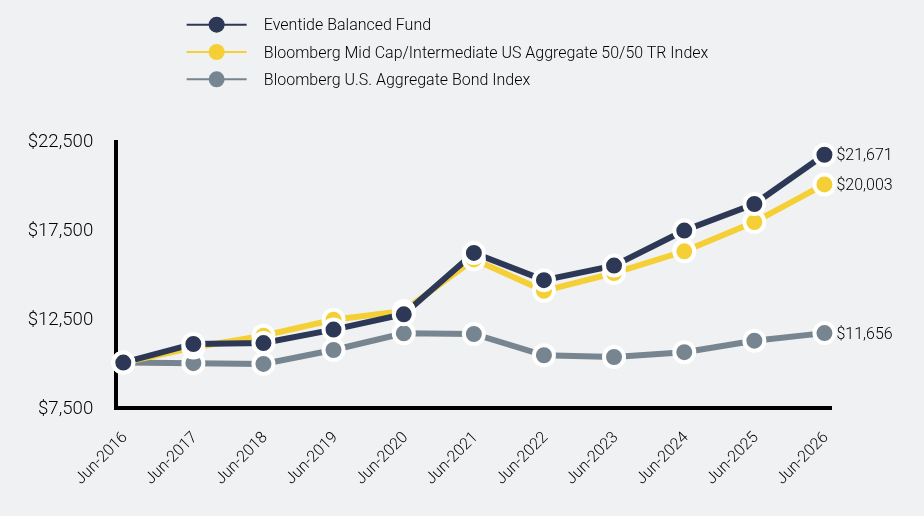
| Line Graph [Table Text Block] |
Table Summary | Eventide Balanced Fund - with load | Bloomberg Mid Cap/Intermediate US Aggregate 50/50 TR Index | Bloomberg U.S. Aggregate Bond Index |
|---|
Jun-2016 | $9,425 | $10,000 | $10,000 |
|---|
Jun-2017 | $10,389 | $10,847 | $9,969 |
|---|
Jun-2018 | $10,405 | $11,515 | $9,929 |
|---|
Jun-2019 | $11,088 | $12,408 | $10,710 |
|---|
Jun-2020 | $11,872 | $12,902 | $11,646 |
|---|
Jun-2021 | $15,058 | $15,796 | $11,607 |
|---|
Jun-2022 | $13,621 | $14,030 | $10,413 |
|---|
Jun-2023 | $14,342 | $15,029 | $10,315 |
|---|
Jun-2024 | $16,127 | $16,250 | $10,587 |
|---|
Jun-2025 | $17,474 | $17,889 | $11,230 |
|---|
Jun-2026 | $19,976 | $20,003 | $11,656 |
|---|
|
| Average Annual Return [Table Text Block] |
Table Summary | 1 Year | 5 Years | 10 Years |
|---|
Eventide Balanced Fund - Class A |
|---|
Without Load | 14.32% | 5.81% | 7.80% |
|---|
With Load | 7.72% | 4.57% | 7.16% |
|---|
Bloomberg Mid Cap/Intermediate US Aggregate 50/50 TR Index
| 11.82% | 4.84% | 7.18% |
|---|
Bloomberg U.S. Aggregate Bond Index | 3.79% | 0.08% | 1.54% |
|---|
|
| AssetsNet |
$ 398,233,242
|
| Holdings Count | Holding |
164
|
| Advisory Fees Paid, Amount |
$ 2,321,098
|
| InvestmentCompanyPortfolioTurnover |
34.00%
|
| Additional Fund Statistics [Text Block] |
Table SummaryNet Assets | $398,233,242 |
|---|
Number of Portfolio Holdings | 164 |
|---|
Advisory Fee (net of waivers) | $2,321,098 |
|---|
Portfolio Turnover | 34% |
|---|
|
| Holdings [Text Block] |
Industry Weighting (% of net assets)Table SummaryValue | Value |
|---|
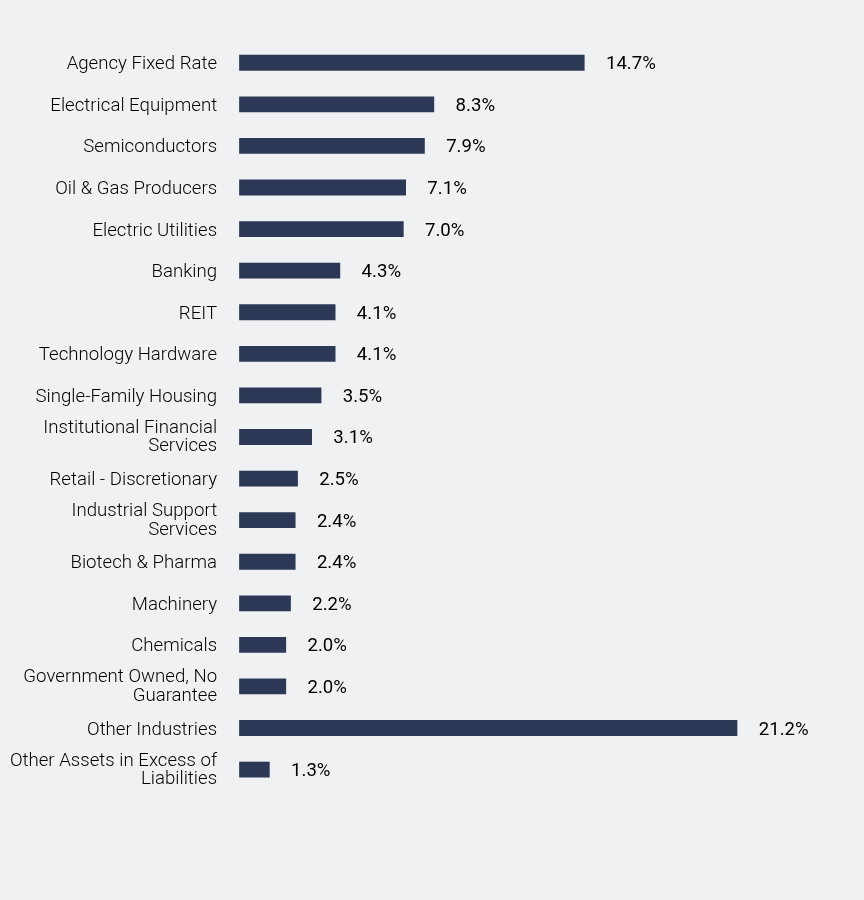
Other Assets in Excess of Liabilities | 1.3% | Other Industries | 21.2% | Government Owned, No Guarantee | 2.0% | Chemicals | 2.0% | Machinery | 2.2% | Biotech & Pharma | 2.4% | Industrial Support Services | 2.4% | Retail - Discretionary | 2.5% | Institutional Financial Services | 3.1% | Single-Family Housing | 3.5% | Technology Hardware | 4.1% | REIT | 4.1% | Banking | 4.3% | Electric Utilities | 7.0% | Oil & Gas Producers | 7.1% | Semiconductors | 7.9% | Electrical Equipment | 8.3% | Agency Fixed Rate | 14.7% | Asset Weighting (% of total investments)Table SummaryValue | Value |
|---|
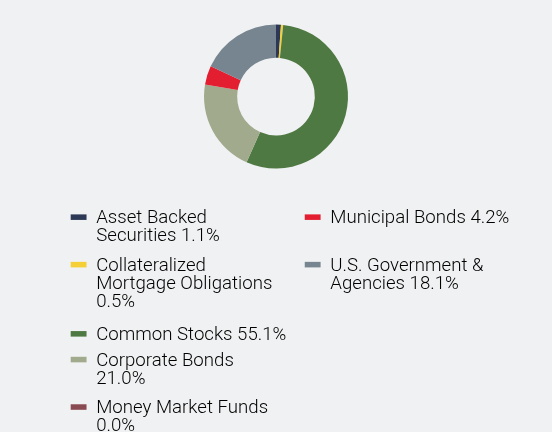
Asset Backed Securities | 1.1% | Collateralized Mortgage Obligations | 0.5% | Common Stocks | 55.1% | Corporate Bonds | 21.0% | Money Market Funds | 0.0% | Municipal Bonds | 4.2% | U.S. Government & Agencies | 18.1% | |
| Largest Holdings [Text Block] |
Top 10 Holdings* (% of net assets)Table SummaryHolding Name | % of Net Assets |
|---|
Trane Technologies PLC | 3.0% |
|---|
nVent Electric PLC | 2.9% |
|---|
KLA Corporation | 2.6% |
|---|
Entergy Corporation | 2.1% |
|---|
Royalty Pharma PLC - Class A | 2.1% |
|---|
Targa Resources Corporation | 2.1% |
|---|
Dell Technologies, Inc. - Class C | 2.0% |
|---|
GE Vernova, Inc. | 2.0% |
|---|
Nasdaq, Inc. | 1.6% |
|---|
Williams Companies, Inc. (The) | 1.6% |
|---|
* Does not include cash/money market funds/equivalents. Based on percentage of net assets. Holdings can change at any time, are subject to risks discussed in the Fund’s prospectus, and should not be considered investment advice. |
| Material Fund Change [Text Block] |
No material changes occurred during the year ended June 30, 2026. |
| C000157836 |
|
| Shareholder Report [Line Items] |
|
| Fund Name |
Eventide Balanced Fund
|
| Class Name |
Class C
|
| Trading Symbol |
ETCMX
|
| Annual or Semi-Annual Statement [Text Block] |
This annual shareholder report contains important information about Eventide Balanced Fund for the period of July 1, 2025 to June 30, 2026.
|
| Additional Information [Text Block] |
You can find additional information about the Fund at https://www.eventidefunds.com. You can also request this information by contacting us at 1-877-771-3836.
|
| Additional Information Phone Number |
1-877-771-3836
|
| Additional Information Website |
https://www.eventidefunds.com
|
| Expenses [Text Block] |
What were the Fund’s costs for the last year?(based on a hypothetical $10,000 investment) Table SummaryClass Name | Costs of a $10,000 investment | Costs paid as a percentage of a $10,000 investment |
|---|
Class C | $194 | 1.82% |
|---|
|
| Expenses Paid, Amount |
$ 194
|
| Expense Ratio, Percent |
1.82%
|
| Factors Affecting Performance [Text Block] |
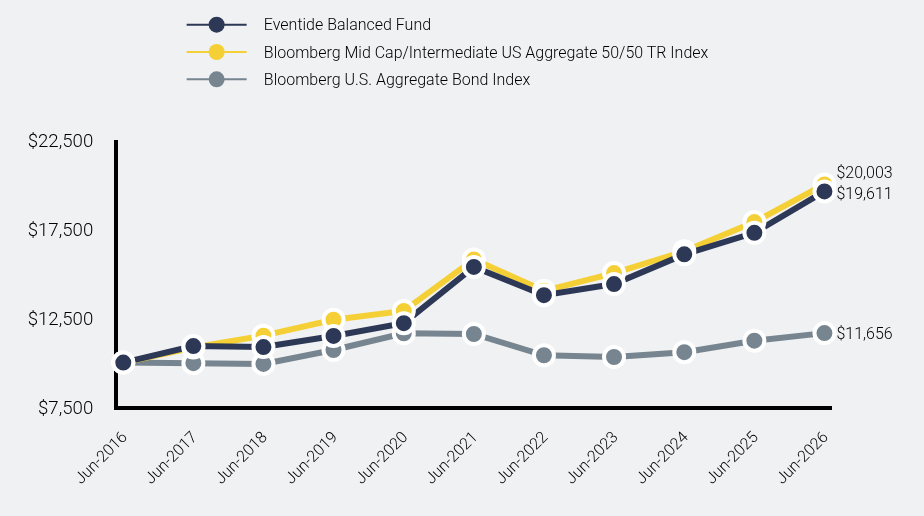
How did the Fund perform during the reporting period? The Fund’s equity positions and fixed income positions outperformed its broad based benchmark. The Fund’s equity positions, which are focused on high-quality dividend growth companies, outperformed fixed income during this time period. The Fund’s fixed income positions outperformed its benchmark also due to the strength of corporate bonds versus Treasury's from an allocation and selection perspective. Our focus remains on resilient growth, strong financials, idiosyncratic risk, and the overarching theme of human flourishing. Our experience underpins our confidence that these high-quality dividend growth companies, within this balanced equity and fixed income strategy, will continue to serve their customers, stakeholders, and shareholders effectively. Visit https://www.eventidefunds.com for more recent performance information. |
| Line Graph [Table Text Block] |
Table Summary | Eventide Balanced Fund | Bloomberg Mid Cap/Intermediate US Aggregate 50/50 TR Index | Bloomberg U.S. Aggregate Bond Index |
|---|
Jun-2016 | $10,000 | $10,000 | $10,000 |
|---|
Jun-2017 | $10,929 | $10,847 | $9,969 |
|---|
Jun-2018 | $10,875 | $11,515 | $9,929 |
|---|
Jun-2019 | $11,499 | $12,408 | $10,710 |
|---|
Jun-2020 | $12,216 | $12,902 | $11,646 |
|---|
Jun-2021 | $15,373 | $15,796 | $11,607 |
|---|
Jun-2022 | $13,784 | $14,030 | $10,413 |
|---|
Jun-2023 | $14,409 | $15,029 | $10,315 |
|---|
Jun-2024 | $16,077 | $16,250 | $10,587 |
|---|
Jun-2025 | $17,287 | $17,889 | $11,230 |
|---|
Jun-2026 | $19,611 | $20,003 | $11,656 |
|---|
|
| Average Annual Return [Table Text Block] |
Table Summary | 1 Year | 5 Years | 10 Years |
|---|
Eventide Balanced Fund - Class C | 13.44% | 4.99% | 6.97% |
|---|
Bloomberg Mid Cap/Intermediate US Aggregate 50/50 TR Index
| 11.82% | 4.84% | 7.18% |
|---|
Bloomberg U.S. Aggregate Bond Index | 3.79% | 0.08% | 1.54% |
|---|
|
| AssetsNet |
$ 398,233,242
|
| Holdings Count | Holding |
164
|
| Advisory Fees Paid, Amount |
$ 2,321,098
|
| InvestmentCompanyPortfolioTurnover |
34.00%
|
| Additional Fund Statistics [Text Block] |
Table SummaryNet Assets | $398,233,242 |
|---|
Number of Portfolio Holdings | 164 |
|---|
Advisory Fee (net of waivers) | $2,321,098 |
|---|
Portfolio Turnover | 34% |
|---|
|
| Holdings [Text Block] |
Industry Weighting (% of net assets)Table SummaryValue | Value |
|---|
Other Assets in Excess of Liabilities | 1.3% | Other Industries | 21.2% | Government Owned, No Guarantee | 2.0% | Chemicals | 2.0% | Machinery | 2.2% | Biotech & Pharma | 2.4% | Industrial Support Services | 2.4% | Retail - Discretionary | 2.5% | Institutional Financial Services | 3.1% | Single-Family Housing | 3.5% | Technology Hardware | 4.1% | REIT | 4.1% | Banking | 4.3% | Electric Utilities | 7.0% | Oil & Gas Producers | 7.1% | Semiconductors | 7.9% | Electrical Equipment | 8.3% | Agency Fixed Rate | 14.7% | Asset Weighting (% of total investments)Table SummaryValue | Value |
|---|
Asset Backed Securities | 1.1% | Collateralized Mortgage Obligations | 0.5% | Common Stocks | 55.1% | Corporate Bonds | 21.0% | Money Market Funds | 0.0% | Municipal Bonds | 4.2% | U.S. Government & Agencies | 18.1% | |
| Largest Holdings [Text Block] |
Top 10 Holdings* (% of net assets)Table SummaryHolding Name | % of Net Assets |
|---|
Trane Technologies PLC | 3.0% |
|---|
nVent Electric PLC | 2.9% |
|---|
KLA Corporation | 2.6% |
|---|
Entergy Corporation | 2.1% |
|---|
Royalty Pharma PLC - Class A | 2.1% |
|---|
Targa Resources Corporation | 2.1% |
|---|
Dell Technologies, Inc. - Class C | 2.0% |
|---|
GE Vernova, Inc. | 2.0% |
|---|
Nasdaq, Inc. | 1.6% |
|---|
Williams Companies, Inc. (The) | 1.6% |
|---|
* Does not include cash/money market funds/equivalents. Based on percentage of net assets. Holdings can change at any time, are subject to risks discussed in the Fund’s prospectus, and should not be considered investment advice. |
| Material Fund Change [Text Block] |
No material changes occurred during the year ended June 30, 2026. |
| C000157837 |
|
| Shareholder Report [Line Items] |
|
| Fund Name |
Eventide Balanced Fund
|
| Class Name |
Class I
|
| Trading Symbol |
ETIMX
|
| Annual or Semi-Annual Statement [Text Block] |
This annual shareholder report contains important information about Eventide Balanced Fund for the period of July 1, 2025 to June 30, 2026.
|
| Additional Information [Text Block] |
You can find additional information about the Fund at https://www.eventidefunds.com. You can also request this information by contacting us at 1-877-771-3836.
|
| Additional Information Phone Number |
1-877-771-3836
|
| Additional Information Website |
https://www.eventidefunds.com
|
| Expenses [Text Block] |
What were the Fund’s costs for the last year?(based on a hypothetical $10,000 investment) Table SummaryClass Name | Costs of a $10,000 investment | Costs paid as a percentage of a $10,000 investment |
|---|
Class I | $88 | 0.82% |
|---|
|
| Expenses Paid, Amount |
$ 88
|
| Expense Ratio, Percent |
0.82%
|
| Factors Affecting Performance [Text Block] |
How did the Fund perform during the reporting period? The Fund’s equity positions and fixed income positions outperformed its broad based benchmark. The Fund’s equity positions, which are focused on high-quality dividend growth companies, outperformed fixed income during this time period. The Fund’s fixed income positions outperformed its benchmark also due to the strength of corporate bonds versus Treasury's from an allocation and selection perspective. Our focus remains on resilient growth, strong financials, idiosyncratic risk, and the overarching theme of human flourishing. Our experience underpins our confidence that these high-quality dividend growth companies, within this balanced equity and fixed income strategy, will continue to serve their customers, stakeholders, and shareholders effectively. Visit https://www.eventidefunds.com for more recent performance information. |
| Line Graph [Table Text Block] |
Table Summary | Eventide Balanced Fund | Bloomberg Mid Cap/Intermediate US Aggregate 50/50 TR Index | Bloomberg U.S. Aggregate Bond Index |
|---|
Jun-2016 | $10,000 | $10,000 | $10,000 |
|---|
Jun-2017 | $11,047 | $10,847 | $9,969 |
|---|
Jun-2018 | $11,099 | $11,515 | $9,929 |
|---|
Jun-2019 | $11,855 | $12,408 | $10,710 |
|---|
Jun-2020 | $12,713 | $12,902 | $11,646 |
|---|
Jun-2021 | $16,160 | $15,796 | $11,607 |
|---|
Jun-2022 | $14,631 | $14,030 | $10,413 |
|---|
Jun-2023 | $15,446 | $15,029 | $10,315 |
|---|
Jun-2024 | $17,415 | $16,250 | $10,587 |
|---|
Jun-2025 | $18,905 | $17,889 | $11,230 |
|---|
Jun-2026 | $21,671 | $20,003 | $11,656 |
|---|
|
| Average Annual Return [Table Text Block] |
Table Summary | 1 Year | 5 Years | 10 Years |
|---|
Eventide Balanced Fund - Class I | 14.64% | 6.04% | 8.04% |
|---|
Bloomberg Mid Cap/Intermediate US Aggregate 50/50 TR Index
| 11.82% | 4.84% | 7.18% |
|---|
Bloomberg U.S. Aggregate Bond Index | 3.79% | 0.08% | 1.54% |
|---|
|
| AssetsNet |
$ 398,233,242
|
| Holdings Count | Holding |
164
|
| Advisory Fees Paid, Amount |
$ 2,321,098
|
| InvestmentCompanyPortfolioTurnover |
34.00%
|
| Additional Fund Statistics [Text Block] |
Table SummaryNet Assets | $398,233,242 |
|---|
Number of Portfolio Holdings | 164 |
|---|
Advisory Fee (net of waivers) | $2,321,098 |
|---|
Portfolio Turnover | 34% |
|---|
|
| Holdings [Text Block] |
Industry Weighting (% of net assets)Table SummaryValue | Value |
|---|
Other Assets in Excess of Liabilities | 1.3% | Other Industries | 21.2% | Government Owned, No Guarantee | 2.0% | Chemicals | 2.0% | Machinery | 2.2% | Biotech & Pharma | 2.4% | Industrial Support Services | 2.4% | Retail - Discretionary | 2.5% | Institutional Financial Services | 3.1% | Single-Family Housing | 3.5% | Technology Hardware | 4.1% | REIT | 4.1% | Banking | 4.3% | Electric Utilities | 7.0% | Oil & Gas Producers | 7.1% | Semiconductors | 7.9% | Electrical Equipment | 8.3% | Agency Fixed Rate | 14.7% | Asset Weighting (% of total investments)Table SummaryValue | Value |
|---|
Asset Backed Securities | 1.1% | Collateralized Mortgage Obligations | 0.5% | Common Stocks | 55.1% | Corporate Bonds | 21.0% | Money Market Funds | 0.0% | Municipal Bonds | 4.2% | U.S. Government & Agencies | 18.1% | |
| Largest Holdings [Text Block] |
Top 10 Holdings* (% of net assets)Table SummaryHolding Name | % of Net Assets |
|---|
Trane Technologies PLC | 3.0% |
|---|
nVent Electric PLC | 2.9% |
|---|
KLA Corporation | 2.6% |
|---|
Entergy Corporation | 2.1% |
|---|
Royalty Pharma PLC - Class A | 2.1% |
|---|
Targa Resources Corporation | 2.1% |
|---|
Dell Technologies, Inc. - Class C | 2.0% |
|---|
GE Vernova, Inc. | 2.0% |
|---|
Nasdaq, Inc. | 1.6% |
|---|
Williams Companies, Inc. (The) | 1.6% |
|---|
* Does not include cash/money market funds/equivalents. Based on percentage of net assets. Holdings can change at any time, are subject to risks discussed in the Fund’s prospectus, and should not be considered investment advice. |
| Material Fund Change [Text Block] |
No material changes occurred during the year ended June 30, 2026. |
| C000157838 |
|
| Shareholder Report [Line Items] |
|
| Fund Name |
Eventide Balanced Fund
|
| Class Name |
Class N
|
| Trading Symbol |
ETNMX
|
| Annual or Semi-Annual Statement [Text Block] |
This annual shareholder report contains important information about Eventide Balanced Fund for the period of July 1, 2025 to June 30, 2026.
|
| Additional Information [Text Block] |
You can find additional information about the Fund at https://www.eventidefunds.com. You can also request this information by contacting us at 1-877-771-3836.
|
| Additional Information Phone Number |
1-877-771-3836
|
| Additional Information Website |
https://www.eventidefunds.com
|
| Expenses [Text Block] |
What were the Fund’s costs for the last year?(based on a hypothetical $10,000 investment) Table SummaryClass Name | Costs of a $10,000 investment | Costs paid as a percentage of a $10,000 investment |
|---|
Class N | $109 | 1.02% |
|---|
|
| Expenses Paid, Amount |
$ 109
|
| Expense Ratio, Percent |
1.02%
|
| Factors Affecting Performance [Text Block] |
How did the Fund perform during the reporting period? The Fund’s equity positions and fixed income positions outperformed its broad based benchmark. The Fund’s equity positions, which are focused on high-quality dividend growth companies, outperformed fixed income during this time period. The Fund’s fixed income positions outperformed its benchmark also due to the strength of corporate bonds versus Treasury's from an allocation and selection perspective. Our focus remains on resilient growth, strong financials, idiosyncratic risk, and the overarching theme of human flourishing. Our experience underpins our confidence that these high-quality dividend growth companies, within this balanced equity and fixed income strategy, will continue to serve their customers, stakeholders, and shareholders effectively. Visit https://www.eventidefunds.com for more recent performance information. |
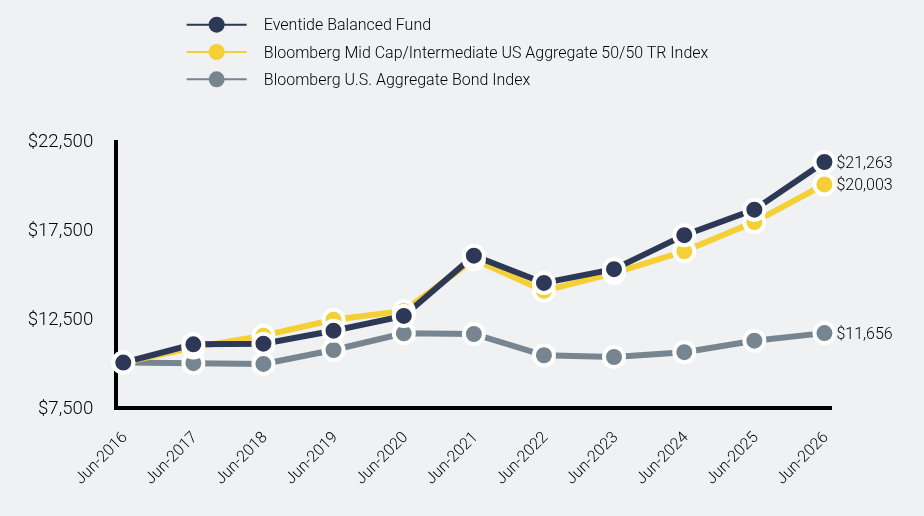
| Line Graph [Table Text Block] |
Table Summary | Eventide Balanced Fund | Bloomberg Mid Cap/Intermediate US Aggregate 50/50 TR Index | Bloomberg U.S. Aggregate Bond Index |
|---|
Jun-2016 | $10,000 | $10,000 | $10,000 |
|---|
Jun-2017 | $11,029 | $10,847 | $9,969 |
|---|
Jun-2018 | $11,062 | $11,515 | $9,929 |
|---|
Jun-2019 | $11,793 | $12,408 | $10,710 |
|---|
Jun-2020 | $12,621 | $12,902 | $11,646 |
|---|
Jun-2021 | $16,005 | $15,796 | $11,607 |
|---|
Jun-2022 | $14,472 | $14,030 | $10,413 |
|---|
Jun-2023 | $15,246 | $15,029 | $10,315 |
|---|
Jun-2024 | $17,155 | $16,250 | $10,587 |
|---|
Jun-2025 | $18,586 | $17,889 | $11,230 |
|---|
Jun-2026 | $21,263 | $20,003 | $11,656 |
|---|
|
| Average Annual Return [Table Text Block] |
Table Summary | 1 Year | 5 Years | 10 Years |
|---|
Eventide Balanced Fund - Class N | 14.40% | 5.85% | 7.84% |
|---|
Bloomberg Mid Cap/Intermediate US Aggregate 50/50 TR Index
| 11.82% | 4.84% | 7.18% |
|---|
Bloomberg U.S. Aggregate Bond Index | 3.79% | 0.08% | 1.54% |
|---|
|
| AssetsNet |
$ 398,233,242
|
| Holdings Count | Holding |
164
|
| Advisory Fees Paid, Amount |
$ 2,321,098
|
| InvestmentCompanyPortfolioTurnover |
34.00%
|
| Additional Fund Statistics [Text Block] |
Table SummaryNet Assets | $398,233,242 |
|---|
Number of Portfolio Holdings | 164 |
|---|
Advisory Fee (net of waivers) | $2,321,098 |
|---|
Portfolio Turnover | 34% |
|---|
|
| Holdings [Text Block] |
Industry Weighting (% of net assets)Table SummaryValue | Value |
|---|
Other Assets in Excess of Liabilities | 1.3% | Other Industries | 21.2% | Government Owned, No Guarantee | 2.0% | Chemicals | 2.0% | Machinery | 2.2% | Biotech & Pharma | 2.4% | Industrial Support Services | 2.4% | Retail - Discretionary | 2.5% | Institutional Financial Services | 3.1% | Single-Family Housing | 3.5% | Technology Hardware | 4.1% | REIT | 4.1% | Banking | 4.3% | Electric Utilities | 7.0% | Oil & Gas Producers | 7.1% | Semiconductors | 7.9% | Electrical Equipment | 8.3% | Agency Fixed Rate | 14.7% | Asset Weighting (% of total investments)Table SummaryValue | Value |
|---|
Asset Backed Securities | 1.1% | Collateralized Mortgage Obligations | 0.5% | Common Stocks | 55.1% | Corporate Bonds | 21.0% | Money Market Funds | 0.0% | Municipal Bonds | 4.2% | U.S. Government & Agencies | 18.1% | |
| Largest Holdings [Text Block] |
Top 10 Holdings* (% of net assets)Table SummaryHolding Name | % of Net Assets |
|---|
Trane Technologies PLC | 3.0% |
|---|
nVent Electric PLC | 2.9% |
|---|
KLA Corporation | 2.6% |
|---|
Entergy Corporation | 2.1% |
|---|
Royalty Pharma PLC - Class A | 2.1% |
|---|
Targa Resources Corporation | 2.1% |
|---|
Dell Technologies, Inc. - Class C | 2.0% |
|---|
GE Vernova, Inc. | 2.0% |
|---|
Nasdaq, Inc. | 1.6% |
|---|
Williams Companies, Inc. (The) | 1.6% |
|---|
* Does not include cash/money market funds/equivalents. Based on percentage of net assets. Holdings can change at any time, are subject to risks discussed in the Fund’s prospectus, and should not be considered investment advice. |
| Material Fund Change [Text Block] |
No material changes occurred during the year ended June 30, 2026. |
| C000220844 |
|
| Shareholder Report [Line Items] |
|
| Fund Name |
Eventide Core Bond Fund
|
| Class Name |
Class A
|
| Trading Symbol |
ETARX
|
| Annual or Semi-Annual Statement [Text Block] |
This annual shareholder report contains important information about Eventide Core Bond Fund for the period of July 1, 2025 to June 30, 2026.
|
| Additional Information [Text Block] |
You can find additional information about the Fund at https://www.eventidefunds.com. You can also request this information by contacting us at 1-877-771-3836.
|
| Material Fund Change Notice [Text Block] |
This report describes changes to the Fund that occurred during the reporting period.
|
| Additional Information Phone Number |
1-877-771-3836
|
| Additional Information Website |
https://www.eventidefunds.com
|
| Expenses [Text Block] |
What were the Fund’s costs for the last year?(based on a hypothetical $10,000 investment) Table SummaryClass Name | Costs of a $10,000 investment | Costs paid as a percentage of a $10,000 investment |
|---|
Class A | $76 | 0.74% |
|---|
|
| Expenses Paid, Amount |
$ 76
|
| Expense Ratio, Percent |
0.74%
|
| Factors Affecting Performance [Text Block] |
How did the Fund perform during the reporting period? The Fund outperformed the benchmark for the year ended June 30, 2026. The Fund benefited from an overweight to corporate bonds and a significant underweight to Treasury bonds as corporate bonds outperformed Treasury bonds. The Fund’s investments in corporate bonds also outperformed the performance of corporate bond allocations within the benchmark. Mortgage-backed securities and taxable municipal bonds also contributed positively to relative returns. Visit https://www.eventidefunds.com for more recent performance information. |
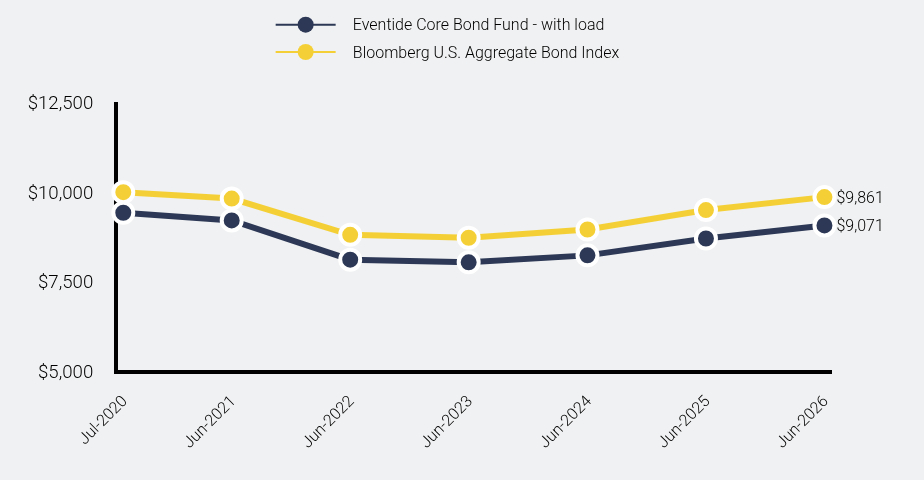
| Line Graph [Table Text Block] |
Table Summary | Eventide Core Bond Fund - with load | Bloomberg U.S. Aggregate Bond Index |
|---|
Jul-2020 | $9,425 | $10,000 |
|---|
Jun-2021 | $9,210 | $9,820 |
|---|
Jun-2022 | $8,113 | $8,809 |
|---|
Jun-2023 | $8,040 | $8,727 |
|---|
Jun-2024 | $8,234 | $8,956 |
|---|
Jun-2025 | $8,706 | $9,500 |
|---|
Jun-2026 | $9,071 | $9,861 |
|---|
|
| Average Annual Return [Table Text Block] |
Table Summary | 1 Year | 5 Years | Since Inception (7/31/2020) |
|---|
Eventide Core Bond Fund - Class A |
|---|
Without Load | 4.19% | -0.30% | -0.65% |
|---|
With Load | -1.75% | -1.47% | -1.63% |
|---|
Bloomberg U.S. Aggregate Bond Index
| 3.79% | 0.08% | -0.24% |
|---|
|
| Performance Inception Date |
Jul. 31, 2020
|
| AssetsNet |
$ 215,134,089
|
| Holdings Count | Holding |
117
|
| Advisory Fees Paid, Amount |
$ 324,413
|
| InvestmentCompanyPortfolioTurnover |
23.00%
|
| Additional Fund Statistics [Text Block] |
Table SummaryNet Assets | $215,134,089 |
|---|
Number of Portfolio Holdings | 117 |
|---|
Advisory Fee (net of waivers) | $324,413 |
|---|
Portfolio Turnover | 23% |
|---|
|
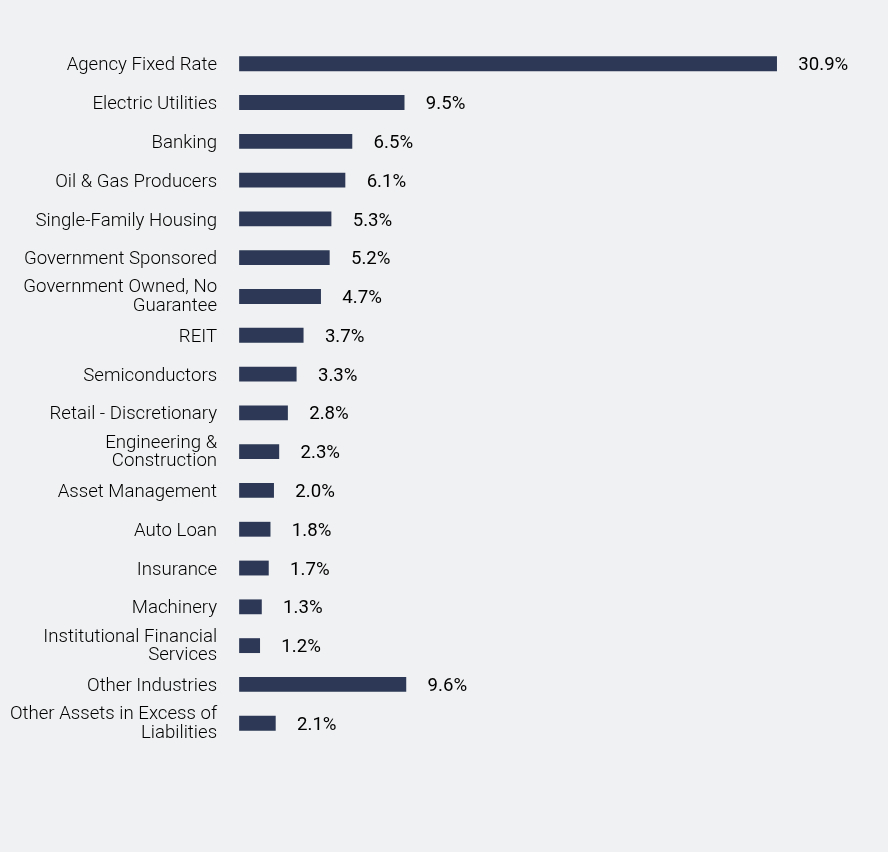
| Holdings [Text Block] |
Industry Weighting (% of net assets)Table SummaryValue | Value |
|---|
Other Assets in Excess of Liabilities | 2.1% | Other Industries | 9.6% | Institutional Financial Services | 1.2% | Machinery | 1.3% | Insurance | 1.7% | Auto Loan | 1.8% | Asset Management | 2.0% | Engineering & Construction | 2.3% | Retail - Discretionary | 2.8% | Semiconductors | 3.3% | REIT | 3.7% | Government Owned, No Guarantee | 4.7% | Government Sponsored | 5.2% | Single-Family Housing | 5.3% | Oil & Gas Producers | 6.1% | Banking | 6.5% | Electric Utilities | 9.5% | Agency Fixed Rate | 30.9% | Asset Weighting (% of total investments)Table SummaryValue | Value |
|---|
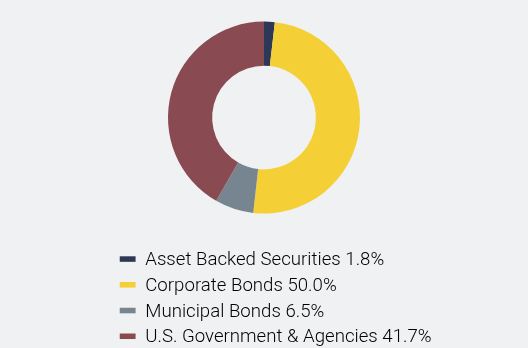
Asset Backed Securities | 1.8% | Corporate Bonds | 50.0% | Municipal Bonds | 6.5% | U.S. Government & Agencies | 41.7% | |
| Largest Holdings [Text Block] |
Top 10 Holdings* (% of net assets)Table SummaryHolding Name | % of Net Assets |
|---|
Ginnie Mae II Pool, 5.000%, due 04/20/56 | 1.5% |
|---|
Ginnie Mae II Pool, 4.500%, due 11/20/55 | 1.4% |
|---|
Ginnie Mae II Pool, 4.500%, due 03/20/54 | 1.4% |
|---|
Fannie Mae Pool, 4.500%, due 11/1/52 | 1.3% |
|---|
Ginnie Mae II Pool, 4.000%, due 03/20/56 | 1.3% |
|---|
JPMorgan Chase & Company, 6.070%, due 10/22/27 | 1.3% |
|---|
Federal Home Loan Mortgage Corporation, 6.250%, due 07/15/32 | 1.3% |
|---|
Fannie Mae Pool, 4.000%, due 12/1/40 | 1.3% |
|---|
Federal National Mortgage Association, 5.625%, due 07/15/37 | 1.3% |
|---|
Fannie Mae Pool, 4.000%, due 08/1/52 | 1.2% |
|---|
* Does not include cash/money market funds/equivalents. Based on percentage of net assets. Holdings can change at any time, are subject to risks discussed in the Fund’s prospectus, and should not be considered investment advice. |
| Material Fund Change [Text Block] |
This is a summary of certain changes to the Fund since July 1, 2025. For more complete information, you may review the Fund’s November 1, 2025 prospectus, which is available at https://www.eventidefunds.com/prospectus or upon request at 1-877-771 EVEN (3836). Effective September 1, 2025, the Advisor reduced the expense limitation by 0.10%. |
| C000220845 |
|
| Shareholder Report [Line Items] |
|
| Fund Name |
Eventide Core Bond Fund
|
| Class Name |
Class C
|
| Trading Symbol |
ETCRX
|
| Annual or Semi-Annual Statement [Text Block] |
This annual shareholder report contains important information about Eventide Core Bond Fund for the period of July 1, 2025 to June 30, 2026.
|
| Additional Information [Text Block] |
You can find additional information about the Fund at https://www.eventidefunds.com. You can also request this information by contacting us at 1-877-771-3836.
|
| Material Fund Change Notice [Text Block] |
This report describes changes to the Fund that occurred during the reporting period.
|
| Additional Information Phone Number |
1-877-771-3836
|
| Additional Information Website |
https://www.eventidefunds.com
|
| Expenses [Text Block] |
What were the Fund’s costs for the last year?(based on a hypothetical $10,000 investment) Table SummaryClass Name | Costs of a $10,000 investment | Costs paid as a percentage of a $10,000 investment |
|---|
Class C | $151 | 1.49% |
|---|
|
| Expenses Paid, Amount |
$ 151
|
| Expense Ratio, Percent |
1.49%
|
| Factors Affecting Performance [Text Block] |
How did the Fund perform during the reporting period? The Fund outperformed the benchmark for the year ended June 30, 2026. The Class underperformed for the same period due to class specific fees. The Fund benefited from an overweight to corporate bonds and a significant underweight to Treasury bonds as corporate bonds outperformed Treasury bonds. The Fund’s investments in corporate bonds also outperformed the performance of corporate bond allocations within the benchmark. Mortgage-backed securities and taxable municipal bonds also contributed positively to relative returns. Visit https://www.eventidefunds.com for more recent performance information. |
| Line Graph [Table Text Block] |
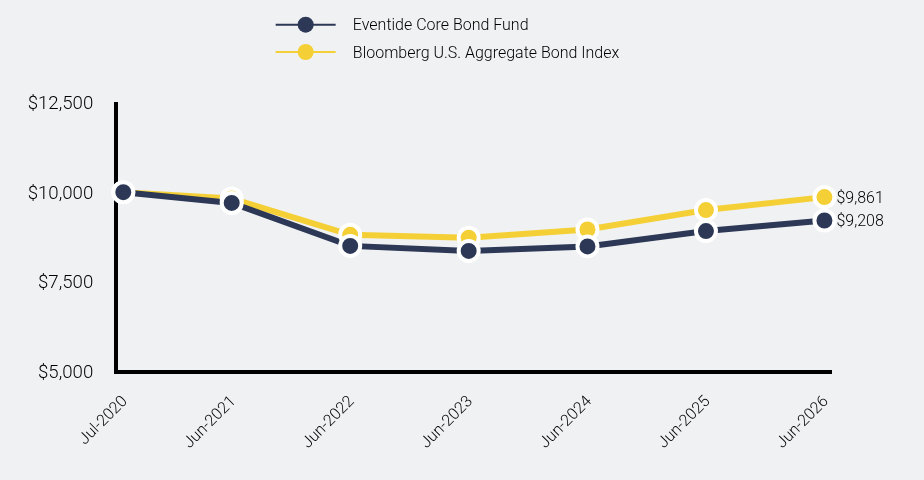
Table Summary | Eventide Core Bond Fund | Bloomberg U.S. Aggregate Bond Index |
|---|
Jul-2020 | $10,000 | $10,000 |
|---|
Jun-2021 | $9,698 | $9,820 |
|---|
Jun-2022 | $8,499 | $8,809 |
|---|
Jun-2023 | $8,357 | $8,727 |
|---|
Jun-2024 | $8,485 | $8,956 |
|---|
Jun-2025 | $8,913 | $9,500 |
|---|
Jun-2026 | $9,208 | $9,861 |
|---|
|
| Average Annual Return [Table Text Block] |
Table Summary | 1 Year | 5 Years | Since Inception (7/31/2020) |
|---|
Eventide Core Bond Fund - Class C | 3.32% | -1.03% | -1.38% |
|---|
Bloomberg U.S. Aggregate Bond Index
| 3.79% | 0.08% | -0.24% |
|---|
|
| Performance Inception Date |
Jul. 31, 2020
|
| AssetsNet |
$ 215,134,089
|
| Holdings Count | Holding |
117
|
| Advisory Fees Paid, Amount |
$ 324,413
|
| InvestmentCompanyPortfolioTurnover |
23.00%
|
| Additional Fund Statistics [Text Block] |
Table SummaryNet Assets | $215,134,089 |
|---|
Number of Portfolio Holdings | 117 |
|---|
Advisory Fee (net of waivers) | $324,413 |
|---|
Portfolio Turnover | 23% |
|---|
|
| Holdings [Text Block] |
Industry Weighting (% of net assets)Table SummaryValue | Value |
|---|
Other Assets in Excess of Liabilities | 2.1% | Other Industries | 9.6% | Institutional Financial Services | 1.2% | Machinery | 1.3% | Insurance | 1.7% | Auto Loan | 1.8% | Asset Management | 2.0% | Engineering & Construction | 2.3% | Retail - Discretionary | 2.8% | Semiconductors | 3.3% | REIT | 3.7% | Government Owned, No Guarantee | 4.7% | Government Sponsored | 5.2% | Single-Family Housing | 5.3% | Oil & Gas Producers | 6.1% | Banking | 6.5% | Electric Utilities | 9.5% | Agency Fixed Rate | 30.9% | Asset Weighting (% of total investments)Table SummaryValue | Value |
|---|
Asset Backed Securities | 1.8% | Corporate Bonds | 50.0% | Municipal Bonds | 6.5% | U.S. Government & Agencies | 41.7% | |
| Largest Holdings [Text Block] |
Top 10 Holdings* (% of net assets)Table SummaryHolding Name | % of Net Assets |
|---|
Ginnie Mae II Pool, 5.000%, due 04/20/56 | 1.5% |
|---|
Ginnie Mae II Pool, 4.500%, due 11/20/55 | 1.4% |
|---|
Ginnie Mae II Pool, 4.500%, due 03/20/54 | 1.4% |
|---|
Fannie Mae Pool, 4.500%, due 11/1/52 | 1.3% |
|---|
Ginnie Mae II Pool, 4.000%, due 03/20/56 | 1.3% |
|---|
JPMorgan Chase & Company, 6.070%, due 10/22/27 | 1.3% |
|---|
Federal Home Loan Mortgage Corporation, 6.250%, due 07/15/32 | 1.3% |
|---|
Fannie Mae Pool, 4.000%, due 12/1/40 | 1.3% |
|---|
Federal National Mortgage Association, 5.625%, due 07/15/37 | 1.3% |
|---|
Fannie Mae Pool, 4.000%, due 08/1/52 | 1.2% |
|---|
* Does not include cash/money market funds/equivalents. Based on percentage of net assets. Holdings can change at any time, are subject to risks discussed in the Fund’s prospectus, and should not be considered investment advice. |
| Material Fund Change [Text Block] |
This is a summary of certain changes to the Fund since July 1, 2025. For more complete information, you may review the Fund’s November 1, 2025 prospectus, which is available at https://www.eventidefunds.com/prospectus or upon request at 1-877-771 EVEN (3836). Effective September 1, 2025, the Advisor reduced the expense limitation by 0.10%. |
| C000220846 |
|
| Shareholder Report [Line Items] |
|
| Fund Name |
Eventide Core Bond Fund
|
| Class Name |
Class I
|
| Trading Symbol |
ETIRX
|
| Annual or Semi-Annual Statement [Text Block] |
This annual shareholder report contains important information about Eventide Core Bond Fund for the period of July 1, 2025 to June 30, 2026.
|
| Additional Information [Text Block] |
You can find additional information about the Fund at https://www.eventidefunds.com. You can also request this information by contacting us at 1-877-771-3836.
|
| Material Fund Change Notice [Text Block] |
This report describes changes to the Fund that occurred during the reporting period.
|
| Additional Information Phone Number |
1-877-771-3836
|
| Additional Information Website |
https://www.eventidefunds.com
|
| Expenses [Text Block] |
What were the Fund’s costs for the last year?(based on a hypothetical $10,000 investment) Table SummaryClass Name | Costs of a $10,000 investment | Costs paid as a percentage of a $10,000 investment |
|---|
Class I | $51 | 0.49% |
|---|
|
| Expenses Paid, Amount |
$ 51
|
| Expense Ratio, Percent |
0.49%
|
| Factors Affecting Performance [Text Block] |
How did the Fund perform during the reporting period? The Fund outperformed the benchmark for the year ended June 30, 2026. The Fund benefited from an overweight to corporate bonds and a significant underweight to Treasury bonds as corporate bonds outperformed Treasury bonds. The Fund’s investments in corporate bonds also outperformed the performance of corporate bond allocations within the benchmark. Mortgage-backed securities and taxable municipal bonds also contributed positively to relative returns. Visit https://www.eventidefunds.com for more recent performance information. |
| Line Graph [Table Text Block] |
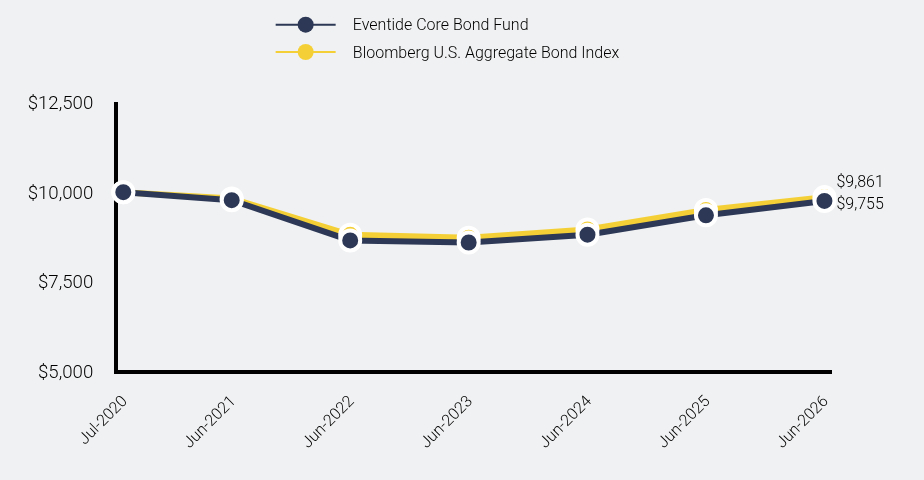
Table Summary | Eventide Core Bond Fund | Bloomberg U.S. Aggregate Bond Index |
|---|
Jul-2020 | $10,000 | $10,000 |
|---|
Jun-2021 | $9,776 | $9,820 |
|---|
Jun-2022 | $8,651 | $8,809 |
|---|
Jun-2023 | $8,593 | $8,727 |
|---|
Jun-2024 | $8,812 | $8,956 |
|---|
Jun-2025 | $9,353 | $9,500 |
|---|
Jun-2026 | $9,755 | $9,861 |
|---|
|
| Average Annual Return [Table Text Block] |
Table Summary | 1 Year | 5 Years | Since Inception (7/31/2020) |
|---|
Eventide Core Bond Fund - Class I | 4.30% | -0.04% | -0.42% |
|---|
Bloomberg U.S. Aggregate Bond Index
| 3.79% | 0.08% | -0.24% |
|---|
|
| Performance Inception Date |
Jul. 31, 2020
|
| AssetsNet |
$ 215,134,089
|
| Holdings Count | Holding |
117
|
| Advisory Fees Paid, Amount |
$ 324,413
|
| InvestmentCompanyPortfolioTurnover |
23.00%
|
| Additional Fund Statistics [Text Block] |
Table SummaryNet Assets | $215,134,089 |
|---|
Number of Portfolio Holdings | 117 |
|---|
Advisory Fee (net of waivers) | $324,413 |
|---|
Portfolio Turnover | 23% |
|---|
|
| Holdings [Text Block] |
Industry Weighting (% of net assets)Table SummaryValue | Value |
|---|
Other Assets in Excess of Liabilities | 2.1% | Other Industries | 9.6% | Institutional Financial Services | 1.2% | Machinery | 1.3% | Insurance | 1.7% | Auto Loan | 1.8% | Asset Management | 2.0% | Engineering & Construction | 2.3% | Retail - Discretionary | 2.8% | Semiconductors | 3.3% | REIT | 3.7% | Government Owned, No Guarantee | 4.7% | Government Sponsored | 5.2% | Single-Family Housing | 5.3% | Oil & Gas Producers | 6.1% | Banking | 6.5% | Electric Utilities | 9.5% | Agency Fixed Rate | 30.9% | Asset Weighting (% of total investments)Table SummaryValue | Value |
|---|
Asset Backed Securities | 1.8% | Corporate Bonds | 50.0% | Municipal Bonds | 6.5% | U.S. Government & Agencies | 41.7% | |
| Largest Holdings [Text Block] |
Top 10 Holdings* (% of net assets)Table SummaryHolding Name | % of Net Assets |
|---|
Ginnie Mae II Pool, 5.000%, due 04/20/56 | 1.5% |
|---|
Ginnie Mae II Pool, 4.500%, due 11/20/55 | 1.4% |
|---|
Ginnie Mae II Pool, 4.500%, due 03/20/54 | 1.4% |
|---|
Fannie Mae Pool, 4.500%, due 11/1/52 | 1.3% |
|---|
Ginnie Mae II Pool, 4.000%, due 03/20/56 | 1.3% |
|---|
JPMorgan Chase & Company, 6.070%, due 10/22/27 | 1.3% |
|---|
Federal Home Loan Mortgage Corporation, 6.250%, due 07/15/32 | 1.3% |
|---|
Fannie Mae Pool, 4.000%, due 12/1/40 | 1.3% |
|---|
Federal National Mortgage Association, 5.625%, due 07/15/37 | 1.3% |
|---|
Fannie Mae Pool, 4.000%, due 08/1/52 | 1.2% |
|---|
* Does not include cash/money market funds/equivalents. Based on percentage of net assets. Holdings can change at any time, are subject to risks discussed in the Fund’s prospectus, and should not be considered investment advice. |
| Material Fund Change [Text Block] |
This is a summary of certain changes to the Fund since July 1, 2025. For more complete information, you may review the Fund’s November 1, 2025 prospectus, which is available at https://www.eventidefunds.com/prospectus or upon request at 1-877-771 EVEN (3836). Effective September 1, 2025, the Advisor reduced the expense limitation by 0.10%. |
| C000220843 |
|
| Shareholder Report [Line Items] |
|
| Fund Name |
Eventide Core Bond Fund
|
| Class Name |
Class N
|
| Trading Symbol |
ETNRX
|
| Annual or Semi-Annual Statement [Text Block] |
This annual shareholder report contains important information about Eventide Core Bond Fund for the period of July 1, 2025 to June 30, 2026.
|
| Additional Information [Text Block] |
You can find additional information about the Fund at https://www.eventidefunds.com. You can also request this information by contacting us at 1-877-771-3836.
|
| Material Fund Change Notice [Text Block] |
This report describes changes to the Fund that occurred during the reporting period.
|
| Additional Information Phone Number |
1-877-771-3836
|
| Additional Information Website |
https://www.eventidefunds.com
|
| Expenses [Text Block] |
What were the Fund’s costs for the last year?(based on a hypothetical $10,000 investment) Table SummaryClass Name | Costs of a $10,000 investment | Costs paid as a percentage of a $10,000 investment |
|---|
Class N | $70 | 0.69% |
|---|
|
| Expenses Paid, Amount |
$ 70
|
| Expense Ratio, Percent |
0.69%
|
| Factors Affecting Performance [Text Block] |
How did the Fund perform during the reporting period? The Fund outperformed the benchmark for the year ended June 30, 2026. The Fund benefited from an overweight to corporate bonds and a significant underweight to Treasury bonds as corporate bonds outperformed Treasury bonds. The Fund’s investments in corporate bonds also outperformed the performance of corporate bond allocations within the benchmark. Mortgage-backed securities and taxable municipal bonds also contributed positively to relative returns. Visit https://www.eventidefunds.com for more recent performance information. |
| Line Graph [Table Text Block] |
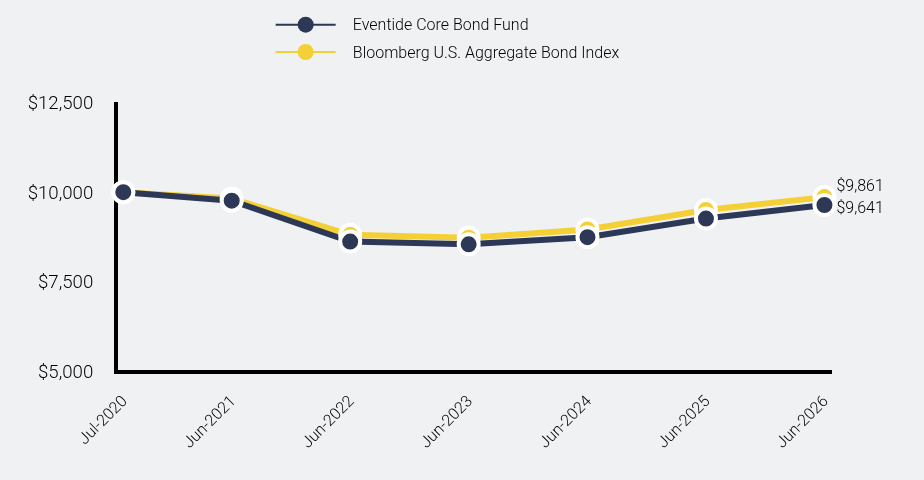
Table Summary | Eventide Core Bond Fund | Bloomberg U.S. Aggregate Bond Index |
|---|
Jul-2020 | $10,000 | $10,000 |
|---|
Jun-2021 | $9,761 | $9,820 |
|---|
Jun-2022 | $8,620 | $8,809 |
|---|
Jun-2023 | $8,543 | $8,727 |
|---|
Jun-2024 | $8,743 | $8,956 |
|---|
Jun-2025 | $9,262 | $9,500 |
|---|
Jun-2026 | $9,641 | $9,861 |
|---|
|
| Average Annual Return [Table Text Block] |
Table Summary | 1 Year | 5 Years | Since Inception (7/31/2020) |
|---|
Eventide Core Bond Fund - Class N | 4.10% | -0.25% | -0.62% |
|---|
Bloomberg U.S. Aggregate Bond Index
| 3.79% | 0.08% | -0.24% |
|---|
|
| Performance Inception Date |
Jul. 31, 2020
|
| AssetsNet |
$ 215,134,089
|
| Holdings Count | Holding |
117
|
| Advisory Fees Paid, Amount |
$ 324,413
|
| InvestmentCompanyPortfolioTurnover |
23.00%
|
| Additional Fund Statistics [Text Block] |
Table SummaryNet Assets | $215,134,089 |
|---|
Number of Portfolio Holdings | 117 |
|---|
Advisory Fee (net of waivers) | $324,413 |
|---|
Portfolio Turnover | 23% |
|---|
|
| Holdings [Text Block] |
Industry Weighting (% of net assets)Table SummaryValue | Value |
|---|
Other Assets in Excess of Liabilities | 2.1% | Other Industries | 9.6% | Institutional Financial Services | 1.2% | Machinery | 1.3% | Insurance | 1.7% | Auto Loan | 1.8% | Asset Management | 2.0% | Engineering & Construction | 2.3% | Retail - Discretionary | 2.8% | Semiconductors | 3.3% | REIT | 3.7% | Government Owned, No Guarantee | 4.7% | Government Sponsored | 5.2% | Single-Family Housing | 5.3% | Oil & Gas Producers | 6.1% | Banking | 6.5% | Electric Utilities | 9.5% | Agency Fixed Rate | 30.9% | Asset Weighting (% of total investments)Table SummaryValue | Value |
|---|
Asset Backed Securities | 1.8% | Corporate Bonds | 50.0% | Municipal Bonds | 6.5% | U.S. Government & Agencies | 41.7% | |
| Largest Holdings [Text Block] |
Top 10 Holdings* (% of net assets)Table SummaryHolding Name | % of Net Assets |
|---|
Ginnie Mae II Pool, 5.000%, due 04/20/56 | 1.5% |
|---|
Ginnie Mae II Pool, 4.500%, due 11/20/55 | 1.4% |
|---|
Ginnie Mae II Pool, 4.500%, due 03/20/54 | 1.4% |
|---|
Fannie Mae Pool, 4.500%, due 11/1/52 | 1.3% |
|---|
Ginnie Mae II Pool, 4.000%, due 03/20/56 | 1.3% |
|---|
JPMorgan Chase & Company, 6.070%, due 10/22/27 | 1.3% |
|---|
Federal Home Loan Mortgage Corporation, 6.250%, due 07/15/32 | 1.3% |
|---|
Fannie Mae Pool, 4.000%, due 12/1/40 | 1.3% |
|---|
Federal National Mortgage Association, 5.625%, due 07/15/37 | 1.3% |
|---|
Fannie Mae Pool, 4.000%, due 08/1/52 | 1.2% |
|---|
* Does not include cash/money market funds/equivalents. Based on percentage of net assets. Holdings can change at any time, are subject to risks discussed in the Fund’s prospectus, and should not be considered investment advice. |
| Material Fund Change [Text Block] |
This is a summary of certain changes to the Fund since July 1, 2025. For more complete information, you may review the Fund’s November 1, 2025 prospectus, which is available at https://www.eventidefunds.com/prospectus or upon request at 1-877-771 EVEN (3836). Effective September 1, 2025, the Advisor reduced the expense limitation by 0.10%. |
| C000193764 |
|
| Shareholder Report [Line Items] |
|
| Fund Name |
Eventide Dividend Growth Fund
|
| Class Name |
Class A
|
| Trading Symbol |
ETADX
|
| Annual or Semi-Annual Statement [Text Block] |
This annual shareholder report contains important information about Eventide Dividend Growth Fund for the period of July 1, 2025 to June 30, 2026.
|
| Additional Information [Text Block] |
You can find additional information about the Fund at https://www.eventidefunds.com. You can also request this information by contacting us at 1-877-771-3836.
|
| Additional Information Phone Number |
1-877-771-3836
|
| Additional Information Website |
https://www.eventidefunds.com
|
| Expenses [Text Block] |
What were the Fund’s costs for the last year?(based on a hypothetical $10,000 investment) Table SummaryClass Name | Costs of a $10,000 investment | Costs paid as a percentage of a $10,000 investment |
|---|
Class A | $134 | 1.20% |
|---|
|
| Expenses Paid, Amount |
$ 134
|
| Expense Ratio, Percent |
1.20%
|
| Factors Affecting Performance [Text Block] |
How did the Fund perform during the reporting period? The Fund underperformed the broad based benchmark for the year. The high-quality, dividend-focused style of the Fund did not keep up with the higher-beta constituents of the equal-weighted broad based benchmark during a very strong year for US equities from an absolute return perspective. An underweight to Healthcare and an overweight to Utilities was a drag on relative returns while an intentional underweight to Consumer Staples was a positive. From a stock selection standpoint, strength in Information Technology holdings was more than offset by weakness in Financials, Healthcare and Consumer Discretionary positions. Our focus remains on resilient growth, strong financials, idiosyncratic risk, and the overarching theme of human flourishing. Our experience underpins our confidence that these high-quality dividend growth companies will continue to serve their customers, stakeholders, and shareholders effectively. Visit https://www.eventidefunds.com for more recent performance information. |
| Line Graph [Table Text Block] |
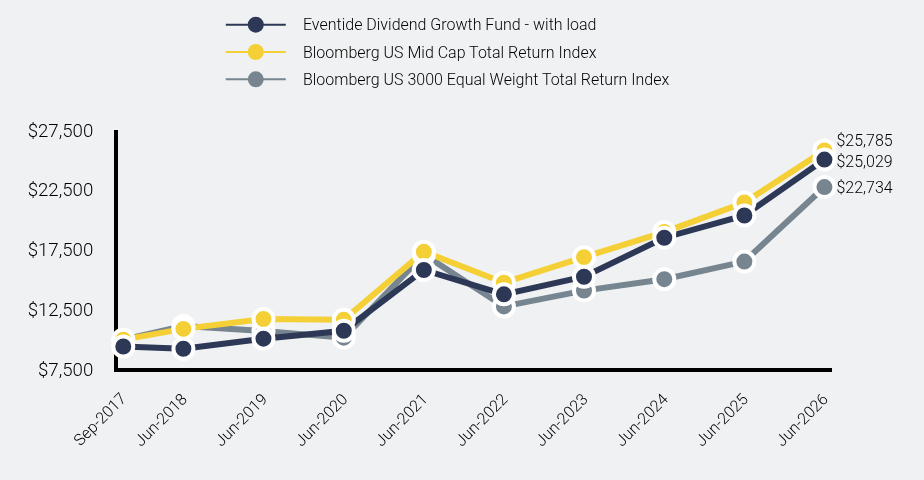
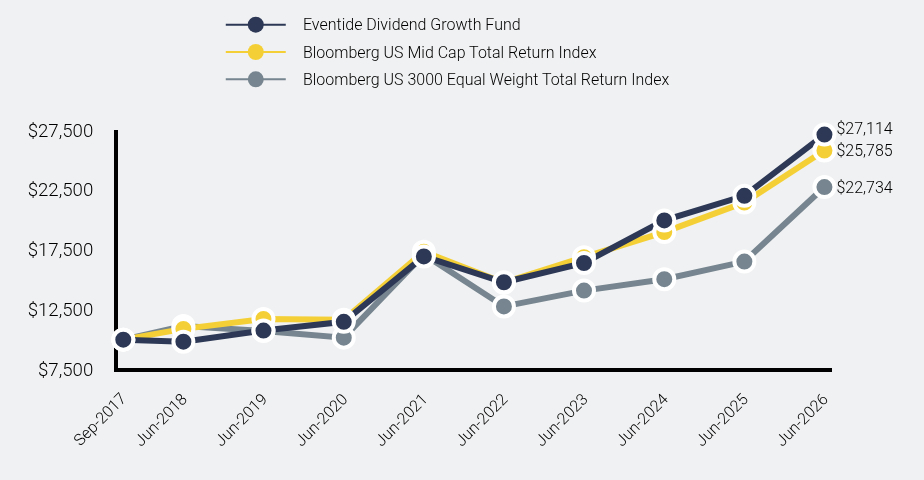
Table Summary | Eventide Dividend Growth Fund - with load | Bloomberg US Mid Cap Total Return Index | Bloomberg US 3000 Equal Weight Total Return Index |
|---|
Sep-2017 | $9,425 | $10,000 | $10,000 |
|---|
Jun-2018 | $9,236 | $10,897 | $11,146 |
|---|
Jun-2019 | $10,081 | $11,723 | $10,713 |
|---|
Jun-2020 | $10,742 | $11,654 | $10,166 |
|---|
Jun-2021 | $15,814 | $17,332 | $17,109 |
|---|
Jun-2022 | $13,778 | $14,753 | $12,770 |
|---|
Jun-2023 | $15,250 | $16,886 | $14,093 |
|---|
Jun-2024 | $18,505 | $18,980 | $15,045 |
|---|
Jun-2025 | $20,362 | $21,448 | $16,516 |
|---|
Jun-2026 | $25,029 | $25,785 | $22,734 |
|---|
|
| Average Annual Return [Table Text Block] |
Table Summary | 1 Year | 5 Years | Since Inception (9/29/2017) |
|---|
Eventide Dividend Growth Fund - Class A |
|---|
Without Load | 22.92% | 9.62% | 11.81% |
|---|
With Load | 15.88% | 8.32% | 11.05% |
|---|
Bloomberg US Mid Cap Total Return Index
| 20.22% | 8.27% | 11.43% |
|---|
Bloomberg US 3000 Equal Weight Total Return Index | 37.65% | 5.85% | 9.84% |
|---|
|
| Performance Inception Date |
Sep. 29, 2017
|
| AssetsNet |
$ 1,425,327,971
|
| Holdings Count | Holding |
59
|
| Advisory Fees Paid, Amount |
$ 9,119,479
|
| InvestmentCompanyPortfolioTurnover |
42.00%
|
| Additional Fund Statistics [Text Block] |
- Net Assets$1,425,327,971
- Number of Portfolio Holdings59
- Advisory Fee (with fee recapture)$9,119,479
- Portfolio Turnover42%
|
| Holdings [Text Block] |
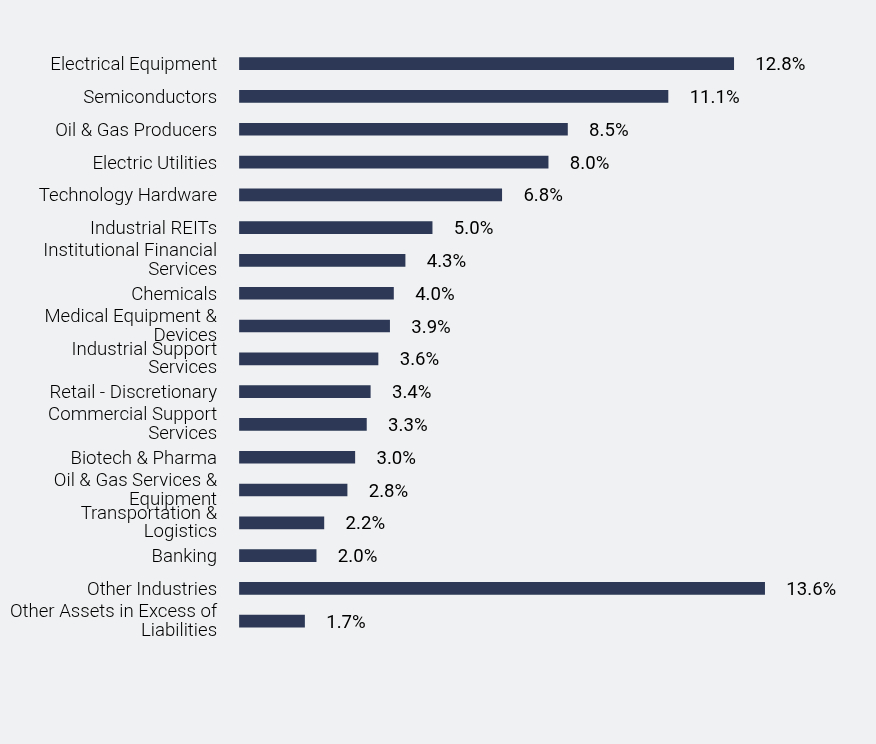
Industry Weighting (% of net assets)Table SummaryValue | Value |
|---|
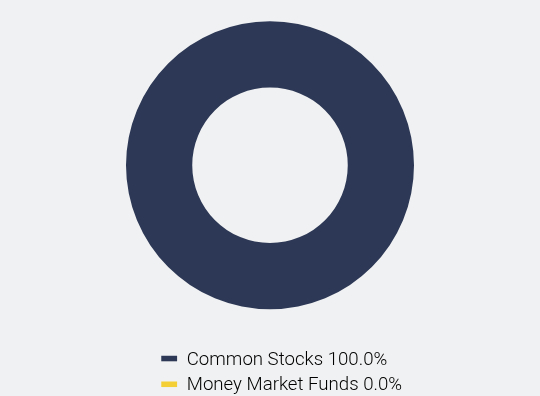
Other Assets in Excess of Liabilities | 1.7% | Other Industries | 13.6% | Banking | 2.0% | Transportation & Logistics | 2.2% | Oil & Gas Services & Equipment | 2.8% | Biotech & Pharma | 3.0% | Commercial Support Services | 3.3% | Retail - Discretionary | 3.4% | Industrial Support Services | 3.6% | Medical Equipment & Devices | 3.9% | Chemicals | 4.0% | Institutional Financial Services | 4.3% | Industrial REITs | 5.0% | Technology Hardware | 6.8% | Electric Utilities | 8.0% | Oil & Gas Producers | 8.5% | Semiconductors | 11.1% | Electrical Equipment | 12.8% | Asset Weighting (% of total investments)Table SummaryValue | Value |
|---|
Common Stocks | 100.0% | Money Market Funds | 0.0% | |
| Largest Holdings [Text Block] |
Top 10 Holdings* (% of net assets)Table SummaryHolding Name | % of Net Assets |
|---|
Trane Technologies PLC | 4.9% |
|---|
nVent Electric PLC | 4.7% |
|---|
KLA Corporation | 4.4% |
|---|
Entergy Corporation | 3.6% |
|---|
Targa Resources Corporation | 3.5% |
|---|
GE Vernova, Inc. | 3.2% |
|---|
Dell Technologies, Inc. - Class C | 3.1% |
|---|
Royalty Pharma PLC - Class A | 3.0% |
|---|
Element Solutions, Inc. | 2.9% |
|---|
Nasdaq, Inc. | 2.7% |
|---|
* Does not include cash/money market funds/equivalents. Based on percentage of net assets. Holdings can change at any time, are subject to risks discussed in the Fund’s prospectus, and should not be considered investment advice. |
| Material Fund Change [Text Block] |
No material changes occurred during the year ended June 30, 2026. |
| C000193765 |
|
| Shareholder Report [Line Items] |
|
| Fund Name |
Eventide Dividend Growth Fund
|
| Class Name |
Class C
|
| Trading Symbol |
ETCDX
|
| Annual or Semi-Annual Statement [Text Block] |
This annual shareholder report contains important information about Eventide Dividend Growth Fund for the period of July 1, 2025 to June 30, 2026.
|
| Additional Information [Text Block] |
You can find additional information about the Fund at https://www.eventidefunds.com. You can also request this information by contacting us at 1-877-771-3836.
|
| Additional Information Phone Number |
1-877-771-3836
|
| Additional Information Website |
https://www.eventidefunds.com
|
| Expenses [Text Block] |
What were the Fund’s costs for the last year?(based on a hypothetical $10,000 investment) Table SummaryClass Name | Costs of a $10,000 investment | Costs paid as a percentage of a $10,000 investment |
|---|
Class C | $216 | 1.95% |
|---|
|
| Expenses Paid, Amount |
$ 216
|
| Expense Ratio, Percent |
1.95%
|
| Factors Affecting Performance [Text Block] |
How did the Fund perform during the reporting period? The Fund underperformed the broad based benchmark for the year. The high-quality, dividend-focused style of the Fund did not keep up with the higher-beta constituents of the equal-weighted broad based benchmark during a very strong year for US equities from an absolute return perspective. An underweight to Healthcare and an overweight to Utilities was a drag on relative returns while an intentional underweight to Consumer Staples was a positive. From a stock selection standpoint, strength in Information Technology holdings was more than offset by weakness in Financials, Healthcare and Consumer Discretionary positions. Our focus remains on resilient growth, strong financials, idiosyncratic risk, and the overarching theme of human flourishing. Our experience underpins our confidence that these high-quality dividend growth companies will continue to serve their customers, stakeholders, and shareholders effectively. Visit https://www.eventidefunds.com for more recent performance information. |
| Line Graph [Table Text Block] |
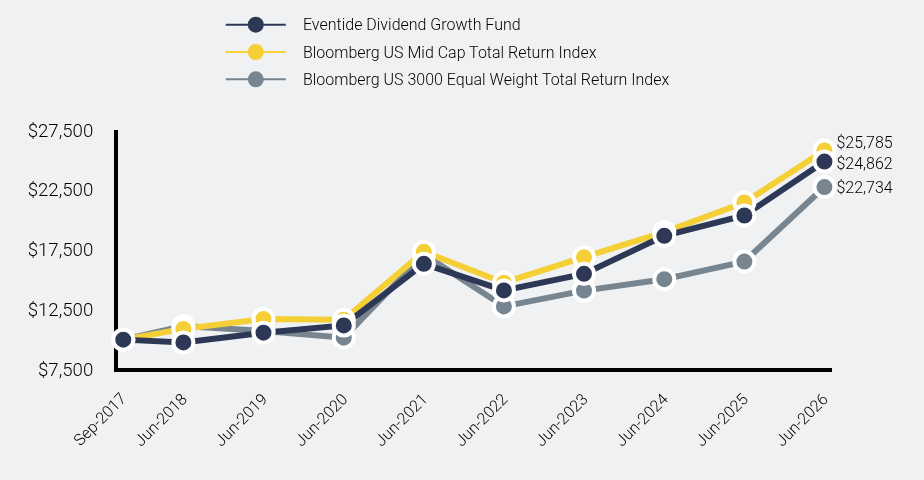
Table Summary | Eventide Dividend Growth Fund | Bloomberg US Mid Cap Total Return Index | Bloomberg US 3000 Equal Weight Total Return Index |
|---|
Sep-2017 | $10,000 | $10,000 | $10,000 |
|---|
Jun-2018 | $9,763 | $10,897 | $11,146 |
|---|
Jun-2019 | $10,577 | $11,723 | $10,713 |
|---|
Jun-2020 | $11,188 | $11,654 | $10,166 |
|---|
Jun-2021 | $16,326 | $17,332 | $17,109 |
|---|
Jun-2022 | $14,110 | $14,753 | $12,770 |
|---|
Jun-2023 | $15,490 | $16,886 | $14,093 |
|---|
Jun-2024 | $18,665 | $18,980 | $15,045 |
|---|
Jun-2025 | $20,359 | $21,448 | $16,516 |
|---|
Jun-2026 | $24,862 | $25,785 | $22,734 |
|---|
|
| Average Annual Return [Table Text Block] |
Table Summary | 1 Year | 5 Years | Since Inception (9/29/2017) |
|---|
Eventide Dividend Growth Fund - Class C | 22.12% | 8.77% | 10.97% |
|---|
Bloomberg US Mid Cap Total Return Index
| 20.22% | 8.27% | 11.43% |
|---|
Bloomberg US 3000 Equal Weight Total Return Index | 37.65% | 5.85% | 9.84% |
|---|
|
| Performance Inception Date |
Sep. 29, 2017
|
| AssetsNet |
$ 1,425,327,971
|
| Holdings Count | Holding |
59
|
| Advisory Fees Paid, Amount |
$ 9,119,479
|
| InvestmentCompanyPortfolioTurnover |
42.00%
|
| Additional Fund Statistics [Text Block] |
- Net Assets$1,425,327,971
- Number of Portfolio Holdings59
- Advisory Fee (with fee recapture)$9,119,479
- Portfolio Turnover42%
|
| Holdings [Text Block] |
Industry Weighting (% of net assets)Table SummaryValue | Value |
|---|
Other Assets in Excess of Liabilities | 1.7% | Other Industries | 13.6% | Banking | 2.0% | Transportation & Logistics | 2.2% | Oil & Gas Services & Equipment | 2.8% | Biotech & Pharma | 3.0% | Commercial Support Services | 3.3% | Retail - Discretionary | 3.4% | Industrial Support Services | 3.6% | Medical Equipment & Devices | 3.9% | Chemicals | 4.0% | Institutional Financial Services | 4.3% | Industrial REITs | 5.0% | Technology Hardware | 6.8% | Electric Utilities | 8.0% | Oil & Gas Producers | 8.5% | Semiconductors | 11.1% | Electrical Equipment | 12.8% | Asset Weighting (% of total investments)Table SummaryValue | Value |
|---|
Common Stocks | 100.0% | Money Market Funds | 0.0% | |
| Largest Holdings [Text Block] |
Top 10 Holdings* (% of net assets)Table SummaryHolding Name | % of Net Assets |
|---|
Trane Technologies PLC | 4.9% |
|---|
nVent Electric PLC | 4.7% |
|---|
KLA Corporation | 4.4% |
|---|
Entergy Corporation | 3.6% |
|---|
Targa Resources Corporation | 3.5% |
|---|
GE Vernova, Inc. | 3.2% |
|---|
Dell Technologies, Inc. - Class C | 3.1% |
|---|
Royalty Pharma PLC - Class A | 3.0% |
|---|
Element Solutions, Inc. | 2.9% |
|---|
Nasdaq, Inc. | 2.7% |
|---|
* Does not include cash/money market funds/equivalents. Based on percentage of net assets. Holdings can change at any time, are subject to risks discussed in the Fund’s prospectus, and should not be considered investment advice. |
| Material Fund Change [Text Block] |
No material changes occurred during the year ended June 30, 2026. |
| C000193766 |
|
| Shareholder Report [Line Items] |
|
| Fund Name |
Eventide Dividend Growth Fund
|
| Class Name |
Class I
|
| Trading Symbol |
ETIDX
|
| Annual or Semi-Annual Statement [Text Block] |
This annual shareholder report contains important information about Eventide Dividend Growth Fund for the period of July 1, 2025 to June 30, 2026.
|
| Additional Information [Text Block] |
You can find additional information about the Fund at https://www.eventidefunds.com. You can also request this information by contacting us at 1-877-771-3836.
|
| Additional Information Phone Number |
1-877-771-3836
|
| Additional Information Website |
https://www.eventidefunds.com
|
| Expenses [Text Block] |
What were the Fund’s costs for the last year?(based on a hypothetical $10,000 investment) Table SummaryClass Name | Costs of a $10,000 investment | Costs paid as a percentage of a $10,000 investment |
|---|
Class I | $106 | 0.95% |
|---|
|
| Expenses Paid, Amount |
$ 106
|
| Expense Ratio, Percent |
0.95%
|
| Factors Affecting Performance [Text Block] |
How did the Fund perform during the reporting period? The Fund underperformed the broad based benchmark for the year. The high-quality, dividend-focused style of the Fund did not keep up with the higher-beta constituents of the equal-weighted broad based benchmark during a very strong year for US equities from an absolute return perspective. An underweight to Healthcare and an overweight to Utilities was a drag on relative returns while an intentional underweight to Consumer Staples was a positive. From a stock selection standpoint, strength in Information Technology holdings was more than offset by weakness in Financials, Healthcare and Consumer Discretionary positions. Our focus remains on resilient growth, strong financials, idiosyncratic risk, and the overarching theme of human flourishing. Our experience underpins our confidence that these high-quality dividend growth companies will continue to serve their customers, stakeholders, and shareholders effectively. Visit https://www.eventidefunds.com for more recent performance information. |
| Line Graph [Table Text Block] |
Table Summary | Eventide Dividend Growth Fund | Bloomberg US Mid Cap Total Return Index | Bloomberg US 3000 Equal Weight Total Return Index |
|---|
Sep-2017 | $10,000 | $10,000 | $10,000 |
|---|
Jun-2018 | $9,832 | $10,897 | $11,146 |
|---|
Jun-2019 | $10,756 | $11,723 | $10,713 |
|---|
Jun-2020 | $11,487 | $11,654 | $10,166 |
|---|
Jun-2021 | $16,942 | $17,332 | $17,109 |
|---|
Jun-2022 | $14,787 | $14,753 | $12,770 |
|---|
Jun-2023 | $16,395 | $16,886 | $14,093 |
|---|
Jun-2024 | $19,952 | $18,980 | $15,045 |
|---|
Jun-2025 | $22,006 | $21,448 | $16,516 |
|---|
Jun-2026 | $27,114 | $25,785 | $22,734 |
|---|
|
| Average Annual Return [Table Text Block] |
Table Summary | 1 Year | 5 Years | Since Inception (9/29/2017) |
|---|
Eventide Dividend Growth Fund - Class I | 23.21% | 9.86% | 12.07% |
|---|
Bloomberg US Mid Cap Total Return Index
| 20.22% | 8.27% | 11.43% |
|---|
Bloomberg US 3000 Equal Weight Total Return Index | 37.65% | 5.85% | 9.84% |
|---|
|
| Performance Inception Date |
Sep. 29, 2017
|
| AssetsNet |
$ 1,425,327,971
|
| Holdings Count | Holding |
59
|
| Advisory Fees Paid, Amount |
$ 9,119,479
|
| InvestmentCompanyPortfolioTurnover |
42.00%
|
| Additional Fund Statistics [Text Block] |
- Net Assets$1,425,327,971
- Number of Portfolio Holdings59
- Advisory Fee (with fee recapture)$9,119,479
- Portfolio Turnover42%
|
| Holdings [Text Block] |
Industry Weighting (% of net assets)Table SummaryValue | Value |
|---|
Other Assets in Excess of Liabilities | 1.7% | Other Industries | 13.6% | Banking | 2.0% | Transportation & Logistics | 2.2% | Oil & Gas Services & Equipment | 2.8% | Biotech & Pharma | 3.0% | Commercial Support Services | 3.3% | Retail - Discretionary | 3.4% | Industrial Support Services | 3.6% | Medical Equipment & Devices | 3.9% | Chemicals | 4.0% | Institutional Financial Services | 4.3% | Industrial REITs | 5.0% | Technology Hardware | 6.8% | Electric Utilities | 8.0% | Oil & Gas Producers | 8.5% | Semiconductors | 11.1% | Electrical Equipment | 12.8% | Asset Weighting (% of total investments)Table SummaryValue | Value |
|---|
Common Stocks | 100.0% | Money Market Funds | 0.0% | |
| Largest Holdings [Text Block] |
Top 10 Holdings* (% of net assets)Table SummaryHolding Name | % of Net Assets |
|---|
Trane Technologies PLC | 4.9% |
|---|
nVent Electric PLC | 4.7% |
|---|
KLA Corporation | 4.4% |
|---|
Entergy Corporation | 3.6% |
|---|
Targa Resources Corporation | 3.5% |
|---|
GE Vernova, Inc. | 3.2% |
|---|
Dell Technologies, Inc. - Class C | 3.1% |
|---|
Royalty Pharma PLC - Class A | 3.0% |
|---|
Element Solutions, Inc. | 2.9% |
|---|
Nasdaq, Inc. | 2.7% |
|---|
* Does not include cash/money market funds/equivalents. Based on percentage of net assets. Holdings can change at any time, are subject to risks discussed in the Fund’s prospectus, and should not be considered investment advice. |
| Material Fund Change [Text Block] |
No material changes occurred during the year ended June 30, 2026. |
| C000193767 |
|
| Shareholder Report [Line Items] |
|
| Fund Name |
Eventide Dividend Growth Fund
|
| Class Name |
Class N
|
| Trading Symbol |
ETNDX
|
| Annual or Semi-Annual Statement [Text Block] |
This annual shareholder report contains important information about Eventide Dividend Growth Fund for the period of July 1, 2025 to June 30, 2026.
|
| Additional Information [Text Block] |
You can find additional information about the Fund at https://www.eventidefunds.com. You can also request this information by contacting us at 1-877-771-3836.
|
| Additional Information Phone Number |
1-877-771-3836
|
| Additional Information Website |
https://www.eventidefunds.com
|
| Expenses [Text Block] |
What were the Fund’s costs for the last year?(based on a hypothetical $10,000 investment) Table SummaryClass Name | Costs of a $10,000 investment | Costs paid as a percentage of a $10,000 investment |
|---|
Class N | $128 | 1.15% |
|---|
|
| Expenses Paid, Amount |
$ 128
|
| Expense Ratio, Percent |
1.15%
|
| Factors Affecting Performance [Text Block] |
How did the Fund perform during the reporting period? The Fund underperformed the broad based benchmark for the year. The high-quality, dividend-focused style of the Fund did not keep up with the higher-beta constituents of the equal-weighted broad based benchmark during a very strong year for US equities from an absolute return perspective. An underweight to Healthcare and an overweight to Utilities was a drag on relative returns while an intentional underweight to Consumer Staples was a positive. From a stock selection standpoint, strength in Information Technology holdings was more than offset by weakness in Financials, Healthcare and Consumer Discretionary positions. Our focus remains on resilient growth, strong financials, idiosyncratic risk, and the overarching theme of human flourishing. Our experience underpins our confidence that these high-quality dividend growth companies will continue to serve their customers, stakeholders, and shareholders effectively. Visit https://www.eventidefunds.com for more recent performance information. |
| Line Graph [Table Text Block] |
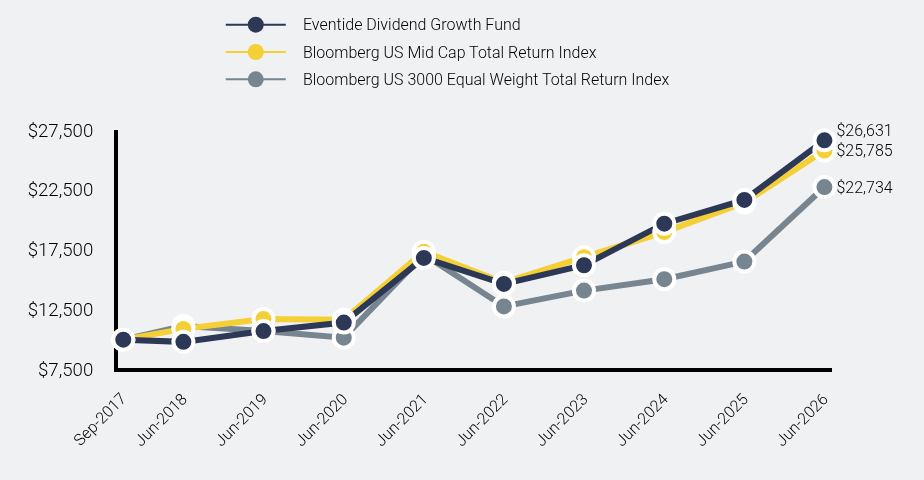
Table Summary | Eventide Dividend Growth Fund | Bloomberg US Mid Cap Total Return Index | Bloomberg US 3000 Equal Weight Total Return Index |
|---|
Sep-2017 | $10,000 | $10,000 | $10,000 |
|---|
Jun-2018 | $9,813 | $10,897 | $11,146 |
|---|
Jun-2019 | $10,716 | $11,723 | $10,713 |
|---|
Jun-2020 | $11,424 | $11,654 | $10,166 |
|---|
Jun-2021 | $16,817 | $17,332 | $17,109 |
|---|
Jun-2022 | $14,647 | $14,753 | $12,770 |
|---|
Jun-2023 | $16,209 | $16,886 | $14,093 |
|---|
Jun-2024 | $19,678 | $18,980 | $15,045 |
|---|
Jun-2025 | $21,662 | $21,448 | $16,516 |
|---|
Jun-2026 | $26,631 | $25,785 | $22,734 |
|---|
|
| Average Annual Return [Table Text Block] |
Table Summary | 1 Year | 5 Years | Since Inception (9/29/2017) |
|---|
Eventide Dividend Growth Fund - Class N | 22.94% | 9.63% | 11.84% |
|---|
Bloomberg US Mid Cap Total Return Index
| 20.22% | 8.27% | 11.43% |
|---|
Bloomberg US 3000 Equal Weight Total Return Index | 37.65% | 5.85% | 9.84% |
|---|
|
| Performance Inception Date |
Sep. 29, 2017
|
| AssetsNet |
$ 1,425,327,971
|
| Holdings Count | Holding |
59
|
| Advisory Fees Paid, Amount |
$ 9,119,479
|
| InvestmentCompanyPortfolioTurnover |
42.00%
|
| Additional Fund Statistics [Text Block] |
- Net Assets$1,425,327,971
- Number of Portfolio Holdings59
- Advisory Fee (with fee recapture)$9,119,479
- Portfolio Turnover42%
|
| Holdings [Text Block] |
Industry Weighting (% of net assets)Table SummaryValue | Value |
|---|
Other Assets in Excess of Liabilities | 1.7% | Other Industries | 13.6% | Banking | 2.0% | Transportation & Logistics | 2.2% | Oil & Gas Services & Equipment | 2.8% | Biotech & Pharma | 3.0% | Commercial Support Services | 3.3% | Retail - Discretionary | 3.4% | Industrial Support Services | 3.6% | Medical Equipment & Devices | 3.9% | Chemicals | 4.0% | Institutional Financial Services | 4.3% | Industrial REITs | 5.0% | Technology Hardware | 6.8% | Electric Utilities | 8.0% | Oil & Gas Producers | 8.5% | Semiconductors | 11.1% | Electrical Equipment | 12.8% | Asset Weighting (% of total investments)Table SummaryValue | Value |
|---|
Common Stocks | 100.0% | Money Market Funds | 0.0% | |
| Largest Holdings [Text Block] |
Top 10 Holdings* (% of net assets)Table SummaryHolding Name | % of Net Assets |
|---|
Trane Technologies PLC | 4.9% |
|---|
nVent Electric PLC | 4.7% |
|---|
KLA Corporation | 4.4% |
|---|
Entergy Corporation | 3.6% |
|---|
Targa Resources Corporation | 3.5% |
|---|
GE Vernova, Inc. | 3.2% |
|---|
Dell Technologies, Inc. - Class C | 3.1% |
|---|
Royalty Pharma PLC - Class A | 3.0% |
|---|
Element Solutions, Inc. | 2.9% |
|---|
Nasdaq, Inc. | 2.7% |
|---|
* Does not include cash/money market funds/equivalents. Based on percentage of net assets. Holdings can change at any time, are subject to risks discussed in the Fund’s prospectus, and should not be considered investment advice. |
| Material Fund Change [Text Block] |
No material changes occurred during the year ended June 30, 2026. |
| C000219892 |
|
| Shareholder Report [Line Items] |
|
| Fund Name |
Eventide Exponential Technologies Fund
|
| Class Name |
Class A
|
| Trading Symbol |
ETAEX
|
| Annual or Semi-Annual Statement [Text Block] |
This annual shareholder report contains important information about Eventide Exponential Technologies Fund for the period of July 1, 2025 to June 30, 2026.
|
| Additional Information [Text Block] |
You can find additional information about the Fund at https://www.eventidefunds.com. You can also request this information by contacting us at 1-877-771-3836.
|
| Material Fund Change Notice [Text Block] |
This report describes changes to the Fund that occurred during the reporting period.
|
| Additional Information Phone Number |
1-877-771-3836
|
| Additional Information Website |
https://www.eventidefunds.com
|
| Expenses [Text Block] |
What were the Fund’s costs for the last year?(based on a hypothetical $10,000 investment) Table SummaryClass Name | Costs of a $10,000 investment | Costs paid as a percentage of a $10,000 investment |
|---|
Class A | $192 | 1.61% |
|---|
|
| Expenses Paid, Amount |
$ 192
|
| Expense Ratio, Percent |
1.61%
|
| Performance Inception Date |
Jun. 30, 2020
|
| AssetsNet |
$ 105,759,930
|
| Holdings Count | Holding |
54
|
| Advisory Fees Paid, Amount |
$ 847,825
|
| InvestmentCompanyPortfolioTurnover |
125.00%
|
| C000219893 |
|
| Shareholder Report [Line Items] |
|
| Fund Name |
Eventide Exponential Technologies Fund
|
| Class Name |
Class C
|
| Trading Symbol |
ETCEX
|
| Annual or Semi-Annual Statement [Text Block] |
This annual shareholder report contains important information about Eventide Exponential Technologies Fund for the period of July 1, 2025 to June 30, 2026.
|
| Additional Information [Text Block] |
You can find additional information about the Fund at https://www.eventidefunds.com. You can also request this information by contacting us at 1-877-771-3836.
|
| Material Fund Change Notice [Text Block] |
This report describes changes to the Fund that occurred during the reporting period.
|
| Additional Information Phone Number |
1-877-771-3836
|
| Additional Information Website |
https://www.eventidefunds.com
|
| Expenses [Text Block] |
What were the Fund’s costs for the last year?(based on a hypothetical $10,000 investment) Table SummaryClass Name | Costs of a $10,000 investment | Costs paid as a percentage of a $10,000 investment |
|---|
Class C | $281 | 2.36% |
|---|
|
| Expenses Paid, Amount |
$ 281
|
| Expense Ratio, Percent |
2.36%
|
| Performance Inception Date |
Jun. 30, 2020
|
| AssetsNet |
$ 105,759,930
|
| Holdings Count | Holding |
54
|
| Advisory Fees Paid, Amount |
$ 847,825
|
| InvestmentCompanyPortfolioTurnover |
125.00%
|
| C000219894 |
|
| Shareholder Report [Line Items] |
|
| Fund Name |
Eventide Exponential Technologies Fund
|
| Class Name |
Class I
|
| Trading Symbol |
ETIEX
|
| Annual or Semi-Annual Statement [Text Block] |
This annual shareholder report contains important information about Eventide Exponential Technologies Fund for the period of July 1, 2025 to June 30, 2026.
|
| Additional Information [Text Block] |
You can find additional information about the Fund at https://www.eventidefunds.com. You can also request this information by contacting us at 1-877-771-3836.
|
| Material Fund Change Notice [Text Block] |
This report describes changes to the Fund that occurred during the reporting period.
|
| Additional Information Phone Number |
1-877-771-3836
|
| Additional Information Website |
https://www.eventidefunds.com
|
| Expenses [Text Block] |
What were the Fund’s costs for the last year?(based on a hypothetical $10,000 investment) Table SummaryClass Name | Costs of a $10,000 investment | Costs paid as a percentage of a $10,000 investment |
|---|
Class I | $163 | 1.36% |
|---|
|
| Expenses Paid, Amount |
$ 163
|
| Expense Ratio, Percent |
1.36%
|
| Performance Inception Date |
Jun. 30, 2020
|
| AssetsNet |
$ 105,759,930
|
| Holdings Count | Holding |
54
|
| Advisory Fees Paid, Amount |
$ 847,825
|
| InvestmentCompanyPortfolioTurnover |
125.00%
|
| C000219891 |
|
| Shareholder Report [Line Items] |
|
| Fund Name |
Eventide Exponential Technologies Fund
|
| Class Name |
Class N
|
| Trading Symbol |
ETNEX
|
| Annual or Semi-Annual Statement [Text Block] |
This annual shareholder report contains important information about Eventide Exponential Technologies Fund for the period of July 1, 2025 to June 30, 2026.
|
| Additional Information [Text Block] |
You can find additional information about the Fund at https://www.eventidefunds.com. You can also request this information by contacting us at 1-877-771-3836.
|
| Material Fund Change Notice [Text Block] |
This report describes changes to the Fund that occurred during the reporting period.
|
| Additional Information Phone Number |
1-877-771-3836
|
| Additional Information Website |
https://www.eventidefunds.com
|
| Expenses [Text Block] |
What were the Fund’s costs for the last year?(based on a hypothetical $10,000 investment) Table SummaryClass Name | Costs of a $10,000 investment | Costs paid as a percentage of a $10,000 investment |
|---|
Class N | $186 | 1.56% |
|---|
|
| Expenses Paid, Amount |
$ 186
|
| Expense Ratio, Percent |
1.56%
|
| Performance Inception Date |
Jun. 30, 2020
|
| AssetsNet |
$ 105,759,930
|
| Holdings Count | Holding |
54
|
| Advisory Fees Paid, Amount |
$ 847,825
|
| InvestmentCompanyPortfolioTurnover |
125.00%
|
| C000080457 |
|
| Shareholder Report [Line Items] |
|
| Fund Name |
Eventide Gilead Fund
|
| Class Name |
Class A
|
| Trading Symbol |
ETAGX
|
| Annual or Semi-Annual Statement [Text Block] |
This annual shareholder report contains important information about Eventide Gilead Fund for the period of July 1, 2025 to June 30, 2026.
|
| Additional Information [Text Block] |
You can find additional information about the Fund at https://www.eventidefunds.com. You can also request this information by contacting us at 1-877-771-3836.
|
| Additional Information Phone Number |
1-877-771-3836
|
| Additional Information Website |
https://www.eventidefunds.com
|
| Expenses [Text Block] |
What were the Fund’s costs for the last year?(based on a hypothetical $10,000 investment) Table SummaryClass Name | Costs of a $10,000 investment | Costs paid as a percentage of a $10,000 investment |
|---|
Class A | $169 | 1.41% |
|---|
|
| Expenses Paid, Amount |
$ 169
|
| Expense Ratio, Percent |
1.41%
|
| Factors Affecting Performance [Text Block] |
How did the Fund perform during the reporting period? The Fund outperformed the benchmark during the fiscal year. This outperformance was due to both allocation and selection. Industrials exposure, favoring domestic manufacturing and global power, and Healthcare, with an overweight in biotech, generated the most sector outperformance. Financials and Communication Services, with significant underweights in the Fund relative to the benchmark, were the sectors that contributed the most to underperformance. The Fund’s investment strategy remains anchored in the belief that companies with sustainable competitive advantages in attractive industries run by great management teams that focus on value creation for their stakeholders generate superior long-term risk-adjusted returns. Visit https://www.eventidefunds.com for more recent performance information. |
| Line Graph [Table Text Block] |
Table Summary | Eventide Gilead Fund - with load | Bloomberg US Mid Cap Growth Total Return Index | Bloomberg US 3000 Equal Weight Total Return Index |
|---|
Jun-2016 | $9,426 | $10,000 | $10,000 |
|---|
Jun-2017 | $12,082 | $11,502 | $12,472 |
|---|
Jun-2018 | $15,222 | $13,310 | $14,658 |
|---|
Jun-2019 | $17,713 | $14,972 | $14,088 |
|---|
Jun-2020 | $20,650 | $16,364 | $13,369 |
|---|
Jun-2021 | $30,848 | $23,619 | $22,500 |
|---|
Jun-2022 | $20,769 | $18,357 | $16,794 |
|---|
Jun-2023 | $24,036 | $21,567 | $18,534 |
|---|
Jun-2024 | $23,876 | $24,128 | $19,785 |
|---|
Jun-2025 | $27,113 | $28,084 | $21,720 |
|---|
Jun-2026 | $37,851 | $32,690 | $29,898 |
|---|
|
| Average Annual Return [Table Text Block] |
Table Summary | 1 Year | 5 Years | 10 Years |
|---|
Eventide Gilead Fund - Class A |
|---|
Without Load | 39.60% | 4.18% | 14.91% |
|---|
With Load | 31.58% | 2.95% | 14.24% |
|---|
Bloomberg US Mid Cap Growth Total Return Index
| 16.40% | 6.72% | 12.57% |
|---|
Bloomberg US 3000 Equal Weight Total Return Index | 37.65% | 5.85% | 11.57% |
|---|
|
| AssetsNet |
$ 3,438,647,827
|
| Holdings Count | Holding |
76
|
| Advisory Fees Paid, Amount |
$ 28,902,794
|
| InvestmentCompanyPortfolioTurnover |
16.00%
|
| Additional Fund Statistics [Text Block] |
Table SummaryNet Assets | $3,438,647,827 |
|---|
Number of Portfolio Holdings | 76 |
|---|
Advisory Fee | $28,902,794 |
|---|
Portfolio Turnover | 16% |
|---|
|
| Holdings [Text Block] |
Industry Weighting (% of net assets)Table SummaryValue | Value |
|---|
Other Assets in Excess of Liabilities | 4.9% | Other Industries | 6.5% | Oil & Gas Services & Equipment | 1.1% | Construction Materials | 1.4% | Technology Hardware | 1.8% | Retail - Discretionary | 2.0% | Electric Utilities | 2.1% | Oil & Gas Producers | 2.4% | Transportation & Logistics | 2.5% | Technology Services | 2.8% | Engineering & Construction | 3.2% | Industrial Support Services | 5.3% | Industrial Intermediate Prod | 5.9% | Software | 7.1% | Electrical Equipment | 9.1% | Medical Equipment & Devices | 11.4% | Biotech & Pharma | 12.4% | Semiconductors | 18.1% | Asset Weighting (% of total investments)Table SummaryValue | Value |
|---|
Common Stocks | 98.6% | Contingent Value Rights | 0.1% | Corporate Bonds | 1.1% | Money Market Funds | 0.2% | |
| Largest Holdings [Text Block] |
Top 10 Holdings* (% of net assets)Table SummaryHolding Name | % of Net Assets |
|---|
Lam Research Corporation | 6.5% |
|---|
Xometry, Inc. - Class A | 5.9% |
|---|
Guardant Health, Inc. | 5.5% |
|---|
ASML Holding N.V. | 3.8% |
|---|
Trane Technologies PLC | 2.7% |
|---|
Lattice Semiconductor Corporation | 2.6% |
|---|
United Rentals, Inc. | 2.6% |
|---|
Datadog, Inc. - Class A | 2.5% |
|---|
Generac Holdings, Inc. | 2.5% |
|---|
Old Dominion Freight Line, Inc. | 2.5% |
|---|
* Does not include cash/money market funds/equivalents. Based on percentage of net assets. Holdings can change at any time, are subject to risks discussed in the Fund’s prospectus, and should not be considered investment advice. |
| Material Fund Change [Text Block] |
No material changes occurred during the year ended June 30, 2026. |
| C000080458 |
|
| Shareholder Report [Line Items] |
|
| Fund Name |
Eventide Gilead Fund
|
| Class Name |
Class C
|
| Trading Symbol |
ETCGX
|
| Annual or Semi-Annual Statement [Text Block] |
This annual shareholder report contains important information about Eventide Gilead Fund for the period of July 1, 2025 to June 30, 2026.
|
| Additional Information [Text Block] |
You can find additional information about the Fund at https://www.eventidefunds.com. You can also request this information by contacting us at 1-877-771-3836.
|
| Additional Information Phone Number |
1-877-771-3836
|
| Additional Information Website |
https://www.eventidefunds.com
|
| Expenses [Text Block] |
What were the Fund’s costs for the last year?(based on a hypothetical $10,000 investment) Table SummaryClass Name | Costs of a $10,000 investment | Costs paid as a percentage of a $10,000 investment |
|---|
Class C | $258 | 2.16% |
|---|
|
| Expenses Paid, Amount |
$ 258
|
| Expense Ratio, Percent |
2.16%
|
| Factors Affecting Performance [Text Block] |
How did the Fund perform during the reporting period? The Fund outperformed the benchmark during the fiscal year. This outperformance was due to both allocation and selection. Industrials exposure, favoring domestic manufacturing and global power, and Healthcare, with an overweight in biotech, generated the most sector outperformance. Financials and Communication Services, with significant underweights in the Fund relative to the benchmark, were the sectors that contributed the most to underperformance. The Fund’s investment strategy remains anchored in the belief that companies with sustainable competitive advantages in attractive industries run by great management teams that focus on value creation for their stakeholders generate superior long-term risk-adjusted returns. Visit https://www.eventidefunds.com for more recent performance information. |
| Line Graph [Table Text Block] |
Table Summary | Eventide Gilead Fund | Bloomberg US Mid Cap Growth Total Return Index | Bloomberg US 3000 Equal Weight Total Return Index |
|---|
Jun-2016 | $10,000 | $10,000 | $10,000 |
|---|
Jun-2017 | $12,724 | $11,502 | $12,472 |
|---|
Jun-2018 | $15,910 | $13,310 | $14,658 |
|---|
Jun-2019 | $18,376 | $14,972 | $14,088 |
|---|
Jun-2020 | $21,263 | $16,364 | $13,369 |
|---|
Jun-2021 | $31,517 | $23,619 | $22,500 |
|---|
Jun-2022 | $21,051 | $18,357 | $16,794 |
|---|
Jun-2023 | $24,182 | $21,567 | $18,534 |
|---|
Jun-2024 | $23,845 | $24,128 | $19,785 |
|---|
Jun-2025 | $26,873 | $28,084 | $21,720 |
|---|
Jun-2026 | $37,232 | $32,690 | $29,898 |
|---|
|
| Average Annual Return [Table Text Block] |
Table Summary | 1 Year | 5 Years | 10 Years |
|---|
Eventide Gilead Fund - Class C | 38.55% | 3.39% | 14.05% |
|---|
Bloomberg US Mid Cap Growth Total Return Index
| 16.40% | 6.72% | 12.57% |
|---|
Bloomberg US 3000 Equal Weight Total Return Index | 37.65% | 5.85% | 11.57% |
|---|
|
| AssetsNet |
$ 3,438,647,827
|
| Holdings Count | Holding |
76
|
| Advisory Fees Paid, Amount |
$ 28,902,794
|
| InvestmentCompanyPortfolioTurnover |
16.00%
|
| Additional Fund Statistics [Text Block] |
Table SummaryNet Assets | $3,438,647,827 |
|---|
Number of Portfolio Holdings | 76 |
|---|
Advisory Fee | $28,902,794 |
|---|
Portfolio Turnover | 16% |
|---|
|
| Holdings [Text Block] |
Industry Weighting (% of net assets)Table SummaryValue | Value |
|---|
Other Assets in Excess of Liabilities | 4.9% | Other Industries | 6.5% | Oil & Gas Services & Equipment | 1.1% | Construction Materials | 1.4% | Technology Hardware | 1.8% | Retail - Discretionary | 2.0% | Electric Utilities | 2.1% | Oil & Gas Producers | 2.4% | Transportation & Logistics | 2.5% | Technology Services | 2.8% | Engineering & Construction | 3.2% | Industrial Support Services | 5.3% | Industrial Intermediate Prod | 5.9% | Software | 7.1% | Electrical Equipment | 9.1% | Medical Equipment & Devices | 11.4% | Biotech & Pharma | 12.4% | Semiconductors | 18.1% | Asset Weighting (% of total investments)Table SummaryValue | Value |
|---|
Common Stocks | 98.6% | Contingent Value Rights | 0.1% | Corporate Bonds | 1.1% | Money Market Funds | 0.2% | |
| Largest Holdings [Text Block] |
Top 10 Holdings* (% of net assets)Table SummaryHolding Name | % of Net Assets |
|---|
Lam Research Corporation | 6.5% |
|---|
Xometry, Inc. - Class A | 5.9% |
|---|
Guardant Health, Inc. | 5.5% |
|---|
ASML Holding N.V. | 3.8% |
|---|
Trane Technologies PLC | 2.7% |
|---|
Lattice Semiconductor Corporation | 2.6% |
|---|
United Rentals, Inc. | 2.6% |
|---|
Datadog, Inc. - Class A | 2.5% |
|---|
Generac Holdings, Inc. | 2.5% |
|---|
Old Dominion Freight Line, Inc. | 2.5% |
|---|
* Does not include cash/money market funds/equivalents. Based on percentage of net assets. Holdings can change at any time, are subject to risks discussed in the Fund’s prospectus, and should not be considered investment advice. |
| Material Fund Change [Text Block] |
No material changes occurred during the year ended June 30, 2026. |
| C000080459 |
|
| Shareholder Report [Line Items] |
|
| Fund Name |
Eventide Gilead Fund
|
| Class Name |
Class I
|
| Trading Symbol |
ETILX
|
| Annual or Semi-Annual Statement [Text Block] |
This annual shareholder report contains important information about Eventide Gilead Fund for the period of July 1, 2025 to June 30, 2026.
|
| Additional Information [Text Block] |
You can find additional information about the Fund at https://www.eventidefunds.com. You can also request this information by contacting us at 1-877-771-3836.
|
| Additional Information Phone Number |
1-877-771-3836
|
| Additional Information Website |
https://www.eventidefunds.com
|
| Expenses [Text Block] |
What were the Fund’s costs for the last year?(based on a hypothetical $10,000 investment) Table SummaryClass Name | Costs of a $10,000 investment | Costs paid as a percentage of a $10,000 investment |
|---|
Class I | $139 | 1.16% |
|---|
|
| Expenses Paid, Amount |
$ 139
|
| Expense Ratio, Percent |
1.16%
|
| Factors Affecting Performance [Text Block] |
How did the Fund perform during the reporting period? The Fund outperformed the benchmark during the fiscal year. This outperformance was due to both allocation and selection. Industrials exposure, favoring domestic manufacturing and global power, and Healthcare, with an overweight in biotech, generated the most sector outperformance. Financials and Communication Services, with significant underweights in the Fund relative to the benchmark, were the sectors that contributed the most to underperformance. The Fund’s investment strategy remains anchored in the belief that companies with sustainable competitive advantages in attractive industries run by great management teams that focus on value creation for their stakeholders generate superior long-term risk-adjusted returns. Visit https://www.eventidefunds.com for more recent performance information. |
| Line Graph [Table Text Block] |
Table Summary | Eventide Gilead Fund | Bloomberg US Mid Cap Growth Total Return Index | Bloomberg US 3000 Equal Weight Total Return Index |
|---|
Jun-2016 | $10,000 | $10,000 | $10,000 |
|---|
Jun-2017 | $12,850 | $11,502 | $12,472 |
|---|
Jun-2018 | $16,233 | $13,310 | $14,658 |
|---|
Jun-2019 | $18,938 | $14,972 | $14,088 |
|---|
Jun-2020 | $22,128 | $16,364 | $13,369 |
|---|
Jun-2021 | $33,138 | $23,619 | $22,500 |
|---|
Jun-2022 | $22,360 | $18,357 | $16,794 |
|---|
Jun-2023 | $25,938 | $21,567 | $18,534 |
|---|
Jun-2024 | $25,834 | $24,128 | $19,785 |
|---|
Jun-2025 | $29,409 | $28,084 | $21,720 |
|---|
Jun-2026 | $41,156 | $32,690 | $29,898 |
|---|
|
| Average Annual Return [Table Text Block] |
Table Summary | 1 Year | 5 Years | 10 Years |
|---|
Eventide Gilead Fund - Class I | 39.95% | 4.43% | 15.20% |
|---|
Bloomberg US Mid Cap Growth Total Return Index
| 16.40% | 6.72% | 12.57% |
|---|
Bloomberg US 3000 Equal Weight Total Return Index | 37.65% | 5.85% | 11.57% |
|---|
|
| AssetsNet |
$ 3,438,647,827
|
| Holdings Count | Holding |
76
|
| Advisory Fees Paid, Amount |
$ 28,902,794
|
| InvestmentCompanyPortfolioTurnover |
16.00%
|
| Additional Fund Statistics [Text Block] |
Table SummaryNet Assets | $3,438,647,827 |
|---|
Number of Portfolio Holdings | 76 |
|---|
Advisory Fee | $28,902,794 |
|---|
Portfolio Turnover | 16% |
|---|
|
| Holdings [Text Block] |
Industry Weighting (% of net assets)Table SummaryValue | Value |
|---|
Other Assets in Excess of Liabilities | 4.9% | Other Industries | 6.5% | Oil & Gas Services & Equipment | 1.1% | Construction Materials | 1.4% | Technology Hardware | 1.8% | Retail - Discretionary | 2.0% | Electric Utilities | 2.1% | Oil & Gas Producers | 2.4% | Transportation & Logistics | 2.5% | Technology Services | 2.8% | Engineering & Construction | 3.2% | Industrial Support Services | 5.3% | Industrial Intermediate Prod | 5.9% | Software | 7.1% | Electrical Equipment | 9.1% | Medical Equipment & Devices | 11.4% | Biotech & Pharma | 12.4% | Semiconductors | 18.1% | Asset Weighting (% of total investments)Table SummaryValue | Value |
|---|
Common Stocks | 98.6% | Contingent Value Rights | 0.1% | Corporate Bonds | 1.1% | Money Market Funds | 0.2% | |
| Largest Holdings [Text Block] |
Top 10 Holdings* (% of net assets)Table SummaryHolding Name | % of Net Assets |
|---|
Lam Research Corporation | 6.5% |
|---|
Xometry, Inc. - Class A | 5.9% |
|---|
Guardant Health, Inc. | 5.5% |
|---|
ASML Holding N.V. | 3.8% |
|---|
Trane Technologies PLC | 2.7% |
|---|
Lattice Semiconductor Corporation | 2.6% |
|---|
United Rentals, Inc. | 2.6% |
|---|
Datadog, Inc. - Class A | 2.5% |
|---|
Generac Holdings, Inc. | 2.5% |
|---|
Old Dominion Freight Line, Inc. | 2.5% |
|---|
* Does not include cash/money market funds/equivalents. Based on percentage of net assets. Holdings can change at any time, are subject to risks discussed in the Fund’s prospectus, and should not be considered investment advice. |
| Material Fund Change [Text Block] |
No material changes occurred during the year ended June 30, 2026. |
| C000065340 |
|
| Shareholder Report [Line Items] |
|
| Fund Name |
Eventide Gilead Fund
|
| Class Name |
Class N
|
| Trading Symbol |
ETGLX
|
| Annual or Semi-Annual Statement [Text Block] |
This annual shareholder report contains important information about Eventide Gilead Fund for the period of July 1, 2025 to June 30, 2026.
|
| Additional Information [Text Block] |
You can find additional information about the Fund at https://www.eventidefunds.com. You can also request this information by contacting us at 1-877-771-3836.
|
| Additional Information Phone Number |
1-877-771-3836
|
| Additional Information Website |
https://www.eventidefunds.com
|
| Expenses [Text Block] |
What were the Fund’s costs for the last year?(based on a hypothetical $10,000 investment) Table SummaryClass Name | Costs of a $10,000 investment | Costs paid as a percentage of a $10,000 investment |
|---|
Class N | $163 | 1.36% |
|---|
|
| Expenses Paid, Amount |
$ 163
|
| Expense Ratio, Percent |
1.36%
|
| Factors Affecting Performance [Text Block] |
How did the Fund perform during the reporting period? The Fund outperformed the benchmark during the fiscal year. This outperformance was due to both allocation and selection. Industrials exposure, favoring domestic manufacturing and global power, and Healthcare, with an overweight in biotech, generated the most sector outperformance. Financials and Communication Services, with significant underweights in the Fund relative to the benchmark, were the sectors that contributed the most to underperformance. The Fund’s investment strategy remains anchored in the belief that companies with sustainable competitive advantages in attractive industries run by great management teams that focus on value creation for their stakeholders generate superior long-term risk-adjusted returns. Visit https://www.eventidefunds.com for more recent performance information. |
| Line Graph [Table Text Block] |
Table Summary | Eventide Gilead Fund | Bloomberg US Mid Cap Growth Total Return Index | Bloomberg US 3000 Equal Weight Total Return Index |
|---|
Jun-2016 | $10,000 | $10,000 | $10,000 |
|---|
Jun-2017 | $12,827 | $11,502 | $12,472 |
|---|
Jun-2018 | $16,168 | $13,310 | $14,658 |
|---|
Jun-2019 | $18,820 | $14,972 | $14,088 |
|---|
Jun-2020 | $21,955 | $16,364 | $13,369 |
|---|
Jun-2021 | $32,807 | $23,619 | $22,500 |
|---|
Jun-2022 | $22,095 | $18,357 | $16,794 |
|---|
Jun-2023 | $25,580 | $21,567 | $18,534 |
|---|
Jun-2024 | $25,421 | $24,128 | $19,785 |
|---|
Jun-2025 | $28,886 | $28,084 | $21,720 |
|---|
Jun-2026 | $40,342 | $32,690 | $29,898 |
|---|
|
| Average Annual Return [Table Text Block] |
Table Summary | 1 Year | 5 Years | 10 Years |
|---|
Eventide Gilead Fund - Class N | 39.66% | 4.22% | 14.97% |
|---|
Bloomberg US Mid Cap Growth Total Return Index
| 16.40% | 6.72% | 12.57% |
|---|
Bloomberg US 3000 Equal Weight Total Return Index | 37.65% | 5.85% | 11.57% |
|---|
|
| AssetsNet |
$ 3,438,647,827
|
| Holdings Count | Holding |
76
|
| Advisory Fees Paid, Amount |
$ 28,902,794
|
| InvestmentCompanyPortfolioTurnover |
16.00%
|
| Additional Fund Statistics [Text Block] |
Table SummaryNet Assets | $3,438,647,827 |
|---|
Number of Portfolio Holdings | 76 |
|---|
Advisory Fee | $28,902,794 |
|---|
Portfolio Turnover | 16% |
|---|
|
| Holdings [Text Block] |
Industry Weighting (% of net assets)Table SummaryValue | Value |
|---|
Other Assets in Excess of Liabilities | 4.9% | Other Industries | 6.5% | Oil & Gas Services & Equipment | 1.1% | Construction Materials | 1.4% | Technology Hardware | 1.8% | Retail - Discretionary | 2.0% | Electric Utilities | 2.1% | Oil & Gas Producers | 2.4% | Transportation & Logistics | 2.5% | Technology Services | 2.8% | Engineering & Construction | 3.2% | Industrial Support Services | 5.3% | Industrial Intermediate Prod | 5.9% | Software | 7.1% | Electrical Equipment | 9.1% | Medical Equipment & Devices | 11.4% | Biotech & Pharma | 12.4% | Semiconductors | 18.1% | Asset Weighting (% of total investments)Table SummaryValue | Value |
|---|
Common Stocks | 98.6% | Contingent Value Rights | 0.1% | Corporate Bonds | 1.1% | Money Market Funds | 0.2% | |
| Largest Holdings [Text Block] |
Top 10 Holdings* (% of net assets)Table SummaryHolding Name | % of Net Assets |
|---|
Lam Research Corporation | 6.5% |
|---|
Xometry, Inc. - Class A | 5.9% |
|---|
Guardant Health, Inc. | 5.5% |
|---|
ASML Holding N.V. | 3.8% |
|---|
Trane Technologies PLC | 2.7% |
|---|
Lattice Semiconductor Corporation | 2.6% |
|---|
United Rentals, Inc. | 2.6% |
|---|
Datadog, Inc. - Class A | 2.5% |
|---|
Generac Holdings, Inc. | 2.5% |
|---|
Old Dominion Freight Line, Inc. | 2.5% |
|---|
* Does not include cash/money market funds/equivalents. Based on percentage of net assets. Holdings can change at any time, are subject to risks discussed in the Fund’s prospectus, and should not be considered investment advice. |
| Material Fund Change [Text Block] |
No material changes occurred during the year ended June 30, 2026. |
| C000121707 |
|
| Shareholder Report [Line Items] |
|
| Fund Name |
Eventide Healthcare & Life Sciences Fund
|
| Class Name |
Class A
|
| Trading Symbol |
ETAHX
|
| Annual or Semi-Annual Statement [Text Block] |
This annual shareholder report contains important information about Eventide Healthcare & Life Sciences Fund for the period of July 1, 2025 to June 30, 2026.
|
| Additional Information [Text Block] |
You can find additional information about the Fund at https://www.eventidefunds.com. You can also request this information by contacting us at 1-877-771-3836.
|
| Additional Information Phone Number |
1-877-771-3836
|
| Additional Information Website |
https://www.eventidefunds.com
|
| Expenses [Text Block] |
What were the Fund’s costs for the last year?(based on a hypothetical $10,000 investment) Table SummaryClass Name | Costs of a $10,000 investment | Costs paid as a percentage of a $10,000 investment |
|---|
Class A | $209 | 1.54% |
|---|
|
| Expenses Paid, Amount |
$ 209
|
| Expense Ratio, Percent |
1.54%
|
| Factors Affecting Performance [Text Block] |
How did the Fund perform during the reporting period? During the fiscal year, the Fund significantly outperformed the broader market. This was largely due to the outperformance of the biotech industry. After several years of struggling, biotech drew significant investor interest because of its high innovation, attractiveness as a source of M&A targets, favorable regulatory dynamics, and a differentiated correlation profile. The Fund has remained overweight the medtech and diagnostic subsectors, as well as in biotech companies in later development and commercial stages. We believe the Fund is strategically aligned to leverage the innovation in healthcare to address important unmet needs. Visit https://www.eventidefunds.com for more recent performance information. |
| Line Graph [Table Text Block] |
Table Summary | Eventide Healthcare & Life Sciences Fund - with load | S&P Biotechnology Select Industry Index | Bloomberg US 3000 Equal Weight Total Return Index |
|---|
Jun-2016 | $9,424 | $10,000 | $10,000 |
|---|
Jun-2017 | $11,789 | $14,299 | $12,472 |
|---|
Jun-2018 | $17,545 | $17,676 | $14,658 |
|---|
Jun-2019 | $19,409 | $16,320 | $14,088 |
|---|
Jun-2020 | $24,196 | $20,841 | $13,369 |
|---|
Jun-2021 | $26,683 | $25,257 | $22,500 |
|---|
Jun-2022 | $17,111 | $13,856 | $16,794 |
|---|
Jun-2023 | $23,736 | $15,537 | $18,534 |
|---|
Jun-2024 | $21,415 | $17,391 | $19,785 |
|---|
Jun-2025 | $21,344 | $15,589 | $21,720 |
|---|
Jun-2026 | $36,563 | $29,931 | $29,898 |
|---|
|
| Average Annual Return [Table Text Block] |
Table Summary | 1 Year | 5 Years | 10 Years |
|---|
Eventide Healthcare & Life Sciences Fund - Class A |
|---|
Without Load | 71.30% | 6.50% | 14.52% |
|---|
With Load | 61.45% | 5.25% | 13.84% |
|---|
S&P Biotechnology Select Industry Index
| 92.00% | 3.45% | 11.59% |
|---|
Bloomberg US 3000 Equal Weight Total Return Index | 37.65% | 5.85% | 11.57% |
|---|
|
| AssetsNet |
$ 1,789,380,256
|
| Holdings Count | Holding |
90
|
| Advisory Fees Paid, Amount |
$ 16,626,771
|
| InvestmentCompanyPortfolioTurnover |
87.00%
|
| Additional Fund Statistics [Text Block] |
Table SummaryNet Assets | $1,789,380,256 |
|---|
Number of Portfolio Holdings | 90 |
|---|
Advisory Fee | $16,626,771 |
|---|
Portfolio Turnover | 87% |
|---|
|
| Holdings [Text Block] |
Industry Weighting (% of net assets)Table SummaryValue | Value |
|---|
Other Assets in Excess of Liabilities | 3.1% | Health Care Facilities & Services | 0.8% | Money Market Funds | 1.1% | Software | 2.0% | Medical Equipment & Devices | 14.8% | Biotech & Pharma | 78.2% | Asset Weighting (% of total investments)Table SummaryValue | Value |
|---|
Common Stocks | 97.0% | Contingent Value Rights | 0.4% | Convertible Bonds | 0.0% | Money Market Funds | 1.1% | Private Investments | 1.3% | Warrant | 0.2% | |
| Largest Holdings [Text Block] |
Top 10 Holdings* (% of net assets)Table SummaryHolding Name | % of Net Assets |
|---|
Guardant Health, Inc. | 5.4% |
|---|
Mirum Pharmaceuticals, Inc. | 3.5% |
|---|
Kymera Therapeutics, Inc. | 3.2% |
|---|
Abivax S.A. - ADR | 2.9% |
|---|
BeLite Bio Inc | 2.8% |
|---|
Trevi Therapeutics, Inc. | 2.8% |
|---|
MBX Biosciences, Inc. | 2.7% |
|---|
Vaxcyte, Inc. | 2.7% |
|---|
Cytokinetics, Inc. | 2.7% |
|---|
Argenx S.E. - ADR | 2.6% |
|---|
* Does not include cash/money market funds/equivalents. Based on percentage of net assets. Holdings can change at any time, are subject to risks discussed in the Fund’s prospectus, and should not be considered investment advice. |
| Material Fund Change [Text Block] |
No material changes occurred during the year ended June 30, 2026. |
| C000121708 |
|
| Shareholder Report [Line Items] |
|
| Fund Name |
Eventide Healthcare & Life Sciences Fund
|
| Class Name |
Class C
|
| Trading Symbol |
ETCHX
|
| Annual or Semi-Annual Statement [Text Block] |
This annual shareholder report contains important information about Eventide Healthcare & Life Sciences Fund for the period of July 1, 2025 to June 30, 2026.
|
| Additional Information [Text Block] |
You can find additional information about the Fund at https://www.eventidefunds.com. You can also request this information by contacting us at 1-877-771-3836.
|
| Additional Information Phone Number |
1-877-771-3836
|
| Additional Information Website |
https://www.eventidefunds.com
|
| Expenses [Text Block] |
What were the Fund’s costs for the last year?(based on a hypothetical $10,000 investment) Table SummaryClass Name | Costs of a $10,000 investment | Costs paid as a percentage of a $10,000 investment |
|---|
Class C | $309 | 2.29% |
|---|
|
| Expenses Paid, Amount |
$ 309
|
| Expense Ratio, Percent |
2.29%
|
| Factors Affecting Performance [Text Block] |
How did the Fund perform during the reporting period? During the fiscal year, the Fund significantly outperformed the broader market. This was largely due to the outperformance of the biotech industry. After several years of struggling, biotech drew significant investor interest because of its high innovation, attractiveness as a source of M&A targets, favorable regulatory dynamics, and a differentiated correlation profile. The Fund has remained overweight the medtech and diagnostic subsectors, as well as in biotech companies in later development and commercial stages. We believe the Fund is strategically aligned to leverage the innovation in healthcare to address important unmet needs. Visit https://www.eventidefunds.com for more recent performance information. |
| Line Graph [Table Text Block] |
Table Summary | Eventide Healthcare & Life Sciences Fund | S&P Biotechnology Select Industry Index | Bloomberg US 3000 Equal Weight Total Return Index |
|---|
Jun-2016 | $10,000 | $10,000 | $10,000 |
|---|
Jun-2017 | $12,415 | $14,299 | $12,472 |
|---|
Jun-2018 | $18,334 | $17,676 | $14,658 |
|---|
Jun-2019 | $20,137 | $16,320 | $14,088 |
|---|
Jun-2020 | $24,916 | $20,841 | $13,369 |
|---|
Jun-2021 | $27,270 | $25,257 | $22,500 |
|---|
Jun-2022 | $17,349 | $13,856 | $16,794 |
|---|
Jun-2023 | $23,892 | $15,537 | $18,534 |
|---|
Jun-2024 | $21,398 | $17,391 | $19,785 |
|---|
Jun-2025 | $21,164 | $15,589 | $21,720 |
|---|
Jun-2026 | $35,983 | $29,931 | $29,898 |
|---|
|
| Average Annual Return [Table Text Block] |
Table Summary | 1 Year | 5 Years | 10 Years |
|---|
Eventide Healthcare & Life Sciences Fund - Class C | 70.02% | 5.70% | 13.66% |
|---|
S&P Biotechnology Select Industry Index
| 92.00% | 3.45% | 11.59% |
|---|
Bloomberg US 3000 Equal Weight Total Return Index | 37.65% | 5.85% | 11.57% |
|---|
|
| AssetsNet |
$ 1,789,380,256
|
| Holdings Count | Holding |
90
|
| Advisory Fees Paid, Amount |
$ 16,626,771
|
| InvestmentCompanyPortfolioTurnover |
87.00%
|
| Additional Fund Statistics [Text Block] |
Table SummaryNet Assets | $1,789,380,256 |
|---|
Number of Portfolio Holdings | 90 |
|---|
Advisory Fee | $16,626,771 |
|---|
Portfolio Turnover | 87% |
|---|
|
| Holdings [Text Block] |
Industry Weighting (% of net assets)Table SummaryValue | Value |
|---|
Other Assets in Excess of Liabilities | 3.1% | Health Care Facilities & Services | 0.8% | Money Market Funds | 1.1% | Software | 2.0% | Medical Equipment & Devices | 14.8% | Biotech & Pharma | 78.2% | Asset Weighting (% of total investments)Table SummaryValue | Value |
|---|
Common Stocks | 97.0% | Contingent Value Rights | 0.4% | Convertible Bonds | 0.0% | Money Market Funds | 1.1% | Private Investments | 1.3% | Warrant | 0.2% | |
| Largest Holdings [Text Block] |
Top 10 Holdings* (% of net assets)Table SummaryHolding Name | % of Net Assets |
|---|
Guardant Health, Inc. | 5.4% |
|---|
Mirum Pharmaceuticals, Inc. | 3.5% |
|---|
Kymera Therapeutics, Inc. | 3.2% |
|---|
Abivax S.A. - ADR | 2.9% |
|---|
BeLite Bio Inc | 2.8% |
|---|
Trevi Therapeutics, Inc. | 2.8% |
|---|
MBX Biosciences, Inc. | 2.7% |
|---|
Vaxcyte, Inc. | 2.7% |
|---|
Cytokinetics, Inc. | 2.7% |
|---|
Argenx S.E. - ADR | 2.6% |
|---|
* Does not include cash/money market funds/equivalents. Based on percentage of net assets. Holdings can change at any time, are subject to risks discussed in the Fund’s prospectus, and should not be considered investment advice. |
| Material Fund Change [Text Block] |
No material changes occurred during the year ended June 30, 2026. |
| C000121710 |
|
| Shareholder Report [Line Items] |
|
| Fund Name |
Eventide Healthcare & Life Sciences Fund
|
| Class Name |
Class I
|
| Trading Symbol |
ETIHX
|
| Annual or Semi-Annual Statement [Text Block] |
This annual shareholder report contains important information about Eventide Healthcare & Life Sciences Fund for the period of July 1, 2025 to June 30, 2026.
|
| Additional Information [Text Block] |
You can find additional information about the Fund at https://www.eventidefunds.com. You can also request this information by contacting us at 1-877-771-3836.
|
| Additional Information Phone Number |
1-877-771-3836
|
| Additional Information Website |
https://www.eventidefunds.com
|
| Expenses [Text Block] |
What were the Fund’s costs for the last year?(based on a hypothetical $10,000 investment) Table SummaryClass Name | Costs of a $10,000 investment | Costs paid as a percentage of a $10,000 investment |
|---|
Class I | $175 | 1.29% |
|---|
|
| Expenses Paid, Amount |
$ 175
|
| Expense Ratio, Percent |
1.29%
|
| Factors Affecting Performance [Text Block] |
How did the Fund perform during the reporting period? During the fiscal year, the Fund significantly outperformed the broader market. This was largely due to the outperformance of the biotech industry. After several years of struggling, biotech drew significant investor interest because of its high innovation, attractiveness as a source of M&A targets, favorable regulatory dynamics, and a differentiated correlation profile. The Fund has remained overweight the medtech and diagnostic subsectors, as well as in biotech companies in later development and commercial stages. We believe the Fund is strategically aligned to leverage the innovation in healthcare to address important unmet needs. Visit https://www.eventidefunds.com for more recent performance information. |
| Line Graph [Table Text Block] |
Table Summary | Eventide Healthcare & Life Sciences Fund | S&P Biotechnology Select Industry Index | Bloomberg US 3000 Equal Weight Total Return Index |
|---|
Jun-2016 | $10,000 | $10,000 | $10,000 |
|---|
Jun-2017 | $12,540 | $14,299 | $12,472 |
|---|
Jun-2018 | $18,760 | $17,676 | $14,658 |
|---|
Jun-2019 | $20,772 | $16,320 | $14,088 |
|---|
Jun-2020 | $25,960 | $20,841 | $13,369 |
|---|
Jun-2021 | $28,697 | $25,257 | $22,500 |
|---|
Jun-2022 | $18,442 | $13,856 | $16,794 |
|---|
Jun-2023 | $25,656 | $15,537 | $18,534 |
|---|
Jun-2024 | $23,199 | $17,391 | $19,785 |
|---|
Jun-2025 | $23,179 | $15,589 | $21,720 |
|---|
Jun-2026 | $39,811 | $29,931 | $29,898 |
|---|
|
| Average Annual Return [Table Text Block] |
Table Summary | 1 Year | 5 Years | 10 Years |
|---|
Eventide Healthcare & Life Sciences Fund - Class I | 71.76% | 6.77% | 14.82% |
|---|
S&P Biotechnology Select Industry Index
| 92.00% | 3.45% | 11.59% |
|---|
Bloomberg US 3000 Equal Weight Total Return Index | 37.65% | 5.85% | 11.57% |
|---|
|
| AssetsNet |
$ 1,789,380,256
|
| Holdings Count | Holding |
90
|
| Advisory Fees Paid, Amount |
$ 16,626,771
|
| InvestmentCompanyPortfolioTurnover |
87.00%
|
| Additional Fund Statistics [Text Block] |
Table SummaryNet Assets | $1,789,380,256 |
|---|
Number of Portfolio Holdings | 90 |
|---|
Advisory Fee | $16,626,771 |
|---|
Portfolio Turnover | 87% |
|---|
|
| Holdings [Text Block] |
Industry Weighting (% of net assets)Table SummaryValue | Value |
|---|
Other Assets in Excess of Liabilities | 3.1% | Health Care Facilities & Services | 0.8% | Money Market Funds | 1.1% | Software | 2.0% | Medical Equipment & Devices | 14.8% | Biotech & Pharma | 78.2% | Asset Weighting (% of total investments)Table SummaryValue | Value |
|---|
Common Stocks | 97.0% | Contingent Value Rights | 0.4% | Convertible Bonds | 0.0% | Money Market Funds | 1.1% | Private Investments | 1.3% | Warrant | 0.2% | |
| Largest Holdings [Text Block] |
Top 10 Holdings* (% of net assets)Table SummaryHolding Name | % of Net Assets |
|---|
Guardant Health, Inc. | 5.4% |
|---|
Mirum Pharmaceuticals, Inc. | 3.5% |
|---|
Kymera Therapeutics, Inc. | 3.2% |
|---|
Abivax S.A. - ADR | 2.9% |
|---|
BeLite Bio Inc | 2.8% |
|---|
Trevi Therapeutics, Inc. | 2.8% |
|---|
MBX Biosciences, Inc. | 2.7% |
|---|
Vaxcyte, Inc. | 2.7% |
|---|
Cytokinetics, Inc. | 2.7% |
|---|
Argenx S.E. - ADR | 2.6% |
|---|
* Does not include cash/money market funds/equivalents. Based on percentage of net assets. Holdings can change at any time, are subject to risks discussed in the Fund’s prospectus, and should not be considered investment advice. |
| Material Fund Change [Text Block] |
No material changes occurred during the year ended June 30, 2026. |
| C000121709 |
|
| Shareholder Report [Line Items] |
|
| Fund Name |
Eventide Healthcare & Life Sciences Fund
|
| Class Name |
Class N
|
| Trading Symbol |
ETNHX
|
| Annual or Semi-Annual Statement [Text Block] |
This annual shareholder report contains important information about Eventide Healthcare & Life Sciences Fund for the period of July 1, 2025 to June 30, 2026.
|
| Additional Information [Text Block] |
You can find additional information about the Fund at https://www.eventidefunds.com. You can also request this information by contacting us at 1-877-771-3836.
|
| Additional Information Phone Number |
1-877-771-3836
|
| Additional Information Website |
https://www.eventidefunds.com
|
| Expenses [Text Block] |
What were the Fund’s costs for the last year?(based on a hypothetical $10,000 investment) Table SummaryClass Name | Costs of a $10,000 investment | Costs paid as a percentage of a $10,000 investment |
|---|
Class N | $202 | 1.49% |
|---|
|
| Expenses Paid, Amount |
$ 202
|
| Expense Ratio, Percent |
1.49%
|
| Factors Affecting Performance [Text Block] |
How did the Fund perform during the reporting period? During the fiscal year, the Fund significantly outperformed the broader market. This was largely due to the outperformance of the biotech industry. After several years of struggling, biotech drew significant investor interest because of its high innovation, attractiveness as a source of M&A targets, favorable regulatory dynamics, and a differentiated correlation profile. The Fund has remained overweight the medtech and diagnostic subsectors, as well as in biotech companies in later development and commercial stages. We believe the Fund is strategically aligned to leverage the innovation in healthcare to address important unmet needs. Visit https://www.eventidefunds.com for more recent performance information. |
| Line Graph [Table Text Block] |
Table Summary | Eventide Healthcare & Life Sciences Fund | S&P Biotechnology Select Industry Index | Bloomberg US 3000 Equal Weight Total Return Index |
|---|
Jun-2016 | $10,000 | $10,000 | $10,000 |
|---|
Jun-2017 | $12,519 | $14,299 | $12,472 |
|---|
Jun-2018 | $18,687 | $17,676 | $14,658 |
|---|
Jun-2019 | $20,652 | $16,320 | $14,088 |
|---|
Jun-2020 | $25,749 | $20,841 | $13,369 |
|---|
Jun-2021 | $28,411 | $25,257 | $22,500 |
|---|
Jun-2022 | $18,226 | $13,856 | $16,794 |
|---|
Jun-2023 | $25,302 | $15,537 | $18,534 |
|---|
Jun-2024 | $22,833 | $17,391 | $19,785 |
|---|
Jun-2025 | $22,772 | $15,589 | $21,720 |
|---|
Jun-2026 | $39,023 | $29,931 | $29,898 |
|---|
|
| Average Annual Return [Table Text Block] |
Table Summary | 1 Year | 5 Years | 10 Years |
|---|
Eventide Healthcare & Life Sciences Fund - Class N | 71.36% | 6.55% | 14.59% |
|---|
S&P Biotechnology Select Industry Index
| 92.00% | 3.45% | 11.59% |
|---|
Bloomberg US 3000 Equal Weight Total Return Index | 37.65% | 5.85% | 11.57% |
|---|
|
| AssetsNet |
$ 1,789,380,256
|
| Holdings Count | Holding |
90
|
| Advisory Fees Paid, Amount |
$ 16,626,771
|
| InvestmentCompanyPortfolioTurnover |
87.00%
|
| Additional Fund Statistics [Text Block] |
Table SummaryNet Assets | $1,789,380,256 |
|---|
Number of Portfolio Holdings | 90 |
|---|
Advisory Fee | $16,626,771 |
|---|
Portfolio Turnover | 87% |
|---|
|
| Holdings [Text Block] |
Industry Weighting (% of net assets)Table SummaryValue | Value |
|---|
Other Assets in Excess of Liabilities | 3.1% | Health Care Facilities & Services | 0.8% | Money Market Funds | 1.1% | Software | 2.0% | Medical Equipment & Devices | 14.8% | Biotech & Pharma | 78.2% | Asset Weighting (% of total investments)Table SummaryValue | Value |
|---|
Common Stocks | 97.0% | Contingent Value Rights | 0.4% | Convertible Bonds | 0.0% | Money Market Funds | 1.1% | Private Investments | 1.3% | Warrant | 0.2% | |
| Largest Holdings [Text Block] |
Top 10 Holdings* (% of net assets)Table SummaryHolding Name | % of Net Assets |
|---|
Guardant Health, Inc. | 5.4% |
|---|
Mirum Pharmaceuticals, Inc. | 3.5% |
|---|
Kymera Therapeutics, Inc. | 3.2% |
|---|
Abivax S.A. - ADR | 2.9% |
|---|
BeLite Bio Inc | 2.8% |
|---|
Trevi Therapeutics, Inc. | 2.8% |
|---|
MBX Biosciences, Inc. | 2.7% |
|---|
Vaxcyte, Inc. | 2.7% |
|---|
Cytokinetics, Inc. | 2.7% |
|---|
Argenx S.E. - ADR | 2.6% |
|---|
* Does not include cash/money market funds/equivalents. Based on percentage of net assets. Holdings can change at any time, are subject to risks discussed in the Fund’s prospectus, and should not be considered investment advice. |
| Material Fund Change [Text Block] |
No material changes occurred during the year ended June 30, 2026. |
| C000236480 |
|
| Shareholder Report [Line Items] |
|
| Fund Name |
Eventide Large Cap Focus Fund
|
| Class Name |
Class A
|
| Trading Symbol |
ETLAX
|
| Annual or Semi-Annual Statement [Text Block] |
This annual shareholder report contains important information about Eventide Large Cap Focus Fund for the period of July 1, 2025 to June 30, 2026.
|
| Additional Information [Text Block] |
You can find additional information about the Fund at https://www.eventidefunds.com. You can also request this information by contacting us at 1-877-771-3836.
|
| Additional Information Phone Number |
1-877-771-3836
|
| Additional Information Website |
https://www.eventidefunds.com
|
| Expenses [Text Block] |
What were the Fund’s costs for the last year?(based on a hypothetical $10,000 investment) Table SummaryClass Name | Costs of a $10,000 investment | Costs paid as a percentage of a $10,000 investment |
|---|
Class A | $130 | 1.19% |
|---|
|
| Expenses Paid, Amount |
$ 130
|
| Expense Ratio, Percent |
1.19%
|
| Line Graph [Table Text Block] |
Table Summary | Eventide Large Cap Focus Fund - with load | S&P 500® Index |
|---|
Jun-2022 | $9,425 | $10,000 |
|---|
Jun-2023 | $10,769 | $11,959 |
|---|
Jun-2024 | $13,183 | $14,896 |
|---|
Jun-2025 | $14,768 | $17,155 |
|---|
Jun-2026 | $17,383 | $20,985 |
|---|
|
| Average Annual Return [Table Text Block] |
Table Summary | 1 Year | Since Inception (6/30/2022) |
|---|
Eventide Large Cap Focus Fund - Class A |
|---|
Without Load | 17.71% | 16.54% |
|---|
With Load | 10.96% | 14.82% |
|---|
S&P 500® Index
| 22.32% | 20.36% |
|---|
|
| Performance Inception Date |
Jun. 30, 2022
|
| Material Change Description [Text Block] |
How did the Fund perform during the reporting period? The Fund’s underperformance in Financials, Materials, Utilities, Information Technology, and Healthcare was partly offset by outperformance in Industrials, Consumer Staples, and Real Estate. The Fund outperformed in the first half of calendar 2026 due to strong stock selection, particularly within Industrials and Information Technology. We remain focused on the Fund owning companies that create significant value for their stakeholders, while also trading at attractive valuations. Visit https://www.eventidefunds.com for more recent performance information. |
| AssetsNet |
$ 204,740,418
|
| Holdings Count | Holding |
51
|
| Advisory Fees Paid, Amount |
$ 974,701
|
| InvestmentCompanyPortfolioTurnover |
30.00%
|
| Additional Fund Statistics [Text Block] |
Table SummaryNet Assets | $204,740,418 |
|---|
Number of Portfolio Holdings | 51 |
|---|
Advisory Fee (net of waivers) | $974,701 |
|---|
Portfolio Turnover | 30% |
|---|
|
| Holdings [Text Block] |
Industry Weighting (% of net assets)Table SummaryValue | Value |
|---|
Other Assets in Excess of Liabilities | 2.9% | Other Industries | 3.0% | Institutional Financial Services | 1.2% | Technology Services | 1.5% | Banking | 1.6% | Oil & Gas Producers | 2.4% | Industrial Support Services | 2.5% | Transportation & Logistics | 3.0% | Specialty Finance | 3.3% | Medical Equipment & Devices | 3.9% | Chemicals | 5.2% | Software | 5.6% | Retail - Discretionary | 6.5% | Biotech & Pharma | 6.6% | Electric Utilities | 7.5% | Technology Hardware | 7.6% | Electrical Equipment | 10.4% | Semiconductors | 25.3% | Table SummaryValue | Value |
|---|
Large Cap | 70.8% | Mid Cap | 26.2% | Cash/Other | 3.0% | Small Cap | 0.0% | |
| Largest Holdings [Text Block] |
Top 10 Holdings* (% of net assets)Table SummaryHolding Name | % of Net Assets |
|---|
NVIDIA Corporation | 6.3% |
|---|
GE Vernova, Inc. | 6.0% |
|---|
Broadcom, Inc. | 4.8% |
|---|
Trane Technologies PLC | 4.4% |
|---|
Linde PLC | 4.3% |
|---|
Royalty Pharma PLC - Class A | 4.1% |
|---|
Dell Technologies, Inc. - Class C | 3.5% |
|---|
Taiwan Semiconductor Manufacturing Company Ltd. - ADR | 3.3% |
|---|
American Express Company | 3.3% |
|---|
KLA Corporation | 3.3% |
|---|
* Does not include cash/money market funds/equivalents. Based on percentage of net assets. Holdings can change at any time, are subject to risks discussed in the Fund’s prospectus, and should not be considered investment advice. |
| Material Fund Change [Text Block] |
No material changes occurred during the year ended June 30, 2026. |
| C000236481 |
|
| Shareholder Report [Line Items] |
|
| Fund Name |
Eventide Large Cap Focus Fund
|
| Class Name |
Class C
|
| Trading Symbol |
ETLCX
|
| Annual or Semi-Annual Statement [Text Block] |
This annual shareholder report contains important information about Eventide Large Cap Focus Fund for the period of July 1, 2025 to June 30, 2026.
|
| Additional Information [Text Block] |
You can find additional information about the Fund at https://www.eventidefunds.com. You can also request this information by contacting us at 1-877-771-3836.
|
| Additional Information Phone Number |
1-877-771-3836
|
| Additional Information Website |
https://www.eventidefunds.com
|
| Expenses [Text Block] |
What were the Fund’s costs for the last year?(based on a hypothetical $10,000 investment) Table SummaryClass Name | Costs of a $10,000 investment | Costs paid as a percentage of a $10,000 investment |
|---|
Class C | $210 | 1.94% |
|---|
|
| Expenses Paid, Amount |
$ 210
|
| Expense Ratio, Percent |
1.94%
|
| Line Graph [Table Text Block] |
Table Summary | Eventide Large Cap Focus Fund | S&P 500® Index |
|---|
Jun-2022 | $10,000 | $10,000 |
|---|
Jun-2023 | $11,360 | $11,959 |
|---|
Jun-2024 | $13,790 | $14,896 |
|---|
Jun-2025 | $15,340 | $17,155 |
|---|
Jun-2026 | $17,926 | $20,985 |
|---|
|
| Average Annual Return [Table Text Block] |
Table Summary | 1 Year | Since Inception (6/30/2022) |
|---|
Eventide Large Cap Focus Fund - Class C | 16.85% | 15.71% |
|---|
S&P 500® Index
| 22.32% | 20.36% |
|---|
|
| Performance Inception Date |
Jun. 30, 2022
|
| Material Change Description [Text Block] |
How did the Fund perform during the reporting period? The Fund’s underperformance in Financials, Materials, Utilities, Information Technology, and Healthcare was partly offset by outperformance in Industrials, Consumer Staples, and Real Estate. The Fund outperformed in the first half of calendar 2026 due to strong stock selection, particularly within Industrials and Information Technology. We remain focused on the Fund owning companies that create significant value for their stakeholders, while also trading at attractive valuations. Visit https://www.eventidefunds.com for more recent performance information. |
| AssetsNet |
$ 204,740,418
|
| Holdings Count | Holding |
51
|
| Advisory Fees Paid, Amount |
$ 974,701
|
| InvestmentCompanyPortfolioTurnover |
30.00%
|
| Additional Fund Statistics [Text Block] |
Table SummaryNet Assets | $204,740,418 |
|---|
Number of Portfolio Holdings | 51 |
|---|
Advisory Fee (net of waivers) | $974,701 |
|---|
Portfolio Turnover | 30% |
|---|
|
| Holdings [Text Block] |
Industry Weighting (% of net assets)Table SummaryValue | Value |
|---|
Other Assets in Excess of Liabilities | 2.9% | Other Industries | 3.0% | Institutional Financial Services | 1.2% | Technology Services | 1.5% | Banking | 1.6% | Oil & Gas Producers | 2.4% | Industrial Support Services | 2.5% | Transportation & Logistics | 3.0% | Specialty Finance | 3.3% | Medical Equipment & Devices | 3.9% | Chemicals | 5.2% | Software | 5.6% | Retail - Discretionary | 6.5% | Biotech & Pharma | 6.6% | Electric Utilities | 7.5% | Technology Hardware | 7.6% | Electrical Equipment | 10.4% | Semiconductors | 25.3% | Table SummaryValue | Value |
|---|
Large Cap | 70.8% | Mid Cap | 26.2% | Cash/Other | 3.0% | Small Cap | 0.0% | |
| Largest Holdings [Text Block] |
Top 10 Holdings* (% of net assets)Table SummaryHolding Name | % of Net Assets |
|---|
NVIDIA Corporation | 6.3% |
|---|
GE Vernova, Inc. | 6.0% |
|---|
Broadcom, Inc. | 4.8% |
|---|
Trane Technologies PLC | 4.4% |
|---|
Linde PLC | 4.3% |
|---|
Royalty Pharma PLC - Class A | 4.1% |
|---|
Dell Technologies, Inc. - Class C | 3.5% |
|---|
Taiwan Semiconductor Manufacturing Company Ltd. - ADR | 3.3% |
|---|
American Express Company | 3.3% |
|---|
KLA Corporation | 3.3% |
|---|
* Does not include cash/money market funds/equivalents. Based on percentage of net assets. Holdings can change at any time, are subject to risks discussed in the Fund’s prospectus, and should not be considered investment advice. |
| Material Fund Change [Text Block] |
No material changes occurred during the year ended June 30, 2026. |
| C000236482 |
|
| Shareholder Report [Line Items] |
|
| Fund Name |
Eventide Large Cap Focus Fund
|
| Class Name |
Class I
|
| Trading Symbol |
ETLIX
|
| Annual or Semi-Annual Statement [Text Block] |
This annual shareholder report contains important information about Eventide Large Cap Focus Fund for the period of July 1, 2025 to June 30, 2026.
|
| Additional Information [Text Block] |
You can find additional information about the Fund at https://www.eventidefunds.com. You can also request this information by contacting us at 1-877-771-3836.
|
| Additional Information Phone Number |
1-877-771-3836
|
| Additional Information Website |
https://www.eventidefunds.com
|
| Expenses [Text Block] |
What were the Fund’s costs for the last year?(based on a hypothetical $10,000 investment) Table SummaryClass Name | Costs of a $10,000 investment | Costs paid as a percentage of a $10,000 investment |
|---|
Class I | $102 | 0.94% |
|---|
|
| Expenses Paid, Amount |
$ 102
|
| Expense Ratio, Percent |
0.94%
|
| Line Graph [Table Text Block] |
Table Summary | Eventide Large Cap Focus Fund | S&P 500® Index |
|---|
Jun-2022 | $10,000 | $10,000 |
|---|
Jun-2023 | $11,455 | $11,959 |
|---|
Jun-2024 | $14,058 | $14,896 |
|---|
Jun-2025 | $15,789 | $17,155 |
|---|
Jun-2026 | $18,632 | $20,985 |
|---|
|
| Average Annual Return [Table Text Block] |
Table Summary | 1 Year | Since Inception (6/30/2022) |
|---|
Eventide Large Cap Focus Fund - Class I | 18.01% | 16.83% |
|---|
S&P 500® Index
| 22.32% | 20.36% |
|---|
|
| Performance Inception Date |
Jun. 30, 2022
|
| Material Change Description [Text Block] |
How did the Fund perform during the reporting period? The Fund’s underperformance in Financials, Materials, Utilities, Information Technology, and Healthcare was partly offset by outperformance in Industrials, Consumer Staples, and Real Estate. The Fund outperformed in the first half of calendar 2026 due to strong stock selection, particularly within Industrials and Information Technology. We remain focused on the Fund owning companies that create significant value for their stakeholders, while also trading at attractive valuations. Visit https://www.eventidefunds.com for more recent performance information. |
| AssetsNet |
$ 204,740,418
|
| Holdings Count | Holding |
51
|
| Advisory Fees Paid, Amount |
$ 974,701
|
| InvestmentCompanyPortfolioTurnover |
30.00%
|
| Additional Fund Statistics [Text Block] |
Table SummaryNet Assets | $204,740,418 |
|---|
Number of Portfolio Holdings | 51 |
|---|
Advisory Fee (net of waivers) | $974,701 |
|---|
Portfolio Turnover | 30% |
|---|
|
| Holdings [Text Block] |
Industry Weighting (% of net assets)Table SummaryValue | Value |
|---|
Other Assets in Excess of Liabilities | 2.9% | Other Industries | 3.0% | Institutional Financial Services | 1.2% | Technology Services | 1.5% | Banking | 1.6% | Oil & Gas Producers | 2.4% | Industrial Support Services | 2.5% | Transportation & Logistics | 3.0% | Specialty Finance | 3.3% | Medical Equipment & Devices | 3.9% | Chemicals | 5.2% | Software | 5.6% | Retail - Discretionary | 6.5% | Biotech & Pharma | 6.6% | Electric Utilities | 7.5% | Technology Hardware | 7.6% | Electrical Equipment | 10.4% | Semiconductors | 25.3% | Table SummaryValue | Value |
|---|
Large Cap | 70.8% | Mid Cap | 26.2% | Cash/Other | 3.0% | Small Cap | 0.0% | |
| Largest Holdings [Text Block] |
Top 10 Holdings* (% of net assets)Table SummaryHolding Name | % of Net Assets |
|---|
NVIDIA Corporation | 6.3% |
|---|
GE Vernova, Inc. | 6.0% |
|---|
Broadcom, Inc. | 4.8% |
|---|
Trane Technologies PLC | 4.4% |
|---|
Linde PLC | 4.3% |
|---|
Royalty Pharma PLC - Class A | 4.1% |
|---|
Dell Technologies, Inc. - Class C | 3.5% |
|---|
Taiwan Semiconductor Manufacturing Company Ltd. - ADR | 3.3% |
|---|
American Express Company | 3.3% |
|---|
KLA Corporation | 3.3% |
|---|
* Does not include cash/money market funds/equivalents. Based on percentage of net assets. Holdings can change at any time, are subject to risks discussed in the Fund’s prospectus, and should not be considered investment advice. |
| Material Fund Change [Text Block] |
No material changes occurred during the year ended June 30, 2026. |
| C000236479 |
|
| Shareholder Report [Line Items] |
|
| Fund Name |
Eventide Large Cap Focus Fund
|
| Class Name |
Class N
|
| Trading Symbol |
ETLNX
|
| Annual or Semi-Annual Statement [Text Block] |
This annual shareholder report contains important information about Eventide Large Cap Focus Fund for the period of July 1, 2025 to June 30, 2026.
|
| Additional Information [Text Block] |
You can find additional information about the Fund at https://www.eventidefunds.com. You can also request this information by contacting us at 1-877-771-3836.
|
| Additional Information Phone Number |
1-877-771-3836
|
| Additional Information Website |
https://www.eventidefunds.com
|
| Expenses [Text Block] |
What were the Fund’s costs for the last year?(based on a hypothetical $10,000 investment) Table SummaryClass Name | Costs of a $10,000 investment | Costs paid as a percentage of a $10,000 investment |
|---|
Class N | $124 | 1.14% |
|---|
|
| Expenses Paid, Amount |
$ 124
|
| Expense Ratio, Percent |
1.14%
|
| Line Graph [Table Text Block] |
Table Summary | Eventide Large Cap Focus Fund | S&P 500® Index |
|---|
Jun-2022 | $10,000 | $10,000 |
|---|
Jun-2023 | $11,443 | $11,959 |
|---|
Jun-2024 | $14,014 | $14,896 |
|---|
Jun-2025 | $15,708 | $17,155 |
|---|
Jun-2026 | $18,494 | $20,985 |
|---|
|
| Average Annual Return [Table Text Block] |
Table Summary | 1 Year | Since Inception (6/30/2022) |
|---|
Eventide Large Cap Focus Fund - Class N | 17.74% | 16.62% |
|---|
S&P 500® Index
| 22.32% | 20.36% |
|---|
|
| Performance Inception Date |
Jun. 30, 2022
|
| Material Change Description [Text Block] |
How did the Fund perform during the reporting period? The Fund’s underperformance in Financials, Materials, Utilities, Information Technology, and Healthcare was partly offset by outperformance in Industrials, Consumer Staples, and Real Estate. The Fund outperformed in the first half of calendar 2026 due to strong stock selection, particularly within Industrials and Information Technology. We remain focused on the Fund owning companies that create significant value for their stakeholders, while also trading at attractive valuations. Visit https://www.eventidefunds.com for more recent performance information. |
| AssetsNet |
$ 204,740,418
|
| Holdings Count | Holding |
51
|
| Advisory Fees Paid, Amount |
$ 974,701
|
| InvestmentCompanyPortfolioTurnover |
30.00%
|
| Additional Fund Statistics [Text Block] |
Table SummaryNet Assets | $204,740,418 |
|---|
Number of Portfolio Holdings | 51 |
|---|
Advisory Fee (net of waivers) | $974,701 |
|---|
Portfolio Turnover | 30% |
|---|
|
| Holdings [Text Block] |
Industry Weighting (% of net assets)Table SummaryValue | Value |
|---|
Other Assets in Excess of Liabilities | 2.9% | Other Industries | 3.0% | Institutional Financial Services | 1.2% | Technology Services | 1.5% | Banking | 1.6% | Oil & Gas Producers | 2.4% | Industrial Support Services | 2.5% | Transportation & Logistics | 3.0% | Specialty Finance | 3.3% | Medical Equipment & Devices | 3.9% | Chemicals | 5.2% | Software | 5.6% | Retail - Discretionary | 6.5% | Biotech & Pharma | 6.6% | Electric Utilities | 7.5% | Technology Hardware | 7.6% | Electrical Equipment | 10.4% | Semiconductors | 25.3% | Table SummaryValue | Value |
|---|
Large Cap | 70.8% | Mid Cap | 26.2% | Cash/Other | 3.0% | Small Cap | 0.0% | |
| Largest Holdings [Text Block] |
Top 10 Holdings* (% of net assets)Table SummaryHolding Name | % of Net Assets |
|---|
NVIDIA Corporation | 6.3% |
|---|
GE Vernova, Inc. | 6.0% |
|---|
Broadcom, Inc. | 4.8% |
|---|
Trane Technologies PLC | 4.4% |
|---|
Linde PLC | 4.3% |
|---|
Royalty Pharma PLC - Class A | 4.1% |
|---|
Dell Technologies, Inc. - Class C | 3.5% |
|---|
Taiwan Semiconductor Manufacturing Company Ltd. - ADR | 3.3% |
|---|
American Express Company | 3.3% |
|---|
KLA Corporation | 3.3% |
|---|
* Does not include cash/money market funds/equivalents. Based on percentage of net assets. Holdings can change at any time, are subject to risks discussed in the Fund’s prospectus, and should not be considered investment advice. |
| Material Fund Change [Text Block] |
No material changes occurred during the year ended June 30, 2026. |
| C000202730 |
|
| Shareholder Report [Line Items] |
|
| Fund Name |
Eventide Limited-Term Bond Fund
|
| Class Name |
Class A
|
| Trading Symbol |
ETABX
|
| Annual or Semi-Annual Statement [Text Block] |
This annual shareholder report contains important information about Eventide Limited-Term Bond Fund for the period of July 1, 2025 to June 30, 2026.
|
| Additional Information [Text Block] |
You can find additional information about the Fund at https://www.eventidefunds.com. You can also request this information by contacting us at 1-877-771-3836.
|
| Material Fund Change Notice [Text Block] |
This report describes changes to the Fund that occurred during the reporting period.
|
| Additional Information Phone Number |
1-877-771-3836
|
| Additional Information Website |
https://www.eventidefunds.com
|
| Expenses [Text Block] |
What were the Fund’s costs for the last year?(based on a hypothetical $10,000 investment) Table SummaryClass Name | Costs of a $10,000 investment | Costs paid as a percentage of a $10,000 investment |
|---|
Class A | $73 | 0.72% |
|---|
|
| Expenses Paid, Amount |
$ 73
|
| Expense Ratio, Percent |
0.72%
|
| Factors Affecting Performance [Text Block] |
How did the Fund perform during the reporting period? The Fund’s performance for the year ended June 30, 2026, was materially impacted by interest rate movements across the yield curve and the performance of corporate bonds relative to Treasury's. The Fund's investments slightly underperformed its benchmark net of fees, but outperformed gross of fees during the period. The Fund benefited from an overweight to corporate bonds and a significant underweight to Treasury bonds as corporate bonds outperformed Treasury bonds. The portfolio’s significantly shorter duration profile relative to the benchmark captured yield change gains as rates rose across the curve, but the carry deficit from holding shorter-dated instruments and the underweight to the long end of the curve produced a net yield drag that detracted from relative returns. Visit https://www.eventidefunds.com for more recent performance information. |
| Line Graph [Table Text Block] |
Table Summary | Eventide Limited-Term Bond Fund - with load | Bloomberg U.S. 1-5 Year Government/Credit Index | Bloomberg U.S. Aggregate Bond Index |
|---|
Jun-2016 | $9,422 | $10,000 | $10,000 |
|---|
Jun-2017 | $9,472 | $10,011 | $9,969 |
|---|
Jun-2018 | $9,424 | $9,991 | $9,929 |
|---|
Jun-2019 | $9,860 | $10,525 | $10,710 |
|---|
Jun-2020 | $10,284 | $11,096 | $11,646 |
|---|
Jun-2021 | $10,330 | $11,140 | $11,607 |
|---|
Jun-2022 | $9,689 | $10,561 | $10,413 |
|---|
Jun-2023 | $9,799 | $10,581 | $10,315 |
|---|
Jun-2024 | $10,298 | $11,074 | $10,587 |
|---|
Jun-2025 | $10,899 | $11,785 | $11,230 |
|---|
Jun-2026 | $11,249 | $12,139 | $11,656 |
|---|
|
| Average Annual Return [Table Text Block] |
Table Summary | 1 Year | 5 Years | 10 Years |
|---|
Eventide Limited-Term Bond Fund - Class A |
|---|
Without Load | 3.21% | 1.72% | 1.79% |
|---|
With Load | -2.75% | 0.52% | 1.18% |
|---|
Bloomberg U.S. 1-5 Year Government/Credit Index
| 3.00% | 1.73% | 1.96% |
|---|
Bloomberg U.S. Aggregate Bond Index | 3.79% | 0.08% | 1.54% |
|---|
|
| AssetsNet |
$ 218,186,572
|
| Holdings Count | Holding |
116
|
| Advisory Fees Paid, Amount |
$ 365,974
|
| InvestmentCompanyPortfolioTurnover |
11.00%
|
| Additional Fund Statistics [Text Block] |
Table SummaryNet Assets | $218,186,572 |
|---|
Number of Portfolio Holdings | 116 |
|---|
Advisory Fee (net of waivers) | $365,974 |
|---|
Portfolio Turnover | 11% |
|---|
|
| Holdings [Text Block] |
Industry Weighting (% of net assets)Table SummaryValue | Value |
|---|
Other Assets in Excess of Liabilities | 2.6% | Other Industries | 14.6% | Construction Materials | 2.0% | Asset Management | 2.0% | Electrical Equipment | 2.2% | Insurance | 2.3% | Engineering & Construction | 2.4% | Machinery | 3.2% | Semiconductors | 3.2% | Single-Family Housing | 3.5% | Retail - Discretionary | 5.5% | REIT | 5.6% | Oil & Gas Producers | 6.1% | Government Sponsored | 6.2% | Electric Utilities | 7.2% | Government Owned, No Guarantee | 8.0% | Banking | 9.6% | Agency Fixed Rate | 13.8% | Asset Weighting (% of total investments)Table SummaryValue | Value |
|---|
Asset Backed Securities | 2.0% | Corporate Bonds | 65.1% | Municipal Bonds | 4.1% | U.S. Government & Agencies | 28.8% | |
| Largest Holdings [Text Block] |
Top 10 Holdings* (% of net assets)Table SummaryHolding Name | % of Net Assets |
|---|
JPMorgan Chase & Company, 6.070%, due 10/22/27 | 1.6% |
|---|
Federal Home Loan Mortgage Corporation, 6.750%, due 03/15/31 | 1.4% |
|---|
Duke Energy Florida, LLC, 2.500%, due 12/1/29 | 1.4% |
|---|
Federal National Mortgage Association, 7.125%, due 01/15/30 | 1.4% |
|---|
Federal Home Loan Mortgage Corporation, 4.125%, due 02/20/31 | 1.4% |
|---|
Truist Financial Corporation, 5.071%, due 05/20/31 | 1.3% |
|---|
Home Depot, Inc. (The), 4.750%, due 06/25/29 | 1.3% |
|---|
Royal Bank of Canada, 1.150%, due 07/14/26 | 1.3% |
|---|
Federal National Mortgage Association, 6.625%, due 11/15/30 | 1.3% |
|---|
Freddie Mac Pool, 4.500%, due 01/1/41 | 1.2% |
|---|
* Does not include cash/money market funds/equivalents. Based on percentage of net assets. Holdings can change at any time, are subject to risks discussed in the Fund’s prospectus, and should not be considered investment advice. |
| Material Fund Change [Text Block] |
This is a summary of certain changes to the Fund since July 1, 2025. For more complete information, you may review the Fund’s November 1, 2025 prospectus, which is available at https://www.eventidefunds.com/prospectus or upon request at 1-877-771 EVEN (3836). Effective September 1, 2025, the Advisor reduced the expense limitation by 0.10%. |
| C000202731 |
|
| Shareholder Report [Line Items] |
|
| Fund Name |
Eventide Limited-Term Bond Fund
|
| Class Name |
Class C
|
| Trading Symbol |
ETCBX
|
| Annual or Semi-Annual Statement [Text Block] |
This annual shareholder report contains important information about Eventide Limited-Term Bond Fund for the period of July 1, 2025 to June 30, 2026.
|
| Additional Information [Text Block] |
You can find additional information about the Fund at https://www.eventidefunds.com. You can also request this information by contacting us at 1-877-771-3836.
|
| Material Fund Change Notice [Text Block] |
This report describes changes to the Fund that occurred during the reporting period.
|
| Additional Information Phone Number |
1-877-771-3836
|
| Additional Information Website |
https://www.eventidefunds.com
|
| Expenses [Text Block] |
What were the Fund’s costs for the last year?(based on a hypothetical $10,000 investment) Table SummaryClass Name | Costs of a $10,000 investment | Costs paid as a percentage of a $10,000 investment |
|---|
Class C | $149 | 1.47% |
|---|
|
| Expenses Paid, Amount |
$ 149
|
| Expense Ratio, Percent |
1.47%
|
| Factors Affecting Performance [Text Block] |
How did the Fund perform during the reporting period? The Fund’s performance for the year ended June 30, 2026, was materially impacted by interest rate movements across the yield curve and the performance of corporate bonds relative to Treasury's. The Fund's investments slightly underperformed its benchmark net of fees, but outperformed gross of fees during the period. The Fund benefited from an overweight to corporate bonds and a significant underweight to Treasury bonds as corporate bonds outperformed Treasury bonds. The portfolio’s significantly shorter duration profile relative to the benchmark captured yield change gains as rates rose across the curve, but the carry deficit from holding shorter-dated instruments and the underweight to the long end of the curve produced a net yield drag that detracted from relative returns. Visit https://www.eventidefunds.com for more recent performance information. |
| Line Graph [Table Text Block] |
Table Summary | Eventide Limited-Term Bond Fund | Bloomberg U.S. 1-5 Year Government/Credit Index | Bloomberg U.S. Aggregate Bond Index |
|---|
Dec-2018 | $10,000 | $10,000 | $10,000 |
|---|
Jun-2019 | $10,424 | $10,427 | $10,708 |
|---|
Jun-2020 | $10,789 | $10,993 | $11,644 |
|---|
Jun-2021 | $10,749 | $11,037 | $11,605 |
|---|
Jun-2022 | $10,003 | $10,463 | $10,411 |
|---|
Jun-2023 | $10,052 | $10,483 | $10,313 |
|---|
Jun-2024 | $10,481 | $10,971 | $10,585 |
|---|
Jun-2025 | $11,015 | $11,676 | $11,228 |
|---|
Jun-2026 | $11,287 | $12,026 | $11,653 |
|---|
|
| Average Annual Return [Table Text Block] |
Table Summary | 1 Year | 5 Years | Since Inception (12/14/2018) |
|---|
Eventide Limited-Term Bond Fund - Class C | 2.47% | 0.98% | 1.62% |
|---|
Bloomberg U.S. 1-5 Year Government/Credit Index
| 3.00% | 1.73% | 2.48% |
|---|
Bloomberg U.S. Aggregate Bond Index | 3.79% | 0.08% | 2.05% |
|---|
|
| Performance Inception Date |
Dec. 14, 2018
|
| AssetsNet |
$ 218,186,572
|
| Holdings Count | Holding |
116
|
| Advisory Fees Paid, Amount |
$ 365,974
|
| InvestmentCompanyPortfolioTurnover |
11.00%
|
| Additional Fund Statistics [Text Block] |
Table SummaryNet Assets | $218,186,572 |
|---|
Number of Portfolio Holdings | 116 |
|---|
Advisory Fee (net of waivers) | $365,974 |
|---|
Portfolio Turnover | 11% |
|---|
|
| Holdings [Text Block] |
Industry Weighting (% of net assets)Table SummaryValue | Value |
|---|
Other Assets in Excess of Liabilities | 2.6% | Other Industries | 14.6% | Construction Materials | 2.0% | Asset Management | 2.0% | Electrical Equipment | 2.2% | Insurance | 2.3% | Engineering & Construction | 2.4% | Machinery | 3.2% | Semiconductors | 3.2% | Single-Family Housing | 3.5% | Retail - Discretionary | 5.5% | REIT | 5.6% | Oil & Gas Producers | 6.1% | Government Sponsored | 6.2% | Electric Utilities | 7.2% | Government Owned, No Guarantee | 8.0% | Banking | 9.6% | Agency Fixed Rate | 13.8% | Asset Weighting (% of total investments)Table SummaryValue | Value |
|---|
Asset Backed Securities | 2.0% | Corporate Bonds | 65.1% | Municipal Bonds | 4.1% | U.S. Government & Agencies | 28.8% | |
| Largest Holdings [Text Block] |
Top 10 Holdings* (% of net assets)Table SummaryHolding Name | % of Net Assets |
|---|
JPMorgan Chase & Company, 6.070%, due 10/22/27 | 1.6% |
|---|
Federal Home Loan Mortgage Corporation, 6.750%, due 03/15/31 | 1.4% |
|---|
Duke Energy Florida, LLC, 2.500%, due 12/1/29 | 1.4% |
|---|
Federal National Mortgage Association, 7.125%, due 01/15/30 | 1.4% |
|---|
Federal Home Loan Mortgage Corporation, 4.125%, due 02/20/31 | 1.4% |
|---|
Truist Financial Corporation, 5.071%, due 05/20/31 | 1.3% |
|---|
Home Depot, Inc. (The), 4.750%, due 06/25/29 | 1.3% |
|---|
Royal Bank of Canada, 1.150%, due 07/14/26 | 1.3% |
|---|
Federal National Mortgage Association, 6.625%, due 11/15/30 | 1.3% |
|---|
Freddie Mac Pool, 4.500%, due 01/1/41 | 1.2% |
|---|
* Does not include cash/money market funds/equivalents. Based on percentage of net assets. Holdings can change at any time, are subject to risks discussed in the Fund’s prospectus, and should not be considered investment advice. |
| Material Fund Change [Text Block] |
This is a summary of certain changes to the Fund since July 1, 2025. For more complete information, you may review the Fund’s November 1, 2025 prospectus, which is available at https://www.eventidefunds.com/prospectus or upon request at 1-877-771 EVEN (3836). Effective September 1, 2025, the Advisor reduced the expense limitation by 0.10%. |
| C000202732 |
|
| Shareholder Report [Line Items] |
|
| Fund Name |
Eventide Limited-Term Bond Fund
|
| Class Name |
Class I
|
| Trading Symbol |
ETIBX
|
| Annual or Semi-Annual Statement [Text Block] |
This annual shareholder report contains important information about Eventide Limited-Term Bond Fund for the period of July 1, 2025 to June 30, 2026.
|
| Additional Information [Text Block] |
You can find additional information about the Fund at https://www.eventidefunds.com. You can also request this information by contacting us at 1-877-771-3836.
|
| Material Fund Change Notice [Text Block] |
This report describes changes to the Fund that occurred during the reporting period.
|
| Additional Information Phone Number |
1-877-771-3836
|
| Additional Information Website |
https://www.eventidefunds.com
|
| Expenses [Text Block] |
What were the Fund’s costs for the last year?(based on a hypothetical $10,000 investment) Table SummaryClass Name | Costs of a $10,000 investment | Costs paid as a percentage of a $10,000 investment |
|---|
Class I | $48 | 0.47% |
|---|
|
| Expenses Paid, Amount |
$ 48
|
| Expense Ratio, Percent |
0.47%
|
| Factors Affecting Performance [Text Block] |
How did the Fund perform during the reporting period? The Fund’s performance for the year ended June 30, 2026, was materially impacted by interest rate movements across the yield curve and the performance of corporate bonds relative to Treasury's. The Fund's investments slightly underperformed its benchmark net of fees, but outperformed gross of fees during the period. The Fund benefited from an overweight to corporate bonds and a significant underweight to Treasury bonds as corporate bonds outperformed Treasury bonds. The portfolio’s significantly shorter duration profile relative to the benchmark captured yield change gains as rates rose across the curve, but the carry deficit from holding shorter-dated instruments and the underweight to the long end of the curve produced a net yield drag that detracted from relative returns. Visit https://www.eventidefunds.com for more recent performance information. |
| Line Graph [Table Text Block] |
Table Summary | Eventide Limited-Term Bond Fund | Bloomberg U.S. 1-5 Year Government/Credit Index | Bloomberg U.S. Aggregate Bond Index |
|---|
Jun-2016 | $10,000 | $10,000 | $10,000 |
|---|
Jun-2017 | $9,987 | $10,011 | $9,969 |
|---|
Jun-2018 | $9,961 | $9,991 | $9,929 |
|---|
Jun-2019 | $10,450 | $10,525 | $10,710 |
|---|
Jun-2020 | $10,928 | $11,096 | $11,646 |
|---|
Jun-2021 | $11,000 | $11,140 | $11,607 |
|---|
Jun-2022 | $10,338 | $10,561 | $10,413 |
|---|
Jun-2023 | $10,489 | $10,581 | $10,315 |
|---|
Jun-2024 | $11,050 | $11,074 | $10,587 |
|---|
Jun-2025 | $11,720 | $11,785 | $11,230 |
|---|
Jun-2026 | $12,138 | $12,139 | $11,656 |
|---|
|
| Average Annual Return [Table Text Block] |
Table Summary | 1 Year | 5 Years | 10 Years |
|---|
Eventide Limited-Term Bond Fund - Class I | 3.57% | 1.99% | 1.96% |
|---|
Bloomberg U.S. 1-5 Year Government/Credit Index
| 3.00% | 1.73% | 1.96% |
|---|
Bloomberg U.S. Aggregate Bond Index | 3.79% | 0.08% | 1.54% |
|---|
|
| AssetsNet |
$ 218,186,572
|
| Holdings Count | Holding |
116
|
| Advisory Fees Paid, Amount |
$ 365,974
|
| InvestmentCompanyPortfolioTurnover |
11.00%
|
| Additional Fund Statistics [Text Block] |
Table SummaryNet Assets | $218,186,572 |
|---|
Number of Portfolio Holdings | 116 |
|---|
Advisory Fee (net of waivers) | $365,974 |
|---|
Portfolio Turnover | 11% |
|---|
|
| Holdings [Text Block] |
Industry Weighting (% of net assets)Table SummaryValue | Value |
|---|
Other Assets in Excess of Liabilities | 2.6% | Other Industries | 14.6% | Construction Materials | 2.0% | Asset Management | 2.0% | Electrical Equipment | 2.2% | Insurance | 2.3% | Engineering & Construction | 2.4% | Machinery | 3.2% | Semiconductors | 3.2% | Single-Family Housing | 3.5% | Retail - Discretionary | 5.5% | REIT | 5.6% | Oil & Gas Producers | 6.1% | Government Sponsored | 6.2% | Electric Utilities | 7.2% | Government Owned, No Guarantee | 8.0% | Banking | 9.6% | Agency Fixed Rate | 13.8% | Asset Weighting (% of total investments)Table SummaryValue | Value |
|---|
Asset Backed Securities | 2.0% | Corporate Bonds | 65.1% | Municipal Bonds | 4.1% | U.S. Government & Agencies | 28.8% | |
| Largest Holdings [Text Block] |
Top 10 Holdings* (% of net assets)Table SummaryHolding Name | % of Net Assets |
|---|
JPMorgan Chase & Company, 6.070%, due 10/22/27 | 1.6% |
|---|
Federal Home Loan Mortgage Corporation, 6.750%, due 03/15/31 | 1.4% |
|---|
Duke Energy Florida, LLC, 2.500%, due 12/1/29 | 1.4% |
|---|
Federal National Mortgage Association, 7.125%, due 01/15/30 | 1.4% |
|---|
Federal Home Loan Mortgage Corporation, 4.125%, due 02/20/31 | 1.4% |
|---|
Truist Financial Corporation, 5.071%, due 05/20/31 | 1.3% |
|---|
Home Depot, Inc. (The), 4.750%, due 06/25/29 | 1.3% |
|---|
Royal Bank of Canada, 1.150%, due 07/14/26 | 1.3% |
|---|
Federal National Mortgage Association, 6.625%, due 11/15/30 | 1.3% |
|---|
Freddie Mac Pool, 4.500%, due 01/1/41 | 1.2% |
|---|
* Does not include cash/money market funds/equivalents. Based on percentage of net assets. Holdings can change at any time, are subject to risks discussed in the Fund’s prospectus, and should not be considered investment advice. |
| Material Fund Change [Text Block] |
This is a summary of certain changes to the Fund since July 1, 2025. For more complete information, you may review the Fund’s November 1, 2025 prospectus, which is available at https://www.eventidefunds.com/prospectus or upon request at 1-877-771 EVEN (3836). Effective September 1, 2025, the Advisor reduced the expense limitation by 0.10%. |
| C000202733 |
|
| Shareholder Report [Line Items] |
|
| Fund Name |
Eventide Limited-Term Bond Fund
|
| Class Name |
Class N
|
| Trading Symbol |
ETNBX
|
| Annual or Semi-Annual Statement [Text Block] |
This annual shareholder report contains important information about Eventide Limited-Term Bond Fund for the period of July 1, 2025 to June 30, 2026.
|
| Additional Information [Text Block] |
You can find additional information about the Fund at https://www.eventidefunds.com. You can also request this information by contacting us at 1-877-771-3836.
|
| Material Fund Change Notice [Text Block] |
This report describes changes to the Fund that occurred during the reporting period.
|
| Additional Information Phone Number |
1-877-771-3836
|
| Additional Information Website |
https://www.eventidefunds.com
|
| Expenses [Text Block] |
What were the Fund’s costs for the last year?(based on a hypothetical $10,000 investment) Table SummaryClass Name | Costs of a $10,000 investment | Costs paid as a percentage of a $10,000 investment |
|---|
Class N | $68 | 0.67% |
|---|
|
| Expenses Paid, Amount |
$ 68
|
| Expense Ratio, Percent |
0.67%
|
| Factors Affecting Performance [Text Block] |
How did the Fund perform during the reporting period? The Fund’s performance for the year ended June 30, 2026, was materially impacted by interest rate movements across the yield curve and the performance of corporate bonds relative to Treasury's. The Fund's investments slightly underperformed its benchmark net of fees, but outperformed gross of fees during the period. The Fund benefited from an overweight to corporate bonds and a significant underweight to Treasury bonds as corporate bonds outperformed Treasury bonds. The portfolio’s significantly shorter duration profile relative to the benchmark captured yield change gains as rates rose across the curve, but the carry deficit from holding shorter-dated instruments and the underweight to the long end of the curve produced a net yield drag that detracted from relative returns. Visit https://www.eventidefunds.com for more recent performance information. |
| Line Graph [Table Text Block] |
Table Summary | Eventide Limited-Term Bond Fund | Bloomberg U.S. 1-5 Year Government/Credit Index | Bloomberg U.S. Aggregate Bond Index |
|---|
Dec-2018 | $10,000 | $10,000 | $10,000 |
|---|
Jun-2019 | $10,464 | $10,427 | $10,708 |
|---|
Jun-2020 | $10,921 | $10,993 | $11,644 |
|---|
Jun-2021 | $10,974 | $11,037 | $11,605 |
|---|
Jun-2022 | $10,287 | $10,463 | $10,411 |
|---|
Jun-2023 | $10,419 | $10,483 | $10,313 |
|---|
Jun-2024 | $10,959 | $10,971 | $10,585 |
|---|
Jun-2025 | $11,595 | $11,676 | $11,228 |
|---|
Jun-2026 | $11,986 | $12,026 | $11,653 |
|---|
|
| Average Annual Return [Table Text Block] |
Table Summary | 1 Year | 5 Years | Since Inception (12/14/2018) |
|---|
Eventide Limited-Term Bond Fund - Class N | 3.37% | 1.78% | 2.43% |
|---|
Bloomberg U.S. 1-5 Year Government/Credit Index
| 3.00% | 1.73% | 2.48% |
|---|
Bloomberg U.S. Aggregate Bond Index | 3.79% | 0.08% | 2.05% |
|---|
|
| Performance Inception Date |
Dec. 14, 2018
|
| AssetsNet |
$ 218,186,572
|
| Holdings Count | Holding |
116
|
| Advisory Fees Paid, Amount |
$ 365,974
|
| InvestmentCompanyPortfolioTurnover |
11.00%
|
| Additional Fund Statistics [Text Block] |
Table SummaryNet Assets | $218,186,572 |
|---|
Number of Portfolio Holdings | 116 |
|---|
Advisory Fee (net of waivers) | $365,974 |
|---|
Portfolio Turnover | 11% |
|---|
|
| Holdings [Text Block] |
Industry Weighting (% of net assets)Table SummaryValue | Value |
|---|
Other Assets in Excess of Liabilities | 2.6% | Other Industries | 14.6% | Construction Materials | 2.0% | Asset Management | 2.0% | Electrical Equipment | 2.2% | Insurance | 2.3% | Engineering & Construction | 2.4% | Machinery | 3.2% | Semiconductors | 3.2% | Single-Family Housing | 3.5% | Retail - Discretionary | 5.5% | REIT | 5.6% | Oil & Gas Producers | 6.1% | Government Sponsored | 6.2% | Electric Utilities | 7.2% | Government Owned, No Guarantee | 8.0% | Banking | 9.6% | Agency Fixed Rate | 13.8% | Asset Weighting (% of total investments)Table SummaryValue | Value |
|---|
Asset Backed Securities | 2.0% | Corporate Bonds | 65.1% | Municipal Bonds | 4.1% | U.S. Government & Agencies | 28.8% | |
| Largest Holdings [Text Block] |
Top 10 Holdings* (% of net assets)Table SummaryHolding Name | % of Net Assets |
|---|
JPMorgan Chase & Company, 6.070%, due 10/22/27 | 1.6% |
|---|
Federal Home Loan Mortgage Corporation, 6.750%, due 03/15/31 | 1.4% |
|---|
Duke Energy Florida, LLC, 2.500%, due 12/1/29 | 1.4% |
|---|
Federal National Mortgage Association, 7.125%, due 01/15/30 | 1.4% |
|---|
Federal Home Loan Mortgage Corporation, 4.125%, due 02/20/31 | 1.4% |
|---|
Truist Financial Corporation, 5.071%, due 05/20/31 | 1.3% |
|---|
Home Depot, Inc. (The), 4.750%, due 06/25/29 | 1.3% |
|---|
Royal Bank of Canada, 1.150%, due 07/14/26 | 1.3% |
|---|
Federal National Mortgage Association, 6.625%, due 11/15/30 | 1.3% |
|---|
Freddie Mac Pool, 4.500%, due 01/1/41 | 1.2% |
|---|
* Does not include cash/money market funds/equivalents. Based on percentage of net assets. Holdings can change at any time, are subject to risks discussed in the Fund’s prospectus, and should not be considered investment advice. |
| Material Fund Change [Text Block] |
This is a summary of certain changes to the Fund since July 1, 2025. For more complete information, you may review the Fund’s November 1, 2025 prospectus, which is available at https://www.eventidefunds.com/prospectus or upon request at 1-877-771 EVEN (3836). Effective September 1, 2025, the Advisor reduced the expense limitation by 0.10%. |