Shareholder Report
Jun. 30, 2026
USD ($)
$ / shares
This report describes changes to the Fund that occurred during the reporting period.
WHAT WERE THE FUND COSTS FOR THE PAST YEAR? (based on a hypothetical $10,000 investment)
|
Class Name
|
Costs of a $10,000 investment
|
Costs paid as a percentage of a $10,000 investment
|
|
Institutional Class
|
$82
|
0.80%
|
HOW DID THE FUND PERFORM LAST YEAR AND WHAT AFFECTED ITS PERFORMANCE?
For the 12-month period ended June 30, 2026, the Fund underperformed its benchmark, the MSCI World Index (Net).
WHAT FACTORS INFLUENCED PERFORMANCE
The Fund underperformed the benchmark that we believe is increasingly driven by bubble-like conditions in semiconductors and other perceived data center supply chain beneficiaries. Bubbles can unwind rapidly, and we remained disciplined regarding portfolio construction to reduce the risk of permanent capital loss and build long-term wealth.
POSITIONING
Key contributors for the year included TSMC, Alphabet and UnitedHealth Group. Demand for AI accelerator chips has strengthened significantly over the past year with rising capex projections and gigawatt-scale data center expansions, which directly benefits TSMC as the world’s leading-edge foundry. As well as capitalizing on wafer demand, the company has also outperformed expectations on gross margins due to pricing and cost efficiencies that offset rising manufacturing costs. Alphabet has performed well as i) concerns about AI disruption to its core Search business abated as it has executed well with AI overviews and AI mode while momentum of ChatGPT slowed, and ii) Alphabet’s long-term investments and full stack approach to AI improved its positioning in Cloud where it is growing strongly and has expanded operating margins. We view the strong performance as justified and continue to view Alphabet as attractively priced relative to its opportunities from AI. UnitedHealth recovered from the depressed levels due to strong recent results with the medical care ratio improving to 83.9% (from 84.8% a year earlier), prompting management to raise FY26 adjusted EPS guidance. The result reflected a prioritization of margin recovery over membership growth, including trimming Medicare Advantage membership and restoring operational discipline at Optum Health. Softer industry-wide medical cost and utilization trends and a larger-than-proposed 2027 Medicare Advantage rate increase further supported sentiment.
Key detractors over the past year included SAP, Microsoft and Meta. SAP has been negatively affected by the sell-off in enterprise software on AI disruption risk, fueled by new coding and productivity tools released by frontier labs like Anthropic. Compounding this was SAP’s Q4 result where its current cloud backlog (CCB) of 25% ex FX was a point below market expectations. We perceived this as timing or macro-related rather than due to AI disruption. While Microsoft has continued to execute well in its cloud and software businesses, it has been affected in recent quarters by its escalating capex plans accompanied by Azure growth that, while strong, did not meet market expectations, in part as it allocates some of its AI capacity to its own products and internal projects. Its greater exposure to enterprise software and its perceived lag in the AI tech stack relative to Google and Amazon have likely also been factors. We still view Microsoft as one of the most advantaged enterprise vendors and expect it to be one of the key beneficiaries of AI adoption. Despite very strong top-line performance as Facebook and Instagram benefited from AI on multiple fronts, Meta’s share price has been affected by Zuckerberg’s decision to invest heavily in AI capabilities, including Meta Superintelligence labs. We view this as very short-term thinking. We consider Zuckerberg to be highly rational in the medium term and expect Meta to either generate a positive ROI from its AI investments or pull back on its investments, in which case profitability will expand meaningfully.
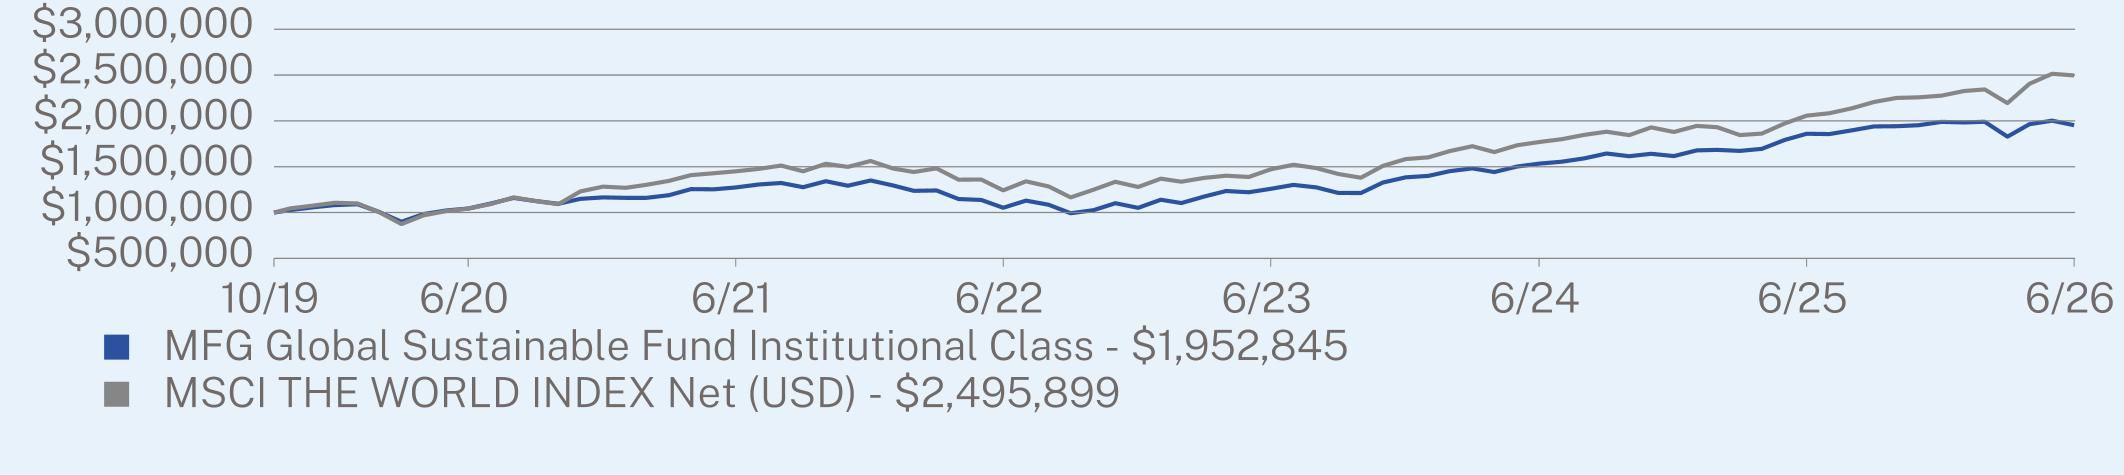
ANNUAL AVERAGE TOTAL RETURN (%)
|
|
1 Year
|
5 Year
|
Since Inception
(10/09/2019) |
|
Institutional Class
|
5.01
|
8.92
|
10.46
|
|
MSCI World Index (Net)
|
21.34
|
11.47
|
14.57
|
Visit https://mfg-funds.com/funds/mfg-global-sustainable/ for more recent performance information.
KEY FUND STATISTICS (as of June 30, 2026)
|
Net Assets
|
$14,295,662
|
|
Number of Holdings
|
27
|
|
Net Advisory Fee
|
$0
|
|
Portfolio Turnover
|
57%
|
WHAT DID THE FUND INVEST IN? (% of net assets as of June 30, 2026)
|
Top Sectors
|
(%)
|
|
|
Information Technology
|
20.6
|
%
|
|
Consumer Staples
|
16.3
|
%
|
|
Consumer Discretionary
|
15.8
|
%
|
|
Communication Services
|
13.5
|
%
|
|
Financials
|
12.8
|
%
|
|
Health Care
|
7.2
|
%
|
|
Utilities
|
3.1
|
%
|
|
Real Estate
|
3.0
|
%
|
|
Industrials
|
2.2
|
%
|
|
Cash & Other
|
5.5
|
%
|
|
Top Issuers
|
(%)
|
|
|
Microsoft Corp.
|
8.3
|
%
|
|
Taiwan Semiconductor Manufacturing Co. Ltd.
|
7.9
|
%
|
|
Amazon.com, Inc.
|
7.1
|
%
|
|
Alphabet, Inc.
|
6.3
|
%
|
|
Mastercard, Inc.
|
5.0
|
%
|
|
Meta Platforms, Inc.
|
4.5
|
%
|
|
SAP SE
|
4.4
|
%
|
|
Nestle SA
|
4.1
|
%
|
|
adidas AG
|
3.6
|
%
|
|
Eversource Energy
|
3.1
|
%
|
|
Top Countries
|
(%)
|
|
|
United States
|
64.0
|
%
|
|
Germany
|
10.1
|
%
|
|
Taiwan, Province of China
|
7.9
|
%
|
|
United Kingdom
|
5.2
|
%
|
|
Switzerland
|
4.1
|
%
|
|
Spain
|
2.2
|
%
|
|
Netherlands
|
1.0
|
%
|
|
Cash & Other
|
5.5
|
%
|
HOW HAS THE FUND CHANGED?
This is a summary of certain changes to the Fund since June 30, 2025. For more complete information, you may review the Fund’s prospectus at https://mfg-funds.com/resources/. You may also obtain a copy of the prospectus by calling 888-825-2100.
Fund Name Change
Effective October 31, 2025, the Fund’s name changed from Frontier MFG Global Sustainable Fund to MFG Global Sustainable Fund.
Investment Adviser and Subadviser Name Changes
Effective November 17, 2025, the name of the Fund’s investment adviser, Frontegra Asset Management, Inc., changed to Magellan Investment Partners North America, Inc. Effective August 15, 2025, the Fund’s subadviser changed its assumed name to Magellan Investment Partners.
Distributor Change
Effective June 22, 2026, the Fund’s distributor, Frontegra Strategies, LLC, was acquired by NexTier Distributors, LLC and the name of the distributor changed to NexTier Distribution, LLC.
This report describes changes to the Fund that occurred during the reporting period.
WHAT WERE THE FUND COSTS FOR THE PAST YEAR? (based on a hypothetical $10,000 investment)
|
Class Name
|
Costs of a $10,000 investment
|
Costs paid as a percentage of a $10,000 investment
|
|
Service Class
|
$92
|
0.90%
|
HOW DID THE FUND PERFORM LAST YEAR AND WHAT AFFECTED ITS PERFORMANCE?
For the 12-month period ended June 30, 2026, the Fund underperformed its benchmark, the MSCI World Index (Net).
WHAT FACTORS INFLUENCED PERFORMANCE
The Fund underperformed the benchmark that we believe is increasingly driven by bubble-like conditions in semiconductors and other perceived data center supply chain beneficiaries. Bubbles can unwind rapidly, and we remained disciplined regarding portfolio construction to reduce the risk of permanent capital loss and build long-term wealth.
POSITIONING
Key contributors for the year included TSMC, Alphabet and UnitedHealth Group. Demand for AI accelerator chips has strengthened significantly over the past year with rising capex projections and gigawatt-scale data center expansions, which directly benefits TSMC as the world’s leading-edge foundry. As well as capitalizing on wafer demand, the company has also outperformed expectations on gross margins due to pricing and cost efficiencies that offset rising manufacturing costs. Alphabet has performed well as i) concerns about AI disruption to its core Search business abated as it has executed well with AI overviews and AI mode while momentum of ChatGPT slowed, and ii) Alphabet’s long-term investments and full stack approach to AI improved its positioning in Cloud where it is growing strongly and has expanded operating margins. We view the strong performance as justified and continue to view Alphabet as attractively priced relative to its opportunities from AI. UnitedHealth recovered from the depressed levels due to strong recent results with the medical care ratio improving to 83.9% (from 84.8% a year earlier), prompting management to raise FY26 adjusted EPS guidance. The result reflected a prioritization of margin recovery over membership growth, including trimming Medicare Advantage membership and restoring operational discipline at Optum Health. Softer industry-wide medical cost and utilization trends and a larger-than-proposed 2027 Medicare Advantage rate increase further supported sentiment.
Key detractors over the past year included SAP, Microsoft and Meta. SAP has been negatively affected by the sell-off in enterprise software on AI disruption risk, fueled by new coding and productivity tools released by frontier labs like Anthropic. Compounding this was SAP’s Q4 result where its current cloud backlog (CCB) of 25% ex FX was a point below market expectations. We perceived this as timing or macro-related rather than due to AI disruption. While Microsoft has continued to execute well in its cloud and software businesses, it has been affected in recent quarters by its escalating capex plans accompanied by Azure growth that, while strong, did not meet market expectations, in part as it allocates some of its AI capacity to its own products and internal projects. Its greater exposure to enterprise software and its perceived lag in the AI tech stack relative to Google and Amazon have likely also been factors. We still view Microsoft as one of the most advantaged enterprise vendors and expect it to be one of the key beneficiaries of AI adoption. Despite very strong top-line performance as Facebook and Instagram benefited from AI on multiple fronts, Meta’s share price has been affected by Zuckerberg’s decision to invest heavily in AI capabilities, including Meta Superintelligence labs. We view this as very short-term thinking. We consider Zuckerberg to be highly rational in the medium term and expect Meta to either generate a positive ROI from its AI investments or pull back on its investments, in which case profitability will expand meaningfully.
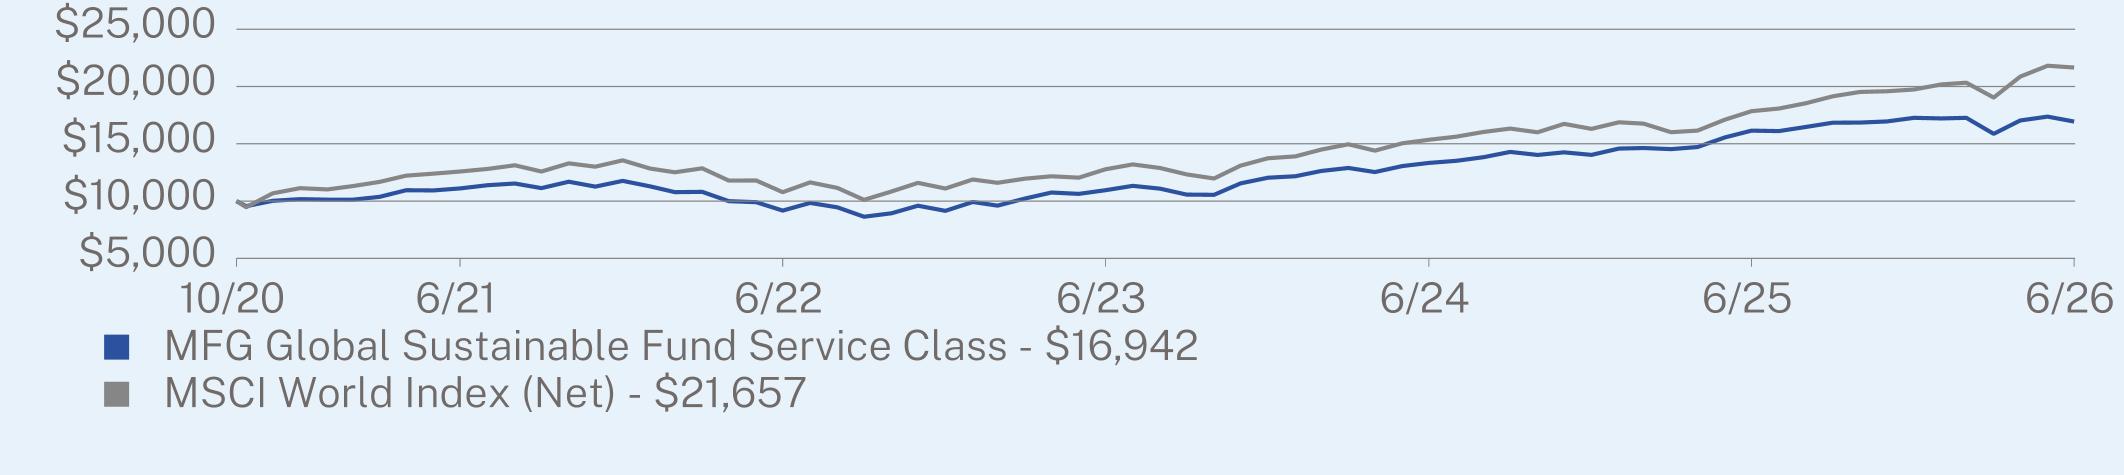
ANNUAL AVERAGE TOTAL RETURN (%)
|
|
1 Year
|
5 Year
|
Since Inception
(10/20/2020) |
|
Service Class
|
4.91
|
8.81
|
9.70
|
|
MSCI World Index (Net)
|
21.34
|
11.47
|
14.54
|
Visit https://mfg-funds.com/funds/mfg-global-sustainable/ for more recent performance information.
KEY FUND STATISTICS (as of June 30, 2026)
|
Net Assets
|
$14,295,662
|
|
Number of Holdings
|
27
|
|
Net Advisory Fee
|
$0
|
|
Portfolio Turnover
|
57%
|
WHAT DID THE FUND INVEST IN? (% of net assets as of June 30, 2026)
|
Top Sectors
|
(%)
|
|
|
Information Technology
|
20.6
|
%
|
|
Consumer Staples
|
16.3
|
%
|
|
Consumer Discretionary
|
15.8
|
%
|
|
Communication Services
|
13.5
|
%
|
|
Financials
|
12.8
|
%
|
|
Health Care
|
7.2
|
%
|
|
Utilities
|
3.1
|
%
|
|
Real Estate
|
3.0
|
%
|
|
Industrials
|
2.2
|
%
|
|
Cash & Other
|
5.5
|
%
|
|
Top Issuers
|
(%)
|
|
|
Microsoft Corp.
|
8.3
|
%
|
|
Taiwan Semiconductor Manufacturing Co. Ltd.
|
7.9
|
%
|
|
Amazon.com, Inc.
|
7.1
|
%
|
|
Alphabet, Inc.
|
6.3
|
%
|
|
Mastercard, Inc.
|
5.0
|
%
|
|
Meta Platforms, Inc.
|
4.5
|
%
|
|
SAP SE
|
4.4
|
%
|
|
Nestle SA
|
4.1
|
%
|
|
adidas AG
|
3.6
|
%
|
|
Eversource Energy
|
3.1
|
%
|
|
Top Countries
|
(%)
|
|
|
United States
|
64.0
|
%
|
|
Germany
|
10.1
|
%
|
|
Taiwan, Province of China
|
7.9
|
%
|
|
United Kingdom
|
5.2
|
%
|
|
Switzerland
|
4.1
|
%
|
|
Spain
|
2.2
|
%
|
|
Netherlands
|
1.0
|
%
|
|
Cash & Other
|
5.5
|
%
|
HOW HAS THE FUND CHANGED?
This is a summary of certain changes to the Fund since June 30, 2025. For more complete information, you may review the Fund’s prospectus at https://mfg-funds.com/resources/. You may also obtain a copy of the prospectus by calling 888-825-2100.
Fund Name Change
Effective October 31, 2025, the Fund’s name changed from Frontier MFG Global Sustainable Fund to MFG Global Sustainable Fund.
Investment Adviser and Subadviser Name Changes
Effective November 17, 2025, the name of the Fund’s investment adviser, Frontegra Asset Management, Inc., changed to Magellan Investment Partners North America, Inc. Effective August 15, 2025, the Fund’s subadviser changed its assumed name to Magellan Investment Partners.
Distributor Change
Effective June 22, 2026, the Fund’s distributor, Frontegra Strategies, LLC, was acquired by NexTier Distributors, LLC and the name of the distributor changed to NexTier Distribution, LLC.
This report describes changes to the Fund that occurred during the reporting period.
WHAT WERE THE FUND COSTS FOR THE PAST YEAR? (based on a hypothetical $10,000 investment)
|
Class Name
|
Costs of a $10,000 investment
|
Costs paid as a percentage of a $10,000 investment
|
|
Institutional Class
|
$54
|
0.50%
|
HOW DID THE FUND PERFORM LAST YEAR AND WHAT AFFECTED ITS PERFORMANCE?
For the 12-month period ended June 30, 2026, the Fund underperformed the S&P Global Infrastructure Index.
WHAT FACTORS INFLUENCED PERFORMANCE
The Fund recorded a positive return in the year to June 2026, as an uncertain climate continued to support investor demand for high-quality, defensive assets including listed infrastructure. Rotation into real assets, as markets digested the implications of AI, was supportive. At the same time, the US war with Iran and rising expectations for inflation and interest rates were headwinds for the strategy over much of the March and June quarters of 2026.
POSITIONING
Top contributors for the year were TC Energy Corporation, Ferrovial and Enbridge. Shares in TC Energy, a Canadian energy infrastructure company, rose as robust results from its highly contracted gas transmission assets, disciplined capital deployment and asset sales accelerated the deleveraging of the company’s balance sheet. The company indicated a firm pipeline for capex and demand, supported by US power demand growth, including data centers, and LNG exports. Shares in global infrastructure operator Ferrovial rose, reflecting sustained robust performance across its major business lines including toll roads, energy and construction. This included strength in its managed lane toll roads businesses, which demonstrated resilience in traffic and robust pricing power, even as gasoline prices rose. For Canadian energy infrastructure company Enbridge, robust energy demand and the announcement of a series of highly accretive, capital-light brownfield asset optimizations drove strong share price performance.
Top detractors for the year included Cellnex, American Tower Corporation and Crown Castle. Spanish telecommunications infrastructure company Cellnex declined as markets received news of telco industry consolidation in Europe as a substantive headwind for the stock, despite the company’s contractual protections and solid underlying business performance during the year. US telecommunications infrastructure companies American Tower and Crown Castle were also affected by rising bond yields as these stocks can trade as bond proxies. During the year, the market was focused on a small customer, DISH, which defaulted on its lease payments resulting in a decline of US tower revenues by approximately 4%. Finally, news reports on the market entry of direct-to-device satellite services, while nascent, also weighed on the stocks.
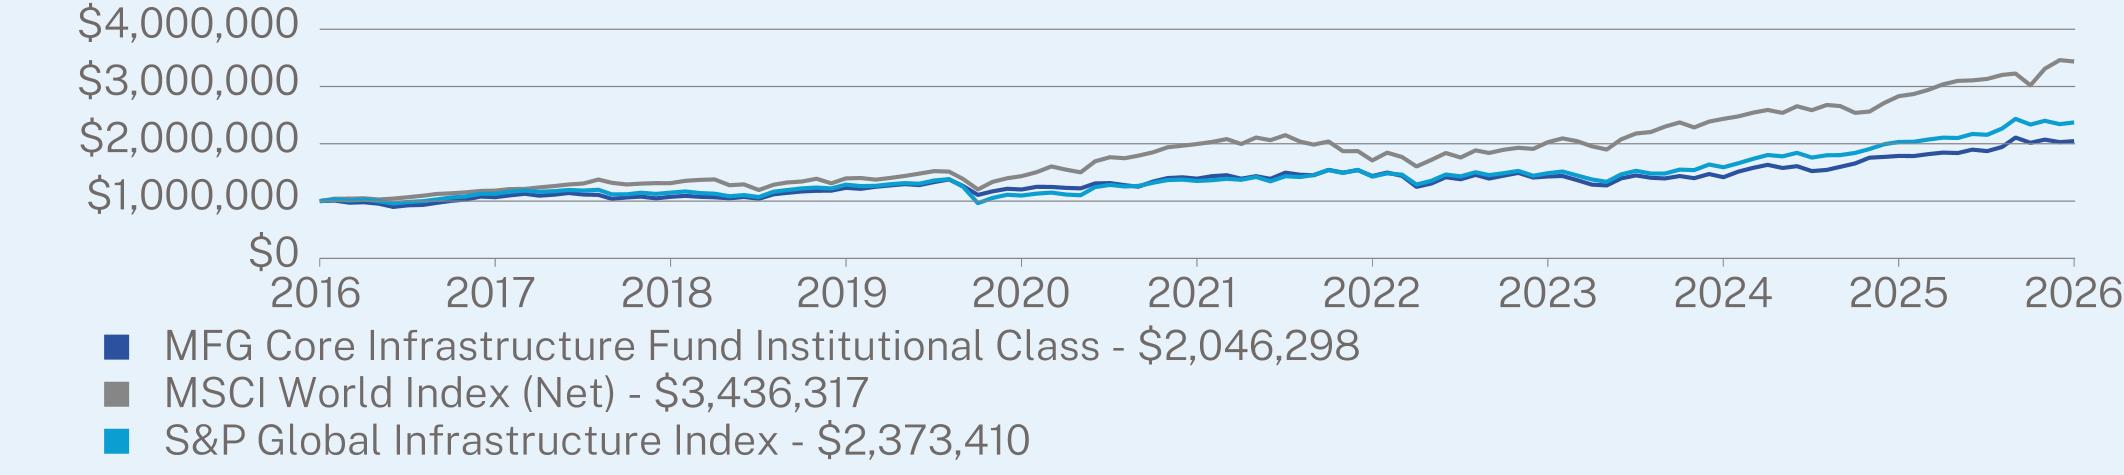
ANNUAL AVERAGE TOTAL RETURN (%)
|
|
1 Year
|
5 Year
|
10 Year
|
|
Institutional Class
|
14.41
|
8.02
|
7.42
|
|
MSCI World Index (Net)
|
21.34
|
11.47
|
13.14
|
|
S&P Global Infrastructure Index
|
16.79
|
11.92
|
9.03
|
Visit https://mfg-funds.com/funds/mfg-core-infrastructure/ for more recent performance information.
KEY FUND STATISTICS (as of June 30, 2026)
|
Net Assets
|
$149,010,654
|
|
Number of Holdings
|
92
|
|
Net Advisory Fee
|
$147,515
|
|
Portfolio Turnover
|
21%
|
WHAT DID THE FUND INVEST IN? (% of net assets as of June 30, 2026)
|
Top Sectors
|
(%)
|
|
|
Integrated Power
|
28.3
|
%
|
|
Transmission & Distribution
|
20.3
|
%
|
|
Toll Roads
|
11.4
|
%
|
|
Airports
|
9.9
|
%
|
|
Energy Infrastructure
|
7.9
|
%
|
|
Gas Utilities
|
6.8
|
%
|
|
Communications
|
5.9
|
%
|
|
Water Utilities
|
5.2
|
%
|
|
Social
|
0.7
|
%
|
|
Cash & Other
|
3.6
|
%
|
|
Top Issuers
|
(%)
|
|
|
Aena SME SA
|
3.1
|
%
|
|
National Grid PLC
|
3.0
|
%
|
|
Ferrovial NV
|
3.0
|
%
|
|
Vinci SA
|
2.9
|
%
|
|
Enbridge, Inc.
|
2.8
|
%
|
|
TC Energy Corp.
|
2.8
|
%
|
|
Fortis, Inc.
|
2.8
|
%
|
|
Transurban Group
|
2.7
|
%
|
|
Snam SpA
|
2.4
|
%
|
|
Hydro One Ltd.
|
2.4
|
%
|
|
Top Countries
|
(%)
|
|
|
United States
|
39.9
|
%
|
|
Canada
|
14.2
|
%
|
|
Italy
|
6.9
|
%
|
|
Spain
|
6.7
|
%
|
|
United Kingdom
|
6.5
|
%
|
|
France
|
5.4
|
%
|
|
Australia
|
4.2
|
%
|
|
Netherlands
|
3.6
|
%
|
|
Mexico
|
3.1
|
%
|
|
Cash & Other
|
9.5
|
%
|
HOW HAS THE FUND CHANGED?
This is a summary of certain changes to the Fund since June 30, 2025. For more complete information, you may review the Fund’s prospectus at https://mfg-funds.com/resources/. You may also obtain a copy of the prospectus by calling 888-825-2100.
Fund Name Change
Effective October 31, 2025, the Fund’s name changed from Frontier MFG Core Infrastructure Fund to MFG Core Infrastructure Fund.
Investment Adviser and Subadviser Name Changes
Effective November 17, 2025, the name of the Fund’s investment adviser, Frontegra Asset Management, Inc., changed to Magellan Investment Partners North America, Inc. Effective August 15, 2025, the Fund’s subadviser changed its assumed name to Magellan Investment Partners.
Distributor Change
Effective June 22, 2026, the Fund’s distributor, Frontegra Strategies, LLC, was acquired by NexTier Distributors, LLC and the name of the distributor changed to NexTier Distribution, LLC.
This report describes changes to the Fund that occurred during the reporting period.
WHAT WERE THE FUND COSTS FOR THE PAST YEAR? (based on a hypothetical $10,000 investment)
|
Class Name
|
Costs of a $10,000 investment
|
Costs paid as a percentage of a $10,000 investment
|
|
Service Class
|
$61
|
0.57%
|
HOW DID THE FUND PERFORM LAST YEAR AND WHAT AFFECTED ITS PERFORMANCE?
For the 12-month period ended June 30, 2026, the Fund underperformed the S&P Global Infrastructure Index.
WHAT FACTORS INFLUENCED PERFORMANCE
The Fund recorded a positive return in the year to June 2026, as an uncertain climate continued to support investor demand for high-quality, defensive assets including listed infrastructure. Rotation into real assets, as markets digested the implications of AI, was supportive. At the same time, the US war with Iran and rising expectations for inflation and interest rates were headwinds for the strategy over much of the March and June quarters of 2026.
POSITIONING
Top contributors for the year were TC Energy Corporation, Ferrovial and Enbridge. Shares in TC Energy, a Canadian energy infrastructure company, rose as robust results from its highly contracted gas transmission assets, disciplined capital deployment and asset sales accelerated the deleveraging of the company’s balance sheet. The company indicated a firm pipeline for capex and demand, supported by US power demand growth, including data centers, and LNG exports. Shares in global infrastructure operator Ferrovial rose, reflecting sustained robust performance across its major business lines including toll roads, energy and construction. This included strength in its managed lane toll roads businesses, which demonstrated resilience in traffic and robust pricing power, even as gasoline prices rose. For Canadian energy infrastructure company Enbridge, robust energy demand and the announcement of a series of highly accretive, capital-light brownfield asset optimizations drove strong share price performance.
Top detractors for the year included Cellnex, American Tower Corporation and Crown Castle. Spanish telecommunications infrastructure company Cellnex declined as markets received news of telco industry consolidation in Europe as a substantive headwind for the stock, despite the company’s contractual protections and solid underlying business performance during the year. US telecommunications infrastructure companies American Tower and Crown Castle were also affected by rising bond yields as these stocks can trade as bond proxies. During the year, the market was focused on a small customer, DISH, which defaulted on its lease payments resulting in a decline of US tower revenues by approximately 4%. Finally, news reports on the market entry of direct-to-device satellite services, while nascent, also weighed on the stocks.
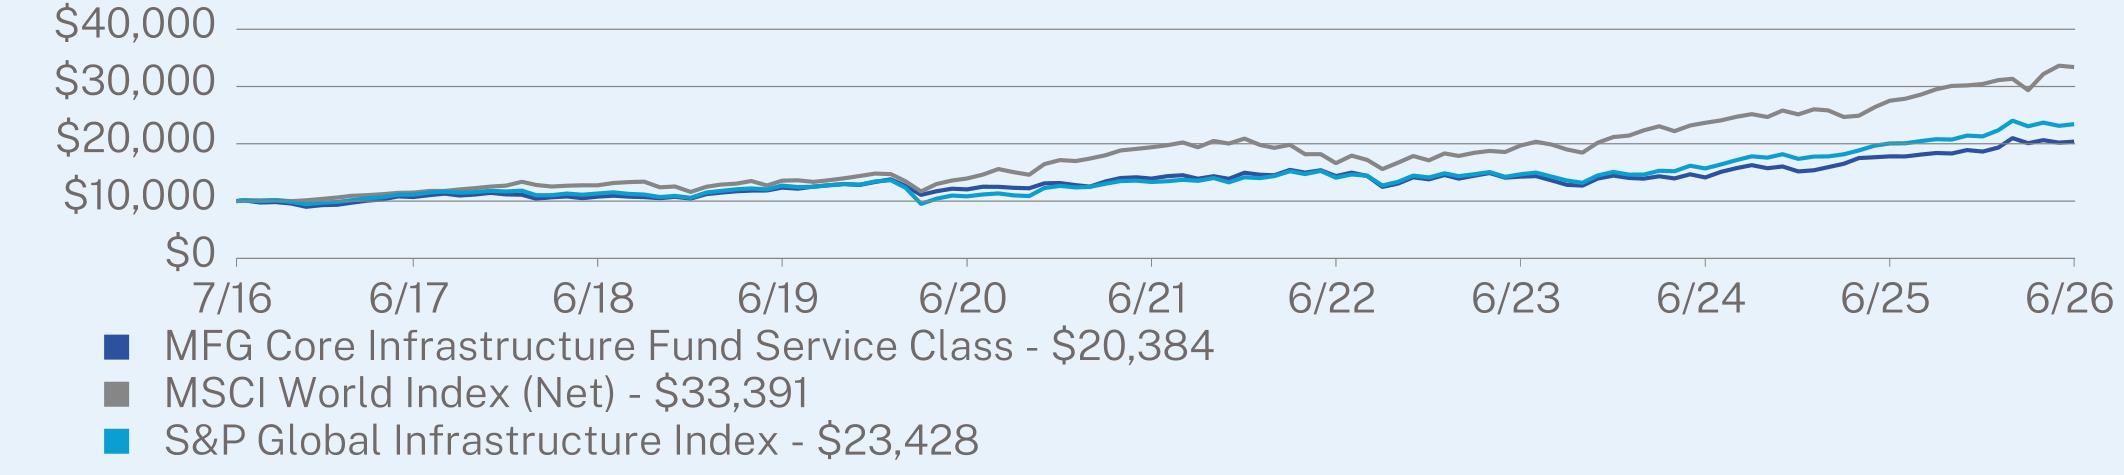
ANNUAL AVERAGE TOTAL RETURN (%)
|
|
1 Year
|
5 Year
|
Since Inception
(07/15/2016) |
|
Service Class
|
14.45
|
7.92
|
7.41
|
|
MSCI World Index (Net)
|
21.34
|
11.47
|
12.87
|
|
S&P Global Infrastructure Index
|
16.79
|
11.92
|
8.92
|
Visit https://mfg-funds.com/funds/mfg-core-infrastructure/ for more recent performance information.
KEY FUND STATISTICS (as of June 30, 2026)
|
Net Assets
|
$149,010,654
|
|
Number of Holdings
|
92
|
|
Net Advisory Fee
|
$147,515
|
|
Portfolio Turnover
|
21%
|
WHAT DID THE FUND INVEST IN? (% of net assets as of June 30, 2026)
|
Top Sectors
|
(%)
|
|
|
Integrated Power
|
28.3
|
%
|
|
Transmission & Distribution
|
20.3
|
%
|
|
Toll Roads
|
11.4
|
%
|
|
Airports
|
9.9
|
%
|
|
Energy Infrastructure
|
7.9
|
%
|
|
Gas Utilities
|
6.8
|
%
|
|
Communications
|
5.9
|
%
|
|
Water Utilities
|
5.2
|
%
|
|
Social
|
0.7
|
%
|
|
Cash & Other
|
3.6
|
%
|
|
Top Issuers
|
(%)
|
|
|
Aena SME SA
|
3.1
|
%
|
|
National Grid PLC
|
3.0
|
%
|
|
Ferrovial NV
|
3.0
|
%
|
|
Vinci SA
|
2.9
|
%
|
|
Enbridge, Inc.
|
2.8
|
%
|
|
TC Energy Corp.
|
2.8
|
%
|
|
Fortis, Inc.
|
2.8
|
%
|
|
Transurban Group
|
2.7
|
%
|
|
Snam SpA
|
2.4
|
%
|
|
Hydro One Ltd.
|
2.4
|
%
|
|
Top Countries
|
(%)
|
|
|
United States
|
39.9
|
%
|
|
Canada
|
14.2
|
%
|
|
Italy
|
6.9
|
%
|
|
Spain
|
6.7
|
%
|
|
United Kingdom
|
6.5
|
%
|
|
France
|
5.4
|
%
|
|
Australia
|
4.2
|
%
|
|
Netherlands
|
3.6
|
%
|
|
Mexico
|
3.1
|
%
|
|
Cash & Other
|
9.5
|
%
|
HOW HAS THE FUND CHANGED?
This is a summary of certain changes to the Fund since June 30, 2025. For more complete information, you may review the Fund’s prospectus at https://mfg-funds.com/resources/. You may also obtain a copy of the prospectus by calling 888-825-2100.
Fund Name Change
Effective October 31, 2025, the Fund’s name changed from Frontier MFG Core Infrastructure Fund to MFG Core Infrastructure Fund.
Investment Adviser and Subadviser Name Changes
Effective November 17, 2025, the name of the Fund’s investment adviser, Frontegra Asset Management, Inc., changed to Magellan Investment Partners North America, Inc. Effective August 15, 2025, the Fund’s subadviser changed its assumed name to Magellan Investment Partners.
Distributor Change
Effective June 22, 2026, the Fund’s distributor, Frontegra Strategies, LLC, was acquired by NexTier Distributors, LLC and the name of the distributor changed to NexTier Distribution, LLC.