Shareholder Report
|
12 Months Ended |
|
Jun. 30, 2026
USD ($)
Holding
|
|---|
| Shareholder Report [Line Items] |
|
| Document Type |
N-CSR
|
| Amendment Flag |
false
|
| Registrant Name |
Northern Lights Fund Trust
|
| Entity Central Index Key |
0001314414
|
| Entity Investment Company Type |
N-1A
|
| Document Period End Date |
Jun. 30, 2026
|
| Shareholder Report Annual or Semi-Annual |
Annual Shareholder Report
|
| C000105241 |
|
| Shareholder Report [Line Items] |
|
| Fund Name |
Winton Managed Futures Trend Fund
|
| Class Name |
Class A
|
| Trading Symbol |
EVOAX
|
| Annual or Semi-Annual Statement [Text Block] |
This annual shareholder report contains important information about Winton Managed Futures Trend Fund ("Fund") for the period of July 1, 2025 to June 30, 2026.
|
| Additional Information [Text Block] |
You can find additional information about the Fund at https://www.wintonfunds.com/managed-futures-trend. You can also request this information by contacting us at 1-877-772-5838.
|
| Additional Information Phone Number |
1-877-772-5838
|
| Additional Information Website |
https://www.wintonfunds.com/managed-futures-trend
|
| Expenses [Text Block] |
What were the Fund’s costs for the last year?(based on a hypothetical $10,000 investment) Table SummaryClass Name | Costs of a $10,000 investment | Costs paid as a percentage of a $10,000 investment |
|---|
Class A | $174 | 1.59% |
|---|
|
| Expenses Paid, Amount |
$ 174
|
| Expense Ratio, Percent |
1.59%
|
| Performance Past Does Not Indicate Future [Text] |
The Fund’s past performance is not a good predictor of how the Fund will perform in the future.
|
| Line Graph [Table Text Block] |
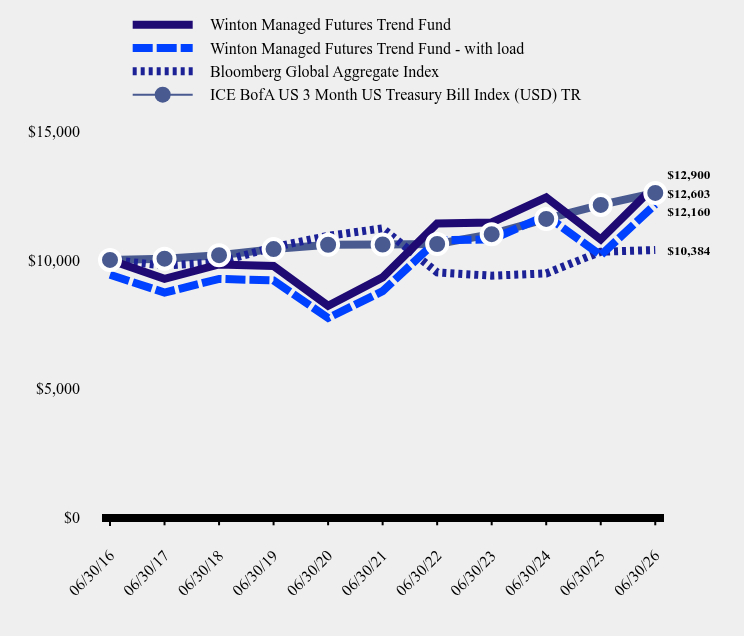
Table Summary | Winton Managed Futures Trend Fund | Winton Managed Futures Trend Fund - with load | Bloomberg Global Aggregate Index | ICE BofA US 3 Month US Treasury Bill Index (USD) TR |
|---|
06/30/16 | $10,000 | $9,426 | $10,000 | $10,000 |
|---|
06/30/17 | $9,264 | $8,732 | $9,782 | $10,049 |
|---|
06/30/18 | $9,826 | $9,262 | $9,915 | $10,186 |
|---|
06/30/19 | $9,764 | $9,204 | $10,495 | $10,421 |
|---|
06/30/20 | $8,217 | $7,745 | $10,938 | $10,591 |
|---|
06/30/21 | $9,322 | $8,787 | $11,226 | $10,601 |
|---|
06/30/22 | $11,419 | $10,763 | $9,514 | $10,619 |
|---|
06/30/23 | $11,458 | $10,801 | $9,389 | $11,000 |
|---|
06/30/24 | $12,434 | $11,720 | $9,476 | $11,594 |
|---|
06/30/25 | $10,800 | $10,181 | $10,320 | $12,137 |
|---|
06/30/26 | $12,900 | $12,160 | $10,384 | $12,603 |
|---|
|
| Average Annual Return [Table Text Block] |
Average Annual Total Returns Table Summary | 1 Year | 5 Years | 10 Years |
|---|
Winton Managed Futures Trend Fund | | | |
|---|
Without Load | 19.44% | 6.71% | 2.58% |
|---|
With Load | 12.61% | 5.45% | 1.97% |
|---|
Bloomberg Global Aggregate Index | 0.62% | -1.55% | 0.38% |
|---|
ICE BofA US 3 Month US Treasury Bill Index (USD) TR | 3.84% | 3.52% | 2.34% |
|---|
The Fund’s past performance is not a good predictor of how the Fund will perform in the future. The graph and table do not reflect the deduction of taxes that a shareholder would pay on fund distributions or redemption of fund shares. For updated performance call 1-877-772-5838. |
| No Deduction of Taxes [Text Block] |
The graph and table do not reflect the deduction of taxes that a shareholder would pay on fund distributions or redemption of fund shares.
|
| AssetsNet |
$ 22,024,267
|
| Holdings Count | Holding |
170
|
| Advisory Fees Paid, Amount |
$ 0
|
| InvestmentCompanyPortfolioTurnover |
0.00%
|
| Additional Fund Statistics [Text Block] |
- Net Assets$22,024,267
- Number of Portfolio Holdings170
- Advisory Fee $0
- Portfolio Turnover0%
|
| Holdings [Text Block] |
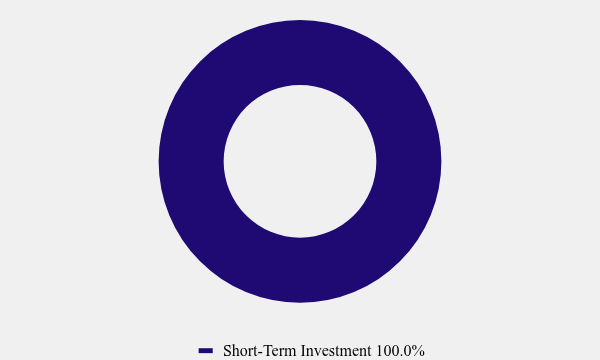
Asset Weighting (% of total investments)Table SummaryValue | Value |
|---|
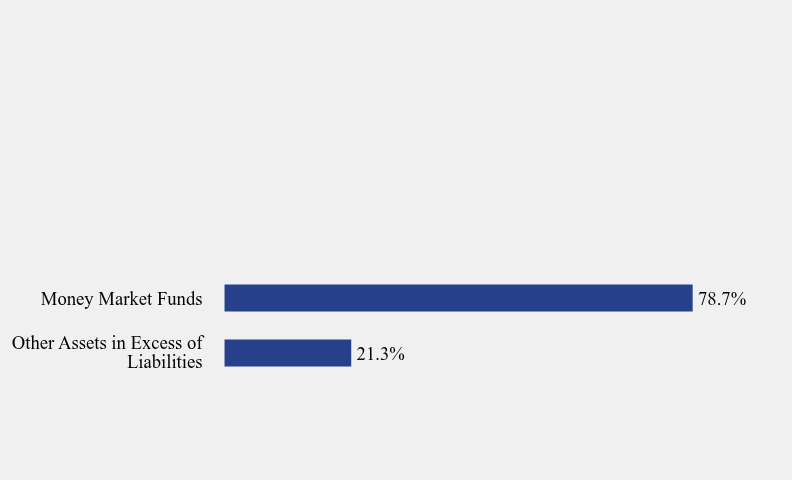
Short-Term Investment | 100.0% | Sector Weighting (% of net assets)Table SummaryValue | Value |
|---|
Other Assets in Excess of Liabilities | 21.3% | Money Market Funds | 78.7% | |
| Material Fund Change [Text Block] |
This is a summary of certain material changes to the Fund since June 30, 2025. For more complete information, you may review the Fund’s prospectus dated October 28, 2025, which is available at www.wintonfunds.com/managed-futures-trend or by calling 1-877-772-5838 (toll free). Effective October 28, 2025, Winton Capital Management Limited assumed the day-to-day management of the Fund’s portfolio. Also, effective October 28, 2025, the Fund’s name, and principal investment strategies and risks materially changed. |
| C000105243 |
|
| Shareholder Report [Line Items] |
|
| Fund Name |
Winton Managed Futures Trend Fund
|
| Class Name |
Class I
|
| Trading Symbol |
EVOIX
|
| Annual or Semi-Annual Statement [Text Block] |
This annual shareholder report contains important information about Winton Managed Futures Trend Fund ("Fund") for the period of July 1, 2025 to June 30, 2026.
|
| Additional Information [Text Block] |
You can find additional information about the Fund at https://www.wintonfunds.com/managed-futures-trend. You can also request this information by contacting us at 1-877-772-5838.
|
| Additional Information Phone Number |
1-877-772-5838
|
| Additional Information Website |
https://www.wintonfunds.com/managed-futures-trend
|
| Expenses [Text Block] |
What were the Fund’s costs for the last year?(based on a hypothetical $10,000 investment) Table SummaryClass Name | Costs of a $10,000 investment | Costs paid as a percentage of a $10,000 investment |
|---|
Class I | $147 | 1.34% |
|---|
|
| Expenses Paid, Amount |
$ 147
|
| Expense Ratio, Percent |
1.34%
|
| Performance Past Does Not Indicate Future [Text] |
The Fund’s past performance is not a good predictor of how the Fund will perform in the future.
|
| Line Graph [Table Text Block] |
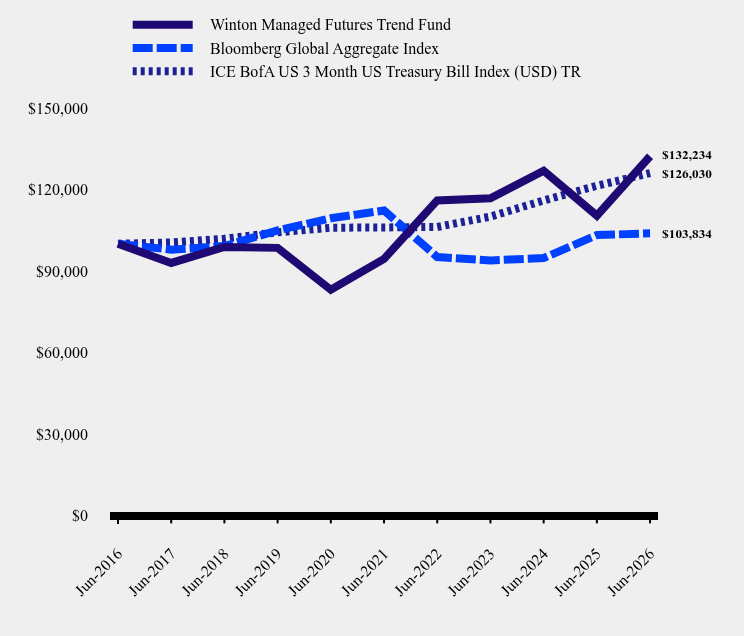
Table Summary | Winton Managed Futures Trend Fund | Bloomberg Global Aggregate Index | ICE BofA US 3 Month US Treasury Bill Index (USD) TR |
|---|
Jun-2016 | $100,000 | $100,000 | $100,000 |
|---|
Jun-2017 | $92,952 | $97,823 | $100,486 |
|---|
Jun-2018 | $98,836 | $99,151 | $101,855 |
|---|
Jun-2019 | $98,499 | $104,949 | $104,211 |
|---|
Jun-2020 | $83,063 | $109,379 | $105,908 |
|---|
Jun-2021 | $94,407 | $112,260 | $106,008 |
|---|
Jun-2022 | $115,962 | $95,141 | $106,186 |
|---|
Jun-2023 | $116,756 | $93,887 | $110,002 |
|---|
Jun-2024 | $126,901 | $94,755 | $115,944 |
|---|
Jun-2025 | $110,367 | $103,195 | $121,371 |
|---|
Jun-2026 | $132,234 | $103,834 | $126,030 |
|---|
|
| Average Annual Return [Table Text Block] |
Average Annual Total Returns Table Summary | 1 Year | 5 Years | 10 Years |
|---|
Winton Managed Futures Trend Fund | 19.81% | 6.97% | 2.83% |
|---|
Bloomberg Global Aggregate Index | 0.62% | -1.55% | 0.38% |
|---|
ICE BofA US 3 Month US Treasury Bill Index (USD) TR | 3.84% | 3.52% | 2.34% |
|---|
The Fund’s past performance is not a good predictor of how the Fund will perform in the future. The graph and table do not reflect the deduction of taxes that a shareholder would pay on fund distributions or redemption of fund shares. For updated performance call 1-877-772-5838. |
| No Deduction of Taxes [Text Block] |
The graph and table do not reflect the deduction of taxes that a shareholder would pay on fund distributions or redemption of fund shares.
|
| AssetsNet |
$ 22,024,267
|
| Holdings Count | Holding |
170
|
| Advisory Fees Paid, Amount |
$ 0
|
| InvestmentCompanyPortfolioTurnover |
0.00%
|
| Additional Fund Statistics [Text Block] |
- Net Assets$22,024,267
- Number of Portfolio Holdings170
- Advisory Fee $0
- Portfolio Turnover0%
|
| Holdings [Text Block] |
Asset Weighting (% of total investments)Table SummaryValue | Value |
|---|
Short-Term Investment | 100.0% | Sector Weighting (% of net assets)Table SummaryValue | Value |
|---|
Other Assets in Excess of Liabilities | 21.3% | Money Market Funds | 78.7% | |
| Material Fund Change [Text Block] |
This is a summary of certain material changes to the Fund since June 30, 2025. For more complete information, you may review the Fund’s prospectus dated October 28, 2025, which is available at www.wintonfunds.com/managed-futures-trend or by calling 1-877-772-5838 (toll free). Effective October 28, 2025, Winton Capital Management Limited assumed the day-to-day management of the Fund’s portfolio. Also, effective October 28, 2025, the Fund’s name, and principal investment strategies and risks materially changed. |