Shareholder Report
|
6 Months Ended |
|
Jun. 30, 2026
USD ($)
Holding
|
|---|
| Shareholder Report [Line Items] |
|
|
| Document Type |
N-CSRS
|
|
| Amendment Flag |
false
|
|
| Registrant Name |
Advisors Preferred Trust
|
|
| Entity Central Index Key |
0001556505
|
|
| Entity Investment Company Type |
N-1A
|
|
| Document Period End Date |
Jun. 30, 2026
|
|
| Shareholder Report Annual or Semi-Annual |
Semi-Annual Shareholder Report
|
|
| C000127985 |
|
|
| Shareholder Report [Line Items] |
|
|
| Fund Name |
OnTrack Core Fund
|
|
| Trading Symbol |
OTRGX
|
|
| Annual or Semi-Annual Statement [Text Block] |
This semi-annual shareholder report contains important information about OnTrack Core Fund for the period of January 1, 2026 to June 30, 2026.
|
|
| Additional Information [Text Block] |
You can find additional information about the Fund at www.ontrackcore.com/funddocuments. You can also request this information by contacting us at (855) 747-9555.
|
|
| Additional Information Phone Number |
(855) 747-9555
|
|
| Additional Information Website |
www.ontrackcore.com/funddocuments
|
|
| Expenses [Text Block] |
What were the Fund’s costs for the last six months?(based on a hypothetical $10,000 investment) Table SummaryClass Name | Costs of a $10,000 investment | Costs paid as a percentage of a $10,000 investment |
|---|
Advisor | $143 | 2.81%Footnote Reference* |
|---|
| Footnote | Description | Footnote* | Annualized |
|
|
| Expenses Paid, Amount |
$ 143
|
|
| Expense Ratio, Percent |
2.81%
|
[1] |
| Factors Affecting Performance [Text Block] |
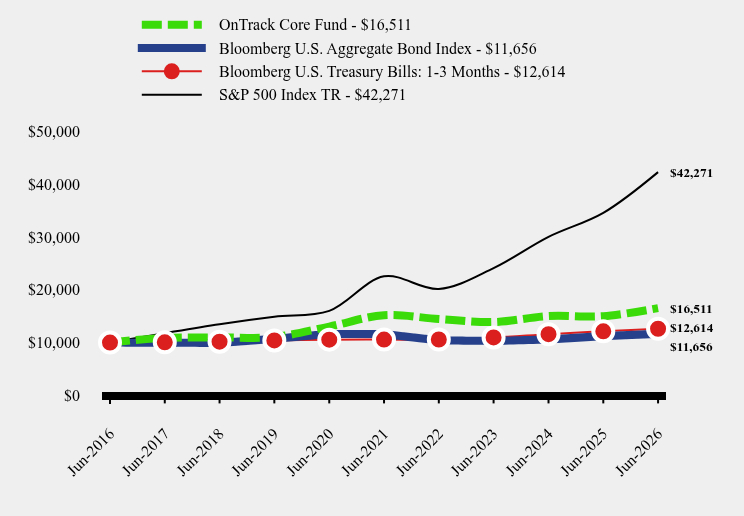
How did the Fund perform during the reporting period? The Fund gained 4.95% for the six months ending June 30, 2026. The Bloomberg 1-3 Months U.S. Treasury Bill index, the Fund’s primary benchmark, earned 1.80% for the same period. Strategy The OnTrack Core Fund seeks total return while keeping the Fund’s volatility and downside risk below that of major equity market indices. We use a flexible approach that emphasizes capital preservation but allows us to adopt a less conservative posture and to increase emphasis on capital appreciation when we believe additional risk is warranted by favorable market conditions. Techniques The market environment entering 2026 was constructive. Growth remained solid, the labor market did not exhibit stress and inflation continued to moderate at the margin. Consistent with these conditions, the Fund was fully invested and leveraged, emphasizing low-volatility bond and income funds, with a meaningful allocation to emerging-market bond strategies. The market environment weakened in March with the U.S.-Iran conflict which drove a sharp rise in oil prices, adding renewed inflation pressure at a time when inflation was sticky. At the same time, weaker economic data reduced expectations for the Fed to cut rates. Concerns around AI-driven disruption contributed to increased volatility and a loss of market momentum. We quickly moved the Fund to a defensive position following the onset of the Middle East conflict. While the hostilities between the U.S. and Iran remained unresolved in April, investor sentiment improved as fears of a prolonged disruption eased. As market conditions stabilized, and uptrends reasserted themselves, we gradually increased the Fund’s exposure so that by the end of April, the Fund was fully invested although not leveraged, reflecting a balanced approach. During May, we adjusted allocations modestly by reducing exposure to several lower-performing preferred stock and income-oriented funds and increased exposure to market neutral strategies. We made minor adjustments to the Fund in June, adding a modest amount of leverage. The bulk of the portfolio remained invested in emerging market bond funds and market neutral funds. The Fund continues to strive to be an attractive alternative for investors seeking moderate long-term returns with relatively low volatility. |
|
| Performance Past Does Not Indicate Future [Text] |
The Fund’s past performance is not a good predictor of how the Fund will perform in the future.
|
|
| Line Graph [Table Text Block] |
Table Summary | OnTrack Core Fund | Bloomberg U.S. Aggregate Bond Index | Bloomberg U.S. Treasury Bills: 1-3 Months | S&P 500 Index TR |
|---|
Jun-2016 | $10,000 | $10,000 | $10,000 | $10,000 |
|---|
Jun-2017 | $10,898 | $9,969 | $10,045 | $11,790 |
|---|
Jun-2018 | $10,968 | $9,929 | $10,175 | $13,484 |
|---|
Jun-2019 | $11,055 | $10,710 | $10,405 | $14,889 |
|---|
Jun-2020 | $13,026 | $11,646 | $10,559 | $16,006 |
|---|
Jun-2021 | $15,183 | $11,607 | $10,566 | $22,536 |
|---|
Jun-2022 | $14,456 | $10,413 | $10,585 | $20,144 |
|---|
Jun-2023 | $13,889 | $10,315 | $10,979 | $24,091 |
|---|
Jun-2024 | $15,026 | $10,587 | $11,583 | $30,006 |
|---|
Jun-2025 | $15,001 | $11,230 | $12,134 | $34,556 |
|---|
Jun-2026 | $16,511 | $11,656 | $12,614 | $42,271 |
|---|
|
|
| Average Annual Return [Table Text Block] |
Table Summary | 6 Months | 1 Year | 5 Years | 10 Years |
|---|
OnTrack Core Fund | 4.95% | 10.07% | 1.69% | 5.14% |
|---|
Bloomberg U.S. Aggregate Bond Index | 0.62% | 3.79% | 0.08% | 1.54% |
|---|
Bloomberg U.S. Treasury Bills: 1-3 Months | 1.80% | 3.96% | 3.61% | 2.35% |
|---|
S&P 500 Index TR | 10.21% | 22.32% | 13.41% | 15.51% |
|---|
|
|
| No Deduction of Taxes [Text Block] |
The graph and table do not reflect the deduction of taxes that a shareholder would pay on fund distributions or redemption of fund shares.
|
|
| AssetsNet |
$ 19,959,820
|
|
| Holdings Count | Holding |
13
|
|
| Advisory Fees Paid, Amount |
$ 247,041
|
|
| InvestmentCompanyPortfolioTurnover |
164.00%
|
|
| Additional Fund Statistics [Text Block] |
- Net Assets$19,959,820
- Number of Portfolio Holdings13
- Advisory Fee $247,041
- Portfolio Turnover164%
|
|
| Holdings [Text Block] |
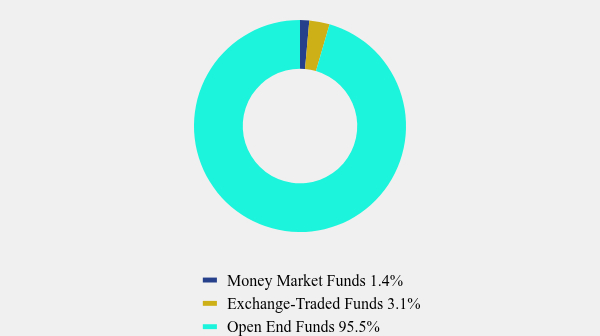
Asset Weighting (% of total investments)Table SummaryValue | Value |
|---|
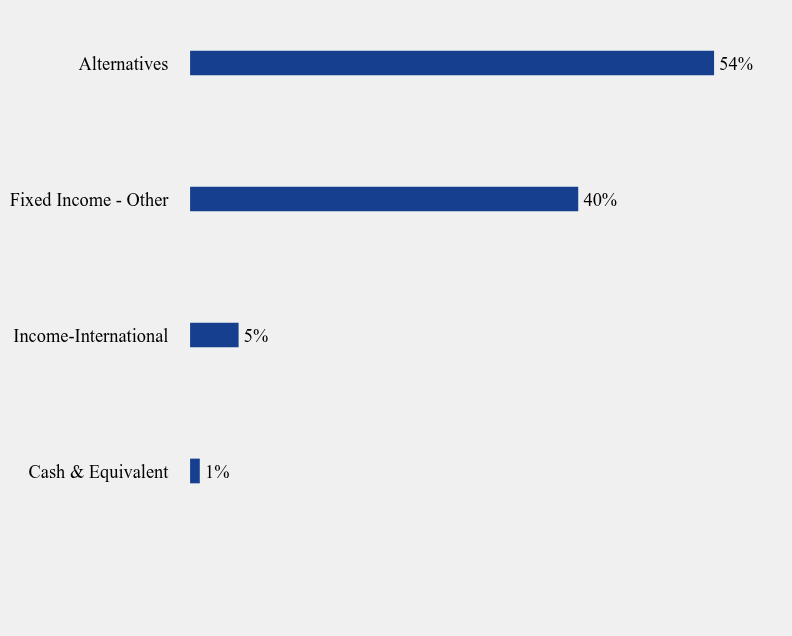
Money Market Funds | 1.4% | Exchange-Traded Funds | 3.1% | Open End Funds | 95.5% | Security Type Weighting (% of total (including notional) exposure)Table SummaryValue | Value |
|---|
Cash & Equivalent | 1% | Income-International | 5% | Fixed Income - Other | 40% | Alternatives | 54% | |
|
| Largest Holdings [Text Block] |
Top 10 Holdings (% of net assets)Table SummaryHolding Name | % of Net Assets |
|---|
Absolute Convertible Arbitrage Fund Institutional Class | 19.8% |
|---|
Eaton Vance Emerging Markets Debt Opportunities Fund Class I | 15.3% |
|---|
Miller Market Neutral Income Fund Class I | 15.2% |
|---|
Victory Pioneer CAT Bond Fund Class Y | 10.2% |
|---|
Catalyst/Millburn Hedge Strategy Fund Class I | 10.2% |
|---|
American Beacon Developing World Income Fund Class Y | 10.1% |
|---|
BlackRock Global Equity Market Neutral Fund Institutional Class | 7.7% |
|---|
Eaton Vance Global Macro Absolute Return Advantage Fund Class I | 5.1% |
|---|
Pacer Aristotle Pacific Floating Rate High Income ETF | 3.0% |
|---|
Fidelity Government Portfolio Institutional Class, 3.520%,
| 0.7% |
|---|
|
|
| Updated Prospectus Web Address |
www.ontrackcore.com/funddocuments
|
|
| C000121122 |
|
|
| Shareholder Report [Line Items] |
|
|
| Fund Name |
OnTrack Core Fund
|
|
| Trading Symbol |
OTRFX
|
|
| Annual or Semi-Annual Statement [Text Block] |
This semi-annual shareholder report contains important information about OnTrack Core Fund for the period of January 1, 2026 to June 30, 2026.
|
|
| Additional Information [Text Block] |
You can find additional information about the Fund at www.ontrackcore.com/funddocuments. You can also request this information by contacting us at (855) 747-9555.
|
|
| Additional Information Phone Number |
(855) 747-9555
|
|
| Additional Information Website |
www.ontrackcore.com/funddocuments
|
|
| Expenses [Text Block] |
What were the Fund’s costs for the last six months?(based on a hypothetical $10,000 investment) Table SummaryClass Name | Costs of a $10,000 investment | Costs paid as a percentage of a $10,000 investment |
|---|
Investor | $134 | 2.63%Footnote Reference* |
|---|
| Footnote | Description | Footnote* | Annualized |
|
|
| Expenses Paid, Amount |
$ 134
|
|
| Expense Ratio, Percent |
2.63%
|
[2] |
| Factors Affecting Performance [Text Block] |
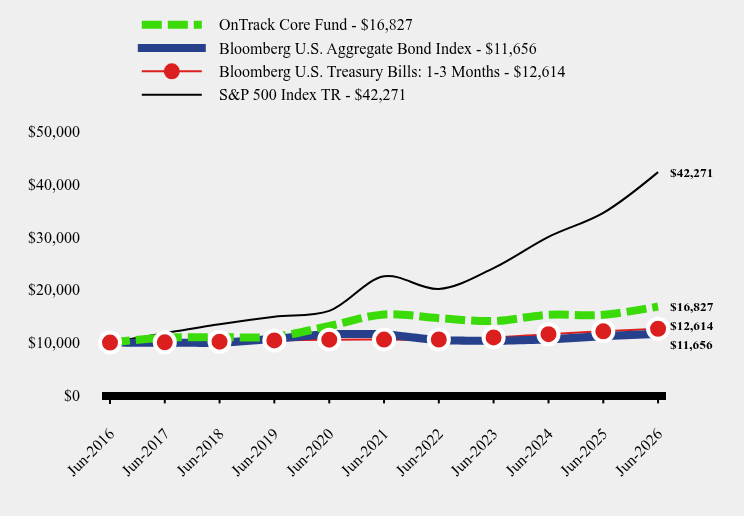
How did the Fund perform during the reporting period? The Fund gained 5.04% for the six months ending June 30, 2026. The Bloomberg 1-3 Months U.S. Treasury Bill index, the Fund’s primary benchmark, earned 1.80% for the same period. Strategy The OnTrack Core Fund seeks total return while keeping the Fund’s volatility and downside risk below that of major equity market indices. We use a flexible approach that emphasizes capital preservation but allows us to adopt a less conservative posture and to increase emphasis on capital appreciation when we believe additional risk is warranted by favorable market conditions. Techniques The market environment entering 2026 was constructive. Growth remained solid, the labor market did not exhibit stress and inflation continued to moderate at the margin. Consistent with these conditions, the Fund was fully invested and leveraged, emphasizing low-volatility bond and income funds, with a meaningful allocation to emerging-market bond strategies. The market environment weakened in March with the U.S.-Iran conflict which drove a sharp rise in oil prices, adding renewed inflation pressure at a time when inflation was sticky. At the same time, weaker economic data reduced expectations for the Fed to cut rates. Concerns around AI-driven disruption contributed to increased volatility and a loss of market momentum. We quickly moved the Fund to a defensive position following the onset of the Middle East conflict. While the hostilities between the U.S. and Iran remained unresolved in April, investor sentiment improved as fears of a prolonged disruption eased. As market conditions stabilized, and uptrends reasserted themselves, we gradually increased the Fund’s exposure so that by the end of April, the Fund was fully invested although not leveraged, reflecting a balanced approach. During May, we adjusted allocations modestly by reducing exposure to several lower-performing preferred stock and income-oriented funds and increased exposure to market neutral strategies. We made minor adjustments to the Fund in June, adding a modest amount of leverage. The bulk of the portfolio remained invested in emerging market bond funds and market neutral funds. The Fund continues to strive to be an attractive alternative for investors seeking moderate long-term returns with relatively low volatility. |
|
| Performance Past Does Not Indicate Future [Text] |
The Fund’s past performance is not a good predictor of how the Fund will perform in the future.
|
|
| Line Graph [Table Text Block] |
Table Summary | OnTrack Core Fund | Bloomberg U.S. Aggregate Bond Index | Bloomberg U.S. Treasury Bills: 1-3 Months | S&P 500 Index TR |
|---|
Jun-2016 | $10,000 | $10,000 | $10,000 | $10,000 |
|---|
Jun-2017 | $10,922 | $9,969 | $10,045 | $11,790 |
|---|
Jun-2018 | $11,017 | $9,929 | $10,175 | $13,484 |
|---|
Jun-2019 | $11,120 | $10,710 | $10,405 | $14,889 |
|---|
Jun-2020 | $13,132 | $11,646 | $10,559 | $16,006 |
|---|
Jun-2021 | $15,336 | $11,607 | $10,566 | $22,536 |
|---|
Jun-2022 | $14,623 | $10,413 | $10,585 | $20,144 |
|---|
Jun-2023 | $14,079 | $10,315 | $10,979 | $24,091 |
|---|
Jun-2024 | $15,255 | $10,587 | $11,583 | $30,006 |
|---|
Jun-2025 | $15,258 | $11,230 | $12,134 | $34,556 |
|---|
Jun-2026 | $16,827 | $11,656 | $12,614 | $42,271 |
|---|
|
|
| Average Annual Return [Table Text Block] |
Table Summary | 6 Months | 1 Year | 5 Years | 10 Years |
|---|
OnTrack Core Fund | 5.04% | 10.28% | 1.87% | 5.34% |
|---|
Bloomberg U.S. Aggregate Bond Index | 0.62% | 3.79% | 0.08% | 1.54% |
|---|
Bloomberg U.S. Treasury Bills: 1-3 Months | 1.80% | 3.96% | 3.61% | 2.35% |
|---|
S&P 500 Index TR | 10.21% | 22.32% | 13.41% | 15.51% |
|---|
|
|
| No Deduction of Taxes [Text Block] |
The graph and table do not reflect the deduction of taxes that a shareholder would pay on fund distributions or redemption of fund shares.
|
|
| AssetsNet |
$ 19,959,820
|
|
| Holdings Count | Holding |
13
|
|
| Advisory Fees Paid, Amount |
$ 247,041
|
|
| InvestmentCompanyPortfolioTurnover |
164.00%
|
|
| Additional Fund Statistics [Text Block] |
- Net Assets$19,959,820
- Number of Portfolio Holdings13
- Advisory Fee $247,041
- Portfolio Turnover164%
|
|
| Holdings [Text Block] |
Asset Weighting (% of total investments)Table SummaryValue | Value |
|---|
Money Market Funds | 1.4% | Exchange-Traded Funds | 3.1% | Open End Funds | 95.5% | Security Type Weighting (% of total (including notional) exposure)Table SummaryValue | Value |
|---|
Cash & Equivalent | 1% | Income-International | 5% | Fixed Income - Other | 40% | Alternatives | 54% | |
|
| Largest Holdings [Text Block] |
Top 10 Holdings (% of net assets)Table SummaryHolding Name | % of Net Assets |
|---|
Absolute Convertible Arbitrage Fund Institutional Class | 19.8% |
|---|
Eaton Vance Emerging Markets Debt Opportunities Fund Class I | 15.3% |
|---|
Miller Market Neutral Income Fund Class I | 15.2% |
|---|
Victory Pioneer CAT Bond Fund Class Y | 10.2% |
|---|
Catalyst/Millburn Hedge Strategy Fund Class I | 10.2% |
|---|
American Beacon Developing World Income Fund Class Y | 10.1% |
|---|
BlackRock Global Equity Market Neutral Fund Institutional Class | 7.7% |
|---|
Eaton Vance Global Macro Absolute Return Advantage Fund Class I | 5.1% |
|---|
Pacer Aristotle Pacific Floating Rate High Income ETF | 3.0% |
|---|
Fidelity Government Portfolio Institutional Class, 3.520%,
| 0.7% |
|---|
|
|
| Updated Prospectus Web Address |
www.ontrackcore.com/funddocuments
|
|
|
|