Shareholder Report
|
6 Months Ended |
|
Jun. 30, 2026
USD ($)
Holding
|
|---|
| Shareholder Report [Line Items] |
|
|
| Document Type |
N-CSRS
|
|
| Amendment Flag |
false
|
|
| Registrant Name |
Advisors Preferred Trust
|
|
| Entity Central Index Key |
0001556505
|
|
| Entity Investment Company Type |
N-1A
|
|
| Document Period End Date |
Jun. 30, 2026
|
|
| Shareholder Report Annual or Semi-Annual |
Semi-Annual Shareholder Report
|
|
| C000143962 |
|
|
| Shareholder Report [Line Items] |
|
|
| Fund Name |
Quantified Gold Futures Tracking Fund
|
|
| Trading Symbol |
QGLCX
|
|
| Annual or Semi-Annual Statement [Text Block] |
This semi-annual shareholder report contains important information about Quantified Gold Futures Tracking Fund for the period of January 1, 2026 to June 30, 2026.
|
|
| Additional Information Phone Number |
(855) 647-8268
|
|
| Additional Information Website |
www.goldbullionstrategyfund.com/index.php/investor-materials
|
|
| Expenses [Text Block] |
What were the Fund’s costs for the last six months?(based on a hypothetical $10,000 investment) Table SummaryClass Name | Costs of a $10,000 investment | Costs paid as a percentage of a $10,000 investment |
|---|
Advisor | $93 | 1.94%Footnote Reference* |
|---|
| Footnote | Description | Footnote* | Annualized |
|
|
| Expenses Paid, Amount |
$ 93
|
|
| Expense Ratio, Percent |
1.94%
|
[1] |
| Factors Affecting Performance [Text Block] |
How did the Fund perform during the reporting period? The Fund returned -7.47% for the six months ended June 30, 2026, as gold gave back its early gains later in the period. The S&P 500 Index, the Fund’s benchmark, gained 10.21%. The S&P GSCI Gold Index earned -7.36% for the period. Strategy The Fund is designed to track the daily price movements of gold; thus, most of its performance is linked to gold’s gains or losses. Techniques Gold continued its momentum from a very strong 2025 into early 2026 on trade uncertainty, central bank demand, and the start of the Iranian war in February. However, those gains were reversed as the period ended with concerns over the future direction of Fed policy. Adhering to its stated investment strategy, the Fund tracked closely with gold prices primarily by using futures contracts. The Fund will continue to execute its investment strategy in an effort to track daily gold prices. |
|
| Performance Past Does Not Indicate Future [Text] |
The Fund’s past performance is not a good predictor of how the Fund will perform in the future.
|
|
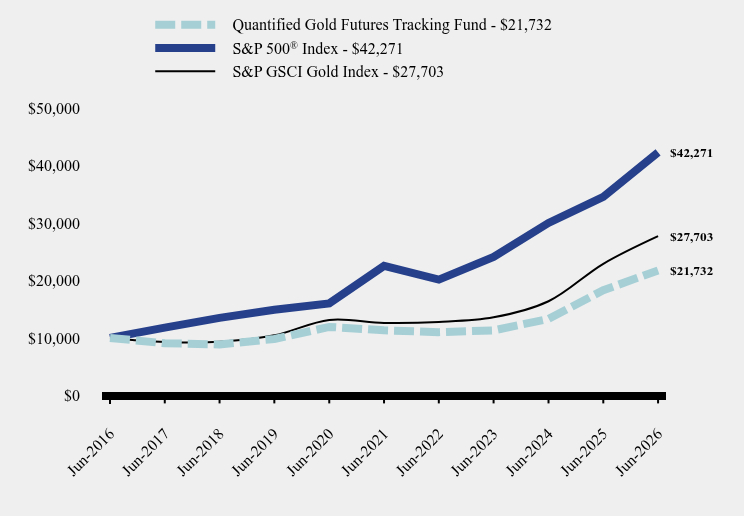
| Line Graph [Table Text Block] |
Table Summary | Quantified Gold Futures Tracking Fund | S&P 500® Index | S&P GSCI Gold Index |
|---|
Jun-2016 | $10,000 | $10,000 | $10,000 |
|---|
Jun-2017 | $9,073 | $11,790 | $9,306 |
|---|
Jun-2018 | $8,860 | $13,484 | $9,325 |
|---|
Jun-2019 | $9,817 | $14,889 | $10,449 |
|---|
Jun-2020 | $11,915 | $16,006 | $13,132 |
|---|
Jun-2021 | $11,315 | $22,536 | $12,616 |
|---|
Jun-2022 | $11,004 | $20,144 | $12,781 |
|---|
Jun-2023 | $11,304 | $24,091 | $13,577 |
|---|
Jun-2024 | $13,299 | $30,006 | $16,376 |
|---|
Jun-2025 | $18,306 | $34,556 | $22,895 |
|---|
Jun-2026 | $21,732 | $42,271 | $27,703 |
|---|
|
|
| Average Annual Return [Table Text Block] |
Table Summary | 6 Months | 1 Year | 5 Years | 10 Years |
|---|
Quantified Gold Futures Tracking Fund | -7.47% | 18.71% | 13.94% | 8.07% |
|---|
S&P 500 Index TR | 10.21% | 22.32% | 13.41% | 15.51% |
|---|
S&P GSCI Gold Index | -7.36% | 21.00% | 17.04% | 10.73% |
|---|
|
|
| No Deduction of Taxes [Text Block] |
The graph and table do not reflect the deduction of taxes that a shareholder would pay on fund distributions or redemption of fund shares.
|
|
| AssetsNet |
$ 115,181,090
|
|
| Holdings Count | Holding |
15
|
|
| Advisory Fees Paid, Amount |
$ 582,193
|
|
| InvestmentCompanyPortfolioTurnover |
47.00%
|
|
| Additional Fund Statistics [Text Block] |
- Net Assets$115,181,090
- Number of Portfolio Holdings15
- Advisory Fee $582,193
- Portfolio Turnover47%
|
|
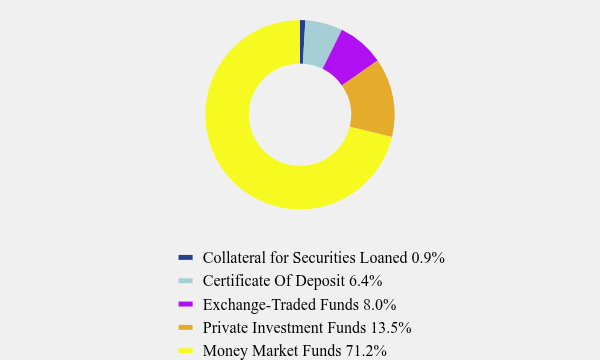
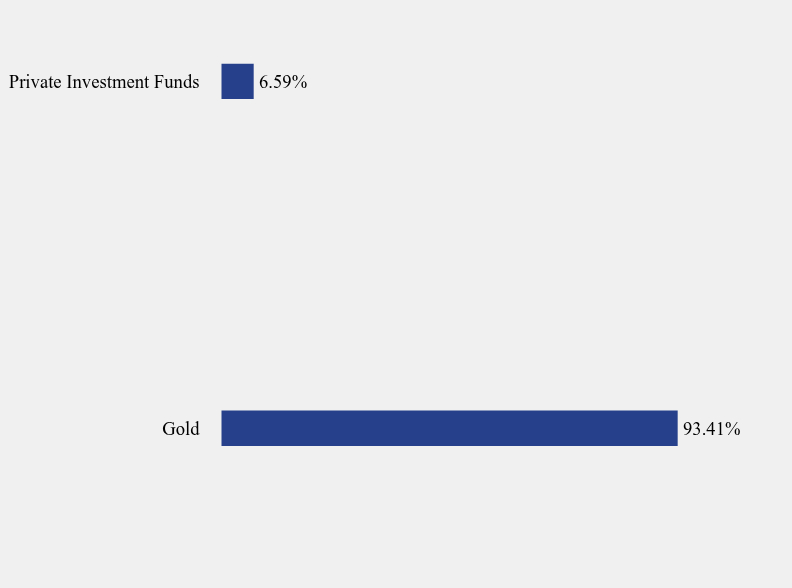
| Holdings [Text Block] |
Asset Weighting (% of total investments)Table SummaryValue | Value |
|---|
Collateral for Securities Loaned | 0.9% | Certificate Of Deposit | 6.4% | Exchange-Traded Funds | 8.0% | Private Investment Funds | 13.5% | Money Market Funds | 71.2% | Security Type Weighting (% of total (including notional) exposure)Table SummaryValue | Value |
|---|
Gold | 93.41% | Private Investment Funds | 6.59% | |
|
| Largest Holdings [Text Block] |
Top 10 Holdings (% of net assets)Table SummaryHolding Name | % of Net Assets |
|---|
Fidelity Government Portfolio Class I, 3.520%,
| 66.2% |
|---|
Hyperion Fund LLC | 9.6% |
|---|
iShares 0-3 Month Treasury Bond ETF | 7.0% |
|---|
Galaxy Plus Fund LLC | 3.2% |
|---|
First American Government Obligations Fund Class Z, 3.519%,
| 1.3% |
|---|
Flushing Bank, 4.000%, 08/12/26
| 0.9% |
|---|
Customers Bank, 4.000%, 08/17/26
| 0.9% |
|---|
ESSA Bank & Trust, 3.700%, 09/25/26
| 0.9% |
|---|
Connexus Credit Union, 4.000%, 08/30/27
| 0.9% |
|---|
Axos Bank, 3.800%, 04/02/27
| 0.9% |
|---|
|
|
| C000126480 |
|
|
| Shareholder Report [Line Items] |
|
|
| Fund Name |
Quantified Gold Futures Tracking Fund
|
|
| Trading Symbol |
QGLDX
|
|
| Annual or Semi-Annual Statement [Text Block] |
This semi-annual shareholder report contains important information about Quantified Gold Futures Tracking Fund for the period of January 1, 2026 to June 30, 2026.
|
|
| Additional Information Phone Number |
(855) 647-8268
|
|
| Additional Information Website |
www.goldbullionstrategyfund.com/index.php/investor-materials
|
|
| Expenses [Text Block] |
What were the Fund’s costs for the last six months?(based on a hypothetical $10,000 investment) Table SummaryClass Name | Costs of a $10,000 investment | Costs paid as a percentage of a $10,000 investment |
|---|
Investor | $64 | 1.34%Footnote Reference* |
|---|
| Footnote | Description | Footnote* | Annualized |
|
|
| Expenses Paid, Amount |
$ 64
|
|
| Expense Ratio, Percent |
1.34%
|
[2] |
| Factors Affecting Performance [Text Block] |
How did the Fund perform during the reporting period? The Fund returned -7.22% for the six months ended June 30, 2026, as gold gave back its early gains later in the period. The S&P 500 Index, the Fund’s benchmark, gained 10.21%. The S&P GSCI Gold Index earned -7.36% for the period. Strategy The Fund is designed to track the daily price movements of gold; thus, most of its performance is linked to gold’s gains or losses. Techniques Gold continued its momentum from a very strong 2025 into early 2026 on trade uncertainty, central bank demand, and the start of the Iranian war in February. However, those gains were reversed as the period ended with concerns over the future direction of Fed policy. Adhering to its stated investment strategy, the Fund tracked closely with gold prices primarily by using futures contracts. The Fund will continue to execute its investment strategy in an effort to track daily gold prices. |
|
| Performance Past Does Not Indicate Future [Text] |
The Fund’s past performance is not a good predictor of how the Fund will perform in the future.
|
|
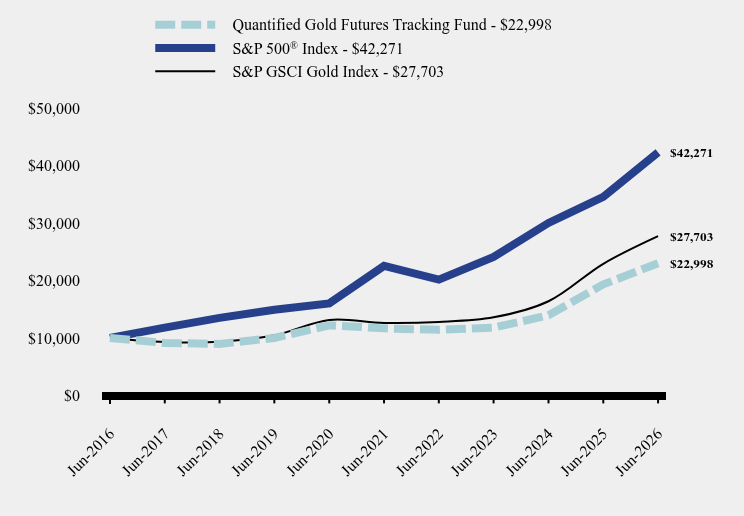
| Line Graph [Table Text Block] |
Table Summary | Quantified Gold Futures Tracking Fund | S&P 500® Index | S&P GSCI Gold Index |
|---|
Jun-2016 | $10,000 | $10,000 | $10,000 |
|---|
Jun-2017 | $9,126 | $11,790 | $9,306 |
|---|
Jun-2018 | $8,963 | $13,484 | $9,325 |
|---|
Jun-2019 | $9,991 | $14,889 | $10,449 |
|---|
Jun-2020 | $12,203 | $16,006 | $13,132 |
|---|
Jun-2021 | $11,660 | $22,536 | $12,616 |
|---|
Jun-2022 | $11,403 | $20,144 | $12,781 |
|---|
Jun-2023 | $11,785 | $24,091 | $13,577 |
|---|
Jun-2024 | $13,943 | $30,006 | $16,376 |
|---|
Jun-2025 | $19,312 | $34,556 | $22,895 |
|---|
Jun-2026 | $22,998 | $42,271 | $27,703 |
|---|
|
|
| Average Annual Return [Table Text Block] |
Table Summary | 6 Months | 1 Year | 5 Years | 10 Years |
|---|
Quantified Gold Futures Tracking Fund | -7.22% | 19.34% | 14.55% | 8.69% |
|---|
S&P 500 Index TR | 10.21% | 22.32% | 13.41% | 15.51% |
|---|
S&P GSCI Gold Index | -7.36% | 21.00% | 17.04% | 10.73% |
|---|
|
|
| No Deduction of Taxes [Text Block] |
The graph and table do not reflect the deduction of taxes that a shareholder would pay on fund distributions or redemption of fund shares.
|
|
| AssetsNet |
$ 115,181,090
|
|
| Holdings Count | Holding |
15
|
|
| Advisory Fees Paid, Amount |
$ 582,193
|
|
| InvestmentCompanyPortfolioTurnover |
47.00%
|
|
| Additional Fund Statistics [Text Block] |
- Net Assets$115,181,090
- Number of Portfolio Holdings15
- Advisory Fee $582,193
- Portfolio Turnover47%
|
|
| Holdings [Text Block] |
Asset Weighting (% of total investments)Table SummaryValue | Value |
|---|
Collateral for Securities Loaned | 0.9% | Certificate Of Deposit | 6.4% | Exchange-Traded Funds | 8.0% | Private Investment Funds | 13.5% | Money Market Funds | 71.2% | Security Type Weighting (% of total (including notional) exposure)Table SummaryValue | Value |
|---|
Gold | 93.41% | Private Investment Funds | 6.59% | |
|
| Largest Holdings [Text Block] |
Top 10 Holdings (% of net assets)Table SummaryHolding Name | % of Net Assets |
|---|
Fidelity Government Portfolio Class I, 3.520%,
| 66.2% |
|---|
Hyperion Fund LLC | 9.6% |
|---|
iShares 0-3 Month Treasury Bond ETF | 7.0% |
|---|
Galaxy Plus Fund LLC | 3.2% |
|---|
First American Government Obligations Fund Class Z, 3.519%,
| 1.3% |
|---|
Flushing Bank, 4.000%, 08/12/26
| 0.9% |
|---|
Customers Bank, 4.000%, 08/17/26
| 0.9% |
|---|
ESSA Bank & Trust, 3.700%, 09/25/26
| 0.9% |
|---|
Connexus Credit Union, 4.000%, 08/30/27
| 0.9% |
|---|
Axos Bank, 3.800%, 04/02/27
| 0.9% |
|---|
|
|
|
|