| Fund (Class) | Costs of a $10,000 Investment | Costs Paid as a Percentage of a $10,000 Investment |
|---|---|---|
| Guinness Atkinson Alternative Energy Fund | $59 | 1.10% |
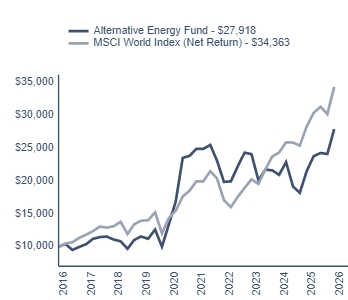
In the first half of 2026, the Guinness Atkinson Alternative Energy Fund produced a total return of 14.96% vs the MSCI World Index (net return) of 9.69%.
Fund performance can be attributed to the following.
Whilst the majority of our top performers have benefitted from improving data centre spending in the first half of the year, we are encouraged by strength across a range of sectors. Chip makers, electrical equipment manufacturers, and building product names are discussed as follows:
Our power electronics names (Infineon, NXP, Amphenol, Sensata) performed well on account of substantial growth in their AI data centre offerings and order intake, supplemented by recovering automotive and industrial end markets. Over the reporting period, Infineon performed strongly as investors responded positively to growth in its AI and data centre business and improving demand trends in its end markets.
The electrical infrastructure companies all performed well, driven by an acceleration in global electrification activity, grid spending and, in select cases (such as Schneider & Legrand), exposure to the data centre sub-sector. Top contributor Prysmian saw a data centre driven recovery in its telecom fibre business as well as announcing three contract awards for large subsea high voltage cables.
Buildings names demonstrated resilience in the half, in spite of new build activity in the US and Europe remaining subdued. Trane Technologies continued to demonstrate strong order intake for its efficient commercial cooling solutions in the US, while Owens Corning rallied sharply after receiving a $10bn takeover offer from fellow portfolio holding Carlisle to create a one stop shop for commercial and residential roofing and insulation products.
Poorer contributors covered various themes and end markets. Chinese clean energy names (Canadian Solar, Xinyi Solar, China Longyuan) continue to suffer the aftereffects of China's transition from fixed feed-in tariffs to market pricing mechanisms for renewables, putting downward pressure on generator margins and reducing demand for equipment. AECOM, (added in April) has performed poorly year-to-date, in spite of record margins and strong bookings on fears that its use of AI tools might interfere with its current business model based on billable hours.
| 6 Months (Actual) | 1 Year | 5 Years | 10 Years | |
|---|---|---|---|---|
| Guinness Atkinson Alternative Energy Fund | 14.96% | 29.85% | 2.31% | 10.81% |
| MSCI World Index (Net Return) | 9.69% | 21.34% | 11.47% | 13.13% |
| Net Assets ($) | $20,990,647 |
|---|---|
| Number of Portfolio Holdings | |
| Portfolio Turnover Rate (%) | 8% |
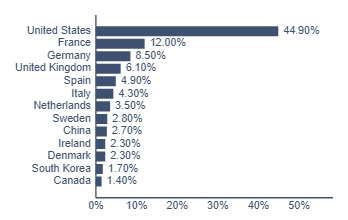
The tables below show the investment makeup of the Fund, representing percentage of the total net assets of the Fund. The Top Ten Holdings and Geographic Allocation exclude short-term holdings, if any.
| Top 10 | % of Net Assets |
|---|---|
| Amphenol Corp | |
| Iberdrola SA | |
| Eaton Corp PLC | |
| Schneider Electric SE | |
| Hubbell Inc | |
| Prysmian SpA | |
| Trane Technologies PLC | |
| Infineon Technologies AG | |
| Siemens AG | |
| Legrand SA |
The tables below show the investment makeup of the Fund, representing percentage of the total net assets of the Fund. The Top Ten Holdings and Geographic Allocation exclude short-term holdings, if any.
| Top 10 | % of Net Assets |
|---|---|
| Amphenol Corp | |
| Iberdrola SA | |
| Eaton Corp PLC | |
| Schneider Electric SE | |
| Hubbell Inc | |
| Prysmian SpA | |
| Trane Technologies PLC | |
| Infineon Technologies AG | |
| Siemens AG | |
| Legrand SA |
| Fund (Class) | Costs of a $10,000 Investment | Costs Paid as a Percentage of a $10,000 Investment |
|---|---|---|
| Guinness Atkinson Asia Focus Fund | $105 | 1.99% |
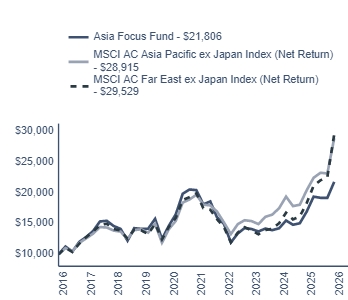
In the first half of 2026, the Guinness Atkinson Asia Focus Fund produced a total return of 13.53% vs the MSCI AC Asia Pacific ex Japan Index (net return) of 23.93%.
What affected the Fund's performance?
Fund performance can be attributed to the following:
Areas which helped the Fund's performance were:
Positive contributions from select stocks in Tech sector including Applied Material, Elite Material and Largan Precision.
Underweight to Financials provided positive relative contributions.
Positive stock selection in Communication Services.
Positive contributions from zero-weights in Materials, Energy, Industrials and Utilities.
Areas which detracted from the Fund's performance were:
Underweight to AI beneficiaries: We do not hold Samsung Electronics. We added SK Hynix to the Fund in the second quarter, but it is held at an underweight (3%) to the benchmark due to our equal weight strategy. TSCM is also held at an underweight (10%). In the second quarter, these three names alone contributed over 78% of the benchmark's total returns.
Overweight to China where weaker domestic confidence continues to drag.
Underweight to Korea, where AI Capex supercycle is driving strength in Samsung and SK Hynix.
| 6 Months (Actual) | 1 Year | 5 Years | 10 Years | |
|---|---|---|---|---|
| Guinness Atkinson Asia Focus Fund | 13.53% | 28.65% | 1.28% | 8.10% |
| MSCI AC Asia Pacific ex Japan Index (Net Return) | 23.93% | 40.75% | 7.32% | 10.56% |
| MSCI AC Far East ex Japan Index (Net Return) | 33.82% | 61.07% | 8.17% | 11.43% |
| Net Assets ($) | $11,957,685 |
|---|---|
| Number of Portfolio Holdings | |
| Portfolio Turnover Rate (%) | 11% |
The tables below show the investment makeup of the Fund, representing percentage of the total net assets of the Fund. The Top Ten Holdings and Industry Allocation exclude short-term holdings, if any.
| Top 10 | % of Net Assets |
|---|---|
| Samsung Electronics Co Ltd | |
| Elite Material Co Ltd | |
| Taiwan Semiconductor Manufacturing Co Ltd | |
| Applied Materials Inc | |
| Largan Precision Co Ltd | |
| DBS Group Holdings | |
| Weichai Power Co Ltd - H Shares | |
| NetEase Inc - ADR | |
| HDFC Bank Ltd | |
| Broadcom Inc |
| Sector | % of Net Assets |
|---|---|
| Electronic Components - Semiconductor | |
| Electronic Component Miscellaneous | |
| Semiconductor Components - Integrated Circuits | |
| E-Commerce/Services | |
| Photo Equipment & Supplies | |
| Commercial Banks | |
| Auto/Truck Parts & Equipment | |
| Entertainment Software | |
| Banks | |
| Machinery - General Industries | |
| Machinery - Industrial Machinery | |
| Machinery | |
| Internet Application Software | |
| Auto - Cars/Light Trucks | |
| Insurance | |
| Metal Processors & Fabricators | |
| Food - Dairy Products | |
| Machinery - Construction & Mining | |
| MRI/Medical Diagnostic Imaging | |
| Medical Products | |
| E-Commerce/Products | |
| Rental Auto/Equipment | |
| Personal Care Products | |
| Internet & Direct Marketing Retail | |
| Textile - Apparel | |
| Pharmaceuticals | |
| Travel Services |
The tables below show the investment makeup of the Fund, representing percentage of the total net assets of the Fund. The Top Ten Holdings and Industry Allocation exclude short-term holdings, if any.
| Top 10 | % of Net Assets |
|---|---|
| Samsung Electronics Co Ltd | |
| Elite Material Co Ltd | |
| Taiwan Semiconductor Manufacturing Co Ltd | |
| Applied Materials Inc | |
| Largan Precision Co Ltd | |
| DBS Group Holdings | |
| Weichai Power Co Ltd - H Shares | |
| NetEase Inc - ADR | |
| HDFC Bank Ltd | |
| Broadcom Inc |
| Fund (Class) | Costs of a $10,000 Investment | Costs Paid as a Percentage of a $10,000 Investment |
|---|---|---|
| Guinness Atkinson China & Hong Kong Fund | $86 | 1.83% |
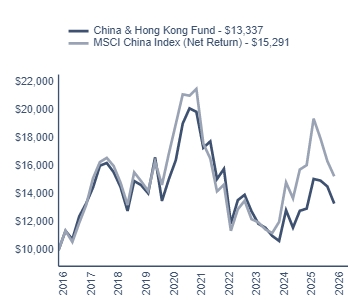
In the first half of 2026, the Guinness Atkinson China & Hong Kong Fund produced a total return of -10.95% vs the MSCI China Index (net return) of -14.97%.
What affected the Fund's performance?
Fund performance can be attributed to the following:
Areas which helped the Fund's relative performance were:
The structural underweight to Tencent and Alibaba. The Fund is run on an equally weighted basis and so each position has a neutral weight of 3.3%. As Tencent and Alibaba underperformed, the structural underweight position benefited the Fund in relative terms.
A combination of the overweight in Industrials and stock selection, driven by Weichai Power.
The underweight to Materials which underperformed.
Areas which detracted from the Fund's relative performance were:
The underweight in Information Technology, which significantly outperformed.
The underweight to Financials which outperformed, as well as stock selection driven by China Merchants Bank, AIA Group and Hong Kong Exchanges and Clearing.
Stock selection in Healthcare, driven by Sino Biopharmaceutical.
| 6 Months (Actual) | 1 Year | 5 Years | 10 Years | |
|---|---|---|---|---|
| Guinness Atkinson China & Hong Kong Fund | -10.95% | 2.82% | -7.69% | 2.92% |
| MSCI China Index (Net Return) | -14.97% | -4.94% | -6.62% | 4.34% |
| Net Assets ($) | $22,635,040 |
|---|---|
| Number of Portfolio Holdings | |
| Portfolio Turnover Rate (%) | 3% |
The tables below show the investment makeup of the Fund, representing percentage of the total net assets of the Fund. The Top Ten Holdings and Geographic Allocation exclude short-term holdings, if any.
| Top 10 | % of Net Assets |
|---|---|
| Hongfa Technology Co Ltd | |
| Hangzhou First Applied Materials | |
| Tencent Holdings Ltd | |
| Midea Group Co Ltd | |
| Weichai Power Co Ltd - H Shares | |
| NetEase Inc - ADR | |
| Inner Mongolia Yili - A Shares | |
| AIA Group Ltd | |
| Baidu Inc | |
| Shenzhen Inovance Technology Co Ltd. |
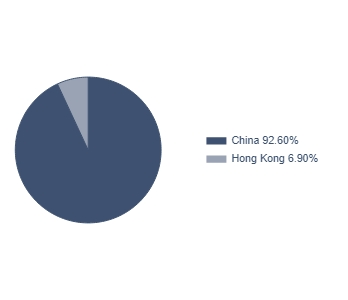
The tables below show the investment makeup of the Fund, representing percentage of the total net assets of the Fund. The Top Ten Holdings and Geographic Allocation exclude short-term holdings, if any.
| Top 10 | % of Net Assets |
|---|---|
| Hongfa Technology Co Ltd | |
| Hangzhou First Applied Materials | |
| Tencent Holdings Ltd | |
| Midea Group Co Ltd | |
| Weichai Power Co Ltd - H Shares | |
| NetEase Inc - ADR | |
| Inner Mongolia Yili - A Shares | |
| AIA Group Ltd | |
| Baidu Inc | |
| Shenzhen Inovance Technology Co Ltd. |
| Fund (Class) | Costs of a $10,000 Investment | Costs Paid as a Percentage of a $10,000 Investment |
|---|---|---|
| Guinness Atkinson Global Energy Fund | $80 | 1.46% |
In the first half of 2026, the Guinness Atkinson Global Energy Fund produced a total return of 20.61% vs the MSCI World Index (net return) of 9.69%.
What affected the Fund's performance?
Fund performance can be attributed to the following.
Within the Global Energy Fund over the period, stronger performers included:
European mid-cap integrateds: Repsol, GALP, Eni and OMV were among the strongest contributors during the first phase of the Iran conflict, helped by higher Brent-linked earnings and elevated refining margins.
Oil services: Baker Hughes, Schlumberger and Halliburton performed well, supported at different points by expectations of higher service activity outside the Middle East, a rebuilding of damaged Gulf based oil & gas facilities, plus growth of LNG demand.
Canadian integrateds and oil sands: Canadian Natural Resources, Suncor, Cenovus and Imperial Oil benefited from stronger oil prices and a renewed appreciation of secure, non-Middle Eastern supply.US refining: Valero and refining-linked parts of the majors (e.g. Exxon) were supported by tight product markets and the increasing importance of refinery flexibility as crude flows altered.
Sectors in the portfolio that were relatively weaker over the period included:
Emerging market oils: PetroChina and Sinopec lagged over the period as Chinese government caps on refined product prices resulted in lower profitability for the Chinese majors versus Western peers.
North American midstream: Enbridge, Kinder Morgan and TC Energy performed respectably in absolute terms, but with lower operating leverage to rising oil and gas prices than upstream focused companies, were relative underperformers.
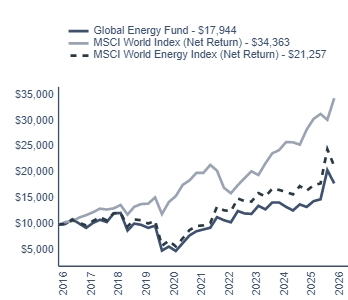
| 6 Months (Actual) | 1 Year | 5 Years | 10 Years | |
|---|---|---|---|---|
| Guinness Atkinson Global Energy Fund | 20.61% | 33.87% | 15.53% | 6.02% |
| MSCI World Index (Net Return) | 9.69% | 21.34% | 11.47% | 13.13% |
| MSCI World Energy Index (Net Return) | 18.51% | 28.45% | 16.92% | 7.83% |
| Net Assets ($) | $12,555,018 |
|---|---|
| Number of Portfolio Holdings | |
| Portfolio Turnover Rate (%) | 15% |
The tables below show the investment makeup of the Fund, representing percentage of the total net assets of the Fund. The Top Ten Holdings and Geographic Allocation exclude short-term holdings, if any.
| Top 10 | % of Net Assets |
|---|---|
| Exxon Mobil Corp | |
| Valero Energy Corp | |
| TotalEnergies SE | |
| Chevron Corp | |
| BP PLC | |
| Shell PLC | |
| ConocoPhillips | |
| Repsol SA | |
| Canadian Natural Resources Ltd | |
| Cenovus Energy Inc |
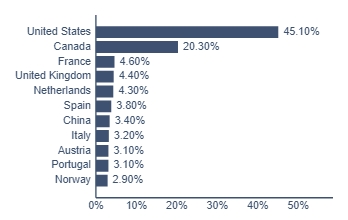
The tables below show the investment makeup of the Fund, representing percentage of the total net assets of the Fund. The Top Ten Holdings and Geographic Allocation exclude short-term holdings, if any.
| Top 10 | % of Net Assets |
|---|---|
| Exxon Mobil Corp | |
| Valero Energy Corp | |
| TotalEnergies SE | |
| Chevron Corp | |
| BP PLC | |
| Shell PLC | |
| ConocoPhillips | |
| Repsol SA | |
| Canadian Natural Resources Ltd | |
| Cenovus Energy Inc |
| Fund (Class) | Costs of a $10,000 Investment | Costs Paid as a Percentage of a $10,000 Investment |
|---|---|---|
| Investor Class | $64 | 1.24% |
In the first half of 2026, the Guinness Atkinson Global Innovators Fund – Investor Class produced a total return of 7.19% vs the MSCI World Index (net return) of 9.69%.
Fund performance can be attributed to:
The Fund benefitted from its overweight position to the Information Technology sector as it outperformed the broader index (+21.6% vs +9.7% in USD). This was supported by positive stock selection within the sector as Fund holdings including Applied Materials (+181.8% in USD), KLA (+148.8%), and Lam Research (+153.5%) delivered robust returns above the MSCI World Information Technology sector.
From an asset allocation perspective, the Fund's overweight position to Communication Services was a drag as the sector underperformed the wider benchmark (-0.2% vs +9.7%). Further, Fund holding Netflix (-23.8%) disappointed by not raising their full year guidance. This created a stock selection headwind, despite the company recently printing a solid set of quarterly results.
The Fund saw a tailwind from a zero-weight allocation to some of the benchmark's weaker sectors including Utilities (+8.9%), Real Estate (+6.6%), and Materials (+9.3%). The headwind faced in the first quarter from having no exposure to Energy partially reversed in the second quarter, with investors rotating away from the sector as progress was made towards de-escalating the US-Iran conflict that has affected energy supplies.
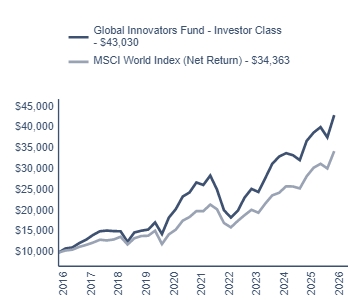
| 6 Months (Actual) | 1 Year | 5 Years | 10 Years | |
|---|---|---|---|---|
| Guinness Atkinson Global Innovators Fund - Investor Class | 7.19% | 16.83% | 9.91% | 15.71% |
| MSCI World Index (Net Return) | 9.69% | 21.34% | 11.47% | 13.13% |
| Net Assets ($) | $197,426,314 |
|---|---|
| Number of Portfolio Holdings | |
| Portfolio Turnover Rate (%) | 15% |
The tables below show the investment makeup of the Fund, representing percentage of the total net assets of the Fund. The Top Ten Holdings and Geographic Allocation exclude short-term holdings, if any.
| Top 10 | % of Net Assets |
|---|---|
| KLA-Tencor Corp | |
| Applied Materials Inc | |
| Lam Research Corp | |
| Advanced Micro Devices Inc | |
| Taiwan Semiconductor Manufacturing Co Ltd | |
| ABB Ltd | |
| Broadcom Inc | |
| Amphenol Corp | |
| Alphabet Inc - A Shares | |
| Amazon.com Inc |
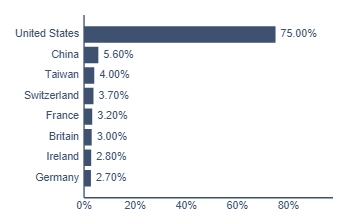
The tables below show the investment makeup of the Fund, representing percentage of the total net assets of the Fund. The Top Ten Holdings and Geographic Allocation exclude short-term holdings, if any.
| Top 10 | % of Net Assets |
|---|---|
| KLA-Tencor Corp | |
| Applied Materials Inc | |
| Lam Research Corp | |
| Advanced Micro Devices Inc | |
| Taiwan Semiconductor Manufacturing Co Ltd | |
| ABB Ltd | |
| Broadcom Inc | |
| Amphenol Corp | |
| Alphabet Inc - A Shares | |
| Amazon.com Inc |
| Fund (Class) | Costs of a $10,000 Investment | Costs Paid as a Percentage of a $10,000 Investment |
|---|---|---|
| Institutional Class | $51 | 0.99% |
In the first half of 2026, the Guinness Atkinson Global Innovators Fund – Institutional Class produced a total return of 7.33% vs the MSCI World Index (net return) of 9.69%.
Fund performance can be attributed to:
The Fund benefitted from its overweight position to the Information Technology sector as it outperformed the broader index (+21.6% vs +9.7% in USD). This was supported by positive stock selection within the sector as Fund holdings including Applied Materials (+181.8% in USD), KLA (+148.8%), and Lam Research (+153.5%) delivered robust returns above the MSCI World Information Technology sector.
From an asset allocation perspective, the Fund's overweight position to Communication Services was a drag as the sector underperformed the wider benchmark (-0.2% vs +9.7%). Further, Fund holding Netflix (-23.8%) disappointed by not raising their full year guidance. This created a stock selection headwind, despite the company recently printing a solid set of quarterly results.
The Fund saw a tailwind from a zero-weight allocation to some of the benchmark's weaker sectors including Utilities (+8.9%), Real Estate (+6.6%), and Materials (+9.3%). The headwind faced in the first quarter from having no exposure to Energy partially reversed in the second quarter, with investors rotating away from the sector as progress was made towards de-escalating the US-Iran conflict that has affected energy supplies.
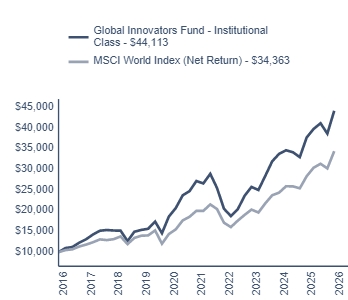
| 6 Months (Actual) | 1 Year | 5 Years | 10 Years | |
|---|---|---|---|---|
| Guinness Atkinson Global Innovators Fund - Institutional Class | 7.33% | 17.12% | 10.18% | 16.00% |
| MSCI World Index (Net Return) | 9.69% | 21.34% | 11.47% | 13.13% |
| Net Assets ($) | $197,426,314 |
|---|---|
| Number of Portfolio Holdings | |
| Portfolio Turnover Rate (%) | 15% |
The tables below show the investment makeup of the Fund, representing percentage of the total net assets of the Fund. The Top Ten Holdings and Geographic Allocation exclude short-term holdings, if any.
| Top 10 | % of Net Assets |
|---|---|
| KLA-Tencor Corp | |
| Applied Materials Inc | |
| Lam Research Corp | |
| Advanced Micro Devices Inc | |
| Taiwan Semiconductor Manufacturing Co Ltd | |
| ABB Ltd | |
| Broadcom Inc | |
| Amphenol Corp | |
| Alphabet Inc - A Shares | |
| Amazon.com Inc |
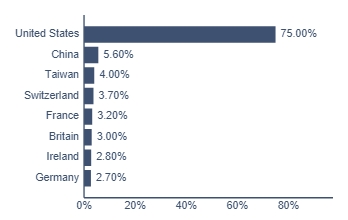
The tables below show the investment makeup of the Fund, representing percentage of the total net assets of the Fund. The Top Ten Holdings and Geographic Allocation exclude short-term holdings, if any.
| Top 10 | % of Net Assets |
|---|---|
| KLA-Tencor Corp | |
| Applied Materials Inc | |
| Lam Research Corp | |
| Advanced Micro Devices Inc | |
| Taiwan Semiconductor Manufacturing Co Ltd | |
| ABB Ltd | |
| Broadcom Inc | |
| Amphenol Corp | |
| Alphabet Inc - A Shares | |
| Amazon.com Inc |
| Fund (Class) | Costs of a $10,000 Investment | Costs Paid as a Percentage of a $10,000 Investment |
|---|---|---|
| Guinness Atkinson Asia Pacific Dividend Builder ETF | $39 | 0.78% |
In the first half of 2026, the Guinness Atkinson Asia Pacific Dividend Builder ETF produced a total return of 3.92% vs the MSCI AC Asia Pacific ex Japan Index (net return) of 23.93%.
What affected the Fund's performance?
Fund performance can be attributed to the following:
Areas which helped the Fund's performance were:
Positive contributions from Elite Material, Largan Precision and Novatek. Microelectronics in the Tech sector, all benefitting from the continued interest in AI.
Communication Services, both from our relative underweight, as well as positive stock. selection (namely not holding Alibaba or Tencent).
Zero-weights in Materials, Energy and Industrials.
Underweight in India, where we only hold one name (Tech Mahindra).
Stock Selection in Hong Kong, again from not holding Alibaba or Tencent.
Areas which detracted from the Fund's performance were:
Zero-weight and underweight to AI beneficiaries: Samsung Electronics and SK hynix do not sit within the Fund's investable universe, TSCM is held at an underweight (our equal weight strategy means we are c10% underweight the benchmark). In the first half of this year, these three names contributed over 78% of the benchmark's total returns.
Overweight to China where weaker domestic confidence continues to drag.
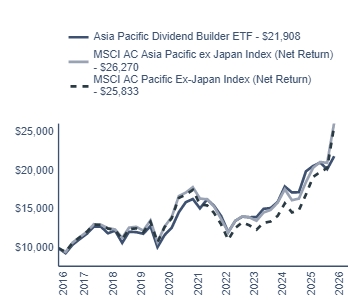
| 6 Months (Actual) | 1 Year | 5 Year | 10 Year | |
|---|---|---|---|---|
| Asia Pacific Dividend Builder ETF | 3.92% | 9.79% | 6.00% | 9.10% |
| MSCI AC Asia Pacific ex Japan Index (Net Return) | 23.93% | 40.75% | 7.32% | 10.56% |
| MSCI AC Pacific ex Japan Index (Net Return) | 29.98% | 52.27% | 8.03% | 11.00% |
| Net Assets ($) | $53,555,943 |
|---|---|
| Number of Portfolio Holdings | |
| Portfolio Turnover Rate (%) | 10% |
The tables below show the investment makeup of the Fund, representing percentage of the total net assets of the Fund. The Top Ten Holdings and Sector Allocation exclude short-term holdings, if any.
| Top 10 | % of Net Assets |
|---|---|
| Taiwan Semiconductor Manufacturing Co Ltd | |
| Elite Material Co Ltd | |
| Novatek Microelectronics Corp | |
| BOC Hong Kong Holdings Ltd | |
| NetEase Inc - ADR | |
| DBS Group Holdings | |
| Industrial & Commercial Bank of China Ltd - H Shares | |
| China Construction Bank Corp - H Shares | |
| Broadcom Inc | |
| Nien Made Enterprise Co |
| Sector | % of Net Assets |
|---|---|
| Financial | |
| Technology | |
| Consumer, Cyclical | |
| Industrial | |
| Consumer, Non-cyclical | |
| Utilities |
The tables below show the investment makeup of the Fund, representing percentage of the total net assets of the Fund. The Top Ten Holdings and Sector Allocation exclude short-term holdings, if any.
| Top 10 | % of Net Assets |
|---|---|
| Taiwan Semiconductor Manufacturing Co Ltd | |
| Elite Material Co Ltd | |
| Novatek Microelectronics Corp | |
| BOC Hong Kong Holdings Ltd | |
| NetEase Inc - ADR | |
| DBS Group Holdings | |
| Industrial & Commercial Bank of China Ltd - H Shares | |
| China Construction Bank Corp - H Shares | |
| Broadcom Inc | |
| Nien Made Enterprise Co |
| Fund (Class) | Costs of a $10,000 Investment | Costs Paid as a Percentage of a $10,000 Investment |
|---|---|---|
| Guinness Atkinson Dividend Builder ETF | $25 | 0.49% |
In the first half of 2026, the Guinness Atkinson Dividend Builder ETF produced a total return of 7.11% vs the MSCI World Index (net return) of 9.69%.
Fund performance can be attributed to:
The large overweight allocation to Consumer Staples (6.3%, USD) was a headwind to relative performance since the sector underperformed the market, whilst the Fund's underweight allocation to Communication Services (-0.1%, USD) and Consumer Discretionary (-2.8%, USD) was a positive tailwind.
Although the Fund's underweight allocation to Information Technology (21.7%, USD) was a detractor to the Fund's relative performance, stock selection more than offset the negative allocation effect. More specifically, Cisco (54.1%, USD), TSMC (57.9%, USD) and Texas Instruments (73.8%, USD) performed strongly over the first half of the year as the holdings benefited from rampant demand towards data centre components.
Although the Fund's overweight allocation to Health Care (2.2%, USD) was a headwind to performance, positive stock selection thanks to Johnson and Johnson (24.1%, USD) and AbbVie (11.9%, USD) reduced much of the negative allocation effect.
The Fund's overweight allocation to Industrials was a tailwind to the Fund's relative performance, with particularly strong performance from ABB (42.2%, USD) and Eaton (33%, USD).
The Fund's zero allocation to Utilities, Materials, and Real Estate, acted as a marginal tailwind to relative Fund performance, whereas the Fund's zero allocation to Energy (19.0%, USD) was a strong headwind to relative performance.
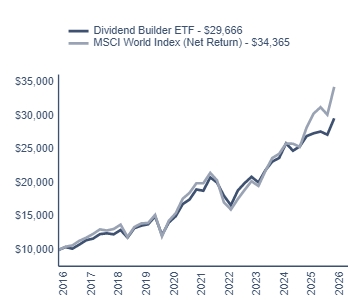
| 6 Months (Actual) | 1 Year | 5 Year | 10 Year | |
|---|---|---|---|---|
| Dividend Builder ETF | 7.11% | 9.82% | 9.28% | 11.49% |
| MSCI World Index (Net Return) | 9.69% | 21.34% | 11.47% | 13.13% |
| Net Assets ($) | $38,465,820 |
|---|---|
| Number of Portfolio Holdings | |
| Portfolio Turnover Rate (%) | 10% |
The tables below show the investment makeup of the Fund, representing percentage of the total net assets of the Fund. The Top Ten Holdings and Sector Allocation exclude short-term holdings, if any.
| Top 10 | % of Net Assets |
|---|---|
| Cisco Systems Inc | |
| Texas Instruments Inc | |
| Taiwan Semiconductor Manufacturing Co Ltd | |
| Broadcom Inc | |
| Eaton Corp PLC | |
| ABB Ltd | |
| AbbVie Inc | |
| Publicis Groupe SA | |
| The Coca-Cola Co - ADR | |
| Johnson & Johnson |
| Sector | % of Net Assets |
|---|---|
| Consumer, Non-cyclical | |
| Industrial | |
| Technology | |
| Financial | |
| Communications | |
| Consumer, Cyclical |
The tables below show the investment makeup of the Fund, representing percentage of the total net assets of the Fund. The Top Ten Holdings and Sector Allocation exclude short-term holdings, if any.
| Top 10 | % of Net Assets |
|---|---|
| Cisco Systems Inc | |
| Texas Instruments Inc | |
| Taiwan Semiconductor Manufacturing Co Ltd | |
| Broadcom Inc | |
| Eaton Corp PLC | |
| ABB Ltd | |
| AbbVie Inc | |
| Publicis Groupe SA | |
| The Coca-Cola Co - ADR | |
| Johnson & Johnson |
| Fund (Class) | Costs of a $10,000 Investment | Costs Paid as a Percentage of a $10,000 Investment |
|---|---|---|
| Guinness Atkinson International Dividend Builder ETF | $23 | 0.46% |
| Net Assets ($) | $369,448 |
|---|---|
| Number of Portfolio Holdings | |
| Portfolio Turnover Rate (%) | 4% |
The Fund held no portfolio investments as of June 30, 2026. The Fund's sole asset consisted of cash pending distribution in connection with the Fund's liquidation.
The Fund liquidated on June 30, 2026.
| Fund (Class) | Costs of a $10,000 Investment | Costs Paid as a Percentage of a $10,000 Investment |
|---|---|---|
| Guinness Atkinson Real Assets Income ETF | $23 | 0.45% |
In the first half of 2026, the Guinness Atkinson Real Assets Income ETF produced a total return of 10.18% vs the MSCI World Index (net return) of 9.69%.
What affected the Fund's performance?
Fund performance can be attributed to the following:
Areas which helped the Fund's performance were:
Stock selection in Utilities, driven by Elia Group, American Electric Power, Alliant Energy and Iberdrola. These companies benefited from increasing electricity demand, the need for further investment in power grids and the defensive nature of their regulated earnings.
Stock selection in Real Estate, led by Equinix, Digital Realty, Welltower and Ventas. Data-centre REITs benefited from continued spending on AI infrastructure, while US senior-housing REITs continued to benefit from strong demand and limited new supply. The Fund's lower exposure to telecommunications towers was also helpful, as tower REITs were relatively weak over the period.
Infratil: Infratil was a strong contributor after its portfolio company, CDC, announced a 555MW, 30-year Australian data-centre contract with a leading US hyperscaler. The contract increased CDC's contracted capacity to more than 1GW and demonstrated the scale of demand for data-centre infrastructure
Areas which detracted from the Fund's relative performance were:
The underweight to Energy: Energy was the strongest area of the benchmark over the first half, helped by higher oil prices following the conflict in the Middle East. The Fund's lower exposure to energy infrastructure therefore detracted from relative performance.
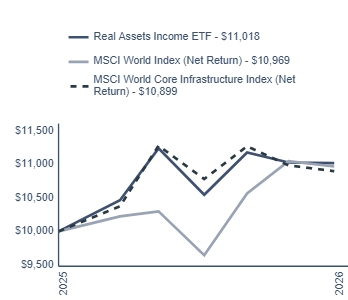
| 6 Months (Actual) | Since Inception (12/19/2025) | |
|---|---|---|
| Guinness Atkinson Real Assets Income ETF | 10.18% | 11.59% |
| MSCI World Index (Net Return) | 9.69% | 10.14% |
| MSCI World Core Infrastructure Index (Net Return) | 9.00% | 10.28% |
| Net Assets ($) | $411,611 |
|---|---|
| Number of Portfolio Holdings | |
| Portfolio Turnover Rate (%) | 6% |
The tables below show the investment makeup of the Fund, representing percentage of the total net assets of the Fund. The Top Ten Holdings and Geographic Allocation exclude short-term holdings, if any.
| Top 10 | % of Net Assets |
|---|---|
| Infratil Ltd | |
| Elia Group SA/NV | |
| Welltower Inc | |
| Equinix Inc | |
| Ventas Inc | |
| Iberdrola SA | |
| Union Pacific Corp | |
| 3i Infrastructure PLC | |
| American Electric Power Co Inc | |
| Greencoat UK Wind PLC/Funds |
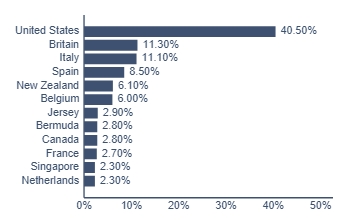
The tables below show the investment makeup of the Fund, representing percentage of the total net assets of the Fund. The Top Ten Holdings and Geographic Allocation exclude short-term holdings, if any.
| Top 10 | % of Net Assets |
|---|---|
| Infratil Ltd | |
| Elia Group SA/NV | |
| Welltower Inc | |
| Equinix Inc | |
| Ventas Inc | |
| Iberdrola SA | |
| Union Pacific Corp | |
| 3i Infrastructure PLC | |
| American Electric Power Co Inc | |
| Greencoat UK Wind PLC/Funds |
| Fund (Class) | Costs of a $10,000 Investment | Costs Paid as a Percentage of a $10,000 Investment |
|---|---|---|
| Guinness Atkinson US Dividend Builder ETF | $17 | 0.35% |
| Net Assets ($) | $244,017 |
|---|---|
| Number of Portfolio Holdings | |
| Portfolio Turnover Rate (%) | 1% |
The Fund held no portfolio investments as of June 30, 2026. The Fund's sole asset consisted of cash pending distribution in connection with the Fund's liquidation.
The Fund liquidated on June 30, 2026.
| Fund (Class) | Costs of a $10,000 Investment | Costs Paid as a Percentage of a $10,000 Investment |
|---|---|---|
| Guinness Atkinson Smart Transportation & Technology ETF | $37 | 0.68% |
In 1H 2026, the Guinness Atkinson Smart Transportation & Technology ETF produced a total return of 21.04% vs the MSCI World Index (net return) of 9.69%.
What affected the Fund's performance?
Fund performance can be attributed to the following:
Electronics (38.9% exposure) was the strongest category over the period, delivering an average return of +50.2% over the period. Equipment (34.0% exposure) was the second strongest category, returning +15.0% on average in the first half of the year. The weakest category was EV manufacturers (17.6% exposure), where the average company delivered -7.6% over the period.
Within the Electronics category, Power Integrations (+137.3%), Renesas Electronics (+115.9%), and Infineon (+112.4%) were notable performers. All three benefited from robust growth in AI data centre spending and increasing confidence in the durability of this investment cycle. All three companies also benefited from a cyclical recovery in auto and industrial end markets.
Within Equipment, we hold a 55.3% weighting to Components, a 34.9% weighting to Autonomous, and a 9.8% weighting to Batteries. The average Components name returned +4.2%, the average Autonomous position delivered +8.0%, and the average Batteries name returned +24.3% in the period. Within Equipment, the Batteries subsegment was boosted by strong performance from Samsung SDI, who benefitted from improving demand visibility across ESS in the US and robust EV demand in Europe. The company has also been bolstered by reports of potential collaboration with Hyundai Motor Group on solid-state batteries for early-stage robotics applications, building on an existing partnership in next generation battery technologies.
The Fund's three top performers were Power Integrations (+137.3%), Renesas Electronics (+115.9%), and Infineon (+112.4%). As described above, all 3 names benefitted from robust growth in data centre spending and increased confidence in the durability of this investment cycle, as well as a cyclical recovery in auto and industrial end markets.
The Fund's three weakest performers were Volkswagen (-29.8%), Mercedes Benz (-24.3%) and BYD (-24.2%). Shares in Volkswagen have weakened in recent months as investors have become increasingly concerned about the European macroeconomic outlook. Higher energy prices, rising interest rates and stagflation risks following the conflict in Iran have weighed on expectations for consumer demand, particularly for discretionary purchases such as new vehicles. Share price performance also reflects concerns around intensifying Chinese competition, the company's ongoing restructuring efforts and broader trade uncertainty.
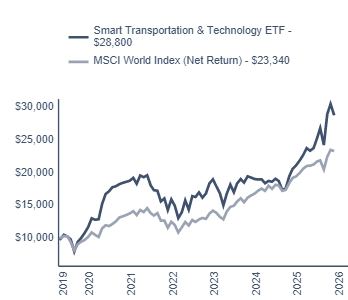
| 6 Months (Actual) | 1 Year | 5 Year | Since Inception (11/14/2019) | |
|---|---|---|---|---|
| Smart Transportation & Technology ETF | 21.04% | 39.57% | 9.09% | 17.31% |
| MSCI World Index (Net Return) | 9.69% | 21.34% | 11.47% | 13.77% |
| Net Assets ($) | $9,717,418 |
|---|---|
| Number of Portfolio Holdings | |
| Portfolio Turnover Rate (%) | 0% |
The tables below show the investment makeup of the Fund, representing percentage of the total net assets of the Fund. The Top Ten Holdings and Geographical Allocation exclude short-term holdings, if any.
| Top 10 | % of Net Assets |
|---|---|
| Taiwan Semiconductor Manufacturing Co Ltd | |
| Infineon Technologies AG | |
| Quanta Services Inc | |
| Amphenol Corp | |
| Analog Devices Inc | |
| Alphabet Inc | |
| NVIDIA Corp | |
| Eaton Corp PLC | |
| Renesas Electronics Corp | |
| Siemens AG |
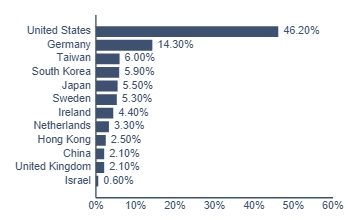
The tables below show the investment makeup of the Fund, representing percentage of the total net assets of the Fund. The Top Ten Holdings and Geographical Allocation exclude short-term holdings, if any.
| Top 10 | % of Net Assets |
|---|---|
| Taiwan Semiconductor Manufacturing Co Ltd | |
| Infineon Technologies AG | |
| Quanta Services Inc | |
| Amphenol Corp | |
| Analog Devices Inc | |
| Alphabet Inc | |
| NVIDIA Corp | |
| Eaton Corp PLC | |
| Renesas Electronics Corp | |
| Siemens AG |
| Fund (Class) | Costs of a $10,000 Investment | Costs Paid as a Percentage of a $10,000 Investment |
|---|---|---|
| Guinness Atkinson Sustainable Energy ETF | $42 | 0.79% |
| Net Assets ($) | $4,555,362 |
|---|---|
| Number of Portfolio Holdings | |
| Portfolio Turnover Rate (%) | 9% |
The Fund held no portfolio investments as of June 30, 2026. The Fund's sole asset consisted of cash pending distribution in connection with the Fund's liquidation.
The Fund liquidated on June 30, 2026.