EverBank + WaFd Stronger Together September 7, 2026
This communication contains certain “forward-looking statements” within the
meaning of the Private Securities Litigation Reform Act of 1995, Section 27A of the Securities Act of 1933, as amended (the “Securities Act”), and Section 21E of the Securities Exchange Act of 1934, as amended (the “Exchange Act”) with respect
to the beliefs, plans, goals, expectations and estimates of WaFd, Inc. (“WaFd”) and EverBank Financial Corp (“EverBank”). Forward-looking statements are not a representation of historical information, but instead pertain to future operations,
strategies, financial results or other developments. The words “believe,” “expect,” “anticipate,” “intend,” “target,” “plan,” “estimate,” “should,” “likely,” “will,” “going forward” and other expressions that indicate future events and trends
identify forward-looking statements. Forward-looking statements are necessarily based upon estimates and assumptions that are inherently subject to significant business, operational, economic and competitive uncertainties and contingencies,
many of which are beyond the control of WaFd and EverBank, and many of which, with respect to future business decisions and actions, are subject to change and which could cause actual results to differ materially from those contemplated or
implied by forward-looking statements or historical performance. Examples of uncertainties and contingencies include factors previously disclosed in WaFd’s reports filed with the U.S. Securities and Exchange Commission (the “SEC”), as well as
the following factors, among others: (i) the occurrence of any event, change or other circumstances that could give rise to the right of one or both of the parties to terminate the definitive merger agreement between WaFd and EverBank; (ii) the
outcome of any legal proceedings that may be instituted against WaFd or EverBank, including potential litigation that may be instituted against WaFd or its directors or officers related to the proposed transaction or the definitive merger
agreement between WaFd and EverBank; (iii) the timing and completion of the transaction, including the possibility that the proposed transaction will not close when expected or at all because required regulatory, shareholder or other approvals
are not received or other conditions to the closing are not satisfied on a timely basis or at all, or are obtained subject to conditions that are not anticipated; (iv) the risk that any announcements relating to the proposed combination could
have adverse effects on the market price of the common stock of WaFd; (v) the possibility that the anticipated benefits of the transaction will not be realized when expected or at all, including as a result of the impact of, or problems arising
from, the integration of the two companies or as a result of the strength of the economy and competitive factors in the areas where WaFd and EverBank do business; (vi) certain restrictions during the pendency of the merger that may impact the
parties’ ability to pursue certain business opportunities or strategic transactions; (vii) the possibility that the transaction may be more expensive to complete than anticipated, including as a result of unexpected factors or events; (viii)
diversion of management’s attention from ongoing business operations and opportunities; (ix) reputational risk and potential adverse reactions or changes to business or employee relationships, including those resulting from the announcement or
completion of the transaction; (x) WaFd’s and EverBank’s success in executing their respective business plans and strategies and managing the risks involved in the foregoing; (xi) currency and interest rate fluctuations; (xii) success of
hedging activities; (xiii) material adverse changes in economic and industry conditions, including the availability of short and long-term financing; (xiv) general competitive, economic, political and market conditions; (xv) changes in asset
quality and credit risk; (xvi) the inability to sustain revenue and earnings growth; (xvii) inflation; (xviii) customer borrowing, repayment, investment and deposit practices; (xix) the impact, extent and timing of technological changes; (xx)
capital management activities; (xxi) other actions of the Board of Governors of the Federal Reserve System, the Office of the Comptroller of the Currency and the State of Washington; (xxii) legislative and regulatory actions and reforms; and
(xxiii) other factors that may affect future results of WaFd and EverBank. We caution that the foregoing list of important factors that may affect future results is not exhaustive. Additional factors that could cause results to differ
materially from those contemplated by forward-looking statements can be found in WaFd’s Annual Report on Form 10-K for the fiscal year ended September 30, 2025, and in its subsequent Quarterly Reports on Form 10-Q filed with the SEC and
available in the “Investor Relations” section of WaFd’s website, www.wafdbank.com/about-us/investor-relations, under the heading “SEC Filings” and in other documents WaFd files with the SEC (available at www.sec.gov). All such factors, as well
as other uncertainties and potential events, and the inherent uncertainty of forward-looking statements, should be considered carefully when making decisions with respect to WaFd and EverBank. Any forward-looking statements contained in this
document represent the views of WaFd and EverBank only as of the date hereof and are presented for the purpose of assisting their respective shareholders and analysts in understanding WaFd’s and EverBank’s financial position, objectives and
priorities and anticipated financial performance as at and for the periods ended on the dates presented, and may not be appropriate for other purposes. Neither WaFd nor EverBank undertakes to update any forward-looking statements, whether
written or oral, that may be made from time to time by or on its behalf, except as required under applicable securities legislation. Statement Regarding Forward-looking Information
In connection with the proposed transaction, WaFd intends to file relevant
materials with the SEC, including a proxy statement on Schedule 14A. Promptly after filing its definitive proxy statement with the SEC, WaFd will mail the definitive proxy statement to each shareholder entitled to vote at the meeting relating
to the proposed transaction. This communication does not constitute an offer to sell or a solicitation of an offer to buy any securities or a solicitation of any vote or approval. SHAREHOLDERS OF WAFD ARE URGED TO READ, WHEN AVAILABLE, ALL
RELEVANT DOCUMENTS (INCLUDING ANY AMENDMENTS OR SUPPLEMENTS THERETO) FILED WITH THE SEC, INCLUDING WAFD’S PROXY STATEMENT, BECAUSE THEY WILL CONTAIN IMPORTANT INFORMATION ABOUT WAFD AND THE PROPOSED TRANSACTION. Investors and shareholders of
WaFd will be able to obtain a free copy of the proxy statement as well as other relevant documents filed with the SEC without charge at the SEC’s website (http://www.sec.gov). Copies of the proxy statement and the filings with the SEC that will
be incorporated by reference in the proxy statement can also be obtained, without charge, by directing a request to Brad Goode, WaFd, Inc., 425 Pike Street, Seattle, Washington 98101, telephone (206) 626-8178. Participants in the
Solicitation WaFd, EverBank and certain of WaFd’s directors and executive officers may be deemed to be participants in the solicitation of proxies in respect of the proposed transaction under the rules of the SEC. Information regarding WaFd’s
directors and executive officers is available in the proxy statement for its 2026 annual meeting of shareholders, which was filed with the SEC, and certain of its Current Reports on Form 8-K. Other information regarding the participants in the
proxy solicitation and a description of their direct and indirect interests, by security holdings or otherwise, will be contained in the proxy statement and other relevant materials to be filed with the SEC when they become available. Free
copies of these documents, when available, may be obtained as described in the preceding paragraph. Non-GAAP Financial Measures This communication contains certain non-GAAP financial measures that are not in accordance with U.S. generally
accepted accounting principles (GAAP). WaFd uses certain non-GAAP financial measures to provide meaningful, supplemental information regarding its operational results and to enhance investors’ overall understanding of WaFd’s financial
performance. The limitations associated with non-GAAP financial measures include the risk that persons might disagree as to the appropriateness of items comprising these measures and that different companies might calculate these measures
differently. These disclosures should not be considered an alternative to WaFd’s GAAP results. Important Other Information
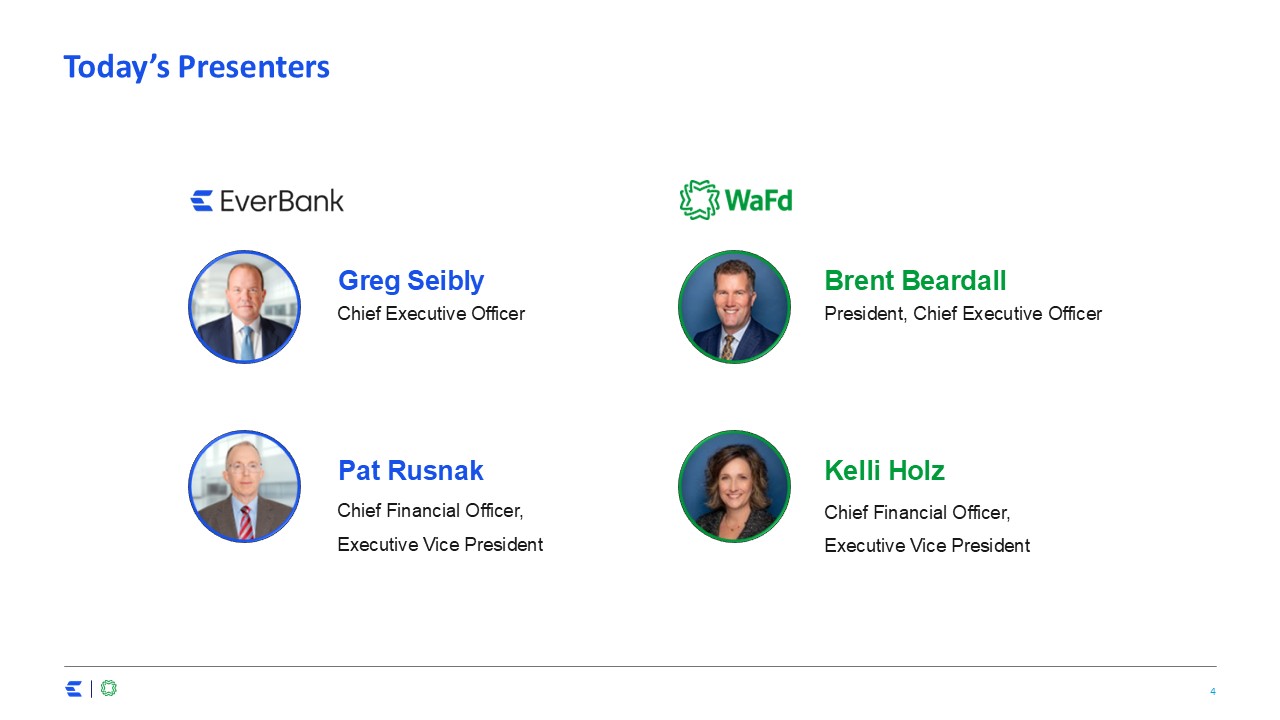
Today’s Presenters Greg Seibly Chief Executive Officer Brent
Beardall President, Chief Executive Officer Pat Rusnak Chief Financial Officer, Executive Vice President Kelli Holz Chief Financial Officer, Executive Vice President

Transaction Overview
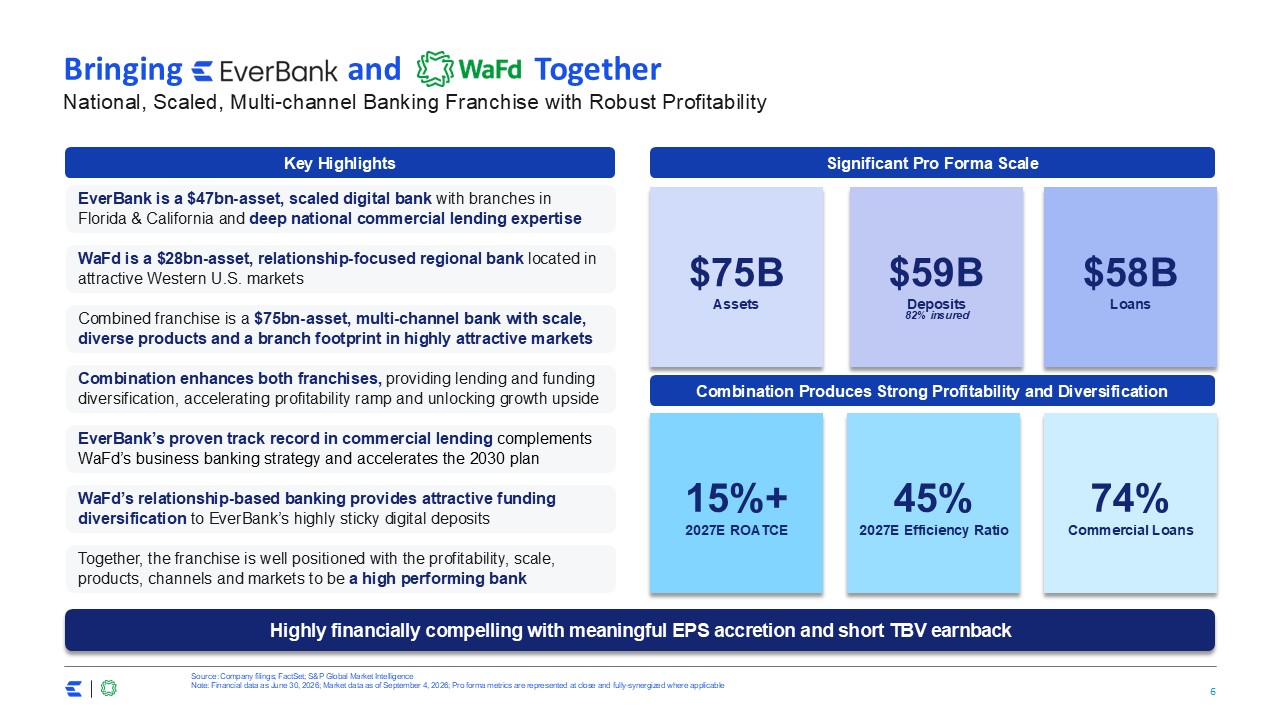
Bringing and Together EverBank is a $47bn-asset, scaled digital bank with
branches in Florida & California and deep national commercial lending expertise WaFd is a $28bn-asset, relationship-focused regional bank located in attractive Western U.S. markets Combined franchise is a $75bn-asset, multi-channel bank
with scale, diverse products and a branch footprint in highly attractive markets Combination enhances both franchises, providing lending and funding diversification, accelerating profitability ramp and unlocking growth upside EverBank’s
proven track record in commercial lending complements WaFd’s business banking strategy and accelerates the 2030 plan WaFd’s relationship-based banking provides attractive funding diversification to EverBank’s highly sticky digital
deposits Together, the franchise is well positioned with the profitability, scale, products, channels and markets to be a high performing bank Source: Company filings; FactSet; S&P Global Market Intelligence Note: Financial data as June
30, 2026; Market data as of September 4, 2026; Pro forma metrics are represented at close and fully-synergized where applicable $75B Assets 74% Commercial Loans $58B Loans 45% 2027E Efficiency Ratio 15%+ 2027E
ROATCE $59B Deposits 82% insured National, Scaled, Multi-channel Banking Franchise with Robust Profitability Key Highlights Significant Pro Forma Scale Combination Produces Strong Profitability and Diversification Highly financially
compelling with meaningful EPS accretion and short TBV earnback
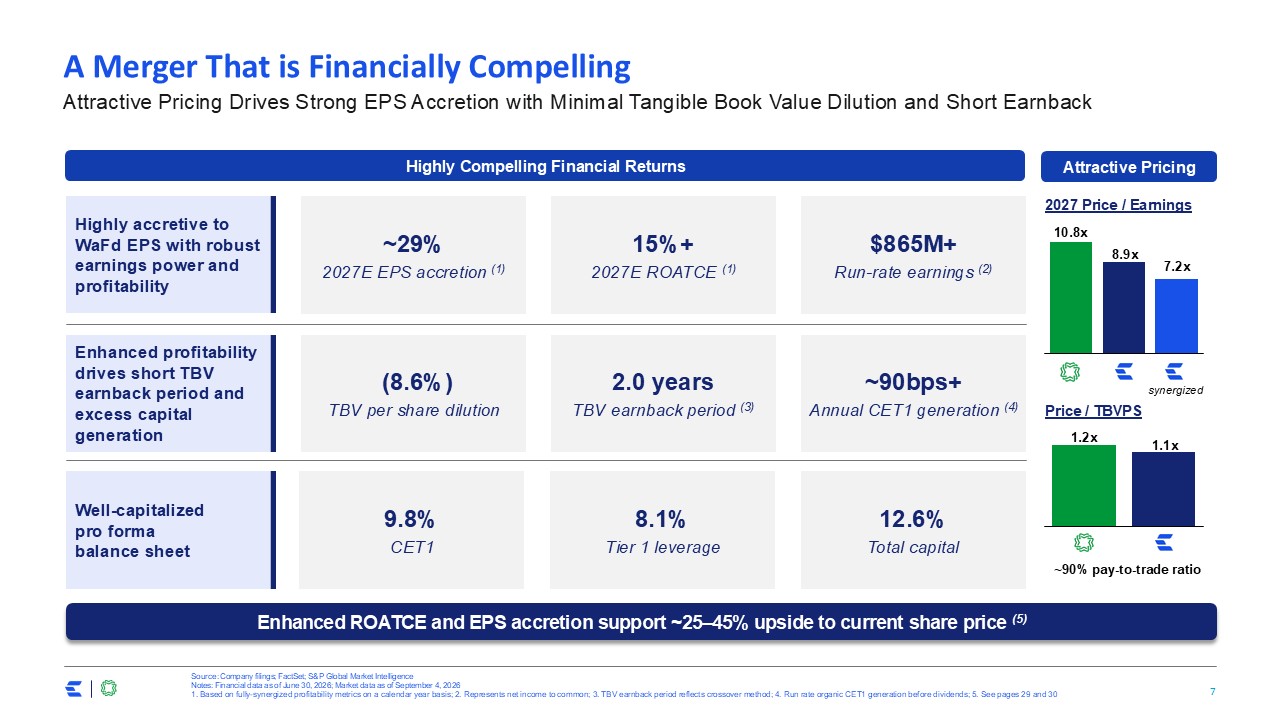
A Merger That is Financially Compelling $865M+ Run-rate earnings (2) Highly
accretive to WaFd EPS with robust earnings power and profitability ~29% 2027E EPS accretion (1) 15%+ 2027E ROATCE (1) Well-capitalized pro forma balance sheet 12.6% Total capital 8.1% Tier 1 leverage 9.8% CET1 Enhanced profitability
drives short TBV earnback period and excess capital generation ~90bps+ Annual CET1 generation (4) 2.0 years TBV earnback period (3) (8.6%) TBV per share dilution Source: Company filings; FactSet; S&P Global Market
Intelligence Notes: Financial data as of June 30, 2026; Market data as of September 4, 2026 1. Based on fully-synergized profitability metrics on a calendar year basis; 2. Represents net income to common; 3. TBV earnback period reflects
crossover method; 4. Run rate organic CET1 generation before dividends; 5. See pages 29 and 30 Attractive Pricing Drives Strong EPS Accretion with Minimal Tangible Book Value Dilution and Short Earnback Enhanced ROATCE and EPS accretion
support ~25–45% upside to current share price (5) Highly Compelling Financial Returns Attractive Pricing 2027 Price / Earnings Price / TBVPS synergized ~90% pay-to-trade ratio
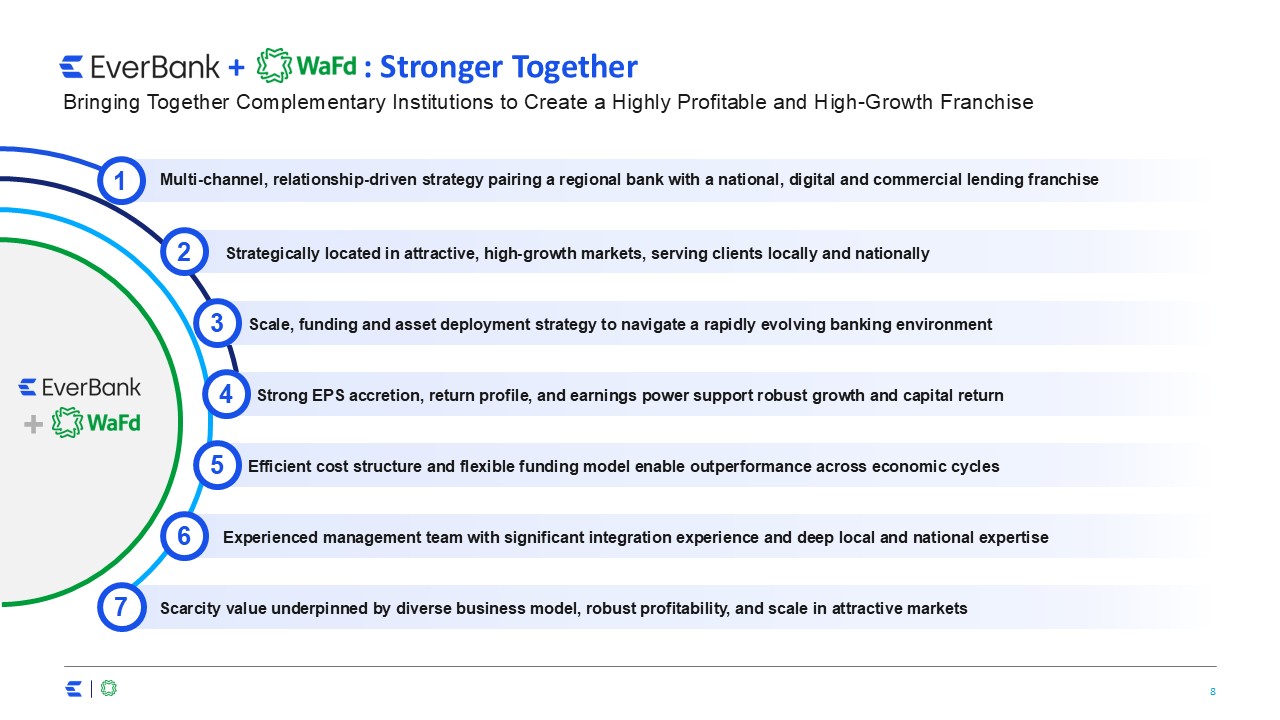
+ : Stronger Together Multi-channel, relationship-driven strategy pairing a
regional bank with a national, digital and commercial lending franchise 1 4 Experienced management team with significant integration experience and deep local and national expertise 6 Scarcity value underpinned by diverse business model,
robust profitability, and scale in attractive markets 7 c Scale, funding and asset deployment strategy to navigate a rapidly evolving banking environment 3 5 + Strategically located in attractive, high-growth markets, serving clients
locally and nationally 2 Strong EPS accretion, return profile, and earnings power support robust growth and capital return Efficient cost structure and flexible funding model enable outperformance across economic cycles Bringing Together
Complementary Institutions to Create a Highly Profitable and High-Growth Franchise
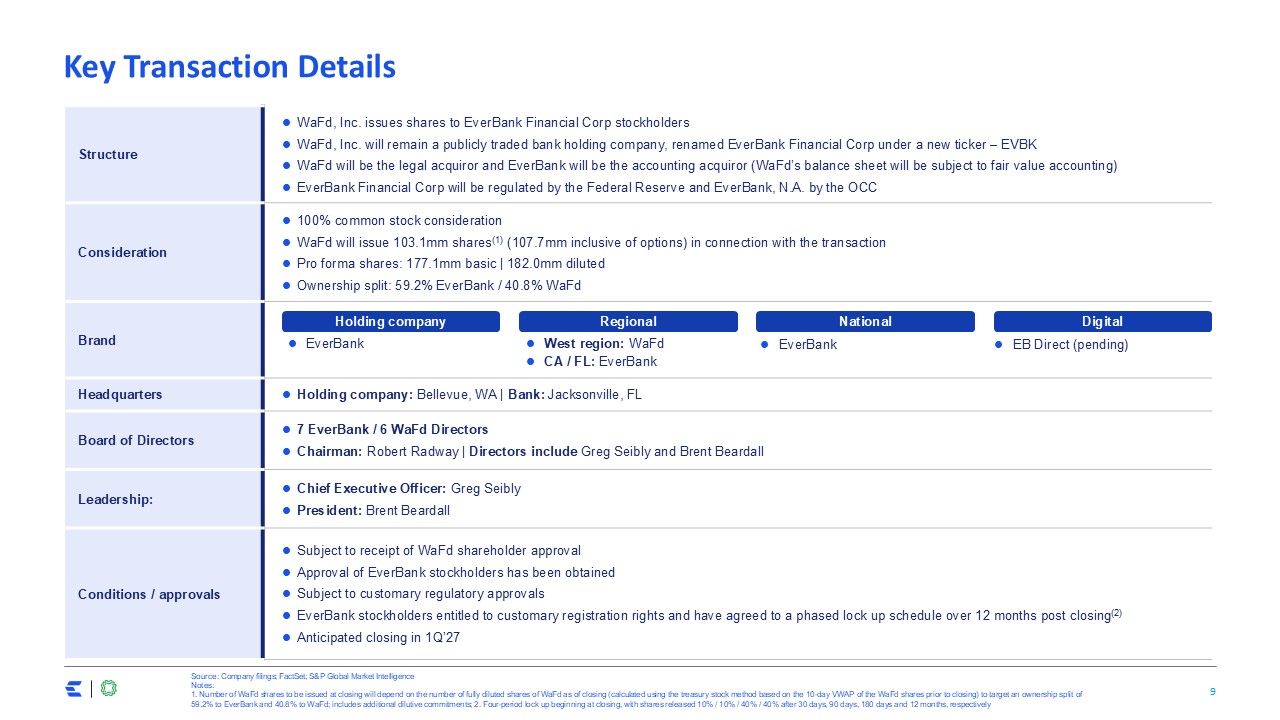
Key Transaction Details Structure WaFd, Inc. issues shares to EverBank
Financial Corp stockholders WaFd, Inc. will remain a publicly traded bank holding company, renamed EverBank Financial Corp under a new ticker – EVBK WaFd will be the legal acquiror and EverBank will be the accounting acquiror (WaFd’s balance
sheet will be subject to fair value accounting) EverBank Financial Corp will be regulated by the Federal Reserve and EverBank, N.A. by the OCC Consideration 100% common stock consideration WaFd will issue 103.1mm shares(1) (107.7mm
inclusive of options) in connection with the transaction Pro forma shares: 177.1mm basic | 182.0mm diluted Ownership split: 59.2% EverBank / 40.8% WaFd Brand Headquarters Holding company: Bellevue, WA | Bank: Jacksonville, FL Board of
Directors 7 EverBank / 6 WaFd Directors Chairman: Robert Radway | Directors include Greg Seibly and Brent Beardall Leadership: Chief Executive Officer: Greg Seibly President: Brent Beardall Conditions / approvals Subject to receipt of
WaFd shareholder approval Approval of EverBank stockholders has been obtained Subject to customary regulatory approvals EverBank stockholders entitled to customary registration rights and have agreed to a phased lock up schedule over 12
months post closing(2) Anticipated closing in 1Q’27 Source: Company filings; FactSet; S&P Global Market Intelligence Notes: 1. Number of WaFd shares to be issued at closing will depend on the number of fully diluted shares of WaFd as
of closing (calculated using the treasury stock method based on the 10-day VWAP of the WaFd shares prior to closing) to target an ownership split of 59.2% to EverBank and 40.8% to WaFd; includes additional dilutive commitments; 2. Four-period
lock up beginning at closing, with shares released 10% / 10% / 40% / 40% after 30 days, 90 days, 180 days and 12 months, respectively Regional West region: WaFd CA / FL: EverBank Holding company EverBank Digital EB Direct
(pending) National EverBank
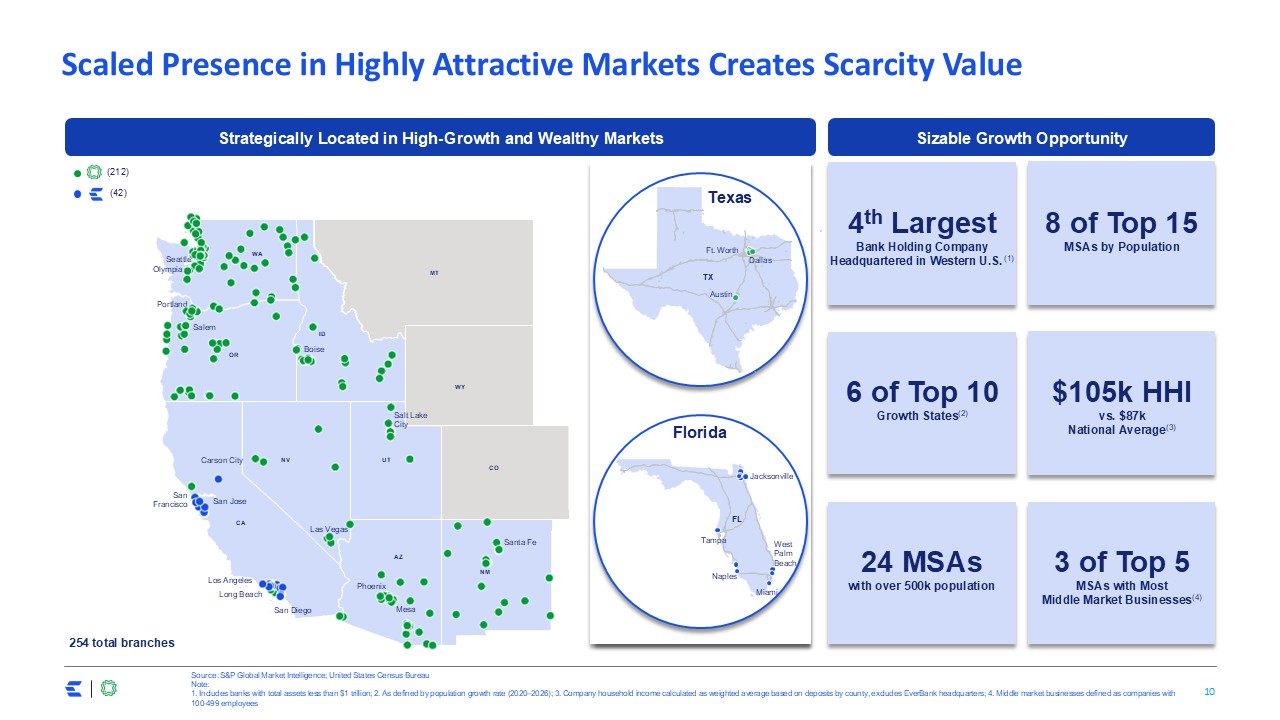
Scaled Presence in Highly Attractive Markets Creates Scarcity Value Strategically
Located in High-Growth and Wealthy Markets CA ID NV NM CO WY UT Seattle AZ WA OR Olympia Portland Salem Boise Carson City SanFrancisco San Jose Los Angeles Long Beach San Diego Phoenix Las Vegas Santa Fe Salt
LakeCity Mesa MT (212) (42) Florida FL Tampa Miami West PalmBeach Jacksonville Naples Texas TX Dallas Austin Ft. Worth Sizable Growth Opportunity 3 of Top 5 MSAs with Most Middle Market Businesses(4) 24 MSAs with over
500k population 8 of Top 15 MSAs by Population 6 of Top 10 Growth States(2) 4th Largest Bank Holding Company Headquartered in Western U.S. (1) $105k HHI vs. $87k National Average(3) 254 total branches Source: S&P Global Market
Intelligence; United States Census Bureau Note: 1. Includes banks with total assets less than $1 trillion; 2. As defined by population growth rate (2020–2026); 3. Company household income calculated as weighted average based on deposits by
county, excludes EverBank headquarters; 4. Middle market businesses defined as companies with 100-499 employees
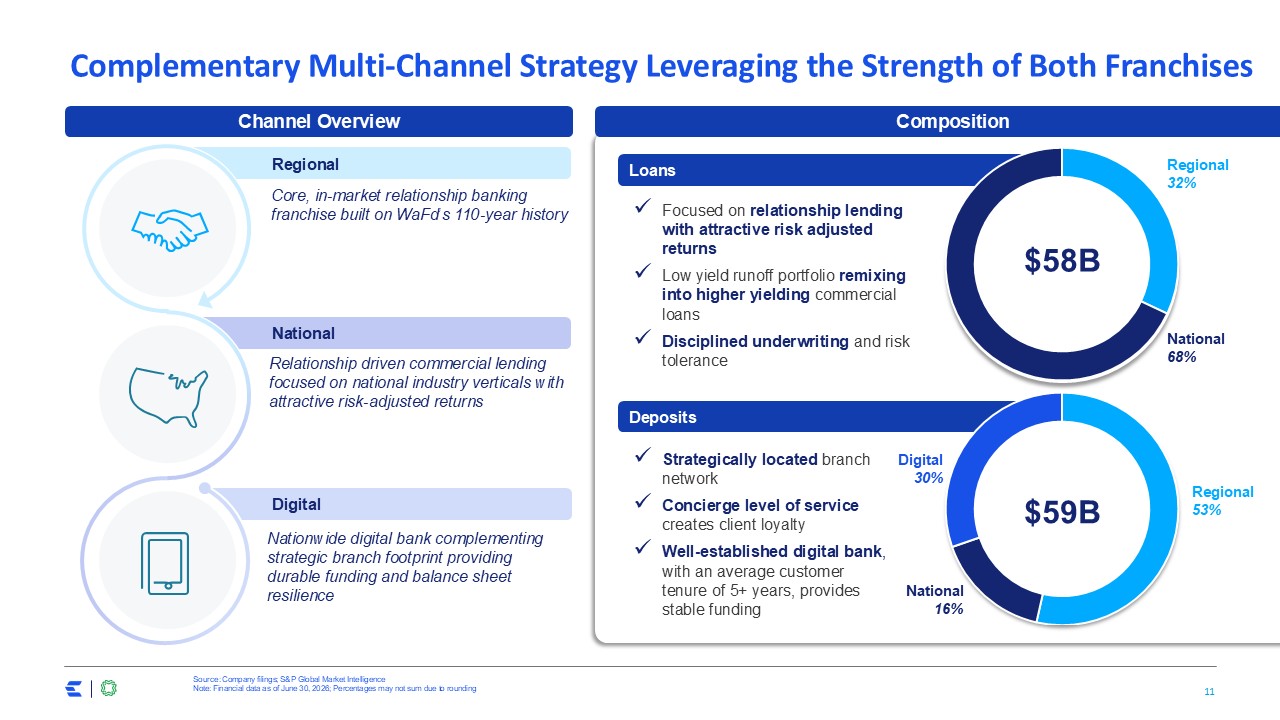
Digital Regional National Composition Loans Deposits Complementary
Multi-Channel Strategy Leveraging the Strength of Both Franchises Source: Company filings; S&P Global Market Intelligence Note: Financial data as of June 30, 2026; Percentages may not sum due to rounding Channel Overview Nationwide
digital bank complementing strategic branch footprint providing durable funding and balance sheet resilience Relationship driven commercial lending focused on national industry verticals with attractive risk-adjusted returns Core, in-market
relationship banking franchise built on WaFd’s 110-year history Regional 32% National 68% $58B Composition Regional 53% National 16% $59B Digital 30% Focused on relationship lending with attractive risk adjusted returns Low yield
runoff portfolio remixing into higher yielding commercial loans Disciplined underwriting and risk tolerance Strategically located branch network Concierge level of service creates client loyalty Well-established digital bank, with an
average customer tenure of 5+ years, provides stable funding
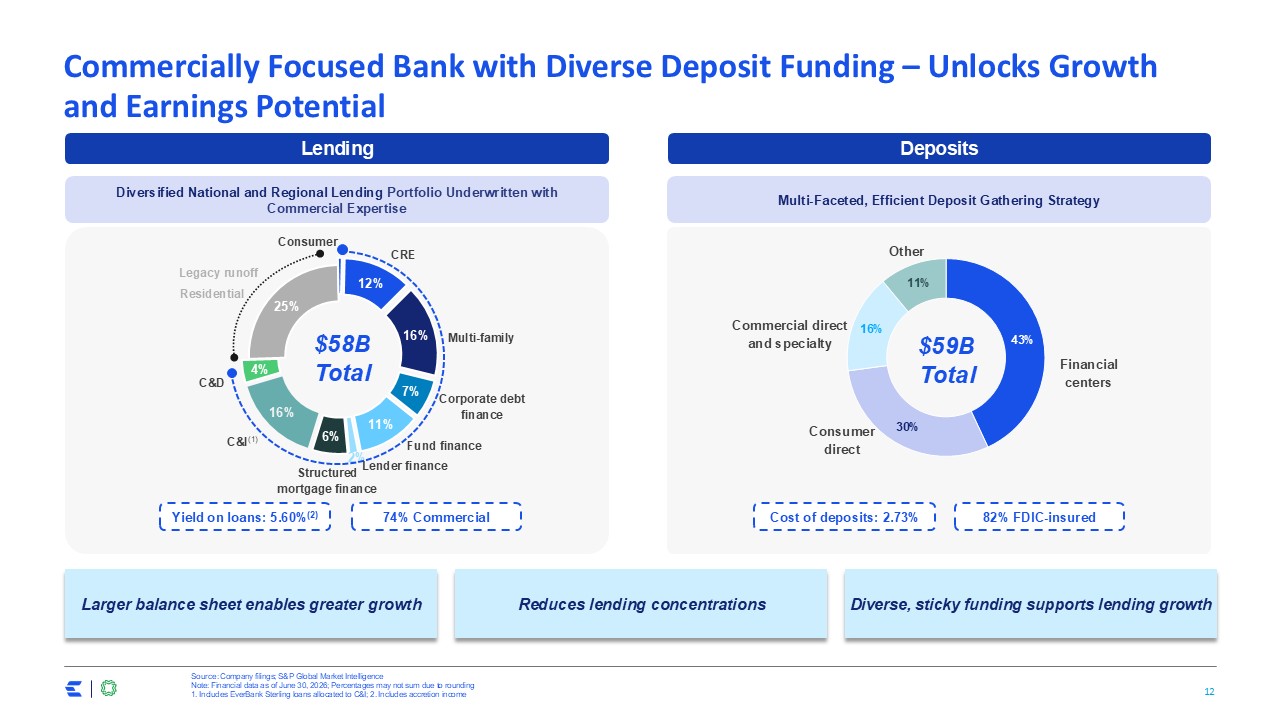
74% Commercial Commercially Focused Bank with Diverse Deposit Funding – Unlocks
Growth and Earnings Potential Multi-Faceted, Efficient Deposit Gathering Strategy Source: Company filings; S&P Global Market Intelligence Note: Financial data as of June 30, 2026; Percentages may not sum due to rounding 1. Includes
EverBank Sterling loans allocated to C&I; 2. Includes accretion income Diversified National and Regional Lending Portfolio Underwritten with Commercial Expertise 82% FDIC-insured Yield on loans: 5.60%(2) Cost of deposits: 2.73%
$59B Total Financial centers Commercial direct and specialty Other Consumer direct Larger balance sheet enables greater growth Reduces lending concentrations Diverse, sticky funding supports lending
growth $58B Total CRE C&I(1) Structured mortgage finance Legacy runoff Multi-family Corporate debt finance Residential C&D Consumer Lending Deposits Fund finance Lender finance
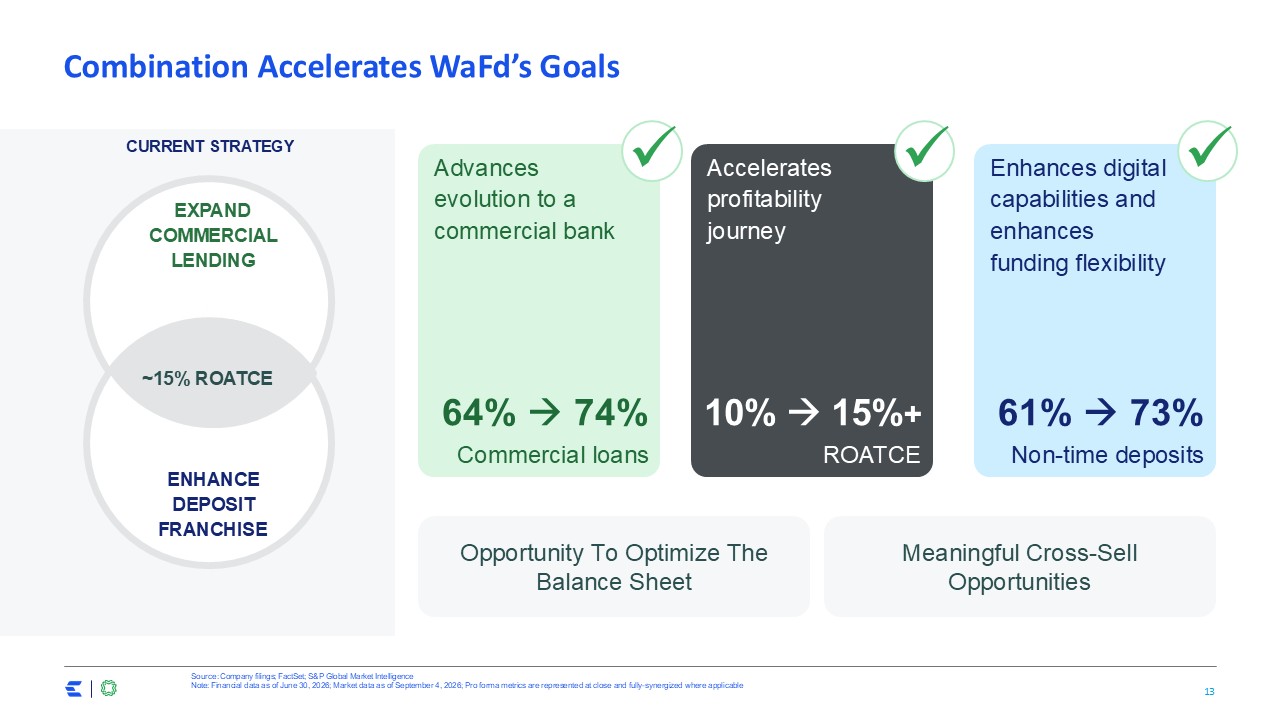
Combination Accelerates WaFd’s Goals Source: Company filings; FactSet; S&P
Global Market Intelligence Note: Financial data as of June 30, 2026; Market data as of September 4, 2026; Pro forma metrics are represented at close and fully-synergized where applicable Opportunity To Optimize The Balance Sheet Meaningful
Cross-Sell Opportunities ENHANCE DEPOSIT FRANCHISE EXPAND COMMERCIAL LENDING ~15% ROATCE Current Strategy 64% 74% Commercial loans Advances evolution to a commercial bank 10% 15%+ ROATCE Accelerates profitability
journey 61% 73% Non-time deposits Enhances digital capabilities and enhances funding flexibility
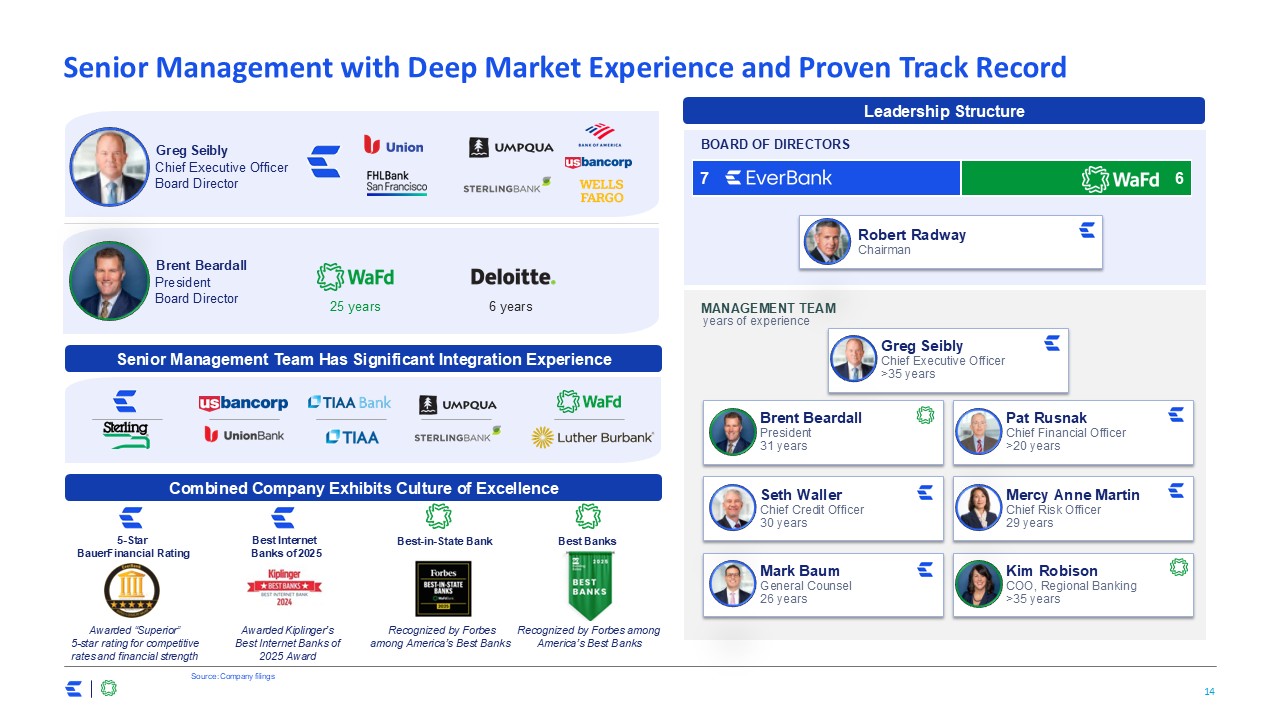
Senior Management with Deep Market Experience and Proven Track Record Greg
Seibly Chief Executive Officer Board Director Brent Beardall President Board Director Leadership Structure Robert Radway Chairman Greg Seibly Chief Executive Officer >35 years Brent Beardall President 31 years BOARD OF
DIRECTORS MANAGEMENT TEAM 25 years Senior Management Team Has Significant Integration Experience Combined Company Exhibits Culture of Excellence Pat Rusnak Chief Financial Officer >20 years Mercy Anne Martin Chief Risk Officer 29
years Kim Robison COO, Regional Banking >35 years Mark Baum General Counsel 26 years Seth Waller Chief Credit Officer 30 years 5-Star BauerFinancial Rating Awarded “Superior” 5-star rating for competitive rates and financial
strength Best Internet Banks of 2025 Awarded Kiplinger’s Best Internet Banks of 2025 Award Best-in-State Bank Best Banks Recognized by Forbes among America’s Best Banks Recognized by Forbes among America’s Best Banks Source: Company
filings 6 years years of experience
Overview of Standalone EverBank
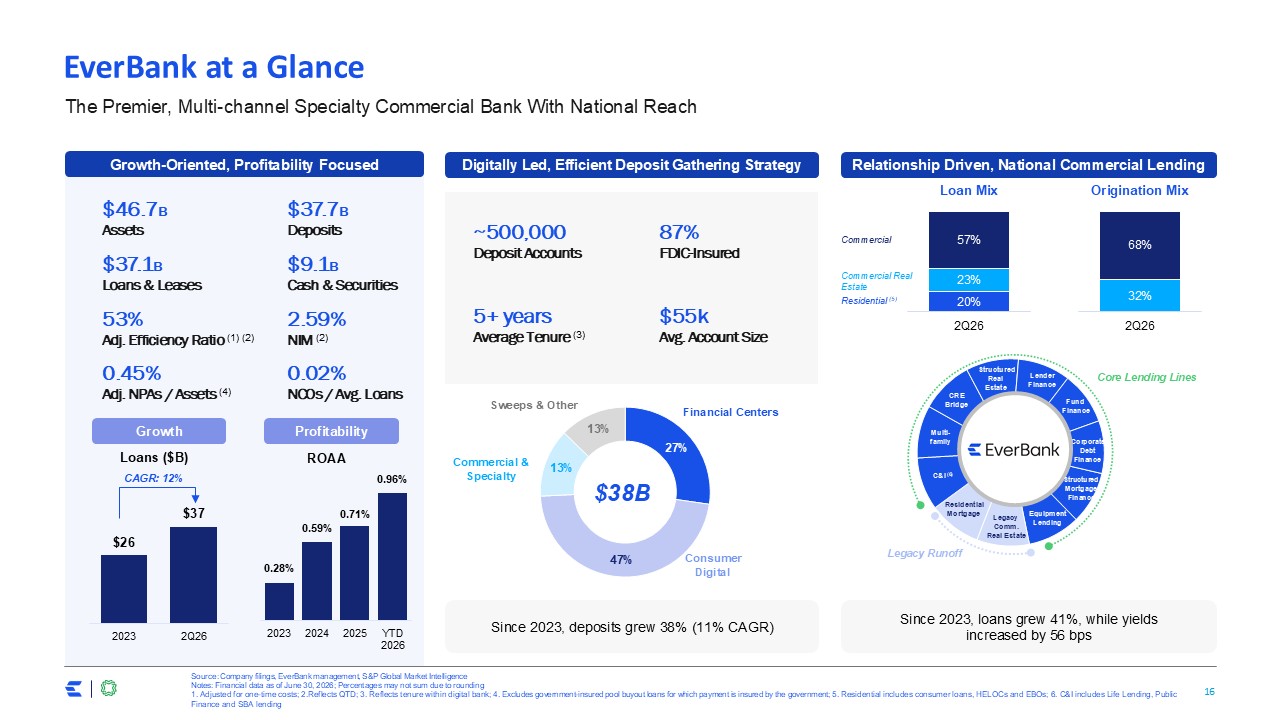
EverBank at a Glance $46.7B Assets $37.7B Deposits $37.1B Loans &
Leases $9.1B Cash & Securities 53% Adj. Efficiency Ratio (1) (2) 2.59% NIM (2) Digitally Led, Efficient Deposit Gathering Strategy Relationship Driven, National Commercial Lending Loan Mix Residential (5) Commercial Real
Estate Commercial 0.45% Adj. NPAs / Assets (4) 0.02% NCOs / Avg. Loans Growth-Oriented, Profitability Focused Loans ($B) Since 2023, deposits grew 38% (11% CAGR) Since 2023, loans grew 41%, while yields increased by 56
bps ROAA Growth Profitability CAGR: 12% Source: Company filings, EverBank management, S&P Global Market Intelligence Notes: Financial data as of June 30, 2026; Percentages may not sum due to rounding 1. Adjusted for one-time costs;
2.Reflects QTD; 3. Reflects tenure within digital bank; 4. Excludes government-insured pool buyout loans for which payment is insured by the government; 5. Residential includes consumer loans, HELOCs and EBOs; 6. C&I includes Life Lending,
Public Finance and SBA lending Core Lending Lines Fund Finance Corporate Debt Finance Lender Finance Structured Real Estate Multi- family C&I (6) Equipment Lending Legacy Comm. Real Estate Residential Mortgage
CRE Bridge The Premier, Multi-channel Specialty Commercial Bank With National Reach Origination Mix StructuredMortgageFinance 87% FDIC-Insured 5+ years Average Tenure (3) ~500,000 Deposit Accounts $55k Avg. Account
Size $38B Financial Centers Consumer Digital Sweeps & Other Commercial & Specialty
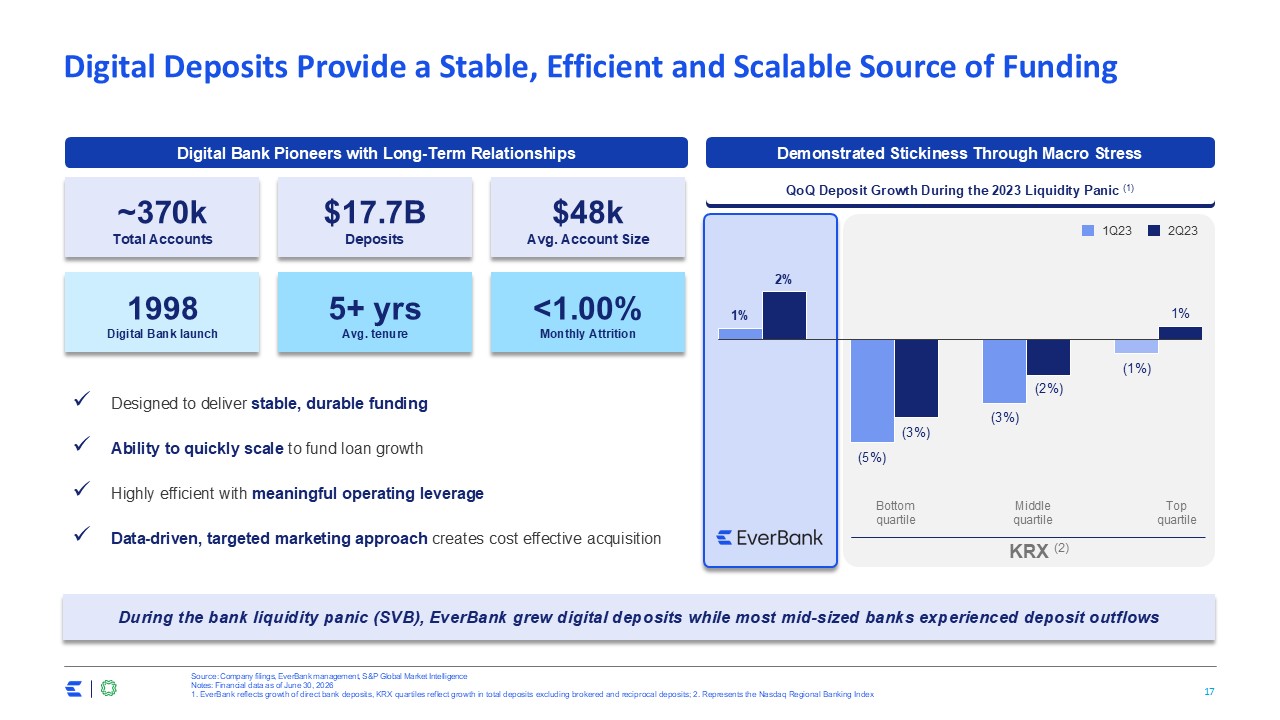
Digital Deposits Provide a Stable, Efficient and Scalable Source of
Funding Digital Bank Pioneers with Long-Term Relationships Designed to deliver stable, durable funding Ability to quickly scale to fund loan growth Highly efficient with meaningful operating leverage Data-driven, targeted marketing
approach creates cost effective acquisition Demonstrated Stickiness Through Macro Stress 1998 Digital Bank launch 5+ yrs Avg. tenure $17.7B Deposits ~370k Total Accounts <1.00% Monthly Attrition $48k Avg. Account Size During
the bank liquidity panic (SVB), EverBank grew digital deposits while most mid-sized banks experienced deposit outflows Source: Company filings, EverBank management, S&P Global Market Intelligence Notes: Financial data as of June 30,
2026 1. EverBank reflects growth of direct bank deposits, KRX quartiles reflect growth in total deposits excluding brokered and reciprocal deposits; 2. Represents the Nasdaq Regional Banking Index 2Q23 1Q23 KRX (2) Bottom
quartile Middle quartile Top quartile QoQ Deposit Growth During the 2023 Liquidity Panic (1)
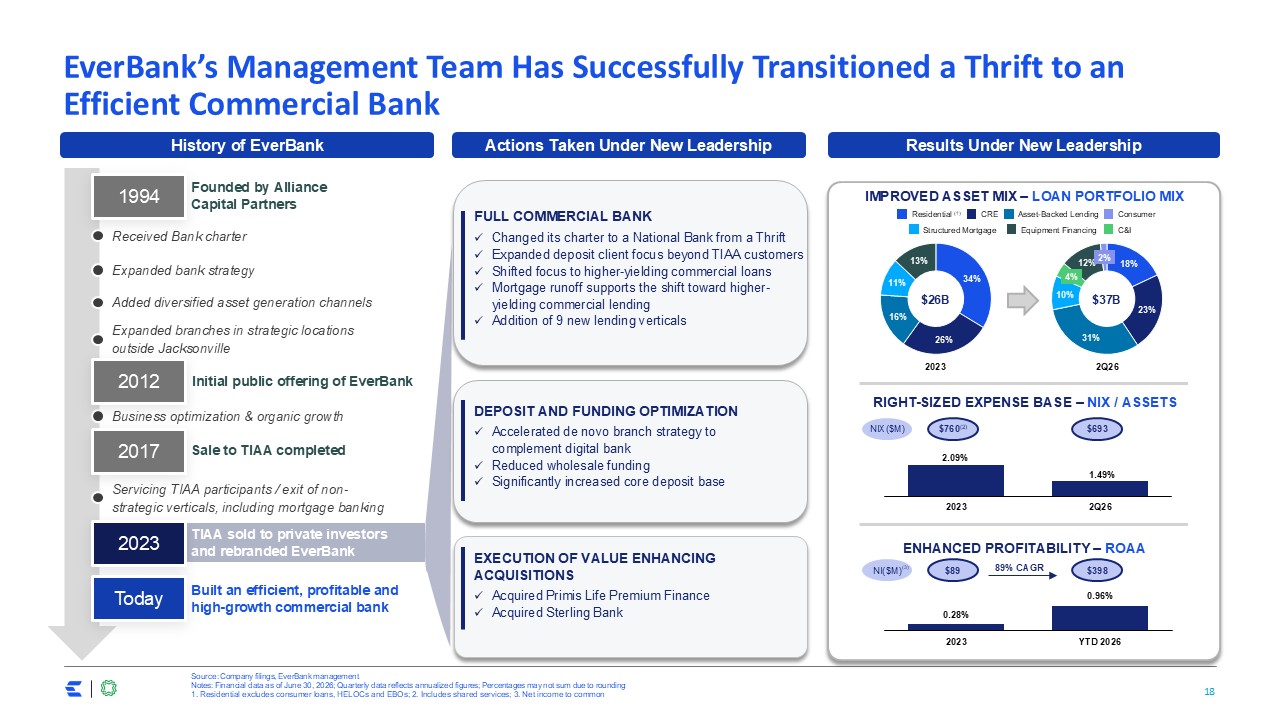
EverBank’s Management Team Has Successfully Transitioned a Thrift to an Efficient
Commercial Bank Source: Company filings, EverBank management Notes: Financial data as of June 30, 2026; Quarterly data reflects annualized figures; Percentages may not sum due to rounding 1. Residential excludes consumer loans, HELOCs and
EBOs; 2. Includes shared services; 3. Net income to common Actions Taken Under New Leadership History of EverBank Residential (1) CRE Asset-Backed Lending Structured Mortgage C&I IMPROVED ASSET MIX – LOAN PORTFOLIO MIX RIGHT-SIZED
EXPENSE BASE – NIX / ASSETS ENHANCED PROFITABILITY – ROAA $760(2) $693 Equipment Financing $26B $37B 2023 2Q26 Consumer NIX($M) Changed its charter to a National Bank from a Thrift Expanded deposit client focus beyond TIAA
customers Shifted focus to higher-yielding commercial loans Mortgage runoff supports the shift toward higher-yielding commercial lending Addition of 9 new lending verticals FULL COMMERCIAL BANK Accelerated de novo branch strategy to
complement digital bank Reduced wholesale funding Significantly increased core deposit base DEPOSIT AND FUNDING OPTIMIZATION Acquired Primis Life Premium Finance Acquired Sterling Bank EXECUTION OF VALUE ENHANCING ACQUISITIONS Added
diversified asset generation channels Business optimization & organic growth Servicing TIAA participants / exit of non-strategic verticals, including mortgage banking Results Under New Leadership Expanded branches in strategic
locations outside Jacksonville Expanded bank strategy Received Bank charter Founded by Alliance Capital Partners 1994 2017 Sale to TIAA completed TIAA sold to private investors and rebranded
EverBank 2023 $89 $398 NI($M) (3) 89% CAGR Today Built an efficient, profitable and high-growth commercial bank Initial public offering of EverBank 2012
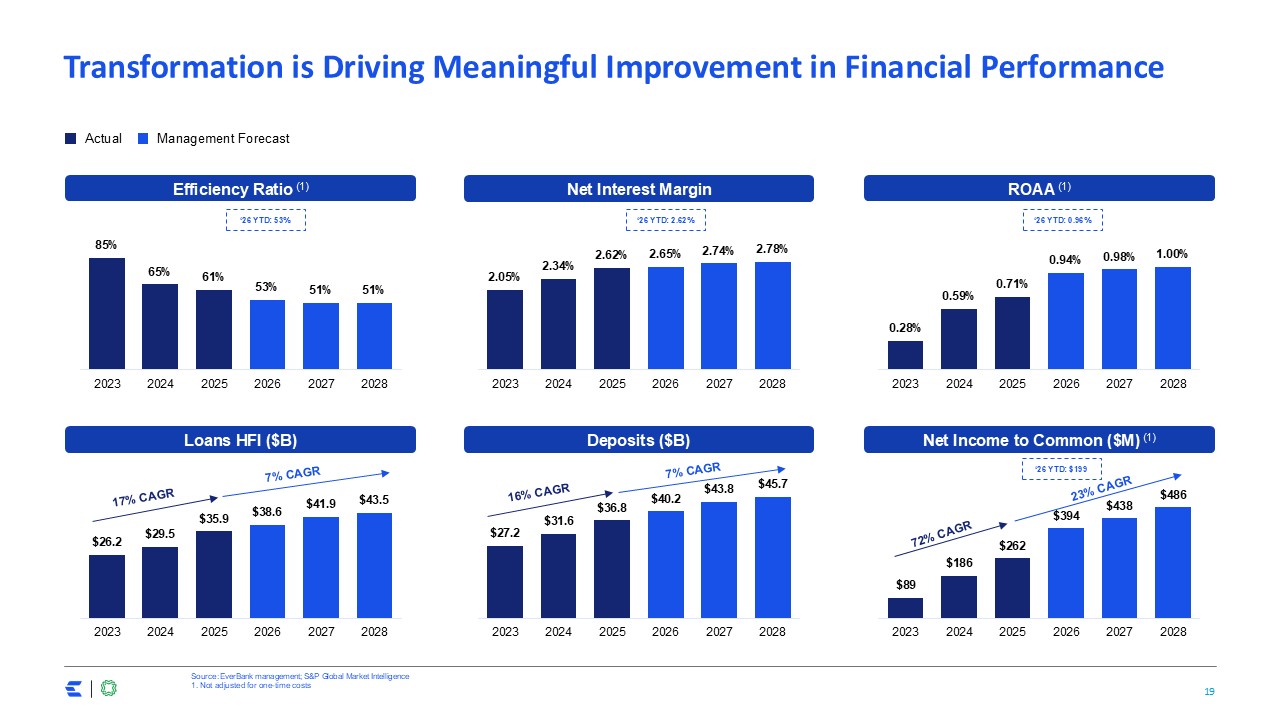
Net Interest Margin Loans HFI ($B) Deposits ($B) Management
Forecast Actual Transformation is Driving Meaningful Improvement in Financial Performance 17% CAGR 7% CAGR 16% CAGR 7% CAGR 72% CAGR 23% CAGR ‘26 YTD: $199 ‘26 YTD: 0.94% ‘26 YTD: 2.58% ‘26 YTD: 53% ROAA (1) Net Income to
Common ($M) (1) Efficiency Ratio (1) Source: EverBank management; S&P Global Market Intelligence 1. Not adjusted for one-time costs Q’2 annualized: $436 Q’2 annualized: 1.02% Q’2 annualized: 2.58% Q’2 annualized: 53% ‘26 YTD:
$199 ‘26 YTD: 0.96% ‘26 YTD: 2.62% ‘26 YTD: 53%

Financial Rationale
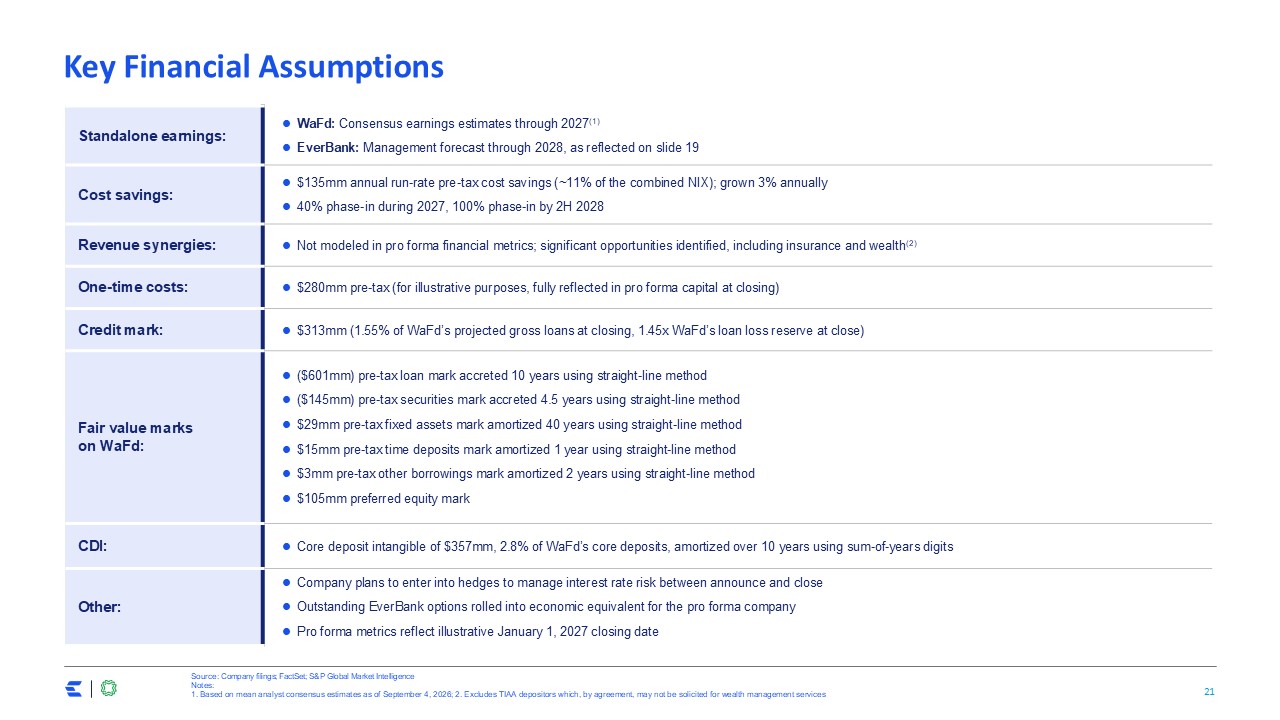
Key Financial Assumptions Standalone earnings: WaFd: Consensus earnings
estimates through 2027(1) EverBank: Management forecast through 2028, as reflected on slide 19 Cost savings: $135mm annual run-rate pre-tax cost savings (~11% of the combined NIX); grown 3% annually 40% phase-in during 2027, 100% phase-in
by 2H 2028 Revenue synergies: Not modeled in pro forma financial metrics; significant opportunities identified, including insurance and wealth(2) One-time costs: $280mm pre-tax (for illustrative purposes, fully reflected in pro forma
capital at closing) Credit mark: $313mm (1.55% of WaFd’s projected gross loans at closing, 1.45x WaFd’s loan loss reserve at close) Fair value marks on WaFd: ($601mm) pre-tax loan mark accreted 10 years using straight-line method ($145mm)
pre-tax securities mark accreted 4.5 years using straight-line method $29mm pre-tax fixed assets mark amortized 40 years using straight-line method $15mm pre-tax time deposits mark amortized 1 year using straight-line method $3mm pre-tax
other borrowings mark amortized 2 years using straight-line method $105mm preferred equity mark CDI: Core deposit intangible of $357mm, 2.8% of WaFd’s core deposits, amortized over 10 years using sum-of-years digits Other: Company plans to
enter into hedges to manage interest rate risk between announce and close Outstanding EverBank options rolled into economic equivalent for the pro forma company Pro forma metrics reflect illustrative January 1, 2027 closing date Source:
Company filings; FactSet; S&P Global Market Intelligence Notes: 1. Based on mean analyst consensus estimates as of September 4, 2026; 2. Excludes TIAA depositors which, by agreement, may not be solicited for wealth management services
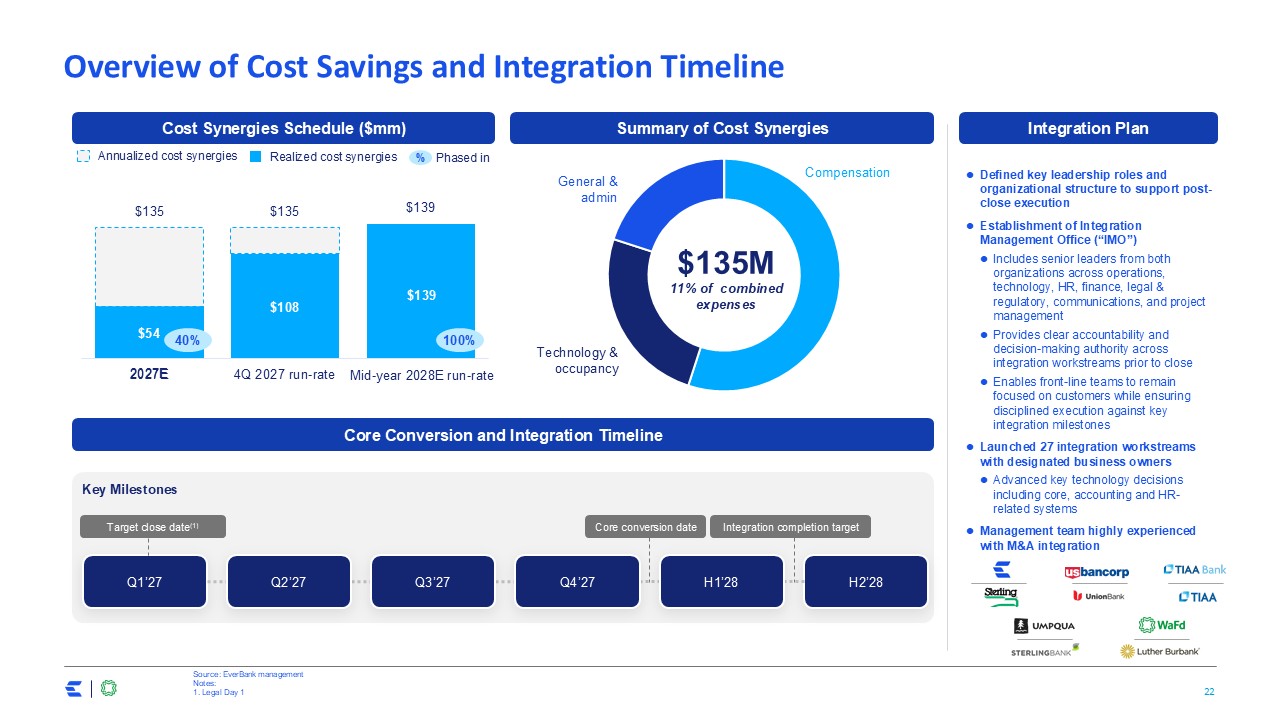
Overview of Cost Savings and Integration Timeline Source: EverBank
management Notes: 1. Legal Day 1 Cost Synergies Schedule ($mm) Defined key leadership roles and organizational structure to support post-close execution Establishment of Integration Management Office (“IMO”) Includes senior leaders from
both organizations across operations, technology, HR, finance, legal & regulatory, communications, and project management Provides clear accountability and decision-making authority across integration workstreams prior to close Enables
front-line teams to remain focused on customers while ensuring disciplined execution against key integration milestones Launched 27 integration workstreams with designated business owners Advanced key technology decisions including core,
accounting and HR-related systems Management team highly experienced with M&A integration Integration Plan Realized cost synergies Annualized cost synergies Key Milestones Q1’27 H2’28 Q2’27 Q3’27 Q4’27 H1’28 Target close
date(1) Core conversion date Integration completion target Core Conversion and Integration Timeline Summary of Cost Synergies $135M Compensation Technology & occupancy General & admin 11% of combined expenses 40% 100% %
Phased in 2027E Mid-year 2028E run-rate
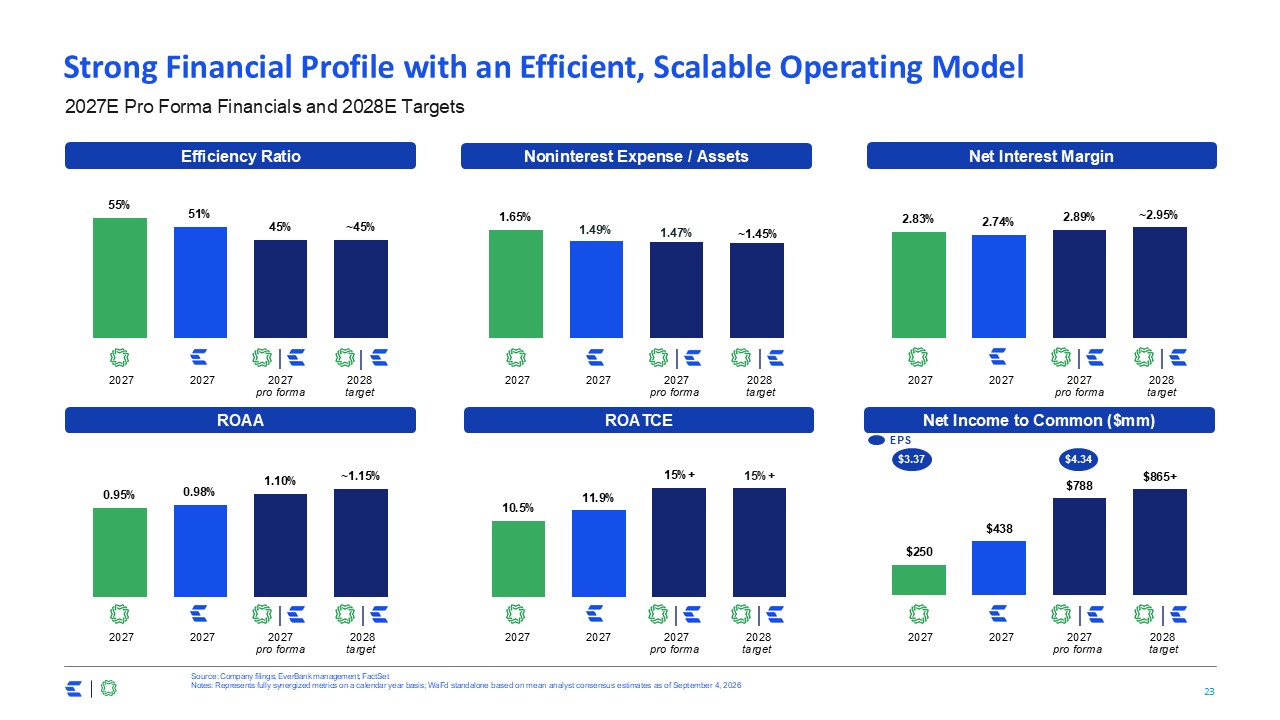
Net Income to Common ($mm) Efficiency Ratio ROATCE Source: Company filings;
EverBank management; FactSet Notes: Represents fully synergized metrics on a calendar year basis; WaFd standalone based on mean analyst consensus estimates as of September 4, 2026 Strong Financial Profile with an Efficient, Scalable Operating
Model ROAA | 2027 2027 2027 | 2027 | 2028 2027 2027 | 2027 | 2028 2027 2027 | 2027 | 2028 2027 2027 15%+ 2027E Pro Forma Financials and 2028E Targets target target target pro forma pro forma Net Interest
Margin | 2027 | 2028 2027 2027 target pro forma Noninterest Expense / Assets | 2027 | 2028 2027 2027 target pro forma pro forma pro forma $3.37 $4.34 EPS | 2028 target
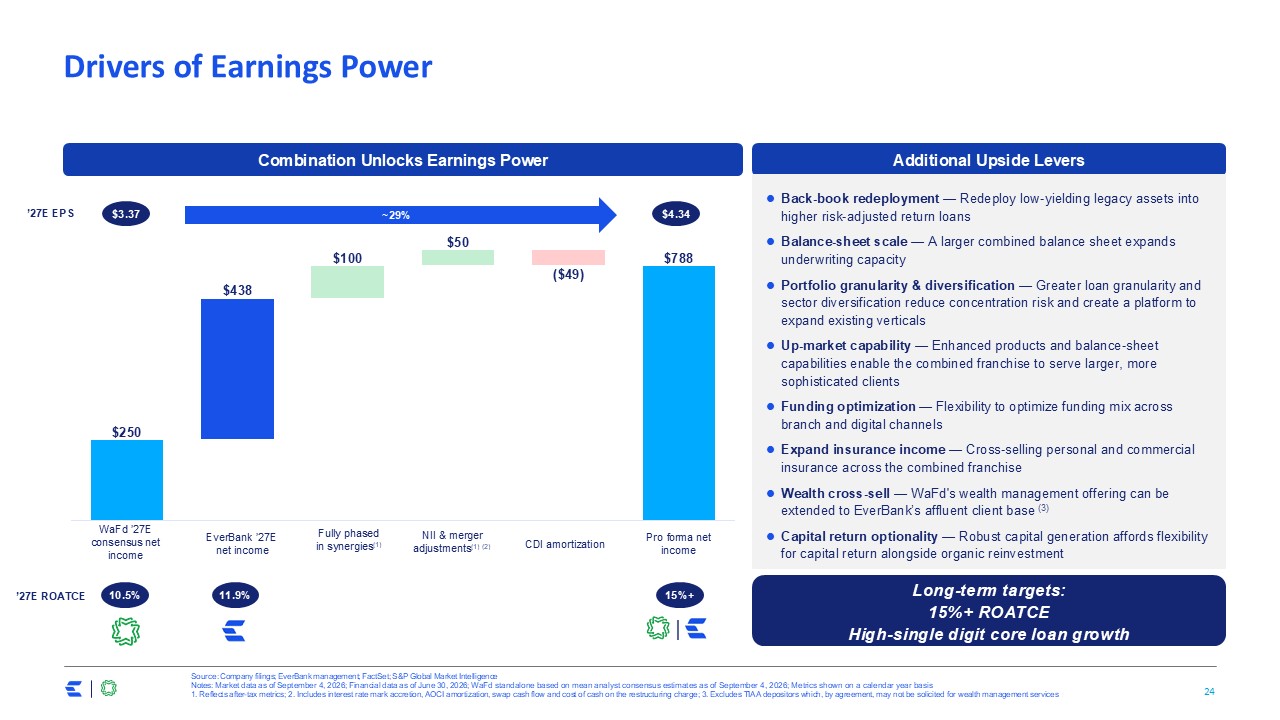
Drivers of Earnings Power Source: Company filings; EverBank management; FactSet;
S&P Global Market Intelligence Notes: Market data as of September 4, 2026; Financial data as of June 30, 2026; WaFd standalone based on mean analyst consensus estimates as of September 4, 2026; Metrics shown on a calendar year basis 1.
Reflects after-tax metrics; 2. Includes interest rate mark accretion, AOCI amortization, swap cash flow and cost of cash on the restructuring charge; 3. Excludes TIAA depositors which, by agreement, may not be solicited for wealth management
services Combination Unlocks Earnings Power Additional Upside Levers Back-book redeployment — Redeploy low-yielding legacy assets into higher risk-adjusted return loans Balance-sheet scale — A larger combined balance sheet expands
underwriting capacity Portfolio granularity & diversification — Greater loan granularity and sector diversification reduce concentration risk and create a platform to expand existing verticals Up-market capability — Enhanced products and
balance-sheet capabilities enable the combined franchise to serve larger, more sophisticated clients Funding optimization — Flexibility to optimize funding mix across branch and digital channels Expand insurance income — Cross-selling
personal and commercial insurance across the combined franchise Wealth cross-sell — WaFd's wealth management offering can be extended to EverBank’s affluent client base (3) Capital return optionality — Robust capital generation affords
flexibility for capital return alongside organic reinvestment Long-term targets: 15%+ ROATCE High-single digit core loan growth NII & merger adjustments(1) (2) WaFd ’27E consensus net income EverBank ’27E net income Fully phased in
synergies(1) CDI amortization Pro forma net income 10.5% 11.9% 15%+ | ’27E ROATCE $3.37 ~29% $4.34 ’27E EPS
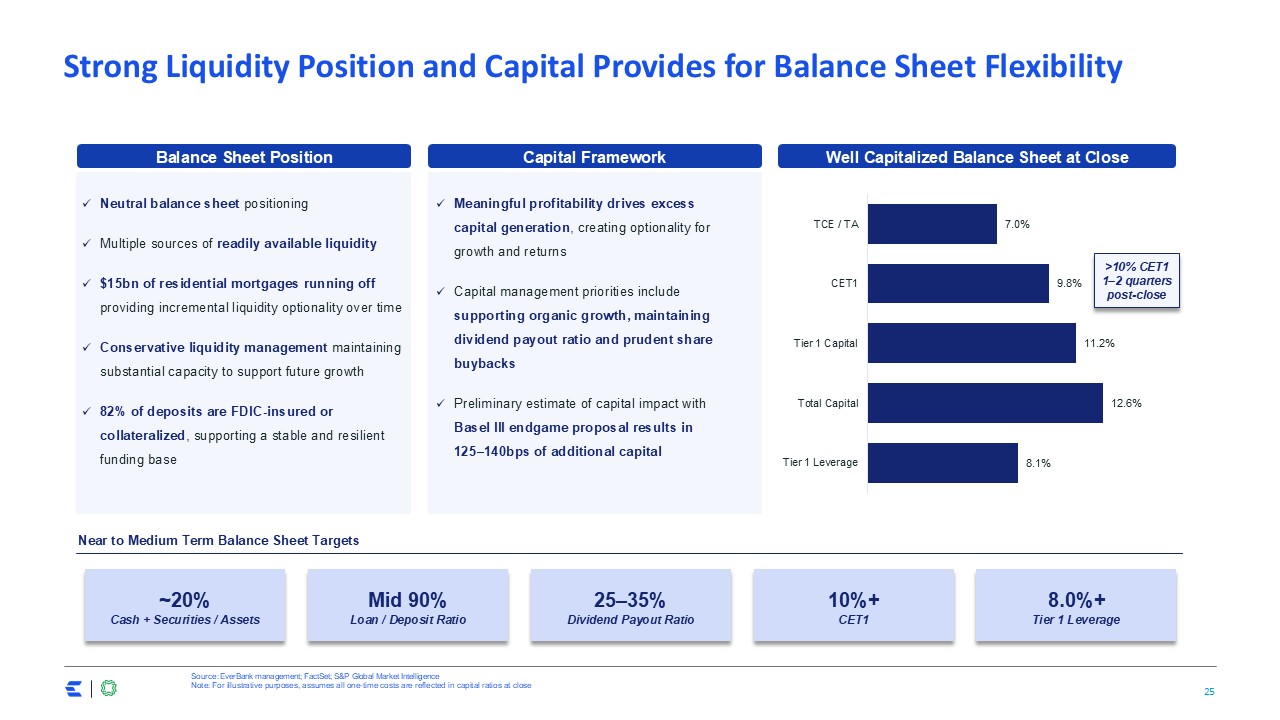
Strong Liquidity Position and Capital Provides for Balance Sheet
Flexibility Source: EverBank management; FactSet; S&P Global Market Intelligence Note: For illustrative purposes, assumes all one-time costs are reflected in capital ratios at close Capital Framework Meaningful profitability drives
excess capital generation, creating optionality for growth and returns Capital management priorities include supporting organic growth, maintaining dividend payout ratio and prudent share buybacks Preliminary estimate of capital impact with
Basel III endgame proposal results in 125–140bps of additional capital ~20% Cash + Securities / Assets 25–35% Dividend Payout Ratio 10%+ CET1 8.0%+ Tier 1 Leverage Near to Medium Term Balance Sheet Targets Mid 90% Loan / Deposit
Ratio Well Capitalized Balance Sheet at Close Balance Sheet Position Neutral balance sheet positioning Multiple sources of readily available liquidity $15bn of residential mortgages running off providing incremental liquidity optionality
over time Conservative liquidity management maintaining substantial capacity to support future growth 82% of deposits are FDIC-insured or collateralized, supporting a stable and resilient funding base >10% CET1 1–2 quarters post-close
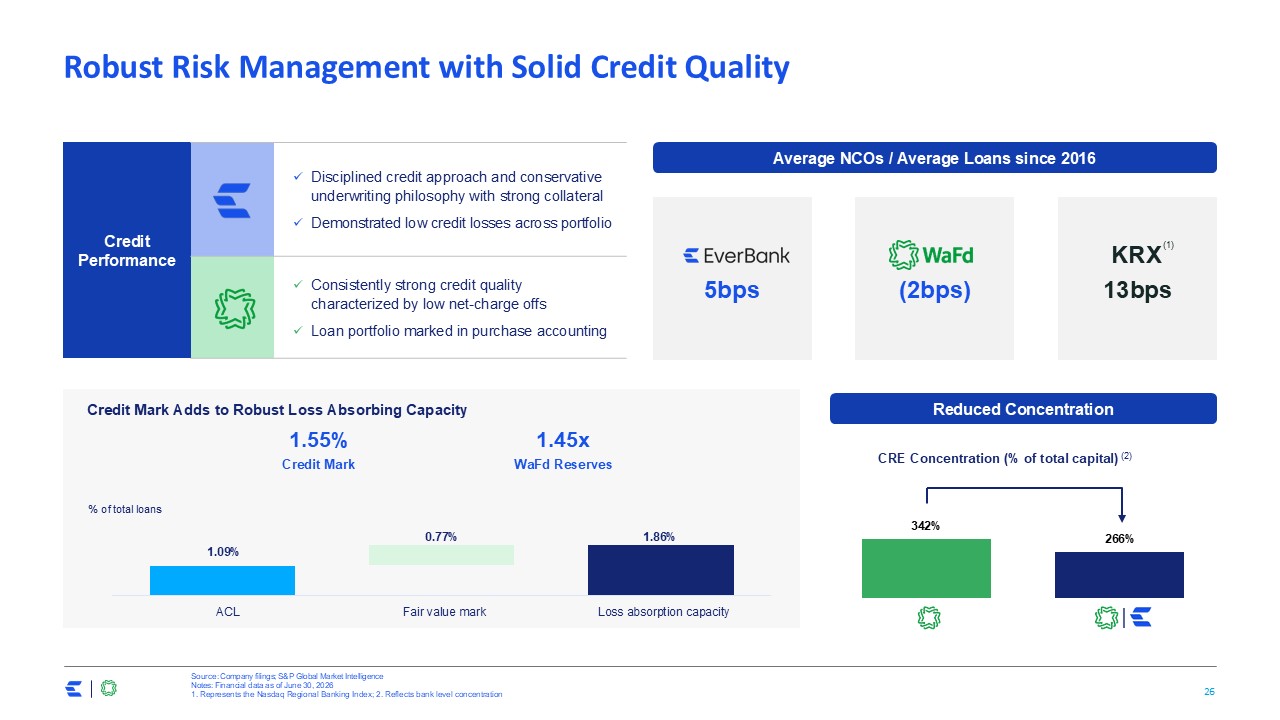
Robust Risk Management with Solid Credit Quality Source: Company filings; S&P
Global Market Intelligence Notes: Financial data as of June 30, 2026 1. Represents the Nasdaq Regional Banking Index; 2. Reflects bank level concentration Credit Performance Disciplined credit approach and conservative underwriting
philosophy with strong collateral Demonstrated low credit losses across portfolio Consistently strong credit quality characterized by low net-charge offs Loan portfolio marked in purchase accounting 1.55% Credit Mark Credit Mark Adds to
Robust Loss Absorbing Capacity 1.45x WaFd Reserves ACL Fair value mark Loss absorption capacity % of total loans 1.09% 0.77% 1.86% CRE Concentration (% of total capital) (2) Reduced Concentration Average NCOs / Average Loans since
2016 5bps (2bps) 13bps KRX (1) |
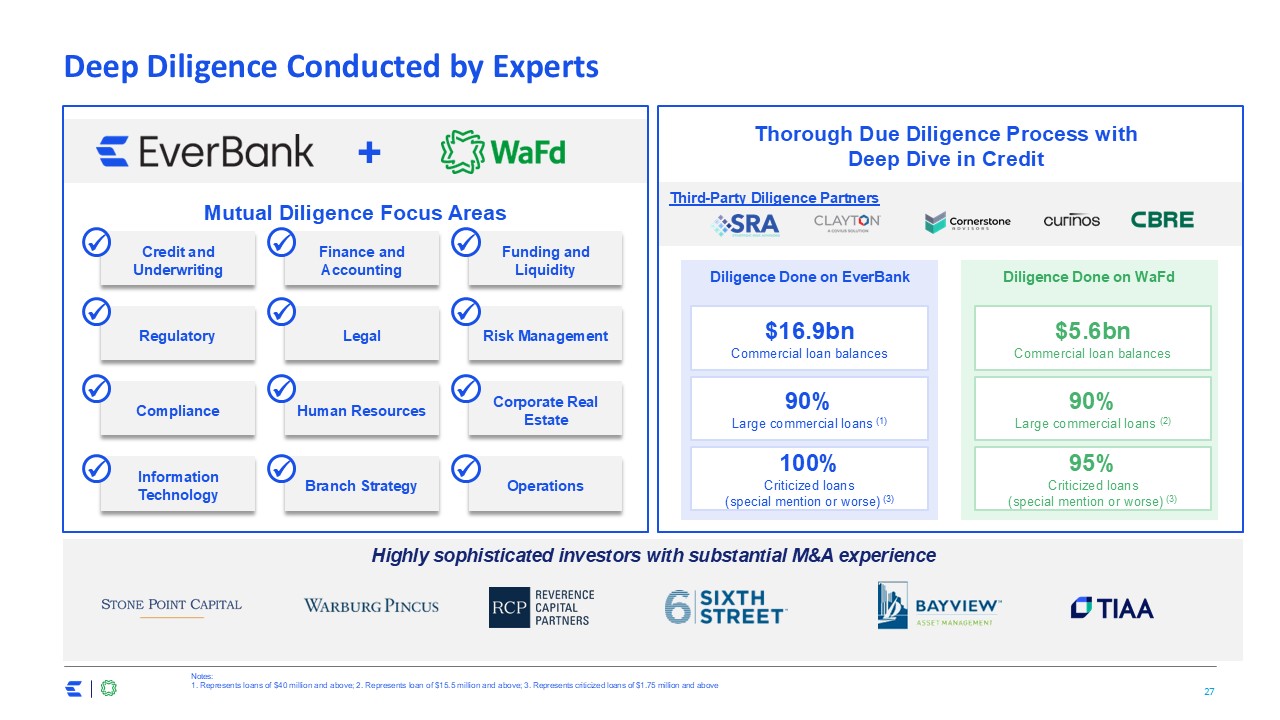
Deep Diligence Conducted by Experts [ ] Third-Party Diligence Partners Thorough
Due Diligence Process with Deep Dive in Credit Mutual Diligence Focus Areas Diligence Done on EverBank Diligence Done on WaFd Credit and Underwriting Finance and Accounting Funding and Liquidity Regulatory Legal Risk
Management Compliance Human Resources Corporate Real Estate Information Technology Branch Strategy Operations $16.9bn Commercial loan balances 100% Criticized loans (special mention or worse)
(3) $5.6bn Commercial loan balances 95% Criticized loans (special mention or worse) (3) Highly sophisticated investors with substantial M&A experience + Notes: 1. Represents loans of $40 million and above; 2. Represents loan of
$15.5 million and above; 3. Represents criticized loans of $1.75 million and above 90% Large commercial loans (1) 90% Large commercial loans (2)

Significant Value Creation
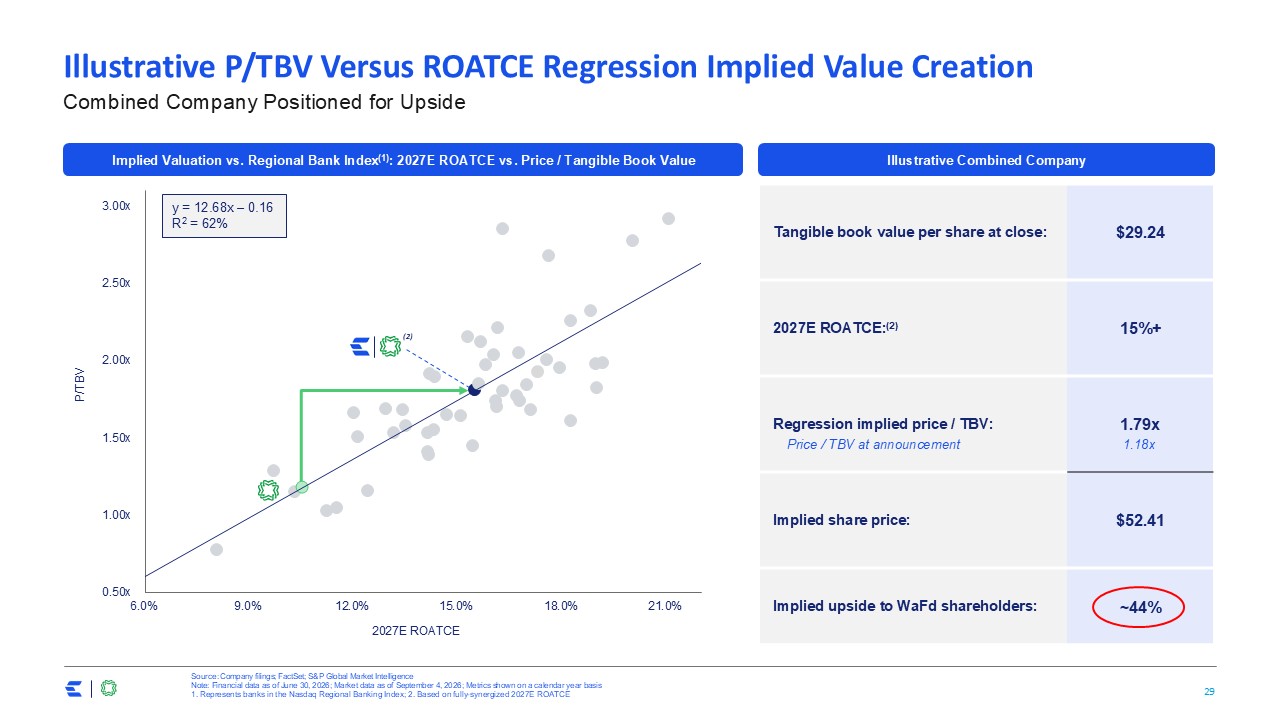
Illustrative P/TBV Versus ROATCE Regression Implied Value Creation Combined
Company Positioned for Upside Source: Company filings; FactSet; S&P Global Market Intelligence Note: Financial data as of June 30, 2026; Market data as of September 4, 2026; Metrics shown on a calendar year basis 1. Represents banks in
the Nasdaq Regional Banking Index; 2. Based on fully-synergized 2027E ROATCE Implied Valuation vs. Regional Bank Index(1): 2027E ROATCE vs. Price / Tangible Book Value (2) y = 12.68x – 0.16 R2 = 62% Illustrative Combined Company Tangible
book value per share at close: $29.24 2027E ROATCE:(2) 15%+ Regression implied price / TBV: 1.79x Implied share price: $52.41 Implied upside to WaFd shareholders: ~44% Price / TBV at announcement 1.18x
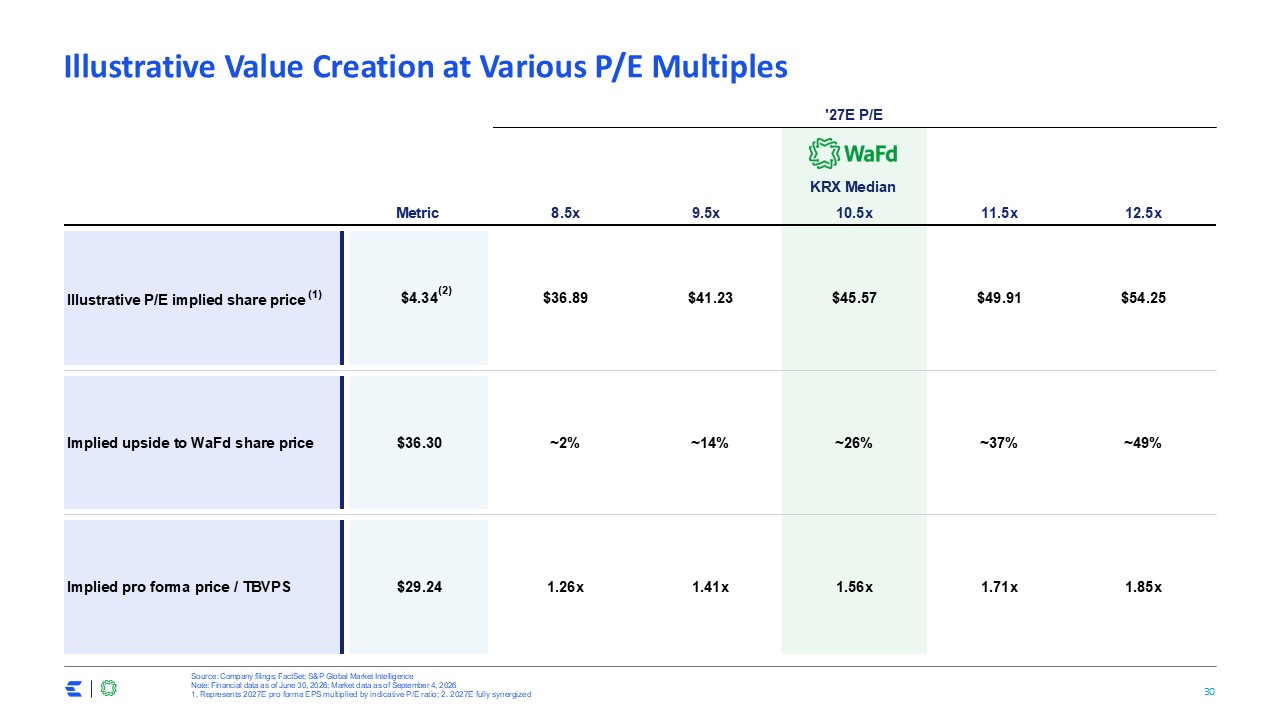
Illustrative Value Creation at Various P/E Multiples Source: Company filings;
FactSet; S&P Global Market Intelligence Note: Financial data as of June 30, 2026; Market data as of September 4, 2026 1. Represents 2027E pro forma EPS multiplied by indicative P/E ratio; 2. 2027E fully synergized (2) '27E P/E KRX
Median Metric 8.5x 9.5x 10.5x 11.5x 12.5x Illustrative P/E implied share price (1) $4.34 $36.89 $41.23 $45.57 $49.91 $54.25 Implied upside to WaFd share price $36.30 ~2% ~14% ~26% ~37% ~49% Implied pro forma price /
TBVPS $29.24 1.26x 1.41x 1.56x 1.71x 1.85x (2)
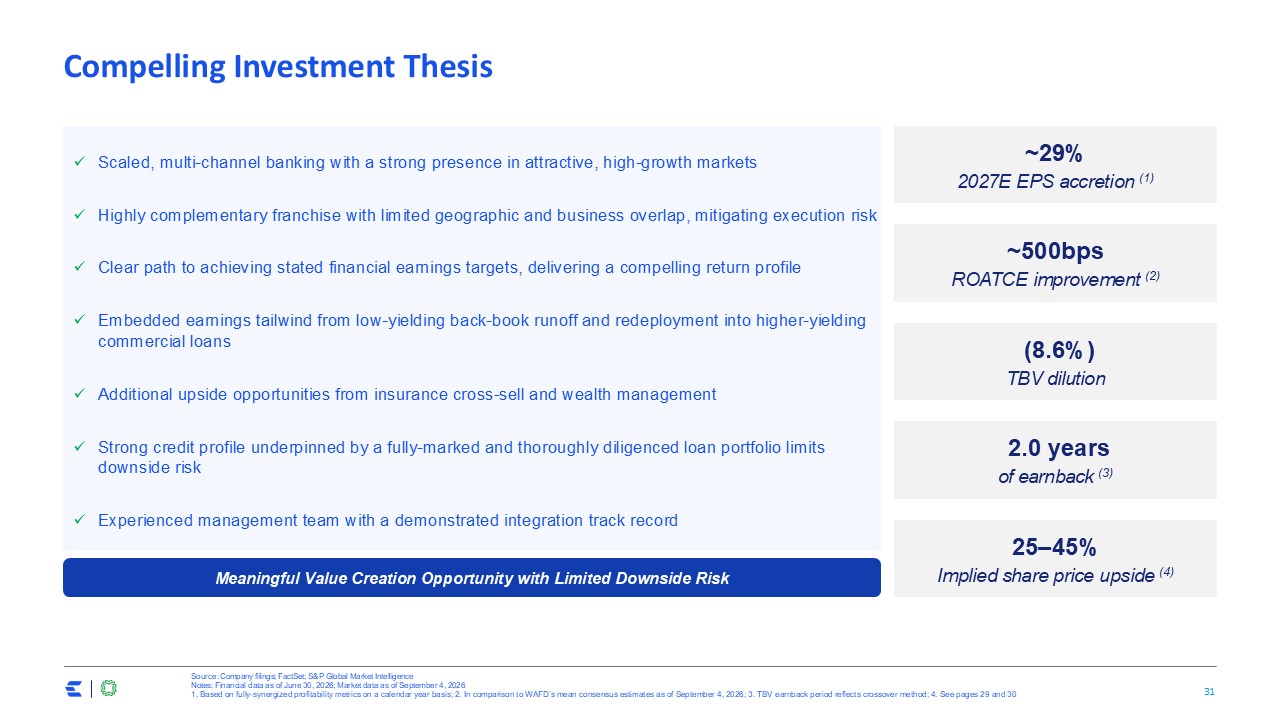
Compelling Investment Thesis Scaled, multi-channel banking with a strong presence
in attractive, high-growth markets Highly complementary franchise with limited geographic and business overlap, mitigating execution risk Clear path to achieving stated financial earnings targets, delivering a compelling return
profile Embedded earnings tailwind from low-yielding back-book runoff and redeployment into higher-yielding commercial loans Additional upside opportunities from insurance cross-sell and wealth management Strong credit profile underpinned by
a fully-marked and thoroughly diligenced loan portfolio limits downside risk Experienced management team with a demonstrated integration track record Meaningful Value Creation Opportunity with Limited Downside Risk ~29% 2027E EPS accretion
(1) ~500bps ROATCE improvement (2) 25–45% Implied share price upside (4) (8.6%) TBV dilution Source: Company filings; FactSet; S&P Global Market Intelligence Notes: Financial data as of June 30, 2026; Market data as of September
4, 2026 1. Based on fully-synergized profitability metrics on a calendar year basis; 2. In comparison to WAFD’s mean consensus estimates as of September 4, 2026; 3. TBV earnback period reflects crossover method; 4. See pages 29 and 30 2.0
years of earnback (3)

Appendix
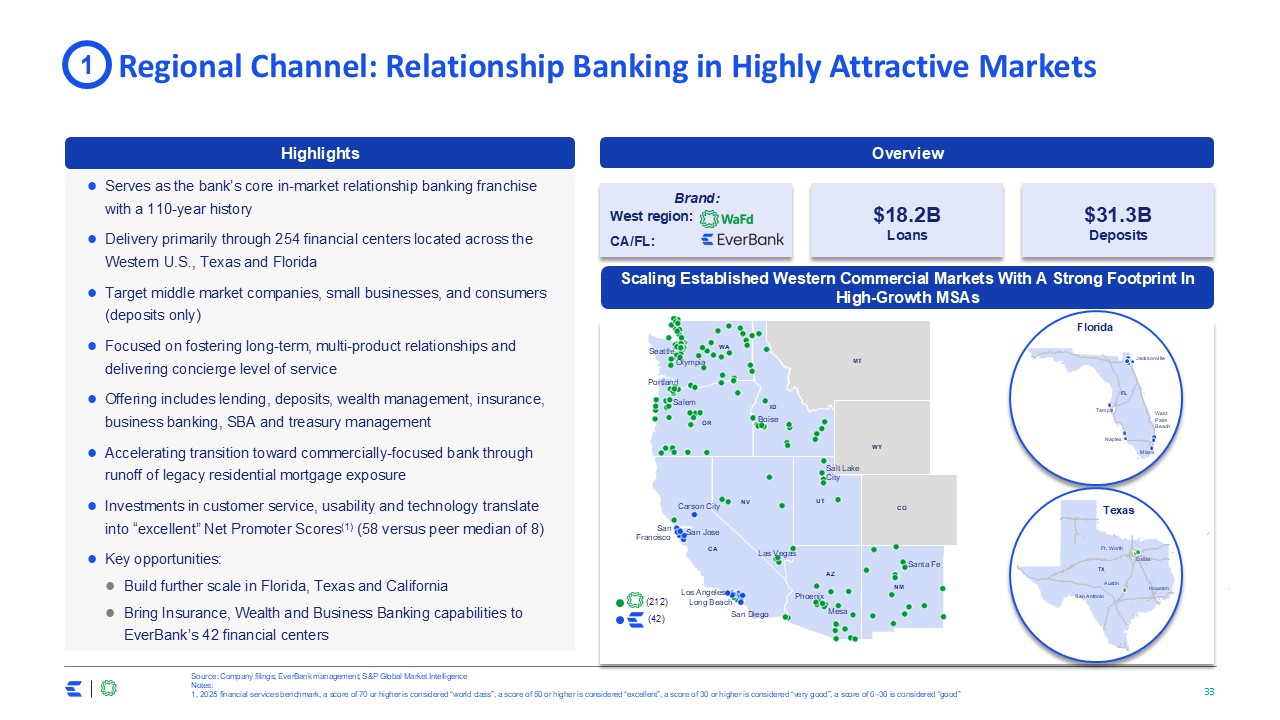
Regional Channel: Relationship Banking in Highly Attractive Markets Source:
Company filings; EverBank management; S&P Global Market Intelligence Notes: 1. 2025 financial services benchmark, a score of 70 or higher is considered “world class”, a score of 50 or higher is considered “excellent”, a score of 30 or
higher is considered “very good”, a score of 0–30 is considered “good” Serves as the bank’s core in-market relationship banking franchise with a 110-year history Delivery primarily through 254 financial centers located across the Western
U.S., Texas and Florida Target middle market companies, small businesses, and consumers (deposits only) Focused on fostering long-term, multi-product relationships and delivering concierge level of service Offering includes lending,
deposits, wealth management, insurance, business banking, SBA and treasury management Accelerating transition toward commercially-focused bank through runoff of legacy residential mortgage exposure Investments in customer service, usability
and technology translate into “excellent” Net Promoter Scores(1) (58 versus peer median of 8) Key opportunities: Build further scale in Florida, Texas and California Bring Insurance, Wealth and Business Banking capabilities to EverBank’s 42
financial centers Highlights 1 Overview $31.3B Deposits $18.2B Loans Brand: Scaling Established Western Commercial Markets With A Strong Footprint In High-Growth MSAs Florida FL Tampa Miami West
PalmBeach Jacksonville Naples Texas TX Dallas Austin San Antonio Ft. Worth Houston (212) (42) Portland MT West region: CA/FL: Seattle WA Olympia CA ID NV NM CO WY UT AZ OR Salem Boise Carson
City SanFrancisco San Jose Los Angeles Long Beach San Diego Phoenix Las Vegas Santa Fe Salt LakeCity Mesa
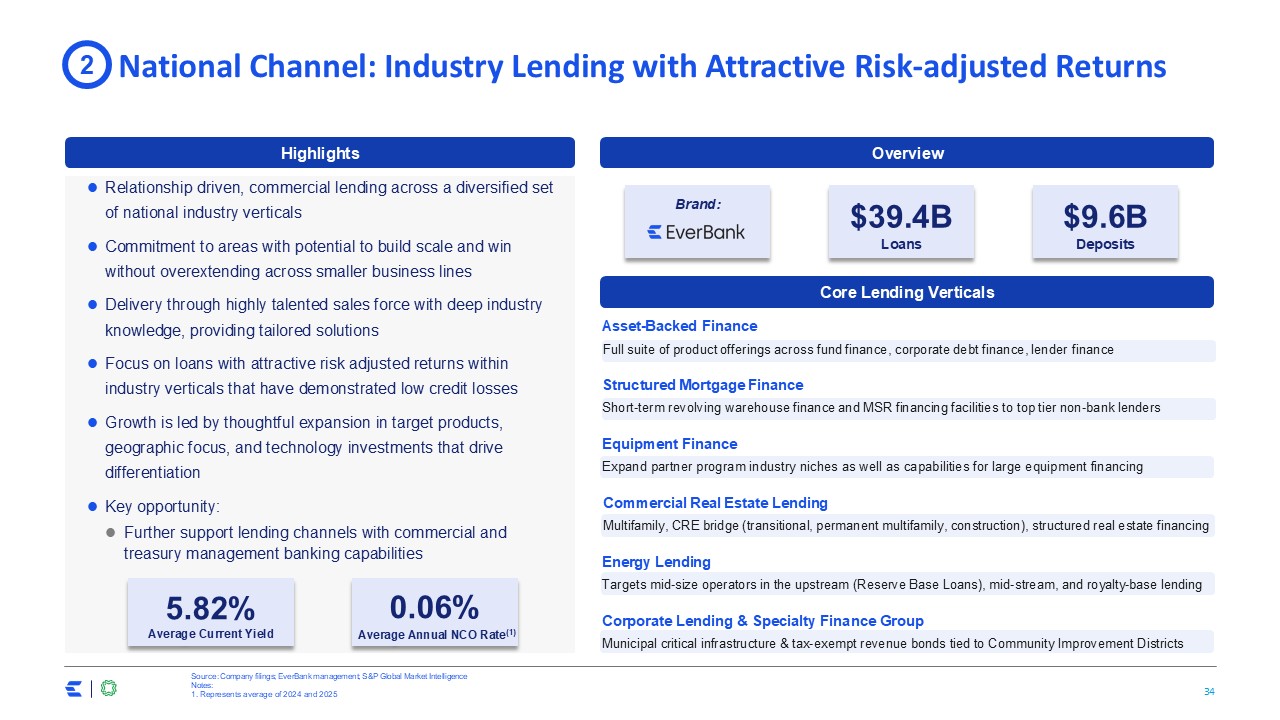
National Channel: Industry Lending with Attractive Risk-adjusted Returns Source:
Company filings; EverBank management; S&P Global Market Intelligence Notes: 1. Represents average of 2024 and 2025 Relationship driven, commercial lending across a diversified set of national industry verticals Commitment to areas with
potential to build scale and win without overextending across smaller business lines Delivery through highly talented sales force with deep industry knowledge, providing tailored solutions Focus on loans with attractive risk adjusted returns
within industry verticals that have demonstrated low credit losses Growth is led by thoughtful expansion in target products, geographic focus, and technology investments that drive differentiation Key opportunity: Further support lending
channels with commercial and treasury management banking capabilities Overview Highlights Core Lending Verticals 2 $9.6B Deposits $39.4B Loans Brand: 0.06% Average Annual NCO Rate(1) 5.82% Average Current Yield Asset-Backed
Finance Full suite of product offerings across fund finance, corporate debt finance, lender finance Commercial Real Estate Lending Multifamily, CRE bridge (transitional, permanent multifamily, construction), structured real estate
financing Structured Mortgage Finance Short-term revolving warehouse finance and MSR financing facilities to top tier non-bank lenders Corporate Lending & Specialty Finance Group Municipal critical infrastructure & tax-exempt
revenue bonds tied to Community Improvement Districts Equipment Finance Expand partner program industry niches as well as capabilities for large equipment financing Energy Lending Targets mid-size operators in the upstream (Reserve Base
Loans), mid-stream, and royalty-base lending
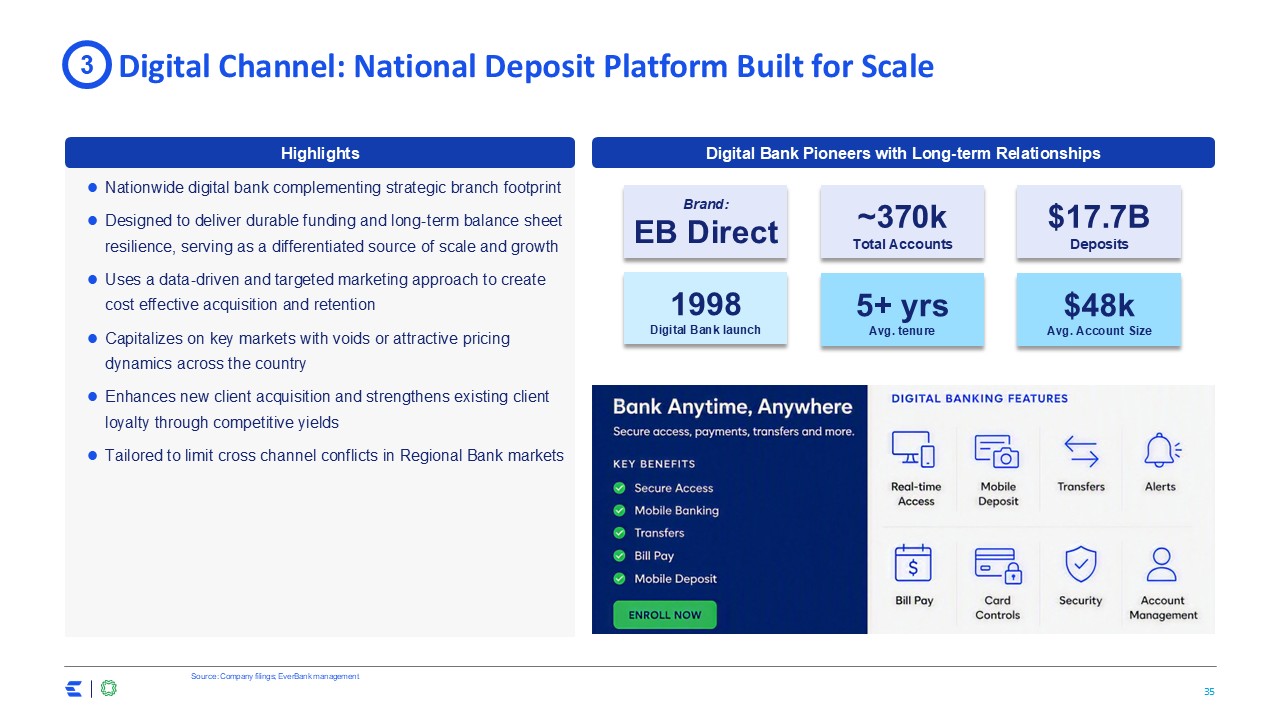
Digital Channel: National Deposit Platform Built for Scale Source: Company
filings; EverBank management Nationwide digital bank complementing strategic branch footprint Designed to deliver durable funding and long-term balance sheet resilience, serving as a differentiated source of scale and growth Uses a
data-driven and targeted marketing approach to create cost effective acquisition and retention Capitalizes on key markets with voids or attractive pricing dynamics across the country Enhances new client acquisition and strengthens existing
client loyalty through competitive yields Tailored to limit cross channel conflicts in Regional Bank markets Digital Bank Pioneers with Long-term Relationships Highlights 1998 Digital Bank launch 5+ yrs Avg.
tenure 3 $17.7B Deposits Brand: EB Direct ~370k Total Accounts $48k Avg. Account Size
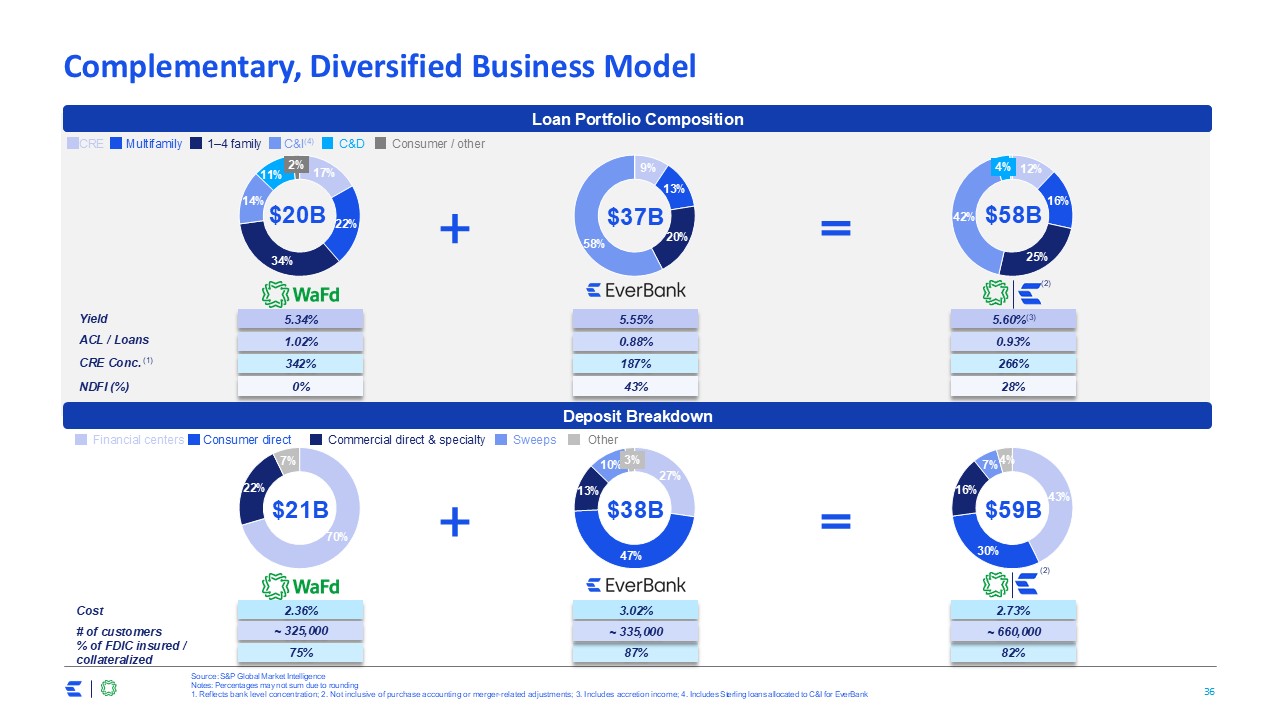
$38B $59B Complementary, Diversified Business Model Source: S&P Global
Market Intelligence Notes: Percentages may not sum due to rounding 1. Reflects bank level concentration; 2. Not inclusive of purchase accounting or merger-related adjustments; 3. Includes accretion income; 4. Includes Sterling loans allocated
to C&I for EverBank Loan Portfolio Composition Deposit Breakdown + = $21B Commercial direct & specialty Consumer direct Other Financial centers 5.34% 5.55% 5.60%(3) Yield Cost Sweeps 1.02% 0.88% 0.93% ACL /
Loans 342% 187% 266% CRE Conc. (1) 0% 43% 28% NDFI (%) # of customers 87% % of FDIC insured / collateralized 2.36% 3.02% ~ 325,000 ~ 335,000 82% 2.73% ~ 660,000 75% Loan Portfolio Composition + = $20B $37B $58B 1–4
family Multifamily C&I(4) CRE C&D Consumer / other (2) (2)
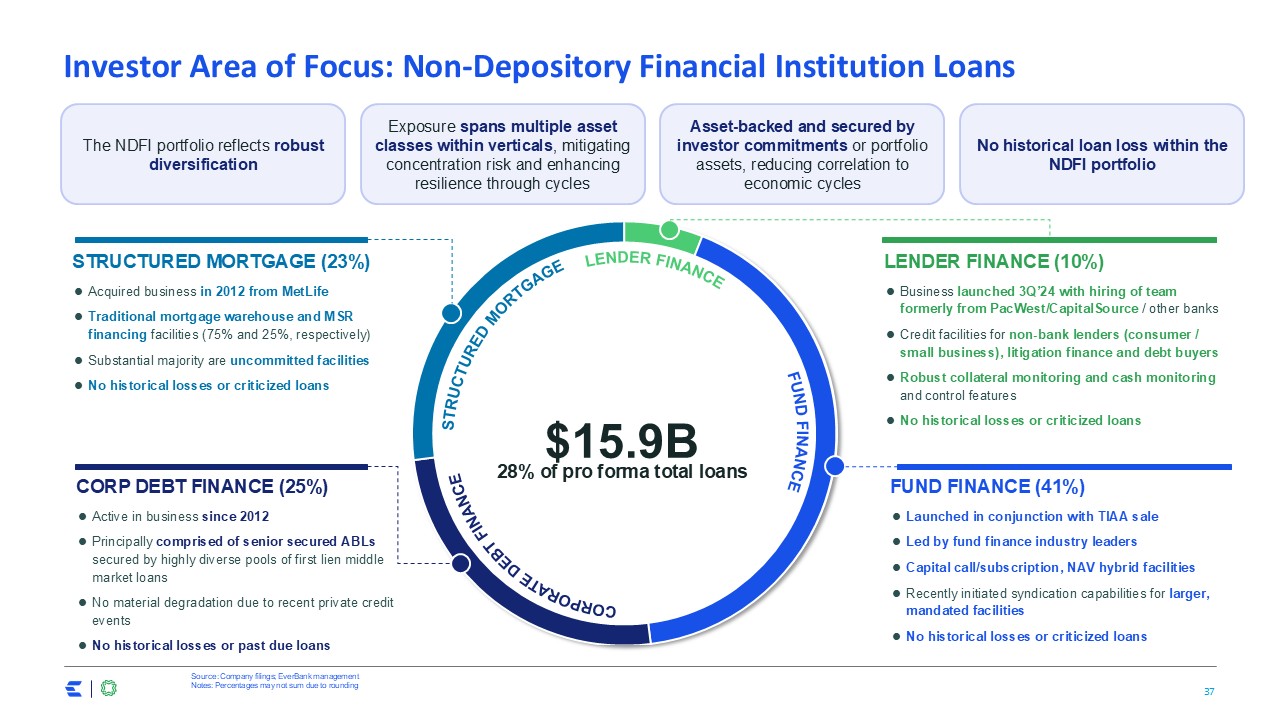
Investor Area of Focus: Non-Depository Financial Institution Loans Source:
Company filings; EverBank management Notes: Percentages may not sum due to rounding FUND FINANCE (41%) Launched in conjunction with TIAA sale Led by fund finance industry leaders Capital call/subscription, NAV hybrid facilities
Recently initiated syndication capabilities for larger, mandated facilities No historical losses or criticized loans Fund finance CORPORATE DEBT FINANCE Lender finance STRUCTURED mortgage $15.9B LENDER FINANCE (10%) Business launched
3Q’24 with hiring of team formerly from PacWest/CapitalSource / other banks Credit facilities for non-bank lenders (consumer / small business), litigation finance and debt buyers Robust collateral monitoring and cash monitoring and control
features No historical losses or criticized loans CORP DEBT FINANCE (25%) Active in business since 2012 Principally comprised of senior secured ABLs secured by highly diverse pools of first lien middle market loans No material degradation
due to recent private credit events No historical losses or past due loans STRUCTURED MORTGAGE (23%) Acquired business in 2012 from MetLife Traditional mortgage warehouse and MSR financing facilities (75% and 25%,
respectively) Substantial majority are uncommitted facilities No historical losses or criticized loans The NDFI portfolio reflects robust diversification Exposure spans multiple asset classes within verticals, mitigating concentration risk
and enhancing resilience through cycles Asset-backed and secured by investor commitments or portfolio assets, reducing correlation to economic cycles No historical loan loss within the NDFI portfolio 28% of pro forma total loans
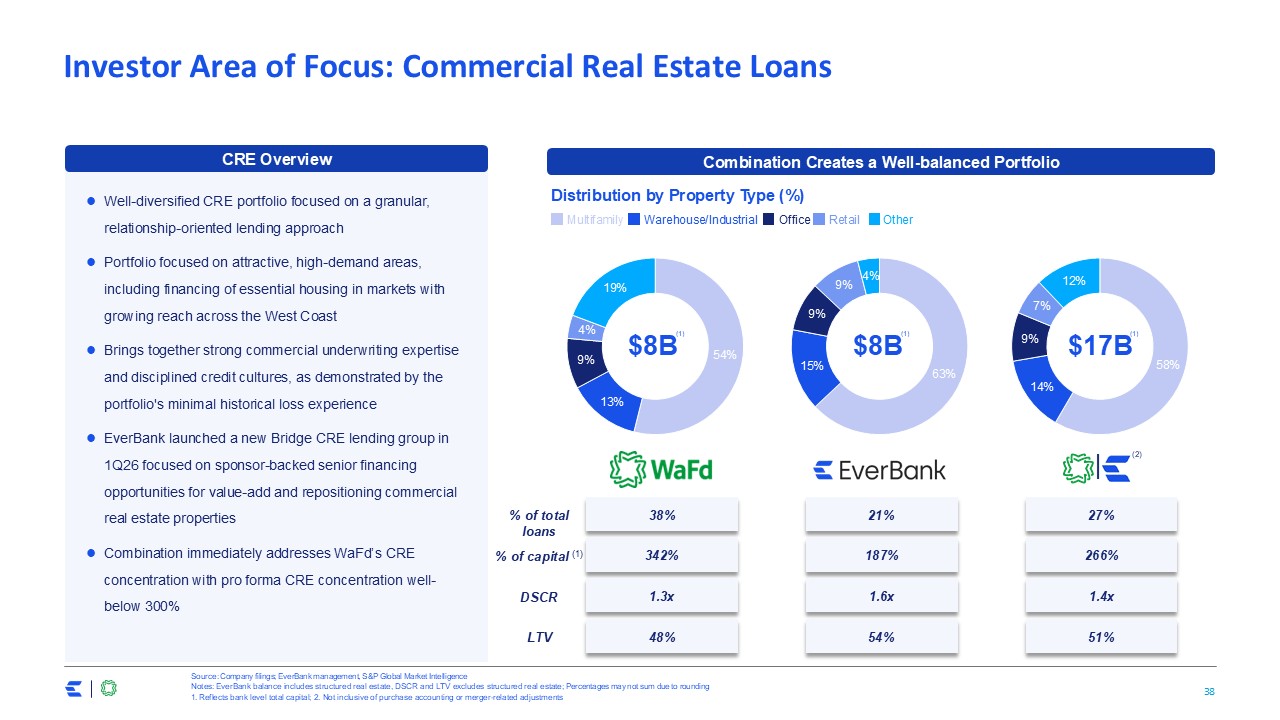
Investor Area of Focus: Commercial Real Estate Loans Source: Company filings;
EverBank management, S&P Global Market Intelligence Notes: EverBank balance includes structured real estate, DSCR and LTV excludes structured real estate; Percentages may not sum due to rounding 1. Reflects bank level total capital; 2.
Not inclusive of purchase accounting or merger-related adjustments 14% 4% 63% 15% 9% 9% Well-diversified CRE portfolio focused on a granular, relationship-oriented lending approach Portfolio focused on attractive, high-demand areas,
including financing of essential housing in markets with growing reach across the West Coast Brings together strong commercial underwriting expertise and disciplined credit cultures, as demonstrated by the portfolio's minimal historical loss
experience EverBank launched a new Bridge CRE lending group in 1Q26 focused on sponsor-backed senior financing opportunities for value-add and repositioning commercial real estate properties Combination immediately addresses WaFd’s CRE
concentration with pro forma CRE concentration well-below 300% CRE Overview Combination Creates a Well-balanced Portfolio % of total loans % of capital (1) Distribution by Property Type (%) $8B $8B $17B Retail Warehouse/Industrial
Office Multifamily Other DSCR 21% 187% 1.6x 54% 38% 342% 1.3x 48% 27% 266% 1.4x 51% LTV (2) | (1) (1) (1)
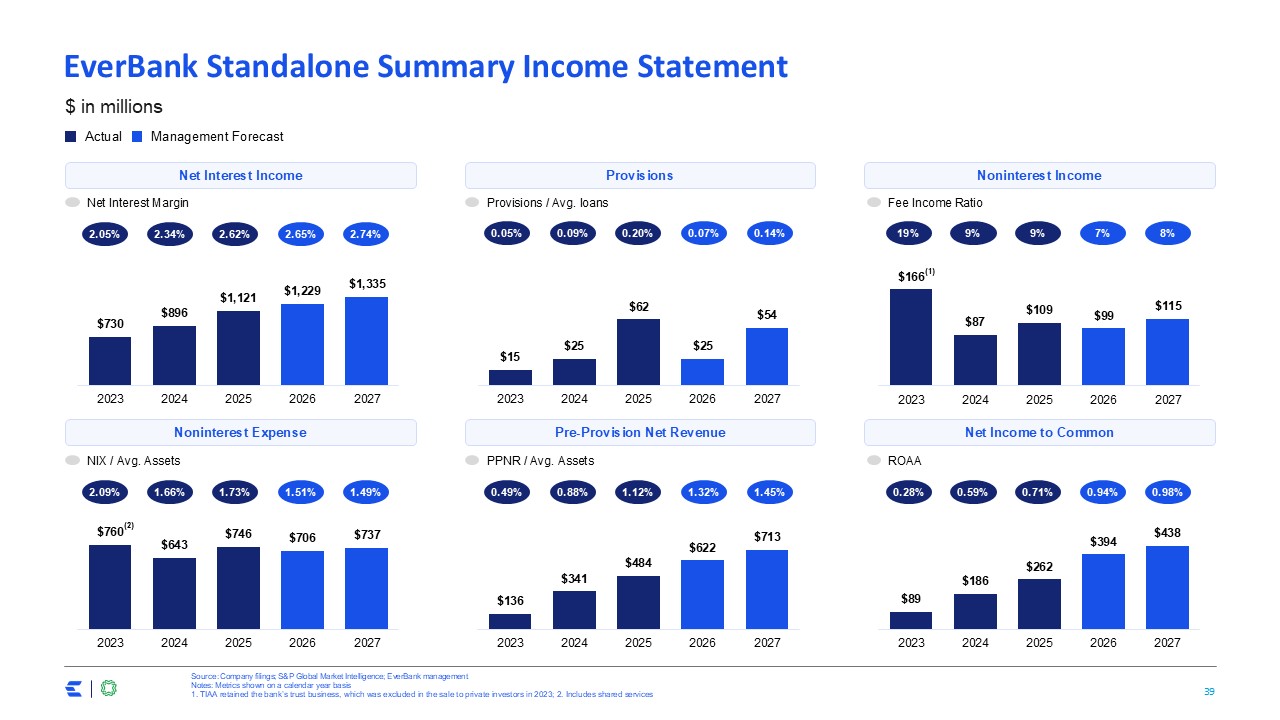
EverBank Standalone Summary Income Statement $ in millions Noninterest
Income Provisions Net Interest Income 2.05% 2.34% 2.62% Net Interest Margin 0.05% 0.09% 0.20% Provisions / Avg. loans Net Income to Common Pre-Provision Net Revenue Noninterest Expense 19% 9% 9% Fee Income
Ratio 2.09% 1.66% 1.73% NIX / Avg. Assets 0.49% 0.88% 1.12% PPNR / Avg. Assets 0.28% 0.59% 0.71% ROAA Source: Company filings; S&P Global Market Intelligence; EverBank management Notes: Metrics shown on a calendar year
basis 1. TIAA retained the bank’s trust business, which was excluded in the sale to private investors in 2023; 2. Includes shared services Management
Forecast Actual 2.65% 2.74% 0.07% 0.14% 7% 8% 1.51% 1.49% 1.32% 1.45% 0.94% 0.98% (2) (1)
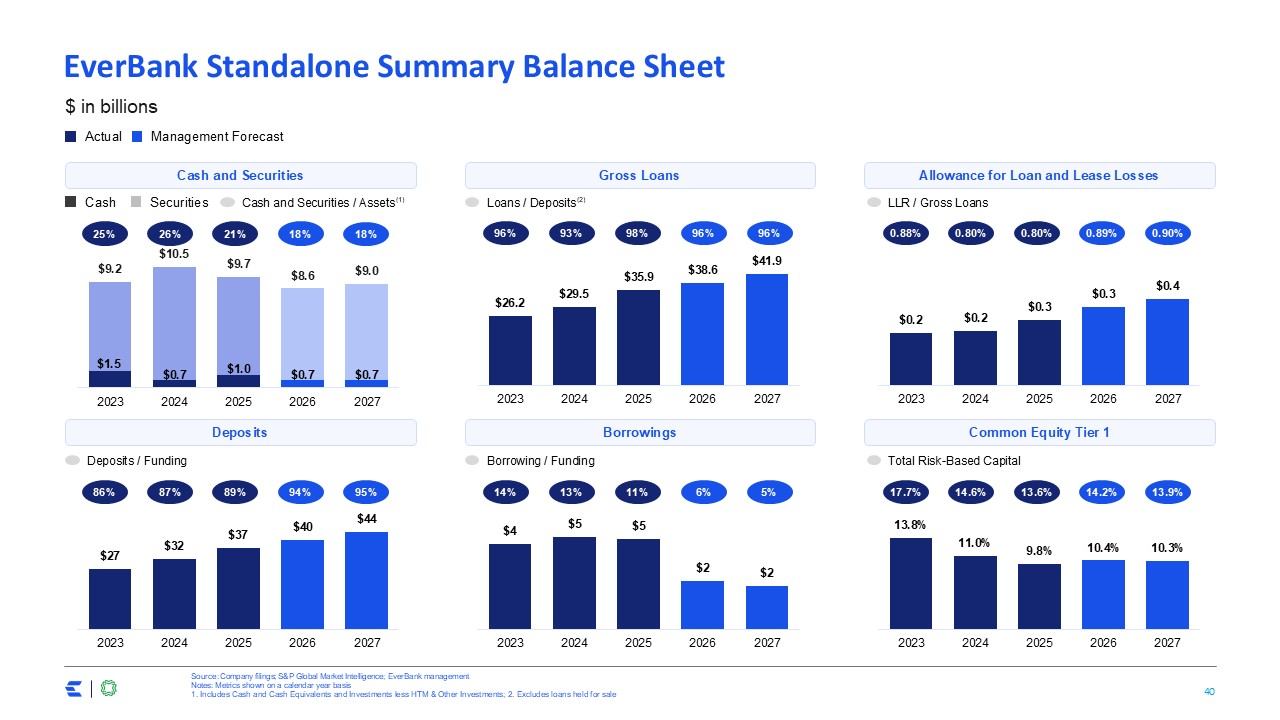
EverBank Standalone Summary Balance Sheet $ in billions Allowance for Loan and
Lease Losses Gross Loans Cash and Securities Common Equity Tier 1 Borrowings Deposits Securities Cash 25% 26% 21% Cash and Securities / Assets 96% 93% Loans / Deposits (2) 0.88% 0.80% 0.80% LLR / Gross
Loans 86% 87% Deposits / Funding Borrowing / Funding Total Risk-Based Capital (1) Source: Company filings; S&P Global Market Intelligence; EverBank management Notes: Metrics shown on a calendar year basis 1. Includes Cash and Cash
Equivalents and Investments less HTM & Other Investments; 2. Excludes loans held for sale 17.7% 14.6% 13.6% 14% 13% 11% 98% 89% Management Forecast Actual 18% 18% 96% 96% 0.89% 0.90% 94% 95% 6% 5% 14.2% 13.9%
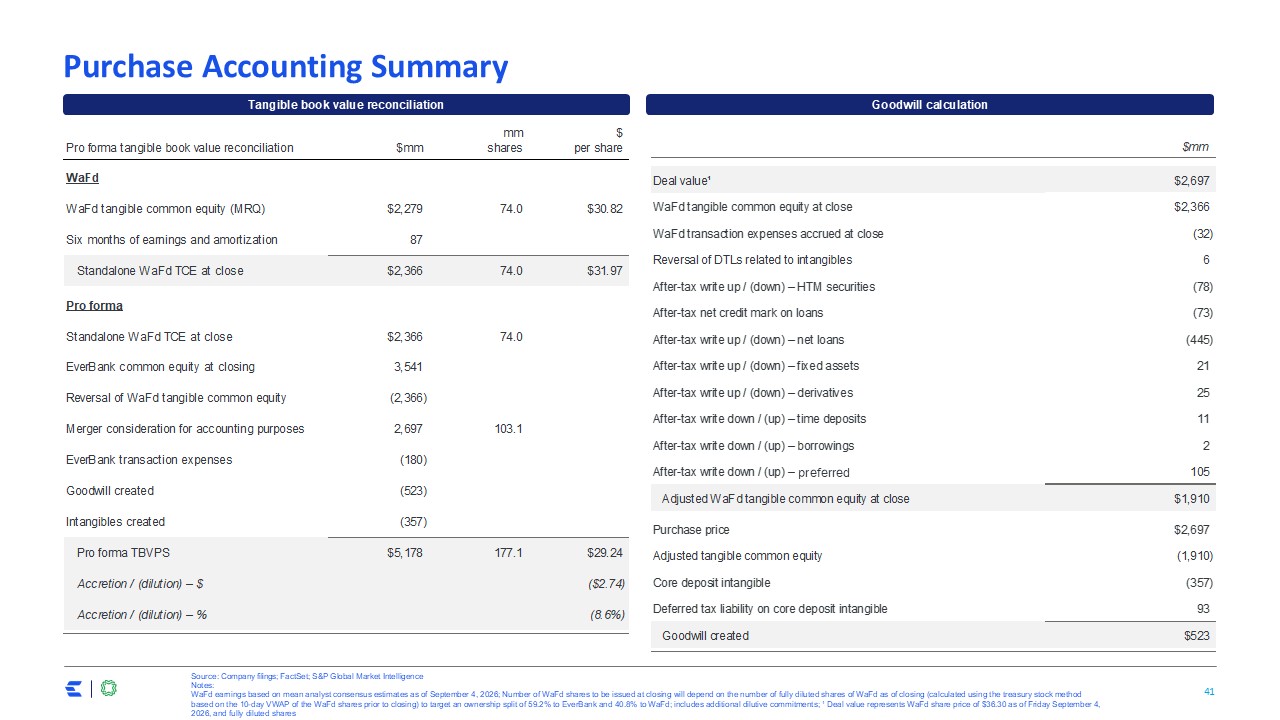
Purchase Accounting Summary Source: Company filings; FactSet; S&P Global
Market Intelligence Notes: WaFd earnings based on mean analyst consensus estimates as of September 4, 2026; Number of WaFd shares to be issued at closing will depend on the number of fully diluted shares of WaFd as of closing (calculated
using the treasury stock method based on the 10-day VWAP of the WaFd shares prior to closing) to target an ownership split of 59.2% to EverBank and 40.8% to WaFd; includes additional dilutive commitments; ¹ Deal value represents WaFd share
price of $36.30 as of Friday September 4, 2026, and fully diluted shares Tangible book value reconciliation Goodwill calculation preferred
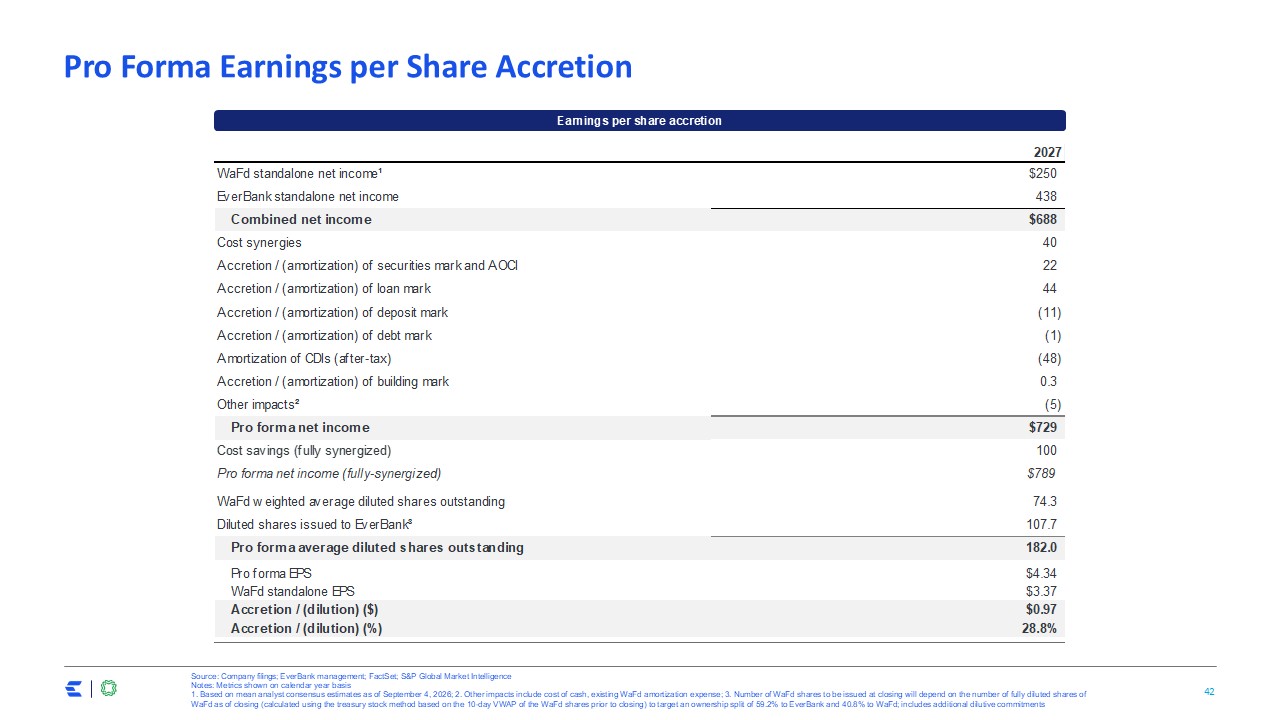
Pro Forma Earnings per Share Accretion Source: Company filings; EverBank
management; FactSet; S&P Global Market Intelligence Notes: Metrics shown on calendar year basis 1. Based on mean analyst consensus estimates as of September 4, 2026; 2. Other impacts include cost of cash, existing WaFd amortization
expense; 3. Number of WaFd shares to be issued at closing will depend on the number of fully diluted shares of WaFd as of closing (calculated using the treasury stock method based on the 10-day VWAP of the WaFd shares prior to closing) to
target an ownership split of 59.2% to EverBank and 40.8% to WaFd; includes additional dilutive commitments Earnings per share accretion
STRONGER TOGETHER