Shareholder Report
|
6 Months Ended |
|
Jun. 30, 2026
USD ($)
Holding
|
|---|
| Shareholder Report [Line Items] |
|
| Document Type |
N-CSRS
|
| Amendment Flag |
false
|
| Registrant Name |
Gabelli Dividend Growth Fund
|
| Entity Central Index Key |
0001086884
|
| Entity Investment Company Type |
N-1A
|
| Document Period End Date |
Jun. 30, 2026
|
| C000002889 |
|
| Shareholder Report [Line Items] |
|
| Fund Name |
The Gabelli Dividend Growth Fund
|
| Class Name |
Class AAA
|
| Trading Symbol |
GABBX
|
| Annual or Semi-Annual Statement [Text Block] |
This semi-annual shareholder report contains important information about The Gabelli Dividend Growth Fund (the "Fund") for the period of January 1, 2026 to June 30, 2026.
|
| Additional Information [Text Block] |
You can find additional information about the Fund, including the Fund’s prospectus, financial information, holdings, and proxy voting information, at https://gabelli.com/ticker/GABBX/. You can also request information by contacting us at 800-GABELLI (800-422-3554).
|
| Additional Information Phone Number |
800-GABELLI (800-422-3554)
|
| Additional Information Website |
https://gabelli.com/ticker/GABBX/
|
| Expenses [Text Block] |
What were the Fund costs for the last six months?
(based on a hypothetical $10,000 investment)
Table Summary
Class Name |
Costs of a $10k Investment |
Costs Paid as a % of a $10k Investment |
The Gabelli Dividend Growth Fund - Class AAA
|
$103 |
2.01% |
|
| Expenses Paid, Amount |
$ 103
|
| Expense Ratio, Percent |
2.01%
|
| Factors Affecting Performance [Text Block] |
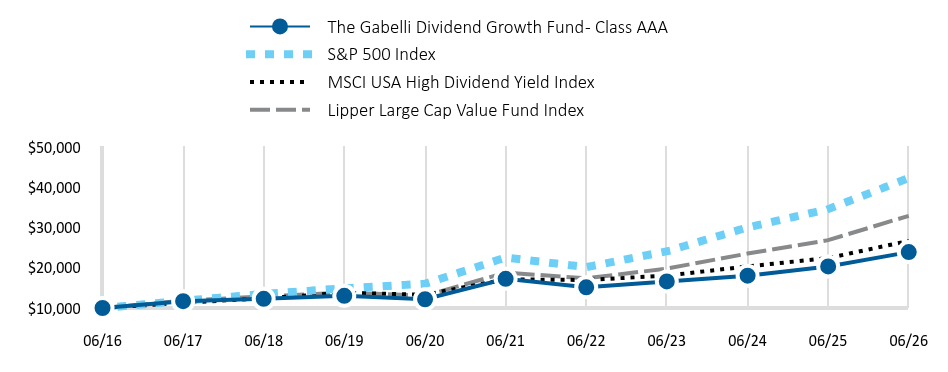
How did the Fund perform?
For the six months ended June 30, 2026, The Gabelli Dividend Growth Fund underperformed its broad-based and comparative benchmarks the S&P 500, MSCI USA High Dividend Yield, and Lipper Large Cap Value Fund Indices. Earnings strength more than trumped a handful of economic and market concerns, including the Iran conflict and higher oil prices, a weak consumer, a strengthening US dollar, and a material flattening of the yield curve. Contributors included Moderna, Inc., Hewlett Packard Enterprise Co., and Merck & Co, Inc. Detractors included Toyota Motor Corp., Fidelity National Information Services, and HubSpot, Inc.
|
| Performance Past Does Not Indicate Future [Text] |
Past performance does not guarantee future results.
|
| Line Graph [Table Text Block] |
Table Summary
|
The Gabelli Dividend Growth Fund - Class AAA |
S&P 500 Index |
MSCI USA High Dividend Yield Index |
Lipper Large Cap Value Fund Index |
06/16 |
10,000 |
10,000 |
10,000 |
10,000 |
06/17 |
11,689 |
11,790 |
11,308 |
11,798 |
06/18 |
12,273 |
13,484 |
12,403 |
12,889 |
06/19 |
13,034 |
14,889 |
13,784 |
13,838 |
06/20 |
12,169 |
16,007 |
13,296 |
13,027 |
06/21 |
17,234 |
22,537 |
17,104 |
18,784 |
06/22 |
15,130 |
20,143 |
16,961 |
17,362 |
06/23 |
16,600 |
24,090 |
18,038 |
19,782 |
06/24 |
18,033 |
30,006 |
20,328 |
23,525 |
06/25 |
20,332 |
34,555 |
22,406 |
26,851 |
06/26 |
23,880 |
42,268 |
26,670 |
32,898 |
|
| Average Annual Return [Table Text Block] |
Table Summary
|
6 months |
1 Year |
5 Year |
10 Year |
The Gabelli Dividend Growth Fund - Class AAA |
7.30% |
17.45% |
6.74% |
9.09% |
S&P 500 Index |
10.21% |
22.32% |
13.41% |
15.51% |
MSCI USA High Dividend Yield Index |
11.51% |
19.03% |
9.29% |
10.31% |
Lipper Large Cap Value Fund Index |
11.23% |
22.52% |
11.86% |
12.65% |
|
| No Deduction of Taxes [Text Block] |
The table and graph presented above do not reflect the deduction of taxes a shareholder would pay on Fund distributions or the redemption of Fund shares.
|
| AssetsNet |
$ 21,825,183
|
| Holdings Count | Holding |
59
|
| Advisory Fees Paid, Amount |
$ 56,669
|
| InvestmentCompanyPortfolioTurnover |
23.00%
|
| Additional Fund Statistics [Text Block] |
- Total Net Assets$21,825,183
- Number of Portfolio Holdings59
- Portfolio Turnover Rate23%
- Management Fees$56,669
|
| Holdings [Text Block] |
Portfolio Weighting (% of net assets)
Table Summary
Common Stocks |
96.3% |
U.S. Government Obligations |
3.1% |
Other Assets and Liabilities (Net) |
0.6% |
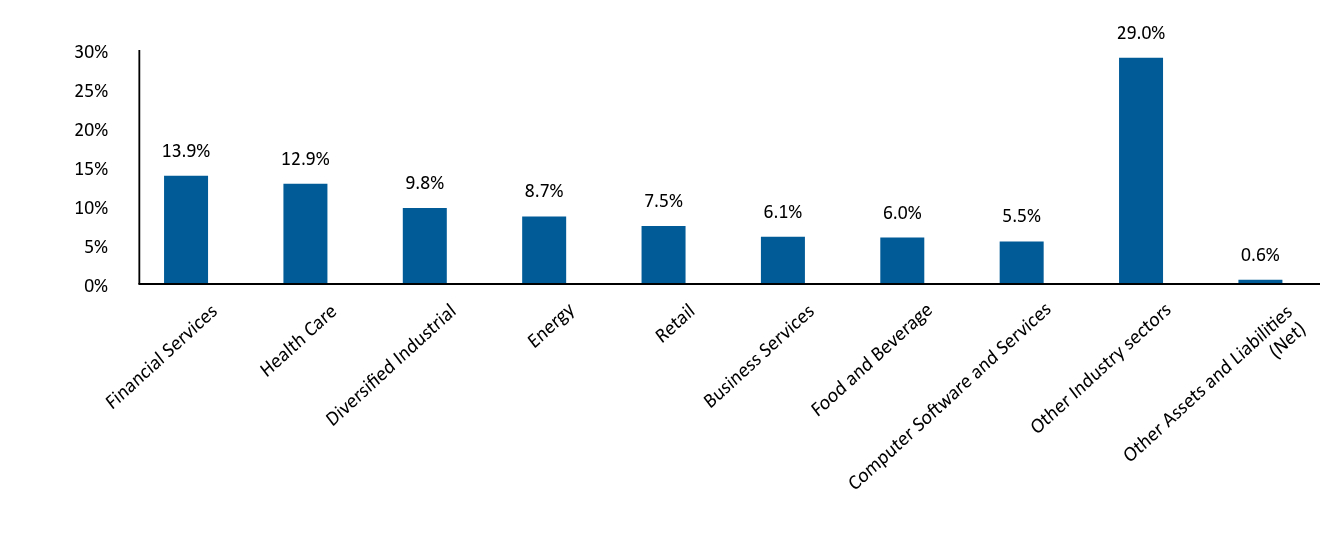
Industry Allocation (% of net assets)
Table Summary
Industry Weighting |
. |
Financial Services |
13.9% |
Health Care |
12.9% |
Diversified Industrial |
9.8% |
Energy |
8.7% |
Retail |
7.5% |
Business Services |
6.1% |
Food and Beverage |
6.0% |
Computer Software and Services |
5.5% |
Other Industry sectors |
29.0% |
Other Assets and Liabilities (Net) |
0.6% |
|
| Largest Holdings [Text Block] |
Top 10 Holdings (% of net assets)
Table Summary
Merck & Co. Inc. |
5.3% |
Amazon.com Inc. |
4.2% |
Alphabet Inc. |
3.2% |
Citigroup Inc. |
3.2% |
The PNC Financial Services Group Inc. |
3.2% |
Mondelez International Inc. |
2.9% |
Belden Inc. |
2.6% |
American International Group Inc. |
2.6% |
The Cigna Group |
2.5% |
PPL Corp. |
2.2% |
|
| Material Fund Change [Text Block] |
|
| Updated Prospectus Phone Number |
800-GABELLI (800-422-3554)
|
| Updated Prospectus Email Address |
<span style="box-sizing: border-box; color: rgb(0, 0, 0); display: inline; flex-wrap: nowrap; font-size: 12px; font-weight: 400; grid-area: auto; line-height: 18px; margin: 0px; overflow: visible; text-align: justify; text-align-last: left; white-space-collapse: preserve-breaks;">info@gabelli.com</span>
|
| Updated Prospectus Web Address |
https://gabelli.com/ticker/GABBX/
|
| C000002891 |
|
| Shareholder Report [Line Items] |
|
| Fund Name |
The Gabelli Dividend Growth Fund
|
| Class Name |
Class C
|
| Trading Symbol |
GBCCX
|
| Annual or Semi-Annual Statement [Text Block] |
This semi-annual shareholder report contains important information about The Gabelli Dividend Growth Fund (the "Fund") for the period of January 1, 2026 to June 30, 2026.
|
| Additional Information [Text Block] |
You can find additional information about the Fund, including the Fund’s prospectus, financial information, holdings, and proxy voting information, at https://gabelli.com/ticker/GBCCX/. You can also request information by contacting us at 800-GABELLI (800-422-3554).
|
| Additional Information Phone Number |
800-GABELLI (800-422-3554)
|
| Additional Information Website |
https://gabelli.com/ticker/GBCCX/
|
| Expenses [Text Block] |
What were the Fund costs for the last six months?
(based on a hypothetical $10,000 investment)
Table Summary
Class Name |
Costs of a $10k Investment |
Costs Paid as a % of a $10k Investment |
The Gabelli Dividend Growth Fund - Class C
|
$142 |
2.76% |
|
| Expenses Paid, Amount |
$ 142
|
| Expense Ratio, Percent |
2.76%
|
| Factors Affecting Performance [Text Block] |
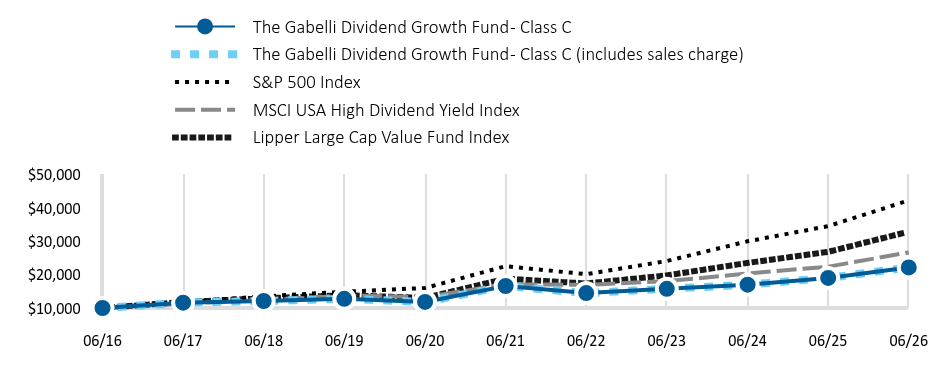
How did the Fund perform?
For the six months ended June 30, 2026, The Gabelli Dividend Growth Fund underperformed its broad-based and comparative benchmarks the S&P 500, MSCI USA High Dividend Yield, and Lipper Large Cap Value Fund Indices. Earnings strength more than trumped a handful of economic and market concerns, including the Iran conflict and higher oil prices, a weak consumer, a strengthening US dollar, and a material flattening of the yield curve. Contributors included Moderna, Inc., Hewlett Packard Enterprise Co., and Merck & Co, Inc. Detractors included Toyota Motor Corp., Fidelity National Information Services, and HubSpot, Inc.
|
| Performance Past Does Not Indicate Future [Text] |
Past performance does not guarantee future results.
|
| Line Graph [Table Text Block] |
Table Summary
|
The Gabelli Dividend Growth Fund - Class C |
The Gabelli Dividend Growth Fund - Class C (includes sales charge) |
S&P 500 Index |
MSCI USA High Dividend Yield Index |
Lipper Large Cap Value Fund Index |
06/16 |
10,000 |
10,000 |
10,000 |
10,000 |
10,000 |
06/17 |
11,607 |
11,607 |
11,790 |
11,308 |
11,798 |
06/18 |
12,098 |
12,098 |
13,484 |
12,403 |
12,889 |
06/19 |
12,748 |
12,748 |
14,889 |
13,784 |
13,838 |
06/20 |
11,815 |
11,815 |
16,007 |
13,296 |
13,027 |
06/21 |
16,604 |
16,604 |
22,537 |
17,104 |
18,784 |
06/22 |
14,468 |
14,468 |
20,143 |
16,961 |
17,362 |
06/23 |
15,760 |
15,760 |
24,090 |
18,038 |
19,782 |
06/24 |
16,994 |
16,994 |
30,006 |
20,328 |
23,525 |
06/25 |
19,021 |
19,021 |
34,555 |
22,406 |
26,851 |
06/26 |
22,169 |
22,169 |
42,268 |
26,670 |
32,898 |
|
| Average Annual Return [Table Text Block] |
Table Summary
|
6 months |
1 Year |
5 Year |
10 Year |
The Gabelli Dividend Growth Fund - Class C |
6.89% |
16.55% |
5.95% |
8.29% |
The Gabelli Dividend Growth Fund - Class C (includes sales charge) |
5.89% |
15.55% |
5.95% |
8.29% |
S&P 500 Index |
10.21% |
22.32% |
13.41% |
15.51% |
MSCI USA High Dividend Yield Index |
11.51% |
19.03% |
9.29% |
10.31% |
Lipper Large Cap Value Fund Index |
11.23% |
22.52% |
11.86% |
12.65% |
|
| No Deduction of Taxes [Text Block] |
The table and graph presented above do not reflect the deduction of taxes a shareholder would pay on Fund distributions or the redemption of Fund shares.
|
| AssetsNet |
$ 21,825,183
|
| Holdings Count | Holding |
59
|
| Advisory Fees Paid, Amount |
$ 56,669
|
| InvestmentCompanyPortfolioTurnover |
23.00%
|
| Additional Fund Statistics [Text Block] |
- Total Net Assets$21,825,183
- Number of Portfolio Holdings59
- Portfolio Turnover Rate23%
- Management Fees$56,669
|
| Holdings [Text Block] |
Portfolio Weighting (% of net assets)
Table Summary
Common Stocks |
96.3% |
U.S. Government Obligations |
3.1% |
Other Assets and Liabilities (Net) |
0.6% |
Industry Allocation (% of net assets)
Table Summary
Industry Weighting |
. |
Financial Services |
13.9% |
Health Care |
12.9% |
Diversified Industrial |
9.8% |
Energy |
8.7% |
Retail |
7.5% |
Business Services |
6.1% |
Food and Beverage |
6.0% |
Computer Software and Services |
5.5% |
Other Industry sectors |
29.0% |
Other Assets and Liabilities (Net) |
0.6% |
|
| Largest Holdings [Text Block] |
Top 10 Holdings (% of net assets)
Table Summary
Merck & Co. Inc. |
5.3% |
Amazon.com Inc. |
4.2% |
Alphabet Inc. |
3.2% |
Citigroup Inc. |
3.2% |
The PNC Financial Services Group Inc. |
3.2% |
Mondelez International Inc. |
2.9% |
Belden Inc. |
2.6% |
American International Group Inc. |
2.6% |
The Cigna Group |
2.5% |
PPL Corp. |
2.2% |
|
| Material Fund Change [Text Block] |
|
| Updated Prospectus Phone Number |
800-GABELLI (800-422-3554)
|
| Updated Prospectus Email Address |
<span style="box-sizing: border-box; color: rgb(0, 0, 0); display: inline; flex-wrap: nowrap; font-size: 12px; font-weight: 400; grid-area: auto; line-height: 18px; margin: 0px; overflow: visible; text-align: justify; text-align-last: left; white-space-collapse: preserve-breaks;">info@gabelli.com</span>
|
| Updated Prospectus Web Address |
https://gabelli.com/ticker/GBCCX/
|
| C000002887 |
|
| Shareholder Report [Line Items] |
|
| Fund Name |
The Gabelli Dividend Growth Fund
|
| Class Name |
Class I
|
| Trading Symbol |
GBCIX
|
| Annual or Semi-Annual Statement [Text Block] |
This semi-annual shareholder report contains important information about The Gabelli Dividend Growth Fund (the "Fund") for the period of January 1, 2026 to June 30, 2026.
|
| Additional Information [Text Block] |
You can find additional information about the Fund, including the Fund’s prospectus, financial information, holdings, and proxy voting information, at https://gabelli.com/ticker/GBCIX/. You can also request information by contacting us at 800-GABELLI (800-422-3554).
|
| Additional Information Phone Number |
800-GABELLI (800-422-3554)
|
| Additional Information Website |
https://gabelli.com/ticker/GBCIX/
|
| Expenses [Text Block] |
What were the Fund costs for the last six months?
(based on a hypothetical $10,000 investment)
Table Summary
Class Name |
Costs of a $10k Investment |
Costs Paid as a % of a $10k Investment |
The Gabelli Dividend Growth Fund - Class I
|
$52 |
1.00% |
|
| Expenses Paid, Amount |
$ 52
|
| Expense Ratio, Percent |
1.00%
|
| Factors Affecting Performance [Text Block] |
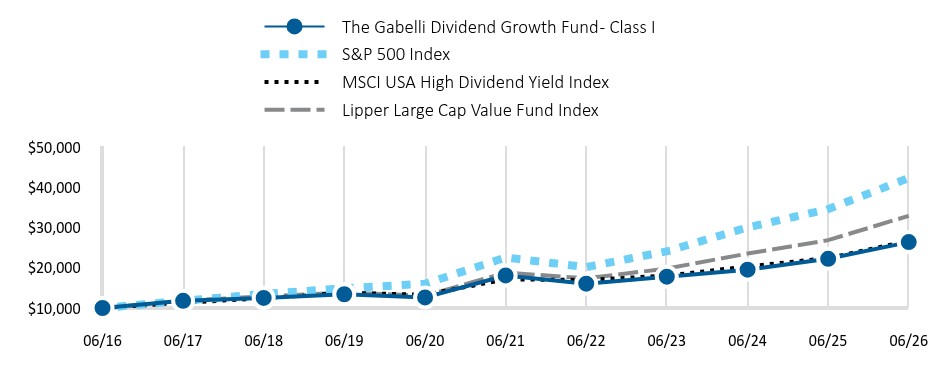
How did the Fund perform?
For the six months ended June 30, 2026, The Gabelli Dividend Growth Fund underperformed its broad-based and comparative benchmarks the S&P 500, MSCI USA High Dividend Yield, and Lipper Large Cap Value Fund Indices. Earnings strength more than trumped a handful of economic and market concerns, including the Iran conflict and higher oil prices, a weak consumer, a strengthening US dollar, and a material flattening of the yield curve. Contributors included Moderna, Inc., Hewlett Packard Enterprise Co., and Merck & Co, Inc. Detractors included Toyota Motor Corp., Fidelity National Information Services, and HubSpot, Inc.
|
| Performance Past Does Not Indicate Future [Text] |
Past performance does not guarantee future results.
|
| Line Graph [Table Text Block] |
Table Summary
|
The Gabelli Dividend Growth Fund - Class I |
S&P 500 Index |
MSCI USA High Dividend Yield Index |
Lipper Large Cap Value Fund Index |
06/16 |
10,000 |
10,000 |
10,000 |
10,000 |
06/17 |
11,780 |
11,790 |
11,308 |
11,798 |
06/18 |
12,498 |
13,484 |
12,403 |
12,889 |
06/19 |
13,410 |
14,889 |
13,784 |
13,838 |
06/20 |
12,638 |
16,007 |
13,296 |
13,027 |
06/21 |
18,085 |
22,537 |
17,104 |
18,784 |
06/22 |
16,036 |
20,143 |
16,961 |
17,362 |
06/23 |
17,777 |
24,090 |
18,038 |
19,782 |
06/24 |
19,514 |
30,006 |
20,328 |
23,525 |
06/25 |
22,219 |
34,555 |
22,406 |
26,851 |
06/26 |
26,368 |
42,268 |
26,670 |
32,898 |
|
| Average Annual Return [Table Text Block] |
Table Summary
|
6 months |
1 Year |
5 Year |
10 Year |
The Gabelli Dividend Growth Fund - Class I |
7.84% |
18.68% |
7.83% |
10.18% |
S&P 500 Index |
10.21% |
22.32% |
13.41% |
15.51% |
MSCI USA High Dividend Yield Index |
11.51% |
19.03% |
9.29% |
10.31% |
Lipper Large Cap Value Fund Index |
11.23% |
22.52% |
11.86% |
12.65% |
|
| No Deduction of Taxes [Text Block] |
The table and graph presented above do not reflect the deduction of taxes a shareholder would pay on Fund distributions or the redemption of Fund shares.
|
| AssetsNet |
$ 21,825,183
|
| Holdings Count | Holding |
59
|
| Advisory Fees Paid, Amount |
$ 56,669
|
| InvestmentCompanyPortfolioTurnover |
23.00%
|
| Additional Fund Statistics [Text Block] |
- Total Net Assets$21,825,183
- Number of Portfolio Holdings59
- Portfolio Turnover Rate23%
- Management Fees$56,669
|
| Holdings [Text Block] |
Portfolio Weighting (% of net assets)
Table Summary
Common Stocks |
96.3% |
U.S. Government Obligations |
3.1% |
Other Assets and Liabilities (Net) |
0.6% |
Industry Allocation (% of net assets)
Table Summary
Industry Weighting |
. |
Financial Services |
13.9% |
Health Care |
12.9% |
Diversified Industrial |
9.8% |
Energy |
8.7% |
Retail |
7.5% |
Business Services |
6.1% |
Food and Beverage |
6.0% |
Computer Software and Services |
5.5% |
Other Industry sectors |
29.0% |
Other Assets and Liabilities (Net) |
0.6% |
|
| Largest Holdings [Text Block] |
Top 10 Holdings (% of net assets)
Table Summary
Merck & Co. Inc. |
5.3% |
Amazon.com Inc. |
4.2% |
Alphabet Inc. |
3.2% |
Citigroup Inc. |
3.2% |
The PNC Financial Services Group Inc. |
3.2% |
Mondelez International Inc. |
2.9% |
Belden Inc. |
2.6% |
American International Group Inc. |
2.6% |
The Cigna Group |
2.5% |
PPL Corp. |
2.2% |
|
| Material Fund Change [Text Block] |
|
| Updated Prospectus Phone Number |
800-GABELLI (800-422-3554)
|
| Updated Prospectus Email Address |
<span style="box-sizing: border-box; color: rgb(0, 0, 0); display: inline; flex-wrap: nowrap; font-size: 12px; font-weight: 400; grid-area: auto; line-height: 18px; margin: 0px; overflow: visible; text-align: justify; text-align-last: left; white-space-collapse: preserve-breaks;">info@gabelli.com</span>
|
| Updated Prospectus Web Address |
https://gabelli.com/ticker/GBCIX/
|
| C000002888 |
|
| Shareholder Report [Line Items] |
|
| Fund Name |
The Gabelli Dividend Growth Fund
|
| Class Name |
Class A
|
| Trading Symbol |
GBCAX
|
| Annual or Semi-Annual Statement [Text Block] |
This semi-annual shareholder report contains important information about The Gabelli Dividend Growth Fund (the "Fund") for the period of January 1, 2026 to June 30, 2026.
|
| Additional Information [Text Block] |
You can find additional information about the Fund, including the Fund’s prospectus, financial information, holdings, and proxy voting information, at https://gabelli.com/ticker/GBCAX/. You can also request information by contacting us at 800-GABELLI (800-422-3554).
|
| Additional Information Phone Number |
800-GABELLI (800-422-3554)
|
| Additional Information Website |
https://gabelli.com/ticker/GBCAX/
|
| Expenses [Text Block] |
What were the Fund costs for the last six months?
(based on a hypothetical $10,000 investment)
Table Summary
Class Name |
Costs of a $10k Investment |
Costs Paid as a % of a $10k Investment |
The Gabelli Dividend Growth Fund - Class A
|
$103 |
2.00% |
|
| Expenses Paid, Amount |
$ 103
|
| Expense Ratio, Percent |
2.00%
|
| Factors Affecting Performance [Text Block] |
How did the Fund perform?
For the six months ended June 30, 2026, The Gabelli Dividend Growth Fund underperformed its broad-based and comparative benchmarks the S&P 500, MSCI USA High Dividend Yield, and Lipper Large Cap Value Fund Indices. Earnings strength more than trumped a handful of economic and market concerns, including the Iran conflict and higher oil prices, a weak consumer, a strengthening US dollar, and a material flattening of the yield curve. Contributors included Moderna, Inc., Hewlett Packard Enterprise Co., and Merck & Co, Inc. Detractors included Toyota Motor Corp., Fidelity National Information Services, and HubSpot, Inc.
|
| Performance Past Does Not Indicate Future [Text] |
Past performance does not guarantee future results.
|
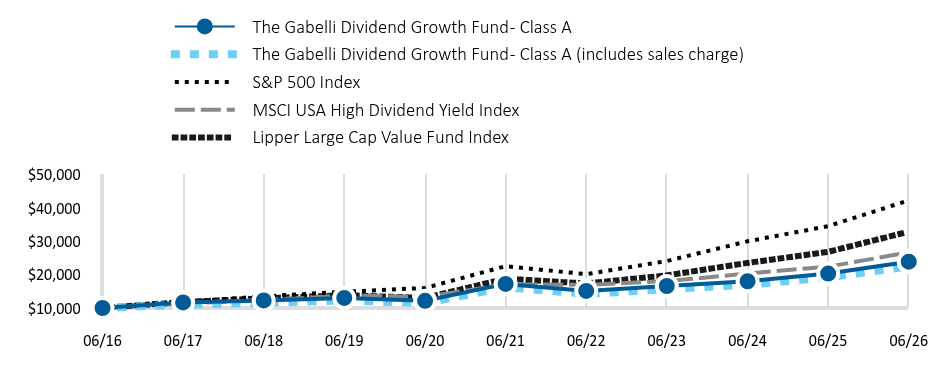
| Line Graph [Table Text Block] |
Table Summary
|
The Gabelli Dividend Growth Fund - Class A |
The Gabelli Dividend Growth Fund - Class A (includes sales charge) |
S&P 500 Index |
MSCI USA High Dividend Yield Index |
Lipper Large Cap Value Fund Index |
06/16 |
10,000 |
10,000 |
10,000 |
10,000 |
10,000 |
06/17 |
11,687 |
11,015 |
11,790 |
11,308 |
11,798 |
06/18 |
12,274 |
11,568 |
13,484 |
12,403 |
12,889 |
06/19 |
13,036 |
12,286 |
14,889 |
13,784 |
13,838 |
06/20 |
12,163 |
11,463 |
16,007 |
13,296 |
13,027 |
06/21 |
17,226 |
16,235 |
22,537 |
17,104 |
18,784 |
06/22 |
15,124 |
14,254 |
20,143 |
16,961 |
17,362 |
06/23 |
16,598 |
15,644 |
24,090 |
18,038 |
19,782 |
06/24 |
18,032 |
16,996 |
30,006 |
20,328 |
23,525 |
06/25 |
20,334 |
19,165 |
34,555 |
22,406 |
26,851 |
06/26 |
23,886 |
22,513 |
42,268 |
26,670 |
32,898 |
|
| Average Annual Return [Table Text Block] |
Table Summary
|
6 months |
1 Year |
5 Year |
10 Year |
The Gabelli Dividend Growth Fund - Class A |
7.33% |
17.47% |
6.76% |
9.10% |
The Gabelli Dividend Growth Fund - Class A (includes sales charge) |
1.15% |
10.71% |
5.50% |
8.45% |
S&P 500 Index |
10.21% |
22.32% |
13.41% |
15.51% |
MSCI USA High Dividend Yield Index |
11.51% |
19.03% |
9.29% |
10.31% |
Lipper Large Cap Value Fund Index |
11.23% |
22.52% |
11.86% |
12.65% |
|
| No Deduction of Taxes [Text Block] |
The table and graph presented above do not reflect the deduction of taxes a shareholder would pay on Fund distributions or the redemption of Fund shares.
|
| AssetsNet |
$ 21,825,183
|
| Holdings Count | Holding |
59
|
| Advisory Fees Paid, Amount |
$ 56,669
|
| InvestmentCompanyPortfolioTurnover |
23.00%
|
| Additional Fund Statistics [Text Block] |
- Total Net Assets$21,825,183
- Number of Portfolio Holdings59
- Portfolio Turnover Rate23%
- Management Fees$56,669
|
| Holdings [Text Block] |
Portfolio Weighting (% of net assets)
Table Summary
Common Stocks |
96.3% |
U.S. Government Obligations |
3.1% |
Other Assets and Liabilities (Net) |
0.6% |
Industry Allocation (% of net assets)
Table Summary
Industry Weighting |
. |
Financial Services |
13.9% |
Health Care |
12.9% |
Diversified Industrial |
9.8% |
Energy |
8.7% |
Retail |
7.5% |
Business Services |
6.1% |
Food and Beverage |
6.0% |
Computer Software and Services |
5.5% |
Other Industry sectors |
29.0% |
Other Assets and Liabilities (Net) |
0.6% |
|
| Largest Holdings [Text Block] |
Top 10 Holdings (% of net assets)
Table Summary
Merck & Co. Inc. |
5.3% |
Amazon.com Inc. |
4.2% |
Alphabet Inc. |
3.2% |
Citigroup Inc. |
3.2% |
The PNC Financial Services Group Inc. |
3.2% |
Mondelez International Inc. |
2.9% |
Belden Inc. |
2.6% |
American International Group Inc. |
2.6% |
The Cigna Group |
2.5% |
PPL Corp. |
2.2% |
|
| Material Fund Change [Text Block] |
|
| Updated Prospectus Phone Number |
800-GABELLI (800-422-3554)
|
| Updated Prospectus Email Address |
<span style="box-sizing: border-box; color: rgb(0, 0, 0); display: inline; flex-wrap: nowrap; font-size: 12px; font-weight: 400; grid-area: auto; line-height: 18px; margin: 0px; overflow: visible; text-align: justify; text-align-last: left; white-space-collapse: preserve-breaks;">info@gabelli.com</span>
|
| Updated Prospectus Web Address |
https://gabelli.com/ticker/GBCAX/
|