v3.26.1
Shareholder Report
12 Months Ended
Jun. 30, 2026
USD ($)
$ / shares
Shareholder Report [Line Items]  
Document Type N-CSR
Amendment Flag false
Registrant Name Advisor Managed Portfolios
Entity Central Index Key 0001970751
Entity Investment Company Type N-1A
Document Period End Date Jun. 30, 2026
Shareholder Report Annual or Semi-Annual annual shareholder report
LionShares U.S. Equity Total Return ETF  
Shareholder Report [Line Items]  
Fund Name LionShares U.S. Equity Total Return ETF
Class Name LionShares U.S. Equity Total Return ETF
Trading Symbol TOT
Security Exchange Name NYSE
Annual or Semi-Annual Statement [Text Block] This annual shareholder report contains important information about the LionShares U.S. Equity Total Return ETF for the period of September 2, 2025, to June 30, 2026.  
Additional Information [Text Block] You can find additional information about the Fund at https://lionsharesetf.com. You can also request this information by contacting us at 855-885-7363.
Additional Information Phone Number 855-885-7363
Additional Information Website https://lionsharesetf.com
Expenses [Text Block]
WHAT WERE THE FUND COSTS FOR THE PAST YEAR? (based on a hypothetical $10,000 investment)
Fund Name
Costs of a $10,000 investment*
Costs paid as a percentage of a $10,000 investment**
LionShares U.S. Equity Total Return ETF
$4
0.04%
[1],[2]
Expenses Paid, Amount $ 4
Expense Ratio, Percent 0.04% [2]
Factors Affecting Performance [Text Block]
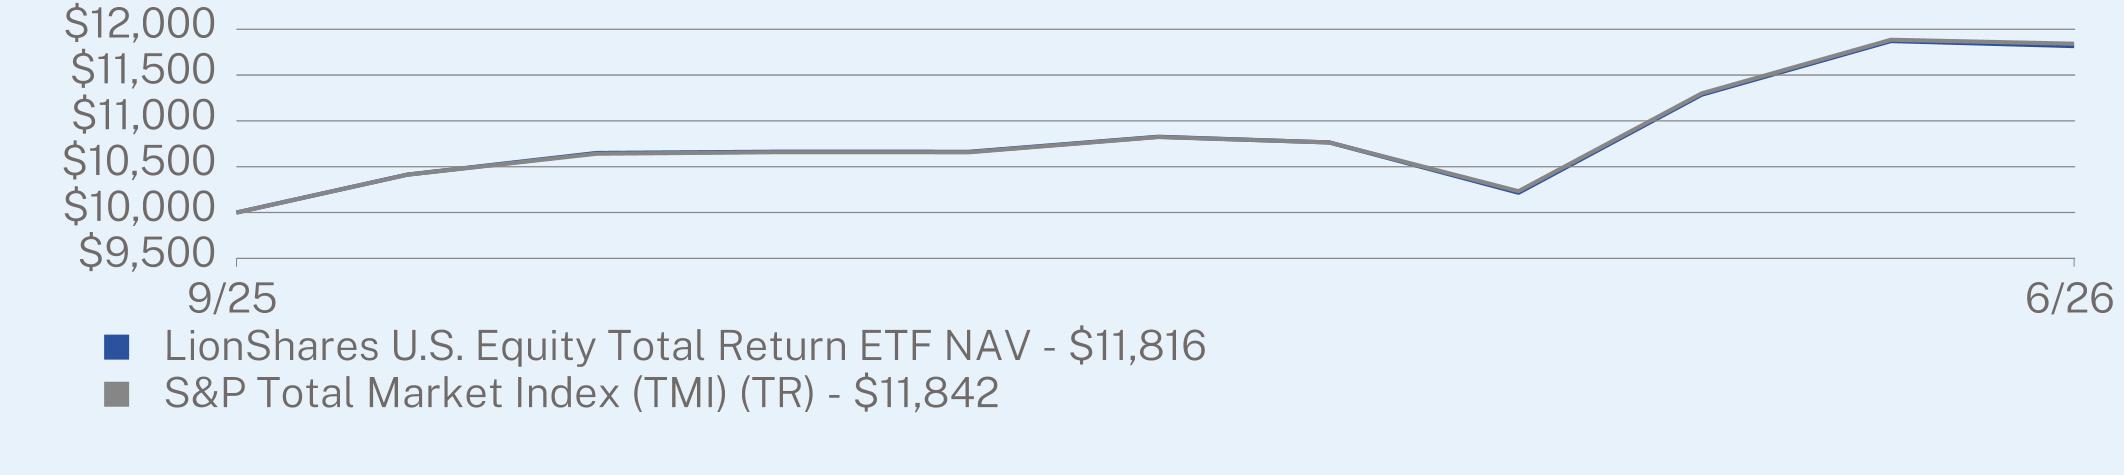
The Fund ended the reporting period on June 30, 2026 with a return of 18.16% based on net asset value since the Fund’s inception on September 2, 2025. The Fund’s benchmark, the S&P Total Market Index, experienced a return of 18.42% during this period.
Growth in the broad U.S. equity market continued to be driven by advancements in technology and business investment in artificial intelligence. Market prices fluctuated as developments in the U.S.-Iran conflict led to periods of escalation followed by de-escalation, additionally leading to fluctuations in energy prices.
Performance Past Does Not Indicate Future [Text] The Fund’s past performance is not a good predictor of how the Fund will perform in the future.
Line Graph [Table Text Block]
image
Average Annual Return [Table Text Block]
  ANNUAL AVERAGE TOTAL RETURN (%)
 
Since Inception
(09/02/2025)
LionShares U.S. Equity Total Return ETF NAV
18.16
S&P Total Market Index (TMI) (TR)
18.42
No Deduction of Taxes [Text Block] The graph and table do not reflect the deduction of taxes that a shareholder would pay on Fund distributions or redemption of Fund shares.
Updated Performance Information Location [Text Block]
Visithttps://lionsharesetf.com for more recent performance information.
Net Assets $ 9,985,499
Holdings Count | $ / shares 2
Advisory Fees Paid, Amount $ 2,776
Investment Company Portfolio Turnover 387.00%
Additional Fund Statistics [Text Block]
KEY FUND STATISTICS (as of June 30, 2026)
Net Assets
$9,985,499
Number of Holdings
2
Net Advisory Fee
$2,776
Portfolio Turnover
387%
Holdings [Text Block]
WHAT DID THE FUND INVEST IN? (as of June 30, 2026)
Top Sectors
(%)
Exchange Traded Funds
99.9
%
Cash & Other
0.1
%
Top 10 Issuers
(%)
iShares Core S&P Total U.S. Stock Market ETF
99.9
%
First American Treasury Obligations Fund
0.1
%
Updated Prospectus Web Address https://lionsharesetf.com
[1]
** Annualized
[2]
* Amount shown reflects the expenses of the Fund from September 2, 2025 through June 30, 2026. Expenses would be higher if the Fund had been in operation for the full year.