Shareholder Report
Jun. 30, 2026
USD ($)
$ / shares
WHAT WERE THE FUND COSTS FOR THE PAST YEAR? (based on a hypothetical $10,000 investment)
|
Class Name
|
Costs of a $10,000 investment
|
Costs paid as a percentage of a $10,000 investment
|
|
Institutional Class
|
$102
|
1.00%
|
HOW DID THE FUND PERFORM LAST YEAR AND WHAT AFFECTED ITS PERFORMANCE?
For the 12-month period ended June 30, 2026, the Fund underperformed its benchmark, the Russell 3000® Growth Total Return.
WHAT FACTORS INFLUENCED PERFORMANCE
Lower-than-benchmark exposure to the largest capitalized companies, higher than benchmark exposure to small capitalized companies, and security selection in large and small capitalized companies detracted from performance during the period when compared to the benchmark.
Positive contributions were led by security selection in the Technology industry and a relative underweight to the Utilities industry as the sector underperformed due to higher bond yields. Allocations to Advanced Micro Devices, Inc. and Rocket Lab Corporation contributed to performance.
Detectors were led by allocation and security selection in the Consumer Discretionary industry, as investors were concerned about the impact of AI on consumer purchasing behaviors, and security selection in the Health Care industry as U.S. policy uncertainty including tariffs, drug pricing policies, and overall competition for capital from the Technology Industry. Allocations to MercadoLibre, Inc. and Axon Enterprise, Inc. also detracted from performance.
POSITIONING
The Fund had several position changes in the top 10 holdings by weight during the period due to market movement, portfolio additions, and portfolio deletions. NVIDIA Corporation remained in the top position, with Advanced Micro Devices, Inc., Rocket Lab Corporation, Alphabet Inc., and Credo Technology Group Ltd rising into the top ten holdings. Meta Platforms, Inc., Netflix, Inc., The Trade Desk, Inc. (sold out of position), and Uber Technologies, Inc. are no longer in the top ten positions.
Overall, the market capitalization exposure of the portfolio saw a decrease in medium capitalized companies by 6% due to positions being sold and increase in the largest capitalized companies increased 6.6% due to market appreciation. Exposure to companies economically exposed to software and consumer services decreased, and exposure to semiconductors and computer hardware increased.
|
Top Contributors
|
|
|
↑
|
Advanced Micro Devices, Inc.
|
|
↑
|
Rocket Lab Corporation
|
|
↑
|
Credo Technology Group Holding Ltd.
|
|
Top Detractors
|
|
|
↓
|
MercadoLibre, Inc.
|
|
↓
|
Axon Enterprise, Inc.
|
|
↓
|
Trade Desk, Inc.
|
PERFORMANCE
The Fund experienced a positive return for the period. Over the past year, the artificial intelligence narrative shifted from a purely digital, software-focused concept into a massive physical infrastructure boom. Giant tech “hyperscalers” (including Microsoft Corporation, Alphabet Inc., Meta Platforms, Inc., and Amazon.com, Inc.) have committed hundreds of billions of dollars toward building next-generation data centers, boosting demand far beyond just software companies. Additionally, a dominant driver of the market’s durable upward path has been robust corporate profitability. S&P 500 earnings growth surged, with a vast majority of companies beating top- and bottom-line expectations. Unlike previous periods where a tiny group of mega-cap tech stocks carried the entire market, the last 12 month period saw market leadership broaden significantly across market capitalizations and sub-sectors posting strong returns, as fundamentally driven profit growth spread across almost every major sector.
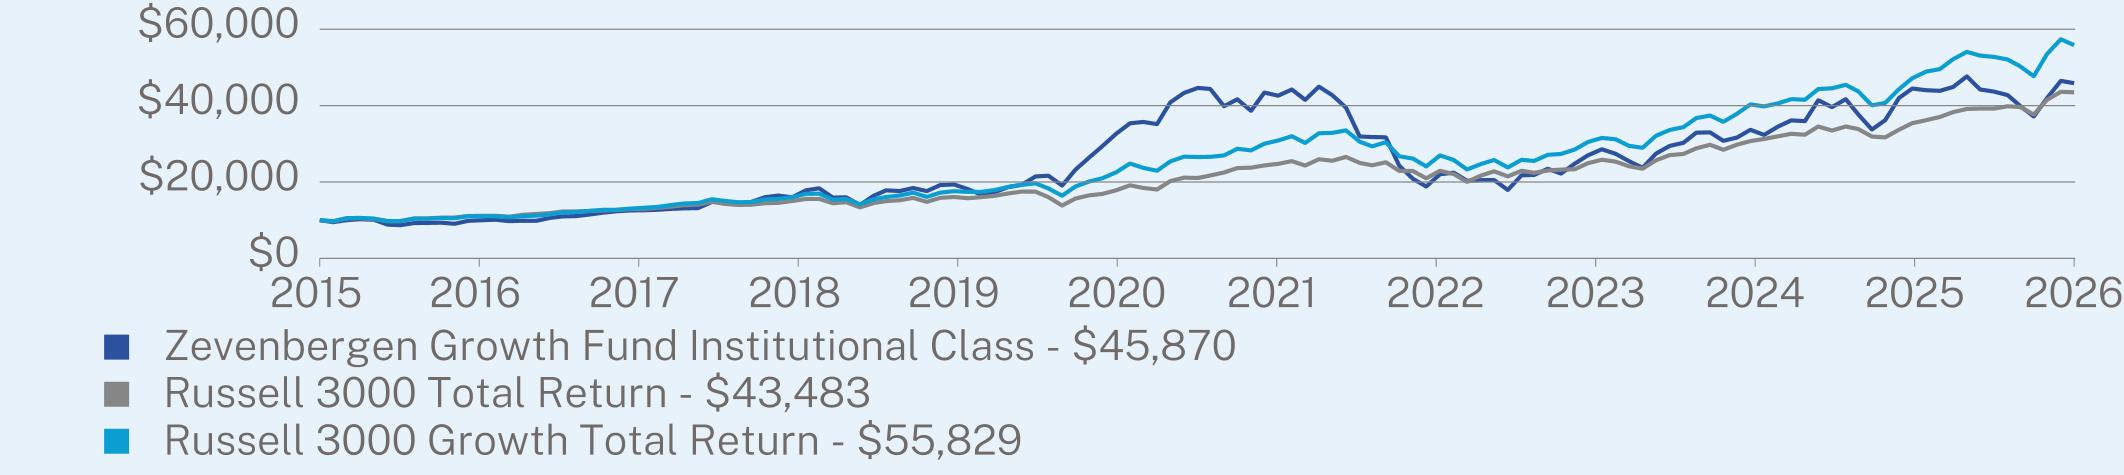
ANNUAL AVERAGE TOTAL RETURN (%)
|
|
1 Year
|
5 Year
|
10 Year
|
|
Institutional Class (without sales charge)
|
3.14
|
1.11
|
17.60
|
|
Russell 3000 Total Return
|
22.82
|
12.31
|
15.06
|
|
Russell 3000 Growth Total Return
|
18.37
|
13.21
|
18.15
|
Visit https://www.zci.com/shareholder-vote-zevenbergen-mutual-funds-to-conversion-to-exchange-traded-funds-etf/ for more recent performance information.
KEY FUND STATISTICS (as of June 30, 2026)
|
Net Assets
|
$140,051,325
|
|
Number of Holdings
|
39
|
|
Net Advisory Fee
|
$801,620
|
|
Portfolio Turnover
|
35%
|
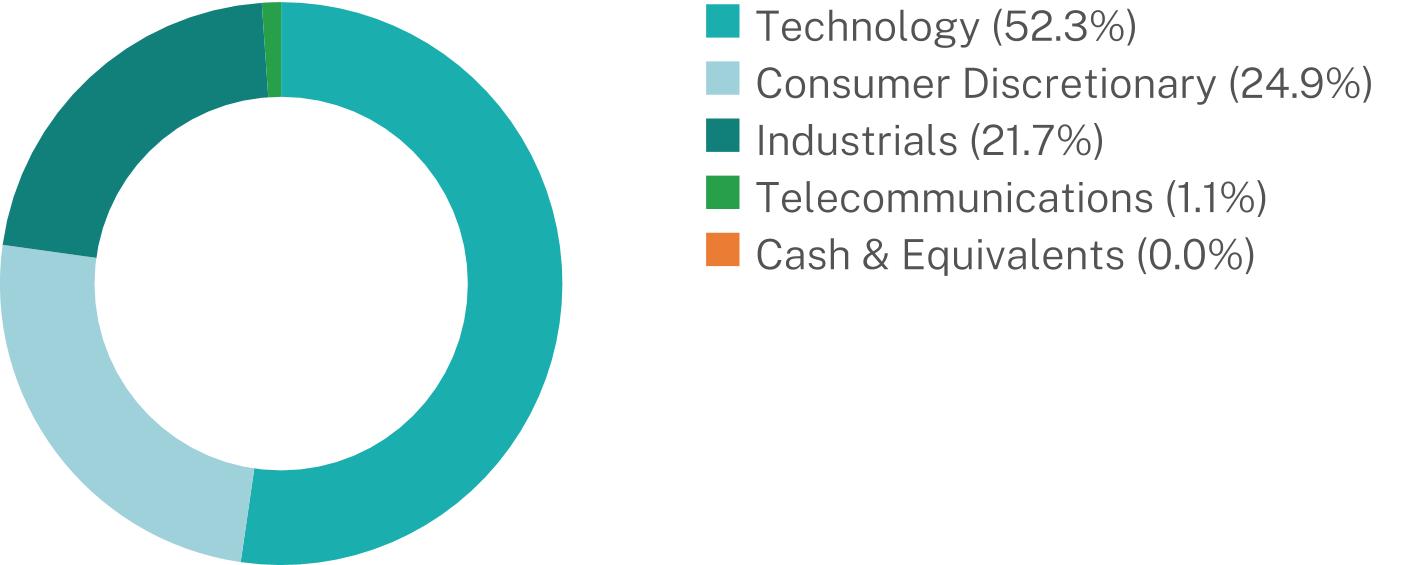
WHAT DID THE FUND INVEST IN? (as of June 30, 2026 as expressed as a percent of net assets)
|
Top 10 Issuers
|
(%)
|
|
NVIDIA Corporation
|
7.8%
|
|
Advanced Micro Devices, Inc.
|
7.5%
|
|
Tesla, Inc.
|
7.1%
|
|
Axon Enterprise, Inc.
|
6.1%
|
|
MercadoLibre, Inc.
|
4.8%
|
|
Shopify, Inc.
|
4.5%
|
|
Rocket Lab Corp.
|
4.4%
|
|
Amazon.com, Inc.
|
4.4%
|
|
Credo Technology Group Holdings Ltd.
|
4.2%
|
|
Alphabet, Inc.
|
4.1%
|
Industry Breakdown (% of net assets)
WHAT WERE THE FUND COSTS FOR THE PAST YEAR? (based on a hypothetical $10,000 investment)
|
Class Name
|
Costs of a $10,000 investment
|
Costs paid as a percentage of a $10,000 investment
|
|
Institutional Class
|
$104
|
1.00%
|
HOW DID THE FUND PERFORM LAST YEAR AND WHAT AFFECTED ITS PERFORMANCE?
For the 12-month period ended June 30, 2026, the Fund underperformed its benchmark, the Russell 3000® Growth Total Return.
WHAT FACTORS INFLUENCED PERFORMANCE
Lower-than-benchmark exposure to the largest capitalized companies within the benchmark, higher than benchmark exposure to small capitalized companies, and security selection in large capitalized companies detracted from performance during the period when compared to the benchmark.
Positive contributions were led by security selection in the Technology and Industrials industries and a relative underweight to the Financials Industry. Allocations to Bloom Energy Corporation and Credo Technology Group Holding Ltd contributed to performance.
Detractors were led by allocation and security selection in the Consumer Discretionary Industry, as investors were concerned about the impact of AI on consumer purchasing behaviors, and security selection in the Real Estate Industry as persistently high mortgage rates suppressed housing transactions. Allocations to Axon Enterprise, Inc. and MercadoLibre, Inc. also detracted from performance.
POSITIONING
The Fund had several position changes in the top 10 holdings by weight during the period due to market movement, portfolio additions, and portfolio deletions. The Fund had several position changes in the top 10 holdings by weight during the period due to market movement, portfolio additions, and portfolio deletions. Tesla had increased to the largest position, with Credo Technology Group Holding Ltd, Bloom Energy Corporation, Datadog, Inc., CrowdStrike Holdings, Inc, rising into the top 10 holdings rank. Netflix, Inc., The Trade Desk, Inc. (position sold), and Spotify Technology S.A. had dropped out of the top 10 positions.
Overall, the market capitalization exposure of the portfolio across large and mega capitalization companies remained consistent, while allocations to mid capitalized companies increased by 11% due to strong security appreciation and new additions to the portfolio during the period. Exposure to companies economically exposed to media and consumer services decreased, and exposure to software and machinery increased during the period.
|
Top Contributors
|
|
|
↑
|
Bloom Energy Corporation
|
|
↑
|
Credo Technology Group Holding Ltd.
|
|
↑
|
Rocket Lab Corporation
|
|
Top Detractors
|
|
|
↓
|
Axon Enterprise Inc.
|
|
↓
|
MercadoLibre, Inc.
|
|
↓
|
The Trade Desk, Inc.
|
PERFORMANCE
The Fund experienced a positive return for the period. Over the past year, the artificial intelligence narrative shifted from a purely digital, software-focused concept into a massive physical infrastructure boom. Giant tech “hyperscalers” (including Microsoft Corporation, Alphabet Inc., Meta Platforms, Inc., and Amazon.com, Inc.) have committed hundreds of billions of dollars toward building next-generation data centers, boosting demand far beyond just software companies. Additionally, a dominant driver of the market’s durable upward path has been robust corporate profitability. S&P 500 earnings growth surged, with a vast majority of companies beating top- and bottom-line expectations. Unlike previous periods where a tiny group of mega-cap tech stocks carried the entire market, the last 12 month period saw market leadership broaden significantly across market capitalizations and sub-sectors posting strong returns as fundamentally driven profit growth spread across almost every major sector.
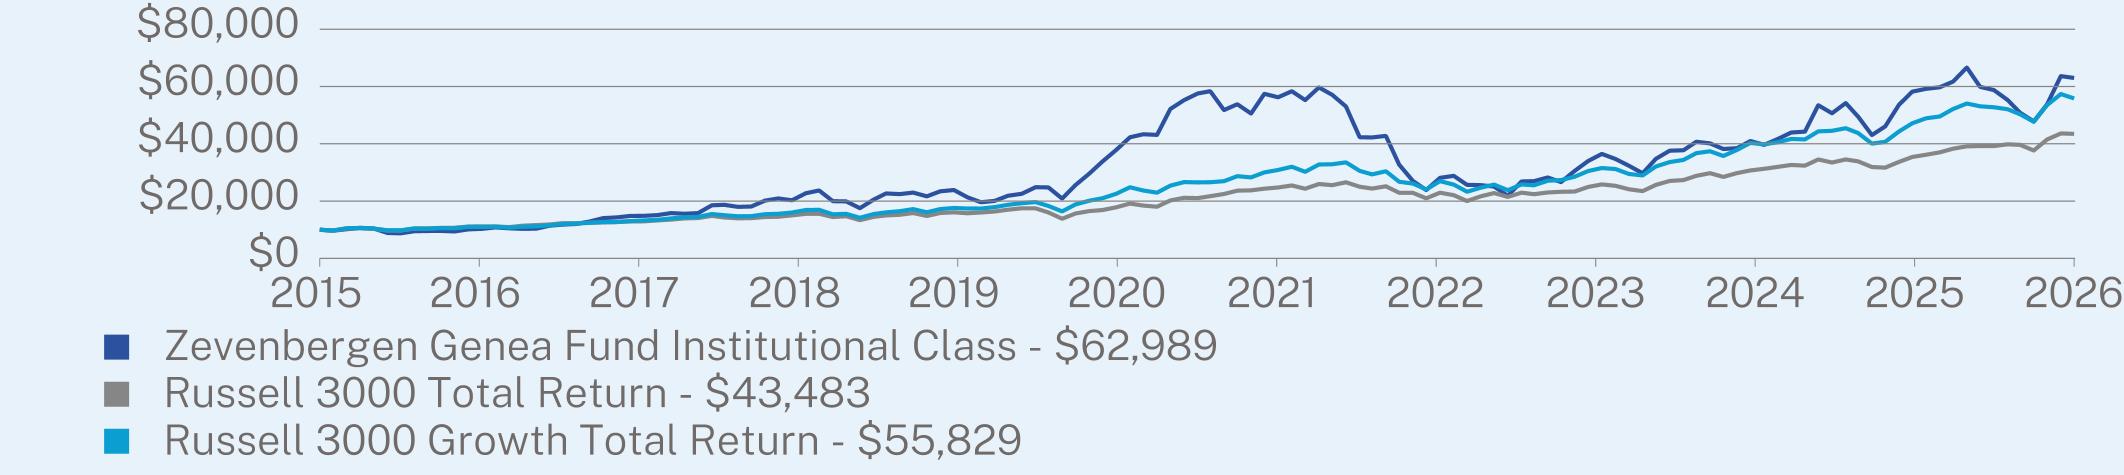
ANNUAL AVERAGE TOTAL RETURN (%)
|
|
1 Year
|
5 Year
|
10 Year
|
|
Institutional Class (without sales charge)
|
8.21
|
1.86
|
20.94
|
|
Russell 3000 Total Return
|
22.82
|
12.31
|
15.06
|
|
Russell 3000 Growth Total Return
|
18.37
|
13.21
|
18.15
|
Visit https://www.zci.com/shareholder-vote-zevenbergen-mutual-funds-to-conversion-to-exchange-traded-funds-etf/ for more recent performance information.
KEY FUND STATISTICS (as of June 30, 2026)
|
Net Assets
|
$71,972,199
|
|
Number of Holdings
|
33
|
|
Net Advisory Fee
|
$331,379
|
|
Portfolio Turnover
|
19%
|
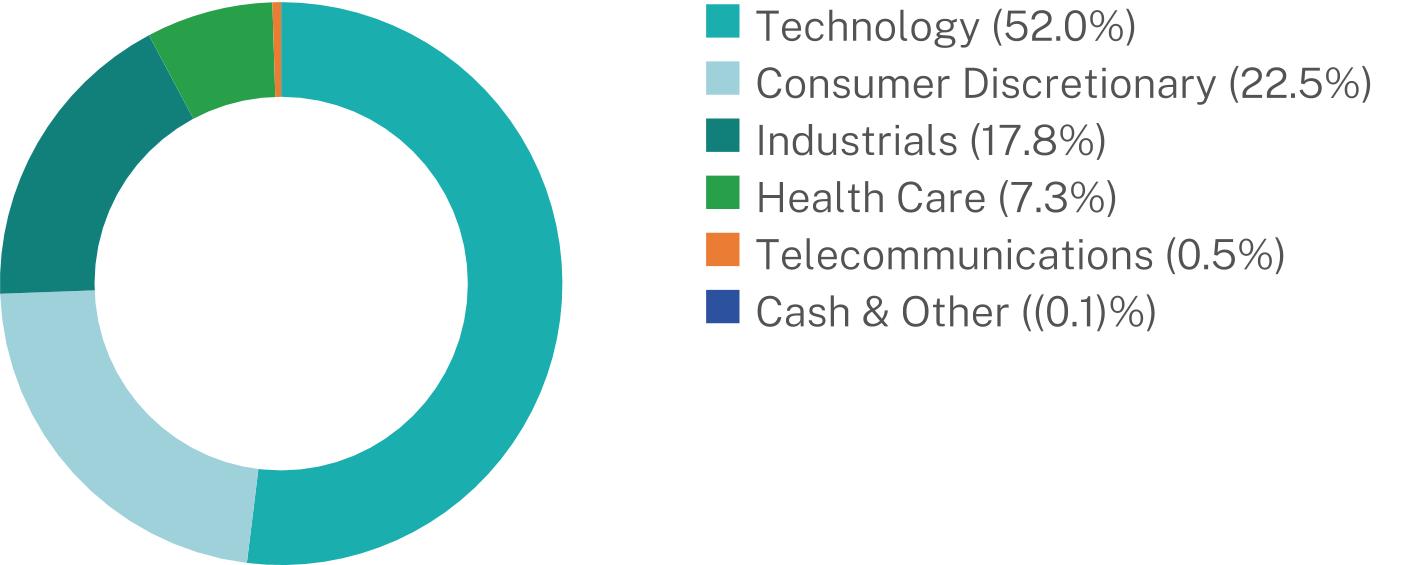
WHAT DID THE FUND INVEST IN? (as of June 30, 2026 as expressed as a percent of net assets)
|
Top 10 Issuers
|
(%)
|
|
Tesla, Inc.
|
8.8%
|
|
NVIDIA, Inc.
|
7.5%
|
|
Credo Technology Group Holdings Ltd.
|
7.2%
|
|
Axon Enterprise, Inc.
|
6.7%
|
|
Shopify, Inc.
|
6.1%
|
|
MercadoLibre, Inc.
|
5.5%
|
|
Bloom Energy Corp.
|
5.4%
|
|
Datadog, Inc.
|
4.8%
|
|
Rocket Lab Corp.
|
4.3%
|
|
CrowdStrike Holdings, Inc.
|
4.2%
|
Industry Breakdown (% of net assets)