Shareholder Report
Jun. 30, 2026
USD ($)
$ / shares
WHAT WERE THE FUND COSTS FOR THE PAST YEAR? (based on a hypothetical $10,000 investment)
|
Fund Name
|
Costs of a $10,000 investment*
|
Costs paid as a percentage of a $10,000 investment**,***
|
|
Reckoner Yield Enhanced AAA CLO ETF
|
$423
|
4.13%
|
HOW DID THE FUND PERFORM LAST YEAR AND WHAT AFFECTED ITS PERFORMANCE?
WHAT FACTORS INFLUENCED PERFORMANCE
For the reporting period ending June 30, 2026, the Reckoner Yield Enhanced AAA CLO ETF returned 5.29% on a NAV basis and 5.48% on a market value basis. Its performance benchmark, the J.P. Morgan CLOIE AAA Index, returned 4.99%.
PERFORMANCE
TOP CONTRIBUTORS TO PERFORMANCE
Spreads on AAA collateralized loan obligations (CLOs) remained stable as the asset class was largely insulated from macroeconomic volatility surrounding the Iran conflict and continued AI disruption. The Fund’s leverage strategy benefited from favorable financing rates on its repurchase agreements, driving outperformance relative to the benchmark.
TOP DETRACTORS FROM PERFORMANCE
The Fund’s overweight to large higher-tiered managers detracted from returns as lower tiered managers traded at slightly wider spreads, generating higher yields relative to the Fund’s holdings.
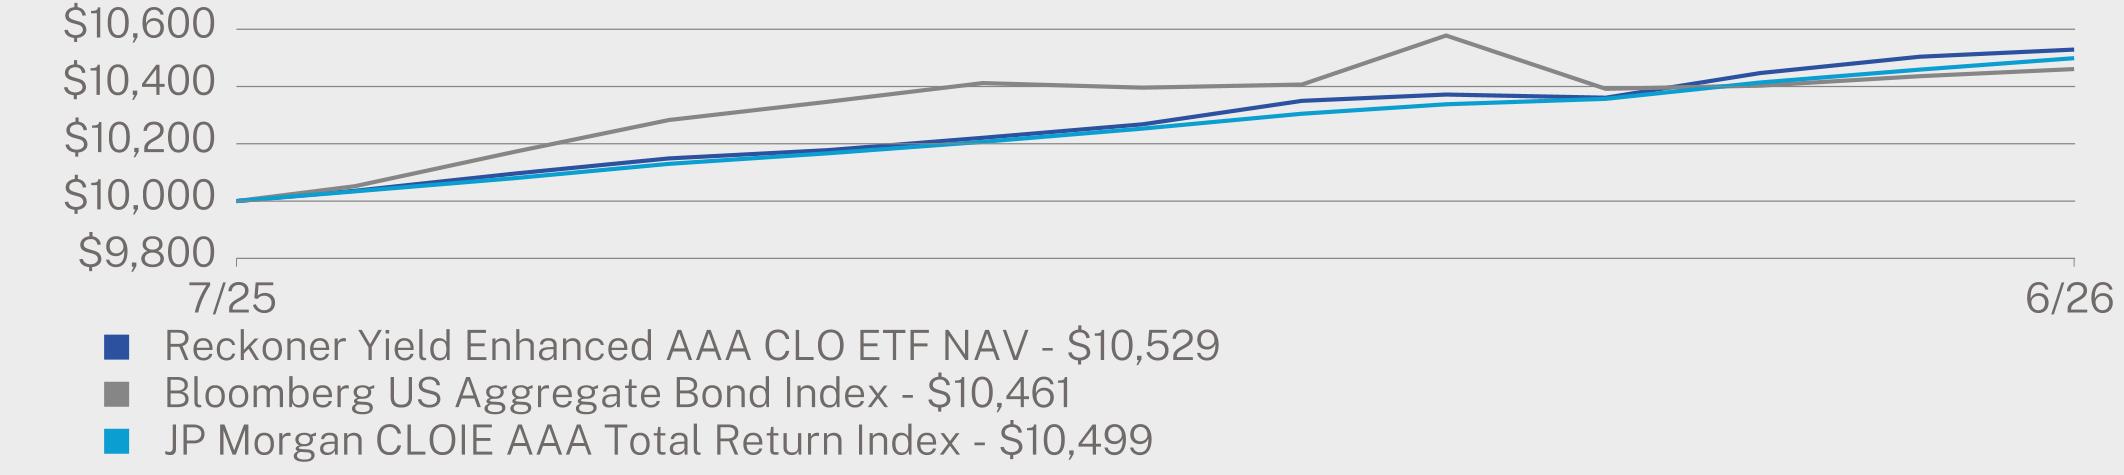
AVERAGE ANNUAL TOTAL RETURN (%)
|
|
Since Inception
(07/08/2025) |
|
Reckoner Yield Enhanced AAA CLO ETF NAV
|
5.29%
|
|
Bloomberg US Aggregate Bond Index
|
4.61%
|
|
JP Morgan CLOIE AAA Total Return Index
|
4.99%
|
Visit https://reckoner.com/raaa/ for more recent performance information.
KEY FUND STATISTICS (as of June 30, 2026)
|
Net Assets
|
$35,131,287
|
|
Number of Holdings
|
37
|
|
Net Advisory Fee
|
$89,507
|
|
Portfolio Turnover
|
25%
|
|
Effective Duration
|
0.04
|
WHAT DID THE FUND INVEST IN? (% of total portfolio* as of June 30, 2026)
|
Sector Breakdown
|
(%)
|
|
Collateralized Loan Obligations
|
99.6%
|
|
Cash & Other
|
0.4%
|
|
Credit Breakdown
|
(%)
|
|
AAA
|
99.6%
|
|
Cash & Other
|
0.4%
|
WHAT WERE THE FUND COSTS FOR THE PAST YEAR? (based on a hypothetical $10,000 investment)
|
Fund Name
|
Costs of a $10,000 investment*
|
Costs paid as a percentage of a $10,000 investment**
|
|
Reckoner BBB-B CLO ETF
|
$51
|
0.50%
|
HOW DID THE FUND PERFORM LAST YEAR AND WHAT AFFECTED ITS PERFORMANCE?
WHAT FACTORS INFLUENCED PERFORMANCE
For the reporting period ending June 30, 2026, the Reckoner BBB-B CLO ETF returned 4.24% on a NAV basis and 4.05% on a market value basis. Its performance benchmark, the JP Morgan CLO High Quality Mezzanine Index, returned 4.10%.
PERFORMANCE
TOP CONTRIBUTORS TO PERFORMANCE
The Fund’s overweight to large higher-tiered managers and high-quality collateralized loan obligations (CLOs) contributed to returns relative to the benchmark, as mezzanine CLO spreads widened during the period. Lower-tiered managers and CLOs widened at a greater magnitude relative to the Fund’s holdings.
TOP DETRACTORS FROM PERFORMANCE
The Fund’s allocation to BB CLOs detracted from performance, as BB CLO spreads widened by a larger magnitude than BBB CLOs due to declines in leverage loan prices and macroeconomic volatility more acutely impacting BB CLOs.
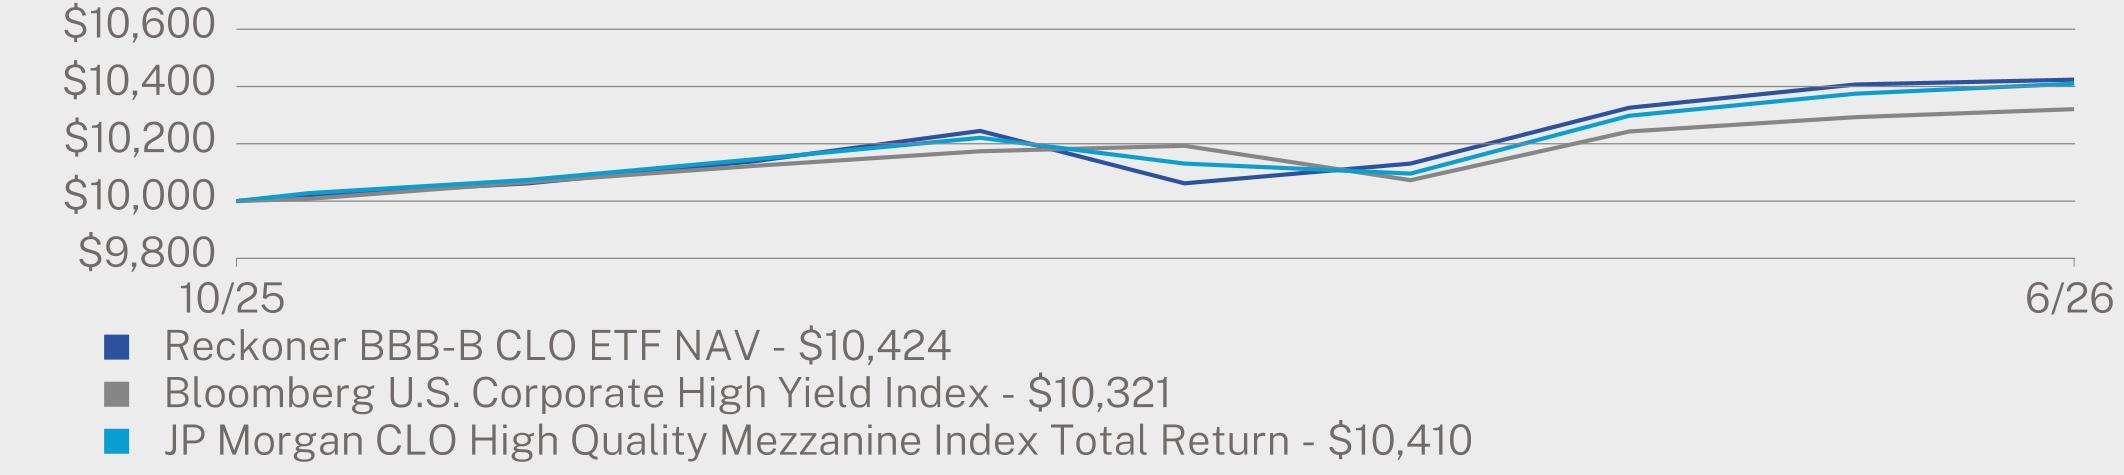
AVERAGE ANNUAL TOTAL RETURN (%)
|
|
Since Inception
(10/21/2025) |
|
Reckoner BBB-B CLO ETF NAV
|
4.24%
|
|
Bloomberg U.S. Corporate High Yield Index
|
3.21%
|
|
JP Morgan CLO High Quality Mezzanine Index Total Return
|
4.10%
|
Visit https://reckoner.com/rclo/ for more recent performance information.
KEY FUND STATISTICS (as of June 30, 2026)
|
Net Assets
|
$30,003,004
|
|
Number of Holdings
|
26
|
|
Net Advisory Fee
|
$95,424
|
|
Portfolio Turnover
|
20%
|
|
Effective Duration
|
-0.01
|
WHAT DID THE FUND INVEST IN? (% of net assets as of June 30, 2026)
|
Sector Breakdown
|
(%)
|
|
Collateralized Loan Obligations
|
97.4%
|
|
Cash & Other
|
2.6%
|
|
Credit Breakdown
|
(%)
|
|
BBB
|
54.6%
|
|
BB
|
42.8%
|
|
Cash & Other
|
2.6%
|
| [1] |
|
||
| [2] |
|
||
| [3] |
|
||
| [4] |
|
||
| [5] |
|
||
| [6] |
|