
Exhibit 99.2
1 + STRATEGIC MERGER From the Shenandoah Valley to the Nation’s Capital Merger Investor Presentation September 8, 2026 John Marshall Bancorp, Inc. (Nasdaq: JMSB ) Eagle Financial Services, Inc. (Nasdaq: EFSI)
2 Disclaimer Cautionary Note Regarding Forward - Looking Statements In addition to historical information, this communication contains forward - looking statements within the meaning of the Private Securities Litigation Reform Act of 1995 that are based on certain assumptions and describe future plans, strategies and expectations of John Marshall Bancorp, Inc. (“John Marshall” or “JMSB”), Eagle Financia l S ervices, Inc. (“Eagle” or “EFSI”), the combined company or otherwise relating to the proposed transaction. These forward - looking statements are generally identified by use of the words “believe,” “expect,” “intend ,” “anticipate,” “estimate,” “project,” “will,” “should,” “may,” “view,” “opportunity,” “potential,” or similar expressions or expressions of confidence. Our ability to predict results or the actual effect of futu re plans or strategies is inherently uncertain. Because forward - looking statements are subject to assumptions and uncertainties, actual results or future events could differ, p ossibly materially, from those indicated in or implied by such forward - looking statements as a result of a variety of factors, many of which are beyond the control of John Marshall, Eagle and the combined company. C aut ion should be exercised against placing undue reliance on forward - looking statements. Factors which could cause actual results to differ materially include, but are not limited to, the following: the occurrence of any event, change or other circumstances that could give rise to the right of John Marshall or Eagle to terminate the definitive agreement; the outcome of any legal proceedings or governmental inquiries or actions that m ay be instituted against John Marshall, Eagle or the combined company; the possibility that the proposed transaction will not close when expected or at all because required regulatory, shareholder or other approvals o r c onsents are not received or other conditions to the closing are not satisfied on a timely basis or at all, or are obtained subject to conditions that are not anticipated (and the risk that required regulatory approv als may result in the imposition of conditions that could adversely affect the combined company or the expected benefits of the proposed transaction); the ability of John Marshall and Eagle to meet expectations regarding the timing, completion and accounting and tax treatments of the proposed transaction; any changes of, including the risk that any announcements relating to the proposed transaction could have adverse effects on, the ma rket price of the common stock of John Marshall or Eagle; the possibility that the anticipated benefits or synergies of the proposed transaction will not be realized when expected or at all, including as a re sul t of the impact of, or problems arising from, the integration of the two companies or as a result of the strength of the economy and competitive factors in the areas where John Marshall and Eagle do business, and suc h i ntegration may be more difficult, time - consuming or costly than expected and may result in unexpected liabilities or operational disruptions; certain restrictions during the pendency of the proposed transaction th at may impact John Marshall’s and Eagle’s ability to pursue certain business opportunities or strategic transactions; the possibility that the transaction may be more expensive to complete than anticipated, including as a result of unexpected factors or events; diversion of John Marshall management’s or Eagle management’s attention from ongoing business operations and opportunities; revenues following the proposed transaction may be lo wer than expected; the concentration of John Marshall’s business in the Washington, D.C. metropolitan area and the effect of changes in the economic, political and environmental conditions on this mar ket, including shutdowns and potential reductions in spending by the United States government, and related reductions in the federal workforce; adequacy of allowance for loan credit losses, allowance for unfu nde d commitments credit losses, and allowance for credit losses associated with John Marshall’s held - to - maturity and available - for - sale securities portfolios; deterioration of John Marshall’s or Eagle’s asset qual ity; future performance of John Marshall’s or Eagle’s loan portfolio with respect to recently originated loans; the level of prepayments on loans and mortgage - backed securities; liquidity, market volatility, interest rate and operational risks; changes in the financial condition or results of operations that reduce capital of John Marshall, Eagle or the combined company; the ability of John Marshall, Eagle or the combined company to maint ain existing deposit relationships or attract new deposit relationships; changes in consumer spending, borrowing, investment, repayment and savings habits; inflation, recession and changes in interest rates; c han ges in the monetary and fiscal policies of the United States government, including policies of the U.S. Treasury and the Board of Governors of the Federal Reserve System; risks related to new lines of busines s, products, product enhancements or services; increased competition with other financial institutions and fintech companies; adverse changes in the securities markets; the dilution caused by John Marshall’s issuanc e o f additional shares of its capital stock in connection with the proposed transaction; changes in the financial condition or future prospects of issuers of securities that we own; John Marshall’s and Eagle’s abil ity to maintain an effective risk management framework; changes in laws or government regulations or policies affecting financial institutions, including changes in regulatory structure and in regulatory fees an d c apital requirements; compliance with legislative or regulatory requirements; results of examination of John Marshall, Eagle or the combined company by regulators, including the possibility of requirements to incre ase allowance for credit losses or to write - down assets or take similar actions; potential claims, damages, and fines related to litigation or government actions; the effectiveness of John Marshall’s or Eagle’s inter nal controls over financial reporting and their ability to remediate any future material weakness in internal controls over financial reporting; geopolitical conditions, including trade restrictions and tariffs, and acts or th reats of terrorism and/or military conflicts, or actions taken by the U.S. or other governments in response to trade restrictions and tariffs, and acts or threats of terrorism and/or military conflicts, negatively impacting bus iness and economic conditions in the U.S. and abroad; the effects of weather - related or natural disasters, which may negatively affect the operations and/or loan portfolio and increase cost of conducting business of John Marshall or Eagle; public health events (such as the COVID - 19 pandemic) and governmental and societal responses thereto; technological risks and developments, data privacy and security risks, and cyber th reats, attacks, or events; changes in accounting policies and practices; the ability of John Marshall, Eagle or the combined company to successfully capitalize on growth opportunities; the ability of John Marshall, Eag le or the combined company to retain or hire key employees or to maintain relationships with customers, suppliers or other business partners, including in connection with the announcement, pendency or completion o f t he proposed transaction; risks related to the potential impact of general economic, political and market conditions, either nationally or in the relevant market area, including higher unemployment and lower re al estate values; implications of John Marshall’s status as a smaller reporting company and as an emerging growth company; and other factors discussed in John Marshall’s and Eagle’s reports (such as Annual Report on F orm 10 - K, Quarterly Reports on Form 10 - Q and Current Reports on Form 8 - K) filed with the Securities and Exchange Commission (the “SEC”). These risks and uncertainties should be considered in evaluating forward - loo king statements and undue reliance should not be placed on such statements. Forward - looking statements speak only as of the date they are made and are based on information available at that time; and neither J ohn Marshall or Eagle undertakes, and each of them specifically disclaims, any obligation or duty to publicly release the result of any revisions which may be made to any forward - looking statements to reflect events or ci rcumstances after the date of such statements or to reflect the occurrence of anticipated or unanticipated events or otherwise update such forward - looking statements, whether written or oral, except as required by appl icable securities laws. The foregoing list of factors is not exhaustive, and other factors that may affect actual results or future events may emerge from time to time. Annualized, pro forma, projected and estimated num bers are used for illustrative purposes only, are not forecasts and may not reflect actual results.

3 Disclaimer Additional Information About the Merger and Where to Find It In connection with the proposed transaction, John Marshall will file a registration statement on Form S - 4 with the SEC to regist er the shares of John Marshall common stock to be issued in connection with the proposed transaction. The registration statement will include a joint proxy statement of John Marshall and Eagle, which also constitut es a prospectus of John Marshall. When final, a definitive copy of the joint proxy statement/prospectus will be mailed or otherwise delivered to shareholders of John Marshall and shareholders of Eagle in conn ect ion with the solicitation of certain approvals related to the proposed transaction. Each of John Marshall and Eagle may file with the SEC other relevant documents concerning the proposed transaction. INVESTORS AND SHAREHOLDERS OF JOHN MARSHALL AND EAGLE AND THEIR RESPECTIVE AFFILIATES ARE URGED TO READ CAREFULLY AND IN THEI R E NTIRETY, WHEN AVAILABLE, THE REGISTRATION STATEMENT ON FORM S - 4, THE JOINT PROXY STATEMENT/PROSPECTUS TO BE INCLUDED WITHIN THE REGISTRATION STATEMENT ON FORM S - 4 AND ANY OTHER RELEVA NT DOCUMENTS FILED OR TO BE FILED WITH THE SEC IN CONNECTION WITH THE PROPOSED TRANSACTION, AS WELL AS ANY AMENDMENTS OR SUPPLEMENTS TO THOSE DOCUMENTS, BECAUSE THEY WILL CONT AIN IMPORTANT INFORMATION ABOUT JOHN MARSHALL, EAGLE AND THE PROPOSED TRANSACTION. Investors and shareholders will be able to obtain a free copy of the registration statement, including the joint proxy statem ent /prospectus, as well as other relevant documents filed with the SEC containing information about John Marshall and Eagle, without charge, at the SEC’s website, www.sec.gov, when they are filed. Copies of documents fi led with the SEC by John Marshall will be made available free of charge in the “Investor Relations” section of John Marshall’s website, investor.johnmarshallbank.com, or can be obtained by requesting by mail at Joh n M arshall Bancorp, Inc., 1943 Isaac Newton Square East, Suite 100, Reston, Virginia 20190, Attention: Corporate Secretary. Copies of documents filed with the SEC by Eagle will be made available free of charge in the “In vestor Relations” section of Eagle’s website, investors.bankofclarke.bank , or can be obtained by requesting by mail at Eagle Financial Services, Inc., 2 East Main St, P.O. Box 391, Berryville, Virginia 22611, A tte ntion: Secretary. The information on John Marshall’s or Eagle’s respective websites is not, and shall not be deemed to be, a part of this communication or incorporated into other filings either company makes with the SEC. Participants in the Solicitation John Marshall, Eagle and certain of their respective directors and executive officers may be deemed to be participants in the so licitation of proxies from shareholders of John Marshall and shareholders of Eagle in respect of the proposed transaction under the rules of the SEC. Information regarding John Marshall’s directors and executive of ficers is available in its definitive proxy statement for its 2026 annual meeting of shareholders, which was filed with the SEC on April 29, 2026, and certain other documents filed by John Marshall with the SEC . I nformation regarding Eagle’s directors and executive officers is available in its definitive proxy statement for its 2026 annual meeting of shareholders, which was filed with the SEC on April 8, 2026, and certain other do cuments filed by Eagle with the SEC. Other information regarding the participants in the solicitation of proxies in respect of the proposed transaction and a description of their direct and indirect interests, by s ecu rity holdings or otherwise, will be contained in the joint proxy statement/prospectus and other relevant materials to be filed with the SEC. Investors should read these documents carefully when they become available before making any voting or investment decisions. Free copies of these documents, when available, may be obtained as described in the preceding section. No Offer or Solicitation This communication does not constitute an offer to sell or the solicitation of an offer to buy any securities or a solicitati on of any vote or approval with respect to the proposed transaction, nor shall there be any sale of securities in any jurisdiction in which such offer, solicitation or sale would be unlawful prior to registration or qualifica tio n under the securities laws of any such jurisdiction. No offer of securities shall be made except by means of a prospectus meeting the requirements of Section 10 of the Securities Act of 1933, as amended.
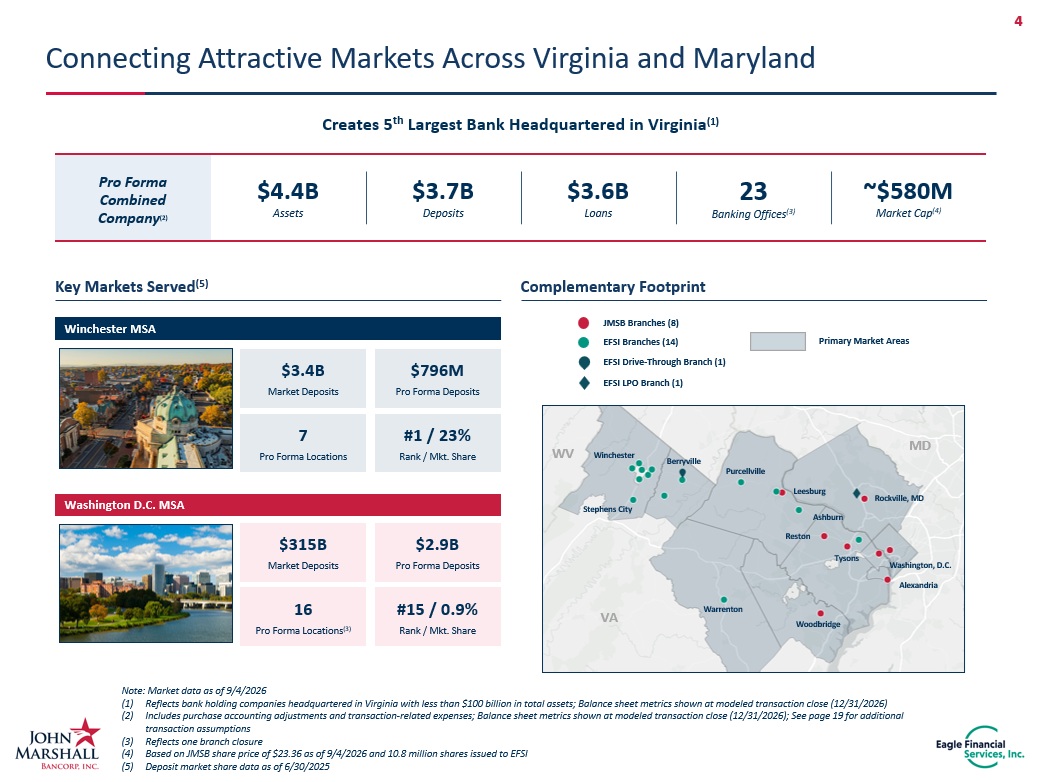
4 Note: Market data as of 9/4/2026 (1) Reflects bank holding companies headquartered in Virginia with less than $100 billion in total assets; Balance sheet metrics shown at modeled transaction close (12/31/2026) (2) Includes purchase accounting adjustments and transaction - related expenses; Balance sheet metrics shown at modeled transaction cl ose (12/31/2026); See page 19 for additional transaction assumptions (3) Reflects one branch closure (4) Based on JMSB share price of $23.36 as of 9/4/2026 and 10.8 million shares issued to EFSI (5) Deposit market share data as of 6/30/2025 Connecting Attractive Markets Across Virginia and Maryland Key Markets Served (5) Complementary Footprint Pro Forma Combined Company ( 2 ) $4.4B Assets $3.7B Deposits $3.6B Loans 2 3 Banking Offices ( 3) ~$ 580 M Market Cap (4) Primary Market Areas JMSB Branches (8) EFSI Branches (14) EFSI Drive - Through Branch (1) EFSI LPO Branch (1) Creates 5 th Largest Bank Headquartered in Virginia (1) Winchester MSA $3.4B Market Deposits $796M Pro Forma Deposits 7 Pro Forma Locations #1 / 23% Rank / Mkt. Share Washington D.C. MSA $315B Market Deposits $2.9B Pro Forma Deposits 16 Pro Forma Locations (3) #15 / 0.9% Rank / Mkt. Share Winchester Berryville Purcellville Leesburg Warrenton Reston Tysons Rockville, MD Washington, D.C. Alexandria VA WV MD Stephens City Ashburn Woodbridge
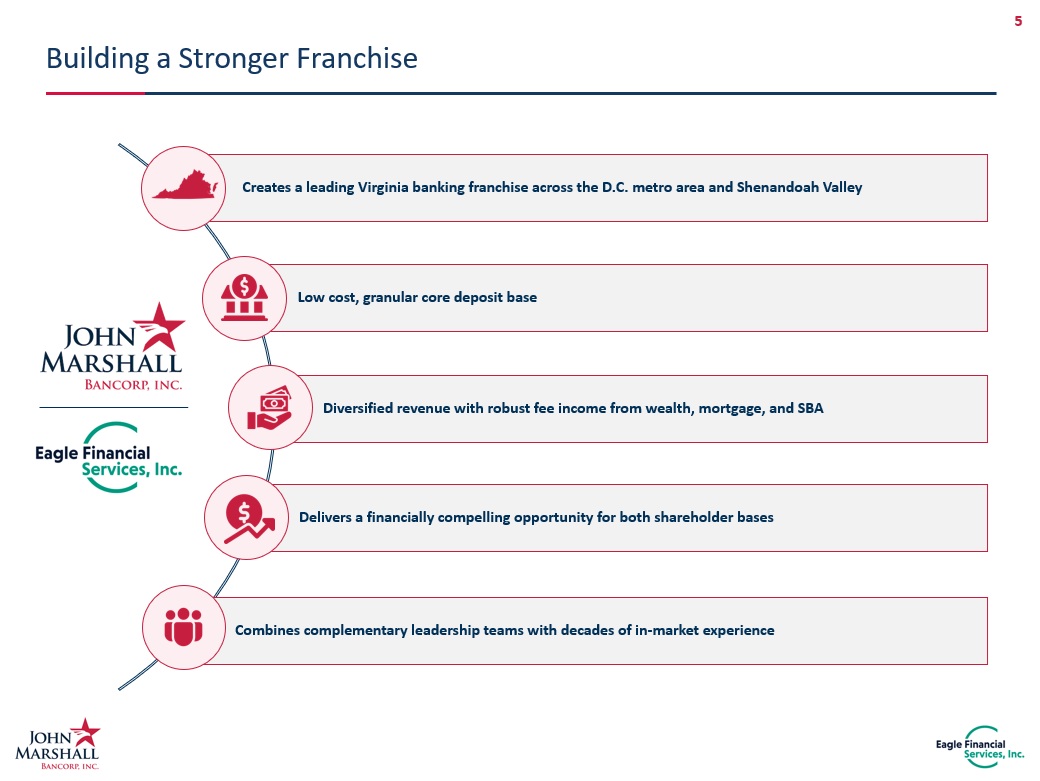
5 Building a Stronger Franchise Diversified revenue with robust fee income from wealth, mortgage, and SBA Creates a leading Virginia banking franchise across the D.C. metro area and Shenandoah Valley Low cost, granular core deposit base Combines complementary leadership teams with decades of in - market experience Delivers a financially compelling opportunity for both shareholder bases
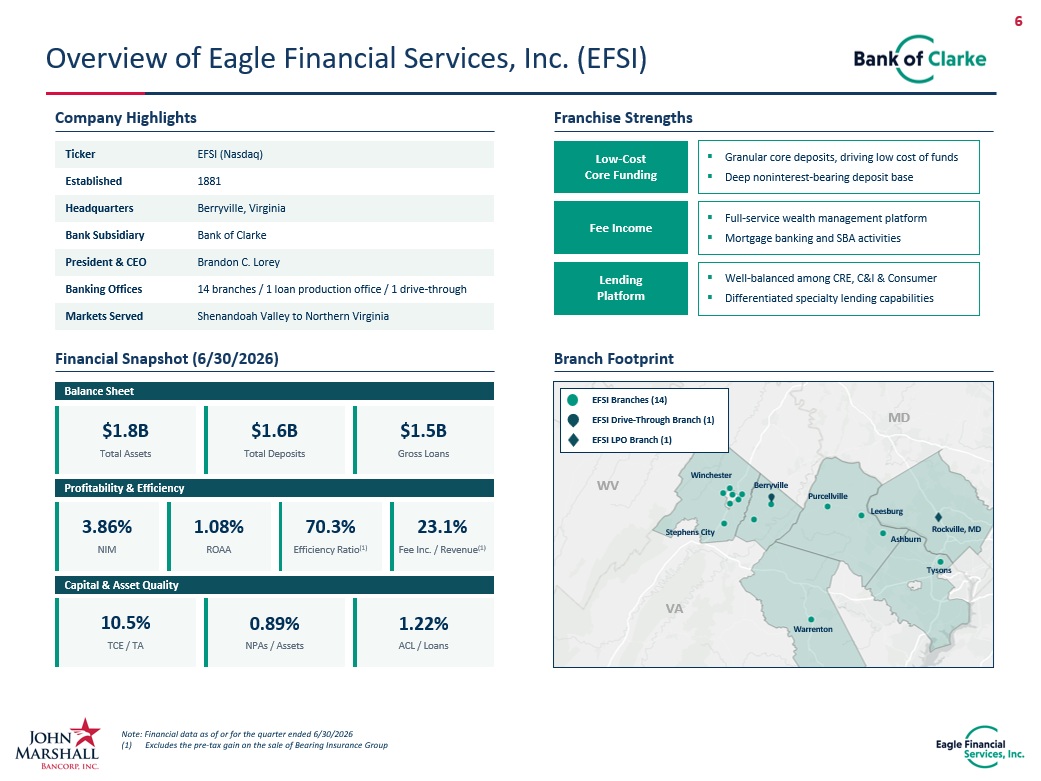
6 EFSI Branches (14) EFSI Drive - Through Branch (1) EFSI LPO Branch (1) Overview of Eagle Financial Services, Inc. (EFSI) Financial Snapshot Company Highlights Financial Snapshot (6/30/2026) Branch Footprint Ticker EFSI (Nasdaq) Established 1881 Headquarters Berryville, Virginia President & CEO Brandon C. Lorey Markets Served Shenandoah Valley to Northern Virginia Bank Subsidiary Bank of Clarke VA WV MD Winchester Stephens City Berryville Purcellville Leesburg Ashburn Tysons Warrenton Banking Offices 14 branches / 1 loan production office / 1 drive - through Franchise Strengths Lending Platform Low - Cost Core Funding Fee Income ▪ Granular core deposits, driving low cost of funds ▪ Deep noninterest - bearing deposit base ▪ Full - service wealth management platform ▪ Mortgage banking and SBA activities ▪ Well - balanced among CRE, C&I & Consumer ▪ Differentiated specialty lending capabilities $ 1 .8B Total Assets $1.6B Total Deposits $1.5B Gross Loans 3.8 6 % NIM 1.08% ROAA 70. 3 % Efficiency Ratio (1) 0.89% NPAs / Assets 1.22% ACL / Loans 10.5% TCE / TA Balance Sheet Profitability & Efficiency Capital & Asset Quality 2 3 . 1 % Fee Inc. / Revenue (1) Rockville, MD Note: Financial data as of or for the quarter ended 6/30/2026 (1) Excludes the pre - tax gain on the sale of Bearing Insurance Group
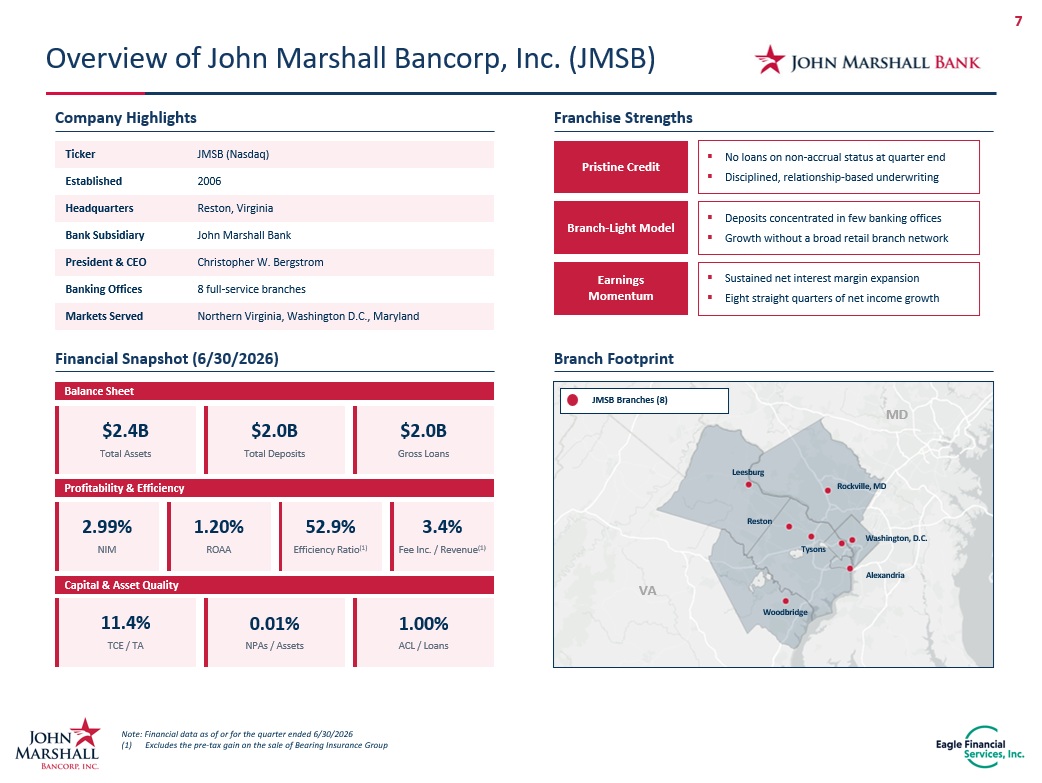
7 JMSB Branches (8) Overview of John Marshall Bancorp, Inc. (JMSB) Financial Snapshot Company Highlights Franchise Strengths Financial Snapshot (6/30/2026) $ 2 . 4 B Total Assets $ 2 . 0 B Total Deposits $ 2 . 0 B Gross Loans 2.99% NIM 1.20% ROAA 52.9% Efficiency Ratio (1) 0.01% NPAs / Assets 1.00% ACL / Loans 11.4% TCE / TA Balance Sheet Profitability & Efficiency Capital & Asset Quality Branch Footprint Ticker JMSB (Nasdaq) Established 2006 Headquarters Reston , Virginia President & CEO Christopher W. Bergstrom Banking Offices 8 full - service branches Markets Served Northern Virginia, Washington D.C., Maryland Bank Subsidiary John Marshall Bank VA MD Leesburg Rockville, MD Reston Tysons Washington, D.C. Alexandria Woodbridge Earnings Momentum Branch - Light Model Pristine Credit ▪ Deposits concentrated in few banking offices ▪ Growth without a broad retail branch network ▪ No loans on non - accrual status at quarter end ▪ Disciplined, relationship - based underwriting ▪ Sustained net interest margin expansion ▪ Eight straight quarters of net income growth 3 .4% Fee Inc. / Revenue (1) Note: Financial data as of or for the quarter ended 6/30/2026 (1) Excludes the pre - tax gain on the sale of Bearing Insurance Group
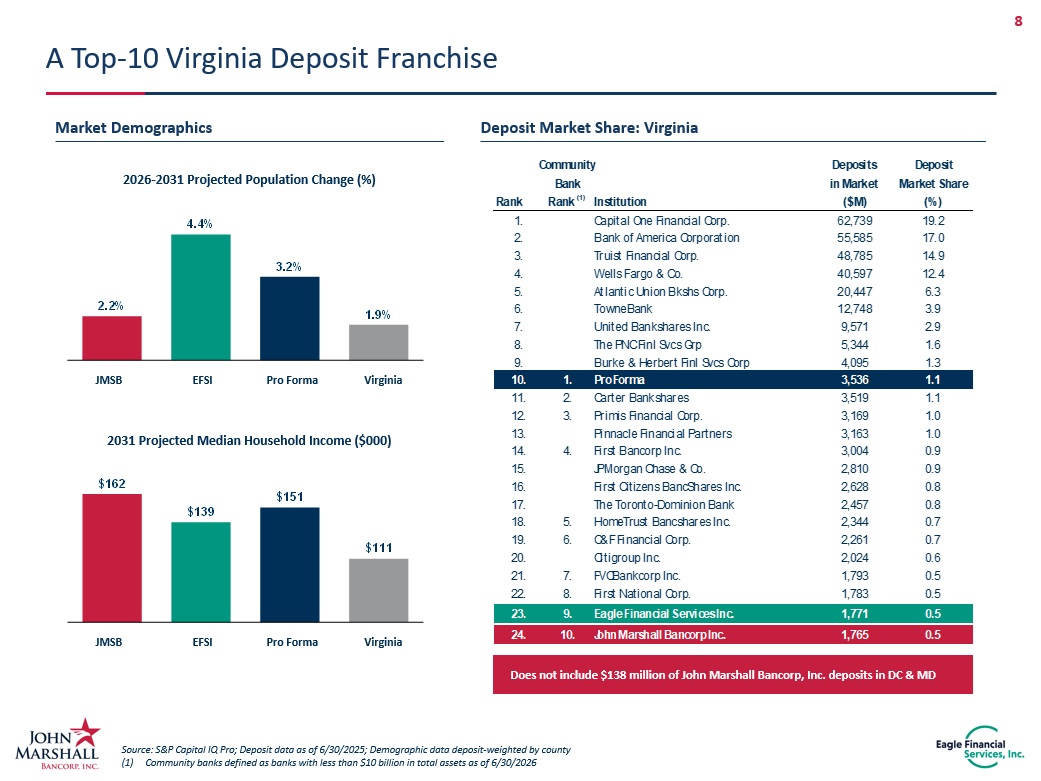
8 Community Deposits Deposit Bank in Market Market Share Rank Rank (1) Institution ($M) (%) 1. Capital One Financial Corp. 62,739 19.2 2. Bank of America Corporation 55,585 17.0 3. Truist Financial Corp. 48,785 14.9 4. Wells Fargo & Co. 40,597 12.4 5. Atlantic Union Bkshs Corp. 20,447 6.3 6. TowneBank 12,748 3.9 7. United Bankshares Inc. 9,571 2.9 8. The PNC Finl Svcs Grp 5,344 1.6 9. Burke & Herbert Finl Svcs Corp 4,095 1.3 10. 1. Pro Forma 3,536 1.1 11. 2. Carter Bankshares 3,519 1.1 12. 3. Primis Financial Corp. 3,169 1.0 13. Pinnacle Financial Partners 3,163 1.0 14. 4. First Bancorp Inc. 3,004 0.9 15. JPMorgan Chase & Co. 2,810 0.9 16. First Citizens BancShares Inc. 2,628 0.8 17. The Toronto-Dominion Bank 2,457 0.8 18. 5. HomeTrust Bancshares Inc. 2,344 0.7 19. 6. C&F Financial Corp. 2,261 0.7 20. Citigroup Inc. 2,024 0.6 21. 7. FVCBankcorp Inc. 1,793 0.5 22. 8. First National Corp. 1,783 0.5 23. 9. Eagle Financial Services Inc. 1,771 0.5 24. 10. John Marshall Bancorp Inc. 1,765 0.5 Source: S&P Capital IQ Pro; Deposit data as of 6/30/2025; Demographic data deposit - weighted by county (1) Community banks defined as banks with less than $10 billion in total assets as of 6/30/2026 A Top - 10 Virginia Deposit Franchise Deposit Market Share: Virginia Market Demographics 2.2% 4.4% 3.2% 1.9% 2026 - 2031 Projected Population Change (%) JMSB EFSI Pro Forma Virginia $162 $139 $151 $111 2031 Projected Median Household Income ($000) JMSB EFSI Pro Forma Virginia Does not include $138 million of John Marshall Bancorp, Inc. deposits in DC & MD
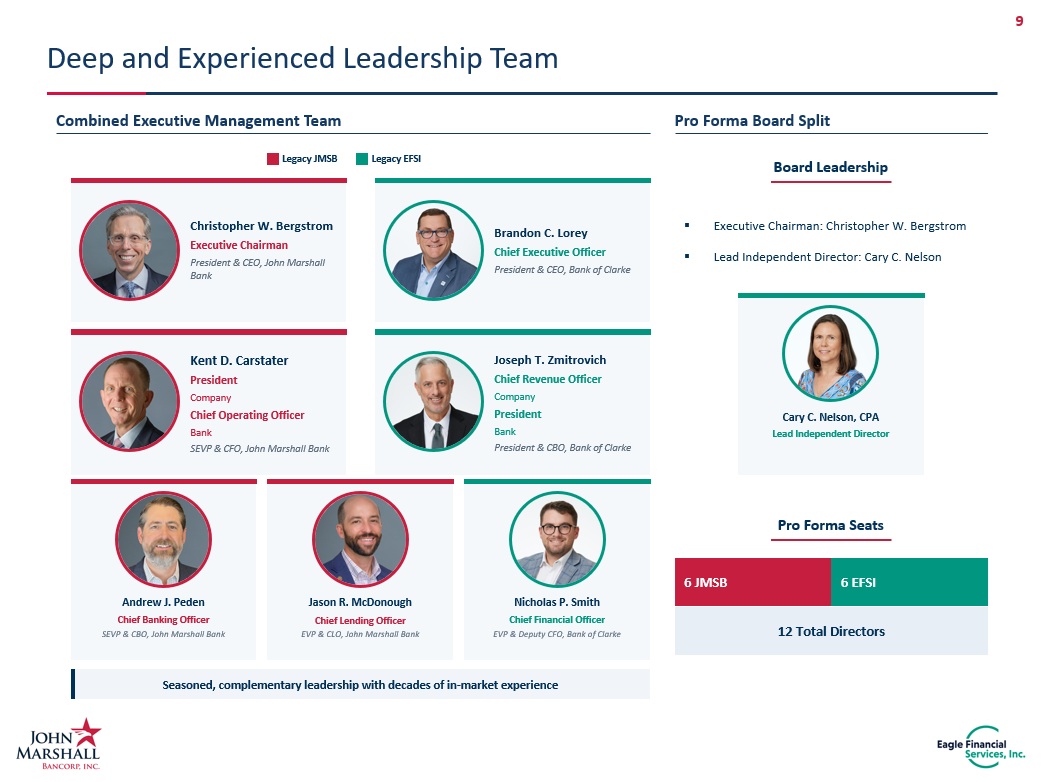
9 Joseph T. Zmitrovich Chief Revenue Officer Company President Bank President & CBO, Bank of Clarke Deep and Experienced Leadership Team Combined Executive Management Team Pro Forma Board Split Christopher W. Bergstrom Executive Chairman President & CEO, John Marshall Bank Brandon C. Lorey Chief Executive Officer President & CEO, Bank of Clarke Seasoned, complementary leadership with decades of in - market experience Legacy JMSB Legacy EFSI 6 JMSB 12 Total Directors Pro Forma Seats 6 EFSI Kent D. Carstater President Company Chief Operating Officer Bank SEVP & CFO, John Marshall Bank Jason R. McDonough Chief Lending Officer EVP & CLO, John Marshall Bank Andrew J. Peden Chief Banking Officer SEVP & CBO, John Marshall Bank Nicholas P. Smith Chief Financial Officer EVP & Deputy CFO, Bank of Clarke Board Leadership ▪ Executive Chairman: Christopher W. Bergstrom ▪ Lead Independent Director: Cary C. Nelson Cary C. Nelson, CPA Lead Independent Director
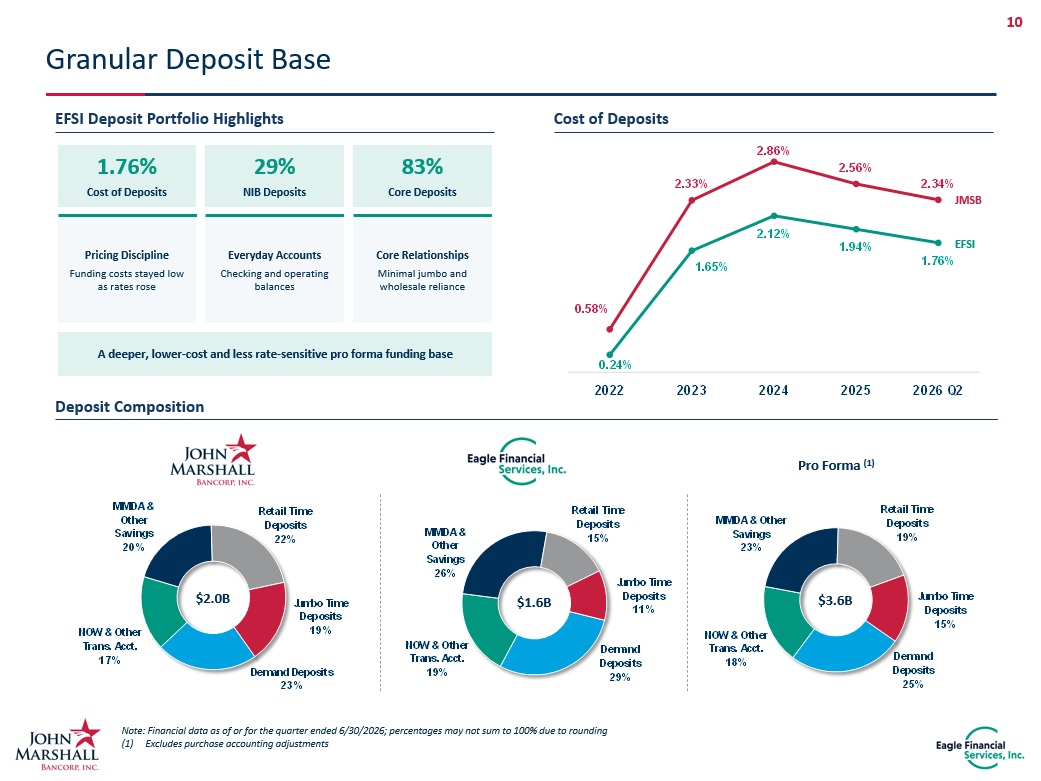
10 0.58% 2.33% 2.86% 2.56% 2.34% 0.24% 1.65% 2.12% 1.94% 1.76% 2022 2023 2024 2025 2026 Q2 Note: Financial data as of or for the quarter ended 6/30/2026 ; percentages may not sum to 100% due to rounding (1) Excludes purchase accounting adjustments Granular Deposit Base Demand Deposits 23% NOW & Other Trans. Acct. 17% MMDA & Other Savings 20% Retail Time Deposits 22% Jumbo Time Deposits 19% Demand Deposits 29% NOW & Other Trans. Acct. 19% MMDA & Other Savings 26% Retail Time Deposits 15% Jumbo Time Deposits 11% Demand Deposits 25% NOW & Other Trans. Acct. 18% MMDA & Other Savings 23% Retail Time Deposits 19% Jumbo Time Deposits 15% $2.0B $1.6B $3.6B Pro Forma (1) Deposit Composition EFSI Deposit Portfolio Highlights Cost of Deposits 1.76% Cost of Deposits 29% NIB Deposits 83% Core Deposits A deeper, lower - cost and less rate - sensitive pro forma funding base Pricing Discipline Funding costs stayed low as rates rose Everyday Accounts Checking and operating balances Core Relationships Minimal jumbo and wholesale reliance JMSB EFSI
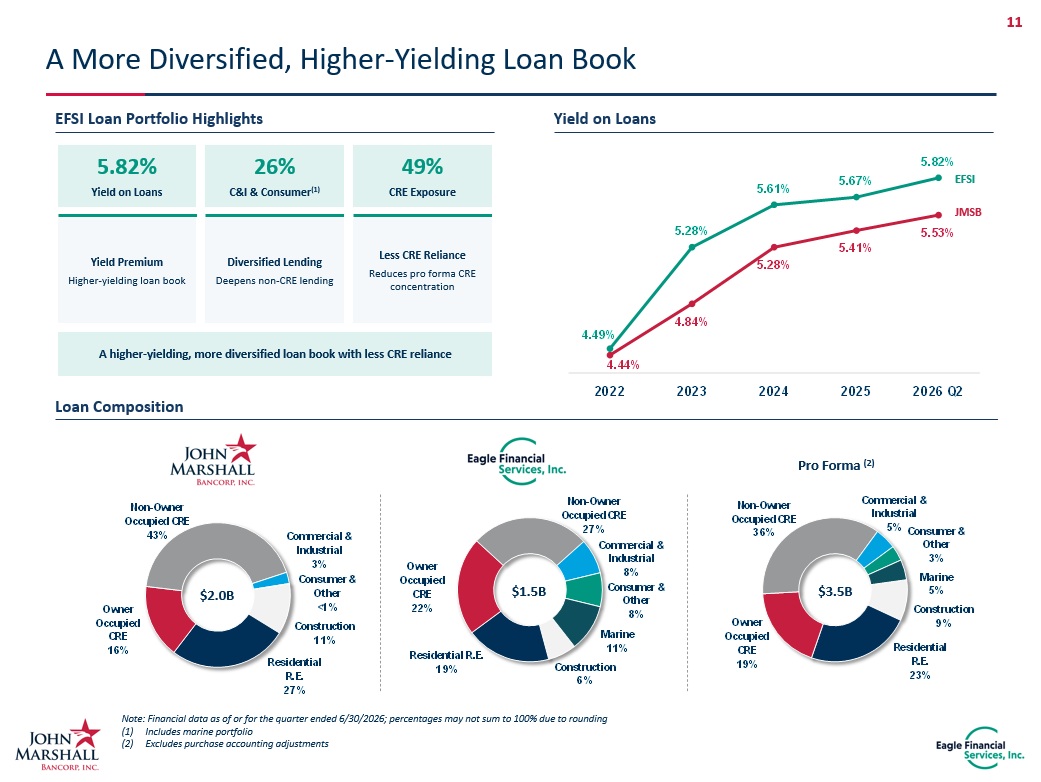
11 4.44% 4.84% 5.28% 5.41% 5.53% 4.49% 5.28% 5.61% 5.67% 5.82% 2022 2023 2024 2025 2026 Q2 Note: Financial data as of or for the quarter ended 6/30/2026; percentages may not sum to 100% due to rounding (1) Includes marine portfolio (2) Excludes purchase accounting adjustments A More Diversified, Higher - Yielding Loan Book Construction 6% Residential R.E. 19% Owner Occupied CRE 22% Non - Owner Occupied CRE 27% Commercial & Industrial 8% Consumer & Other 8% Marine 11% Construction 11% Residential R.E. 27% Owner Occupied CRE 16% Non - Owner Occupied CRE 43% Commercial & Industrial 3% Consumer & Other <1% Construction 9% Residential R.E. 23% Owner Occupied CRE 19% Non - Owner Occupied CRE 36% Commercial & Industrial 5% Consumer & Other 3% Marine 5% $2.0B $1.5B $3.5B Pro Forma ( 2 ) Loan Composition EFSI Loan Portfolio Highlights Yield on Loans A higher - yielding, more diversified loan book with less CRE reliance 5.82% Yield on Loans 26% C&I & Consumer (1) 49% CRE Exposure Yield Premium Higher - yielding loan book Diversified Lending Deepens non - CRE lending Less CRE Reliance Reduces pro forma CRE concentration JMSB EFSI
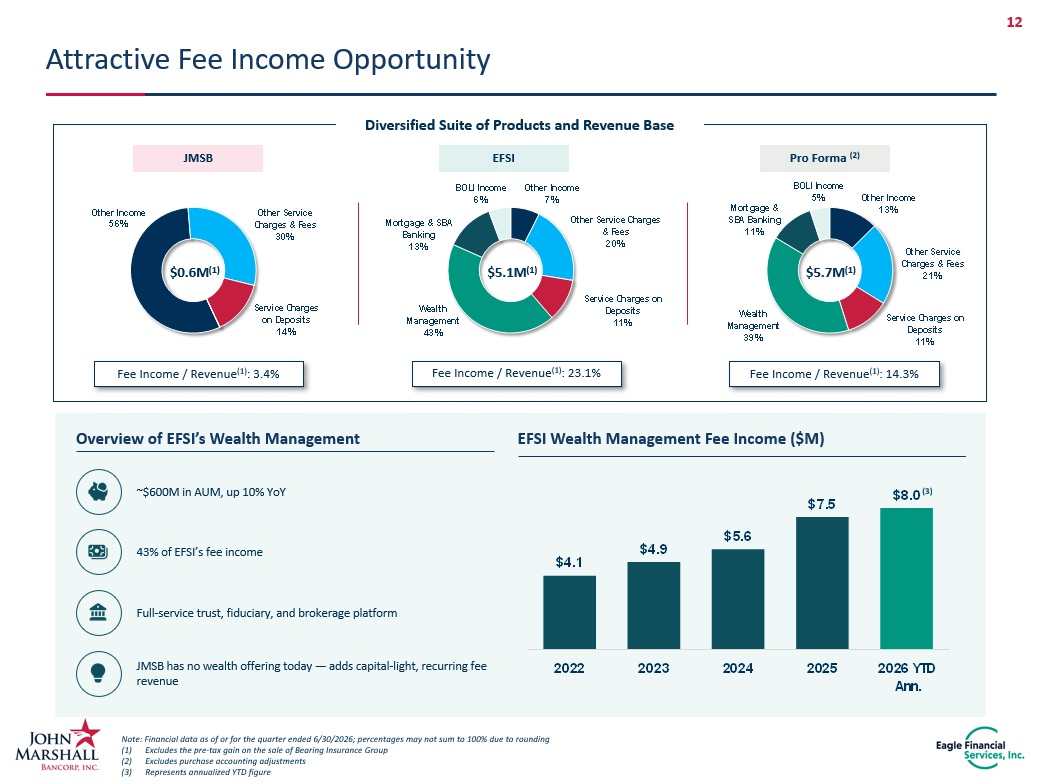
12 Other Income 56% Other Service Charges & Fees 30% Service Charges on Deposits 14% Other Income 7% Other Service Charges & Fees 20% Service Charges on Deposits 11% Wealth Management 43% Mortgage & SBA Banking 13% BOLI Income 6% $4.1 $4.9 $5.6 $7.5 $8.0 2022 2023 2024 2025 2026 YTD Ann. $0.6M (1) $5.1M (1) Other Income 13% Other Service Charges & Fees 21% Service Charges on Deposits 11% Wealth Management 39% Mortgage & SBA Banking 11% BOLI Income 5% $5.7M (1) Note: Financial data as of or for the quarter ended 6/30/2026; percentages may not sum to 100% due to rounding (1) Excludes the pre - tax gain on the sale of Bearing Insurance Group (2) Excludes purchase accounting adjustments (3) Represents annualized YTD figure Attractive Fee Income Opportunity Diversified Suite of Products and Revenue Base Fee Income / Revenue (1) : 3.4% Fee Income / Revenue (1) : 23.1% Fee Income / Revenue (1) : 14. 3 % Overview of EFSI’s Wealth Management EFSI Wealth Management Fee Income ($M) JMSB EFSI Pro Forma (2) (3) ~$600M in AUM, up 10% YoY 4 3 % of EFSI’s fee income Full - service trust, fiduciary , and brokerage platform JMSB has no wealth offering today — adds capital - light, recurring fee revenue
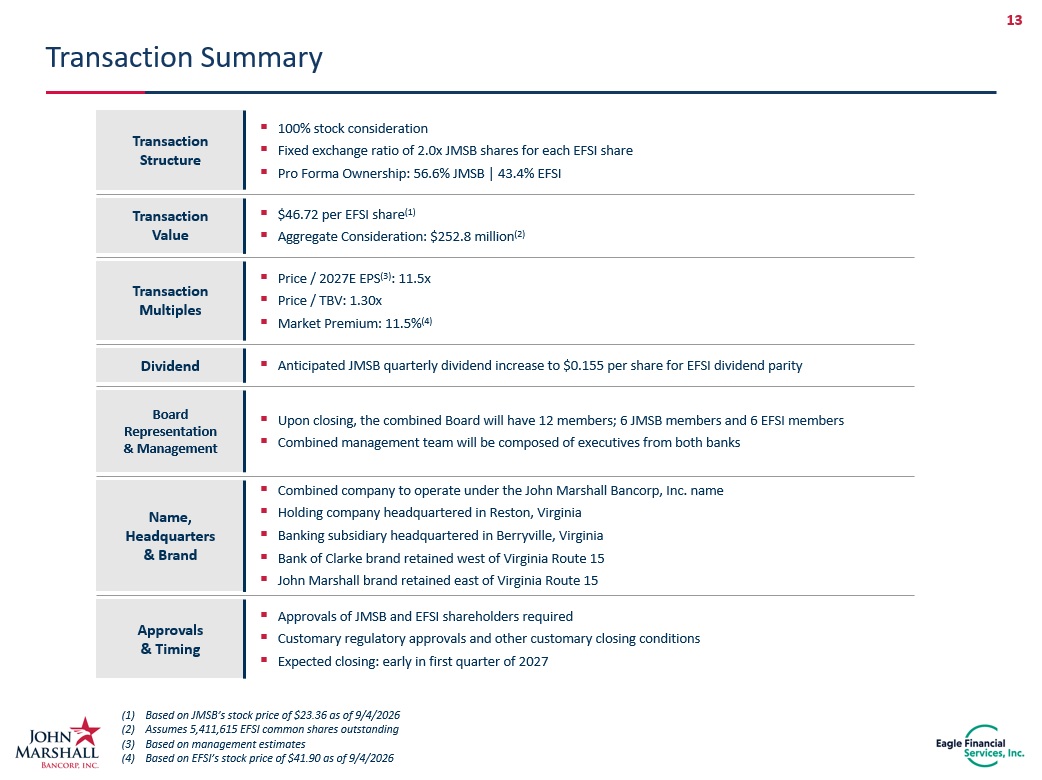
13 Transaction Summary Transaction Structure Transaction Value Transaction Multiples Board Representation & Management Approvals & Timing ▪ 100% stock consideration ▪ Fixed exchange ratio of 2.0x JMSB shares for each EFSI share ▪ Pro Forma Ownership: 56.6% JMSB | 43.4% EFSI ▪ $46.72 per EFSI share (1) ▪ Aggregate Consideration: $252.8 million (2) ▪ Price / 2027E EPS (3) : 11.5x ▪ Price / TBV: 1.30x ▪ Market Premium: 11.5% (4) ▪ Upon closing, the combined Board will have 12 members; 6 JMSB members and 6 EFSI members ▪ Combined management team will be composed of executives from both banks ▪ Approvals of JMSB and EFSI shareholders required ▪ Customary regulatory approvals and other customary closing conditions ▪ Expected closing: early in first quarter of 2027 (1) Based on JMSB’s stock price of $23.36 as of 9/4/2026 (2) Assumes 5,411,615 EFSI common shares outstanding (3) Based on management estimates (4) Based on EFSI’s stock price of $41.90 as of 9/4/2026 Name, Headquarters & Brand ▪ Combined company to operate under the John Marshall Bancorp, Inc. name ▪ Holding company headquartered in Reston, Virginia ▪ Banking subsidiary headquartered in Berryville, Virginia ▪ Bank of Clarke brand retained west of Virginia Route 15 ▪ John Marshall brand retained east of Virginia Route 15 Dividend ▪ Anticipated JMSB quarterly dividend increase to $0.155 per share for EFSI dividend parity
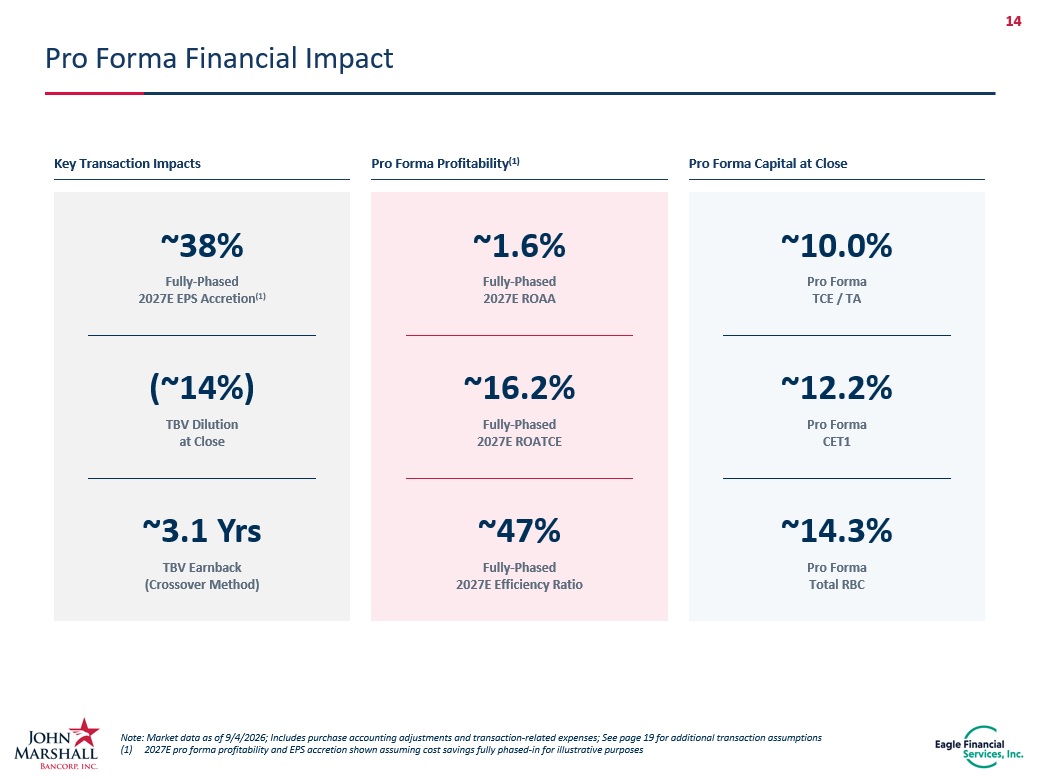
14 Note: Market data as of 9/4/2026; Includes purchase accounting adjustments and transaction - related expenses; See page 19 for additional transaction assumptions (1) 2027E pro forma profitability and EPS accretion shown assuming cost savings fully phased - in for illustrative purposes Pro Forma Financial Impact Key Transaction Impacts (~ 14 %) TBV Dilution at Close ~ 38 % Fully - Phased 2027E EPS Accretion (1) ~3. 1 Yrs TBV Earnback (Crossover Method) Pro Forma Capital at Close ~ 10 . 0 % Pro Forma TCE / TA ~ 12 . 2 % Pro Forma CET1 ~ 14. 3 % Pro Forma Total RBC Pro Forma Profitability (1) ~1.6% Fully - Phased 2027E ROAA ~1 6 . 2 % Fully - Phased 2027E ROATCE ~4 7 % Fully - Phased 2027E Efficiency Ratio
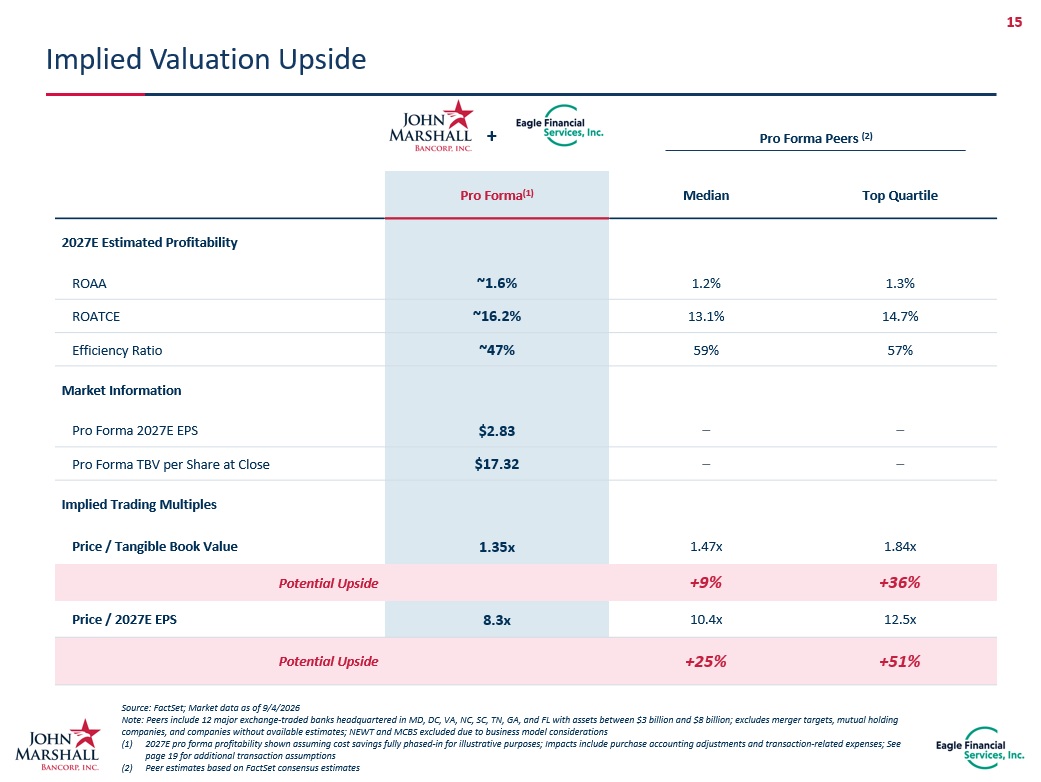
15 Implied Valuation Upside Top Quartile Median Pro Forma (1) 2027E Estimated Profitability 1.3% 1.2% ~1.6% ROAA 14.7% 13.1% ~ 16.2 % ROATCE 57% 59% ~4 7 % Efficiency Ratio Market Information – – $2. 83 Pro Forma 2027E EPS – – $ 17.32 Pro Forma TBV per Share at Close Implied Trading Multiples 1.84x 1.47x 1.35x Price / Tangible Book Value + 36 % + 9 % Potential Upside 1 2.5 x 10. 4 x 8.3 x Price / 2027E EPS + 51 % + 25 % Potential Upside + Pro Forma Peers (2) Source: FactSet; Market data as of 9/4/2026 Note: Peers include 12 major exchange - traded banks headquartered in MD, DC, VA, NC, SC, TN, GA, and FL with assets between $3 bi llion and $8 billion; excludes merger targets, mutual holding companies, and companies without available estimates; NEWT and MCBS excluded due to business model considerations (1) 2027E pro forma profitability shown assuming cost savings fully phased - in for illustrative purposes; Impacts include purchase ac counting adjustments and transaction - related expenses; See page 19 for additional transaction assumptions (2) Peer estimates based on FactSet consensus estimates
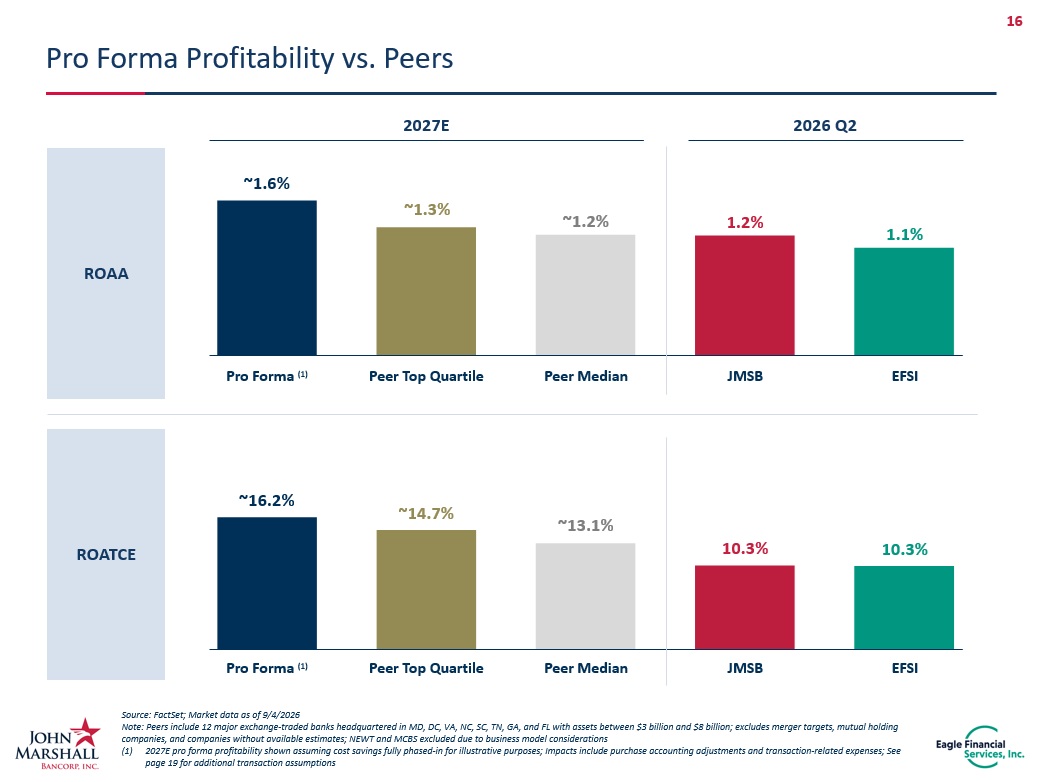
16 Pro Forma Profitability vs. Peers Source: FactSet; Market data as of 9/4/2026 Note: Peers include 12 major exchange - traded banks headquartered in MD, DC, VA, NC, SC, TN, GA, and FL with assets between $3 bi llion and $8 billion; excludes merger targets, mutual holding companies, and companies without available estimates; NEWT and MCBS excluded due to business model considerations (1) 2027E pro forma profitability shown assuming cost savings fully phased - in for illustrative purposes; Impacts include purchase ac counting adjustments and transaction - related expenses; See page 19 for additional transaction assumptions ROAA ROA TCE ~1. 6 % ~1.3% ~1.2% 1.2% 1.1% Pro Forma (1) Peer Top Quartile Peer Median JMSB EFSI 2027E 2026 Q2 ~1 6 . 2 % ~14.7% ~13.1% 10.3% 10.3% Peer Top Quartile Peer Median JMSB EFSI Pro Forma (1)
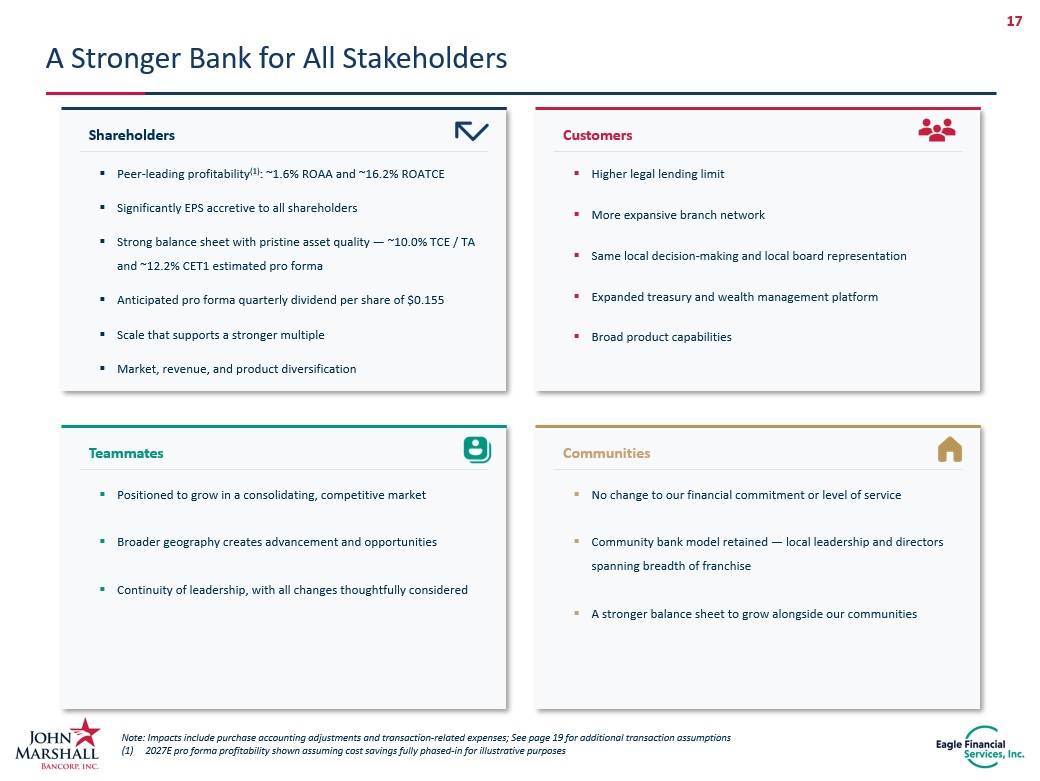
17 A Stronger Bank for All Stakeholders ▪ Peer - leading profitability (1) : ~1.6% ROA A and ~16.2% ROATCE ▪ Significantly EPS accretive to all shareholders ▪ Strong balance sheet with pristine asset quality — ~10 . 0 % TCE / TA and ~ 1 2.2 % CET1 estimated pro forma ▪ Anticipated pro forma quarterly dividend per share of $0.155 ▪ Scale that supports a stronger multiple ▪ Market, revenue, and product diversification ▪ Higher legal lending limit ▪ More expansive branch network ▪ Same local decision - making and local board representation ▪ Expanded treasury and wealth management platform ▪ Broad product capabilities ▪ Positioned to grow in a consolidating, competitive market ▪ Broader geography creates advancement and opportunities ▪ Continuity of leadership, with all changes thoughtfully considered ▪ No change to our financial commitment or level of service ▪ Community bank model retained — local leadership and directors spanning breadth of franchise ▪ A stronger balance sheet to grow alongside our communities Shareholders Customers Teammates Communities Note: Impacts include purchase accounting adjustments and transaction - related expenses; See page 19 for additional transaction a ssumptions (1) 2027E pro forma profitability shown assuming cost savings fully phased - in for illustrative purposes

18 SECTION Appendix
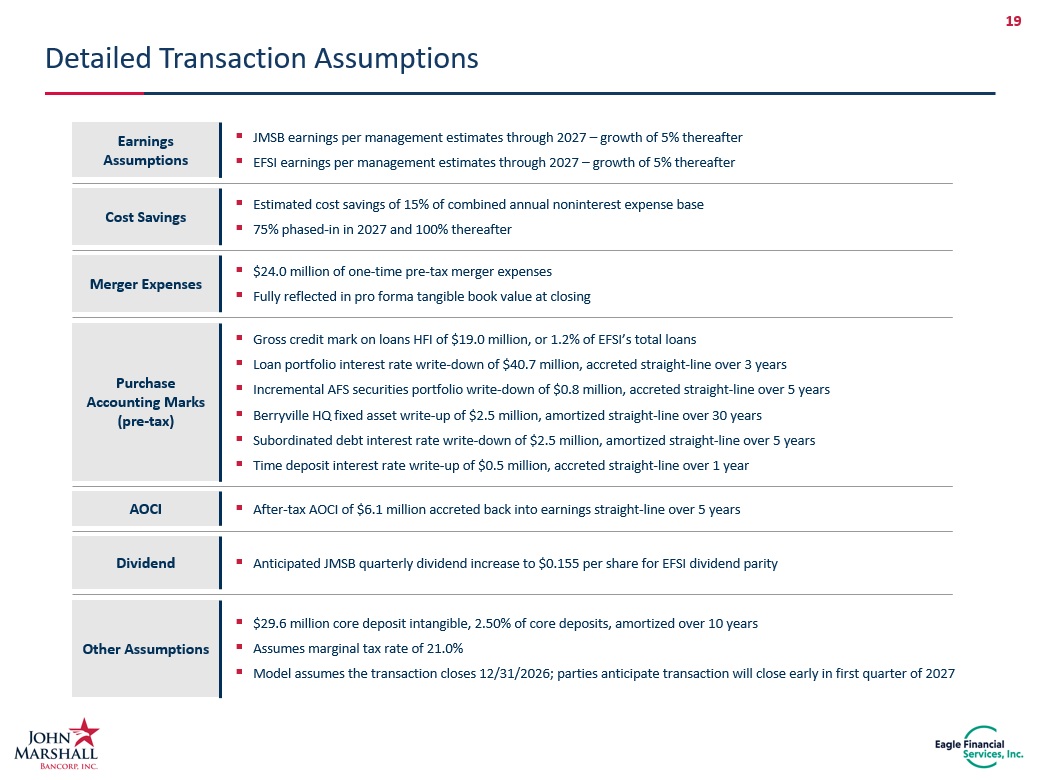
19 Detailed Transaction Assumptions Earnings Assumptions Cost Savings Merger Expenses Purchase Accounting Marks (pre - tax) ▪ JMSB earnings per management estimates through 2027 – growth of 5% thereafter ▪ EFSI earnings per management estimates through 2027 – growth of 5% thereafter ▪ Estimated cost savings of 15% of combined annual noninterest expense base ▪ 75% phased - in in 2027 and 100% thereafter ▪ $24.0 million of one - time pre - tax merger expenses ▪ Fully reflected in pro forma tangible book value at closing ▪ Gross credit mark on loans HFI of $19.0 million, or 1.2% of EFSI’s total loans ▪ Loan portfolio interest rate write - down of $40.7 million, accreted straight - line over 3 years ▪ Incremental AFS securities portfolio write - down of $0.8 million, accreted straight - line over 5 years ▪ Berryville HQ fixed asset write - up of $2.5 million, amortized straight - line over 30 years ▪ Subordinated debt interest rate write - down of $2.5 million, amortized straight - line over 5 years ▪ Time deposit interest rate write - up of $0.5 million, accreted straight - line over 1 year AOCI Other Assumptions ▪ After - tax AOCI of $6.1 million accreted back into earnings straight - line over 5 years ▪ $29.6 million core deposit intangible, 2.50% of core deposits, amortized over 10 years ▪ Assumes marginal tax rate of 21.0% ▪ Model assumes the transaction closes 12/31/2026; parties anticipate transaction will close early in first quarter of 2027 Dividend ▪ Anticipated JMSB quarterly dividend increase to $0.155 per share for EFSI dividend parity
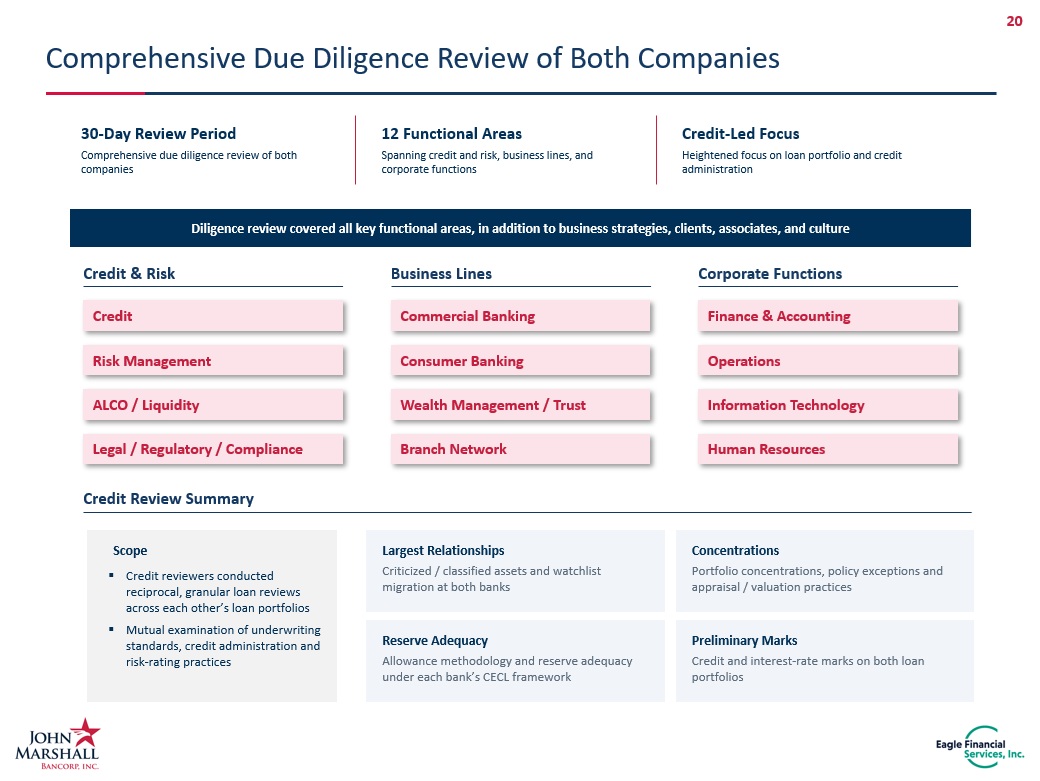
20 Comprehensive Due Diligence Review of Both Companies 30 - Day Review Period Comprehensive due diligence review of both companies 12 Functional Areas Spanning credit and risk, business lines , and corporate functions Credit - Led Focus Heightened focus on loan portfolio and credit administration Diligence review covered all key functional areas, in addition to business strategies, clients, associates , and culture Credit & Risk Credit Risk Management ALCO / Liquidity Legal / Regulatory / Compliance Business Lines Commercial Banking Consumer Banking Wealth Management / Trust Branch Network Corporate Functions Finance & Accounting Operations Information Technology Human Resources Largest Relationships Criticized / classified assets and watchlist migration at both banks Concentrations Portfolio concentrations, policy exceptions and appraisal / valuation practices Reserve Adequacy Allowance methodology and reserve adequacy under each bank’s CECL framework Preliminary Marks Credit and interest - rate marks on both loan portfolios Credit Review Summary ▪ Credit reviewers conducted reciprocal, granular loan reviews across each other’s loan portfolios ▪ Mutual examination of underwriting standards, credit administration and risk - rating practices Scope
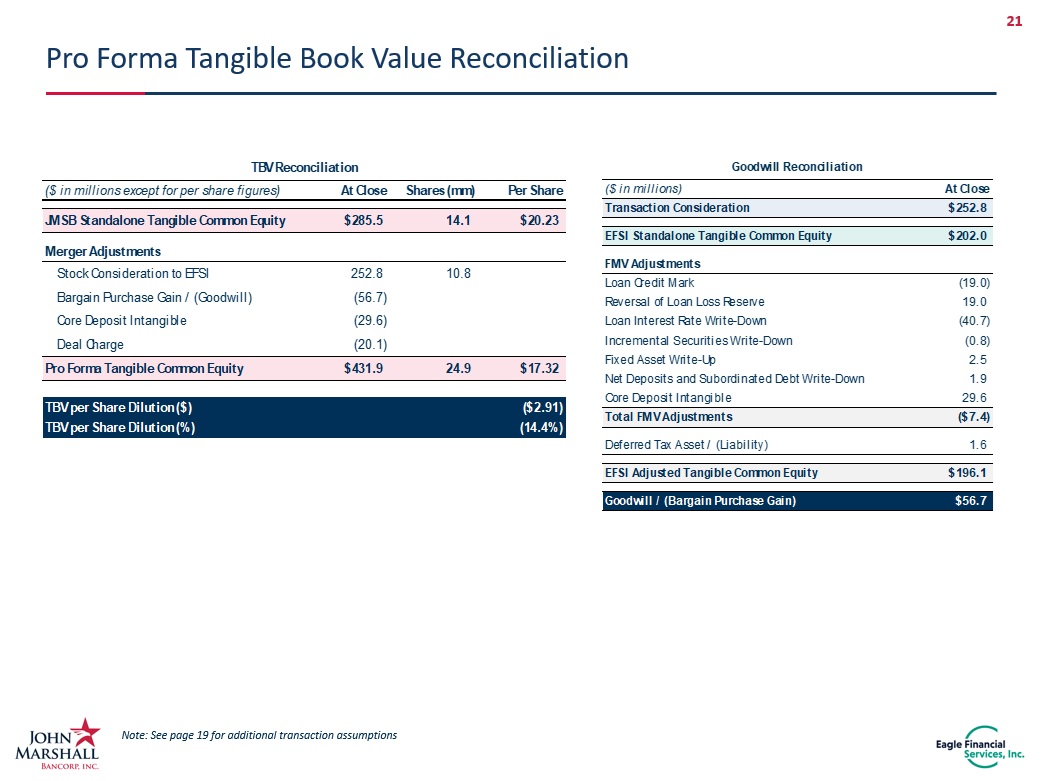
21 Goodwill Reconciliation ($ in millions) At Close Transaction Consideration $252.8 EFSI Standalone Tangible Common Equity $202.0 FMV Adjustments Loan Credit Mark (19.0) Reversal of Loan Loss Reserve 19.0 Loan Interest Rate Write-Down (40.7) Incremental Securities Write-Down (0.8) Fixed Asset Write-Up 2.5 Net Deposits and Subordinated Debt Write-Down 1.9 Core Deposit Intangible 29.6 Total FMV Adjustments ($7.4) Deferred Tax Asset / (Liability) 1.6 EFSI Adjusted Tangible Common Equity $196.1 Goodwill / (Bargain Purchase Gain) $56.7 Note: See page 19 for additional transaction assumptions Pro Forma Tangible Book Value Reconciliation TBV Reconciliation ($ in millions except for per share figures) At Close Shares (mm) Per Share JMSB Standalone Tangible Common Equity $285.5 14.1 $20.23 Merger Adjustments Stock Consideration to EFSI 252.8 10.8 Bargain Purchase Gain / (Goodwill) (56.7) Core Deposit Intangible (29.6) Deal Charge (20.1) Pro Forma Tangible Common Equity $431.9 24.9 $17.32 TBV per Share Dilution ($) ($2.91) TBV per Share Dilution (%) (14.4%)