Shareholder Report
|
12 Months Ended |
|
Jun. 30, 2026
USD ($)
Holding
|
|---|
| Shareholder Report [Line Items] |
|
| Document Type |
N-CSR
|
| Amendment Flag |
false
|
| Registrant Name |
JP MORGAN MUTUAL FUND INVESTMENT TRUST
|
| Entity Central Index Key |
0000803747
|
| Entity Investment Company Type |
N-1A
|
| Document Period End Date |
Jun. 30, 2026
|
| C000133820 [Member] |
|
| Shareholder Report [Line Items] |
|
| Fund Name |
JPMorgan Growth Advantage Fund
|
| Class Name |
Class R6 Shares
|
| Trading Symbol |
JGVVX
|
| Annual or Semi-Annual Statement [Text Block] |
This annual shareholder report contains important information about the JPMorgan Growth Advantage Fund (the "Fund") for the period of July 1, 2025 to June 30, 2026.
|
| Shareholder Report Annual or Semi-Annual |
annual shareholder report
|
| Additional Information [Text Block] |
You can find additional information about the Fund at www.jpmorganfunds.com/funddocuments. You can also request this information by contacting us at 1-800-480-4111, by sending an e-mail request to Funds.Website.Support@jpmorganfunds.com or by asking any financial intermediary that offers shares of the Fund.
|
| Additional Information Phone Number |
1-800-480-4111
|
| Additional Information Email |
Funds.Website.Support@jpmorganfunds.com
|
| Additional Information Website |
www.jpmorganfunds.com/funddocuments
|
| Expenses [Text Block] |
What were the Fund costs for the last year? (based on a hypothetical $10,000 investment)
| Fund (Class) |
Costs of a
$10,000 investment |
Costs paid as a percentage
of a $10,000 investment |
JPMorgan Growth Advantage Fund
(Class R6 Shares) |
$54 |
0.50% |
|
| Expenses Paid, Amount |
$ 54
|
| Expense Ratio, Percent |
0.50%
|
| Factors Affecting Performance [Text Block] |
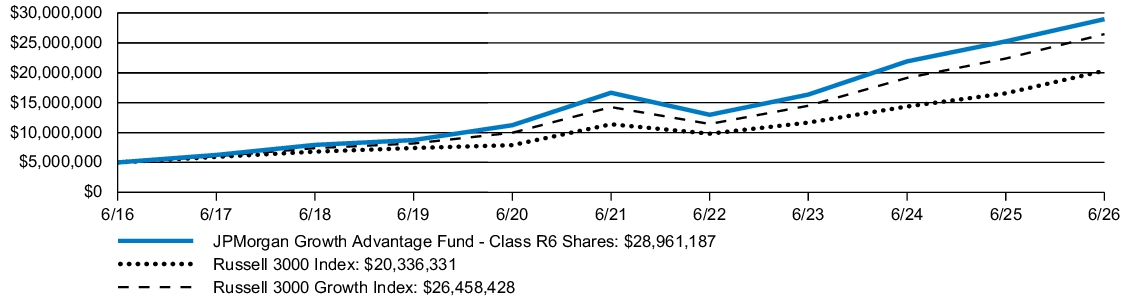
How did the Fund Perform? The Fund's Class R6 Shares returned 14.70% for the twelve months ended June 30, 2026. The Russell 3000 Index (the "Index") returned 22.82% and the Russell 3000 Growth Index returned 18.24% for the twelve months ended June 30, 2026. -
The Fund’s security selection in the technology and consumer discretionary sectors detracted from relative performance. -
The Fund’s underweight allocations to Lam Research and Alphabet detracted from relative performance. -
The Fund’s security selection in the industrials and telecommunications sectors contributed to relative performance. -
The Fund’s underweight allocation to Microsoft and overweight allocation to Teradyne contributed to relative performance.
|
| Performance Past Does Not Indicate Future [Text] |
The performance quoted is past performance and is not a guarantee of future results.
|
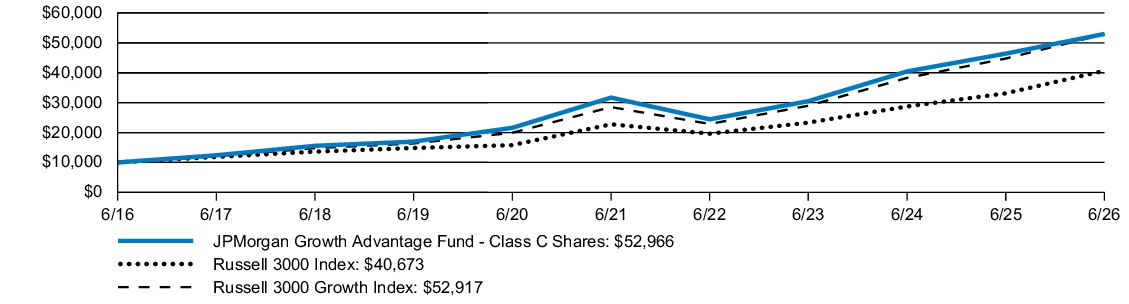
| Line Graph [Table Text Block] |
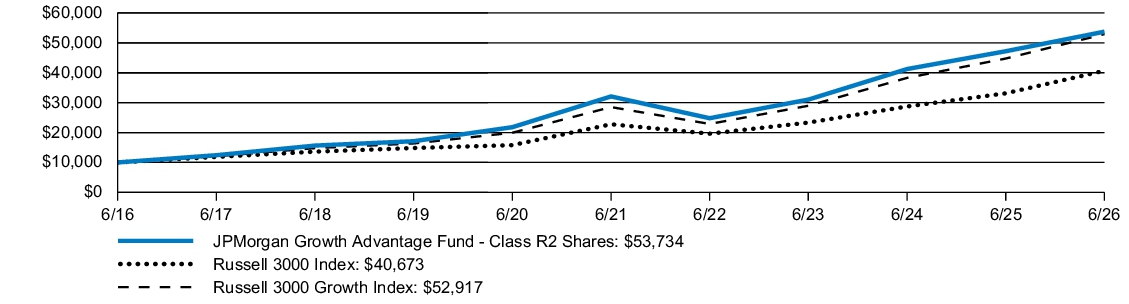
Fund Performance
|
| Average Annual Return [Table Text Block] |
| AVERAGE ANNUAL TOTAL RETURNS |
INCEPTION
DATE |
1 YEAR |
|
5 YEAR |
|
10 YEAR |
|
| JPMorgan Growth Advantage Fund (Class R6 Shares) |
December 23, 2013 |
14.70 |
% |
11.70 |
% |
19.20 |
% |
| Russell 3000 Index |
|
22.82 |
|
12.31 |
|
15.06 |
|
| Russell 3000 Growth Index |
|
18.24 |
|
13.17 |
|
18.13 |
|
|
| Performance Inception Date |
Dec. 23, 2013
|
| No Deduction of Taxes [Text Block] |
Also, performance shown in this section does not reflect the deduction of taxes that a shareholder would pay on Fund distributions or on gains resulting from redemptions of Fund shares.
|
| Updated Performance Information Location [Text Block] |
Updated performance information is available by visiting www.jpmorganfunds.com or by calling 1-800-480-4111.
|
| Net Assets |
$ 22,367,408,000
|
| Holdings Count | Holding |
101
|
| Advisory Fees Paid, Amount |
$ 102,247,000
|
| Investment Company Portfolio Turnover |
51.00%
|
| Additional Fund Statistics [Text Block] |
KEY FUND STATISTICS
| Fund net assets (000's) |
$22,367,408 |
|
| Total number of portfolio holdings |
101 |
|
| Portfolio turnover rate |
51 |
% |
| Total advisory fees paid (000's) |
$102,247 |
|
|
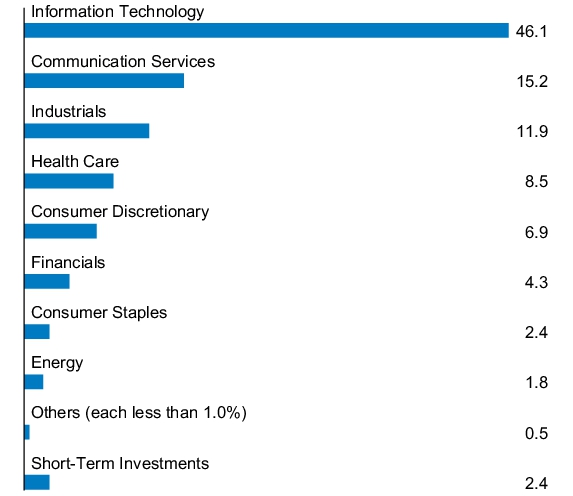
| Holdings [Text Block] |
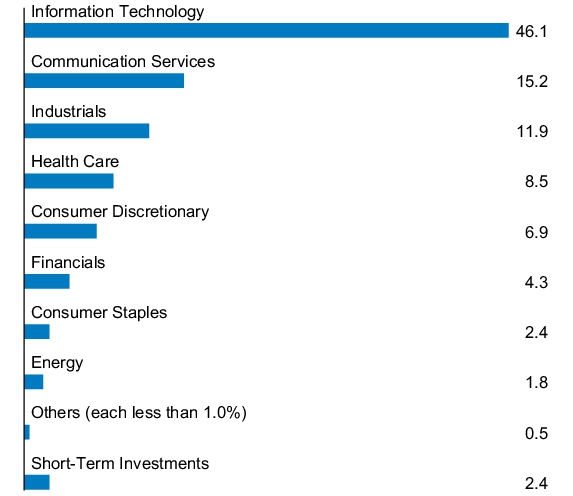
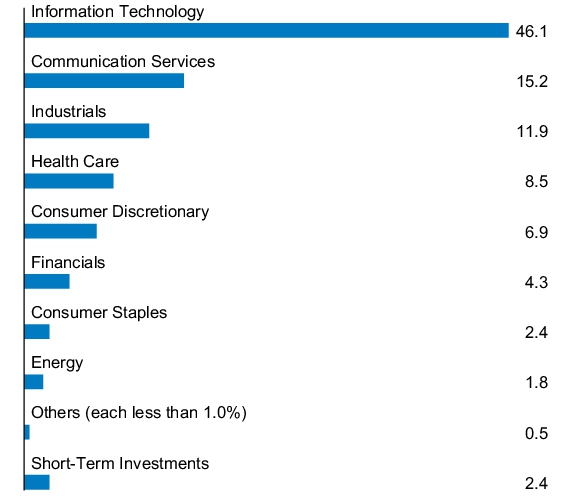
PORTFOLIO COMPOSITION - SECTOR
(% of Total Investments)
|
| C000073572 [Member] |
|
| Shareholder Report [Line Items] |
|
| Fund Name |
JPMorgan Growth Advantage Fund
|
| Class Name |
Class R5 Shares
|
| Trading Symbol |
JGVRX
|
| Annual or Semi-Annual Statement [Text Block] |
This annual shareholder report contains important information about the JPMorgan Growth Advantage Fund (the "Fund") for the period of July 1, 2025 to June 30, 2026.
|
| Shareholder Report Annual or Semi-Annual |
annual shareholder report
|
| Additional Information [Text Block] |
You can find additional information about the Fund at www.jpmorganfunds.com/funddocuments. You can also request this information by contacting us at 1-800-480-4111, by sending an e-mail request to Funds.Website.Support@jpmorganfunds.com or by asking any financial intermediary that offers shares of the Fund.
|
| Additional Information Phone Number |
1-800-480-4111
|
| Additional Information Email |
Funds.Website.Support@jpmorganfunds.com
|
| Additional Information Website |
www.jpmorganfunds.com/funddocuments
|
| Expenses [Text Block] |
What were the Fund costs for the last year? (based on a hypothetical $10,000 investment)
| Fund (Class) |
Costs of a
$10,000 investment |
Costs paid as a percentage
of a $10,000 investment |
JPMorgan Growth Advantage Fund
(Class R5 Shares) |
$64 |
0.60% |
|
| Expenses Paid, Amount |
$ 64
|
| Expense Ratio, Percent |
0.60%
|
| Factors Affecting Performance [Text Block] |
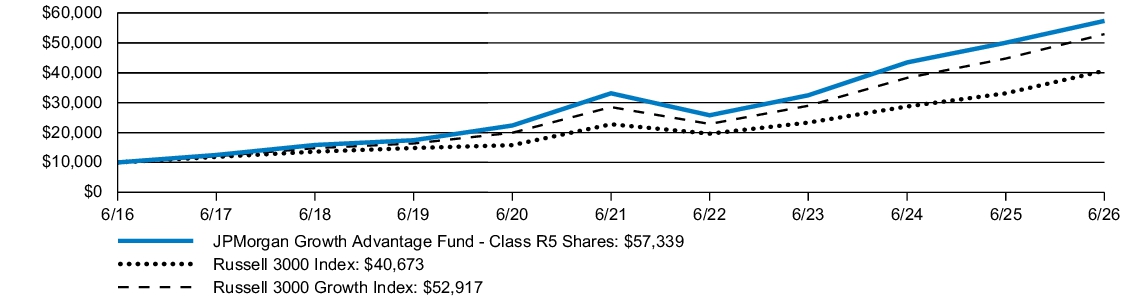
How did the Fund Perform? The Fund's Class R5 Shares returned 14.59% for the twelve months ended June 30, 2026. The Russell 3000 Index (the "Index") returned 22.82% and the Russell 3000 Growth Index returned 18.24% for the twelve months ended June 30, 2026. -
The Fund’s security selection in the technology and consumer discretionary sectors detracted from relative performance. -
The Fund’s underweight allocations to Lam Research and Alphabet detracted from relative performance. -
The Fund’s security selection in the industrials and telecommunications sectors contributed to relative performance. -
The Fund’s underweight allocation to Microsoft and overweight allocation to Teradyne contributed to relative performance.
|
| Performance Past Does Not Indicate Future [Text] |
The performance quoted is past performance and is not a guarantee of future results.
|
| Line Graph [Table Text Block] |
Fund Performance
|
| Average Annual Return [Table Text Block] |
| AVERAGE ANNUAL TOTAL RETURNS |
INCEPTION
DATE |
1 YEAR |
|
5 YEAR |
|
10 YEAR |
|
| JPMorgan Growth Advantage Fund (Class R5 Shares) |
January 8, 2009 |
14.59 |
% |
11.60 |
% |
19.08 |
% |
| Russell 3000 Index |
|
22.82 |
|
12.31 |
|
15.06 |
|
| Russell 3000 Growth Index |
|
18.24 |
|
13.17 |
|
18.13 |
|
|
| Performance Inception Date |
Jan. 08, 2009
|
| No Deduction of Taxes [Text Block] |
Also, performance shown in this section does not reflect the deduction of taxes that a shareholder would pay on Fund distributions or on gains resulting from redemptions of Fund shares.
|
| Updated Performance Information Location [Text Block] |
Updated performance information is available by visiting www.jpmorganfunds.com or by calling 1-800-480-4111.
|
| Net Assets |
$ 22,367,408,000
|
| Holdings Count | Holding |
101
|
| Advisory Fees Paid, Amount |
$ 102,247,000
|
| Investment Company Portfolio Turnover |
51.00%
|
| Additional Fund Statistics [Text Block] |
KEY FUND STATISTICS
| Fund net assets (000's) |
$22,367,408 |
|
| Total number of portfolio holdings |
101 |
|
| Portfolio turnover rate |
51 |
% |
| Total advisory fees paid (000's) |
$102,247 |
|
|
| Holdings [Text Block] |
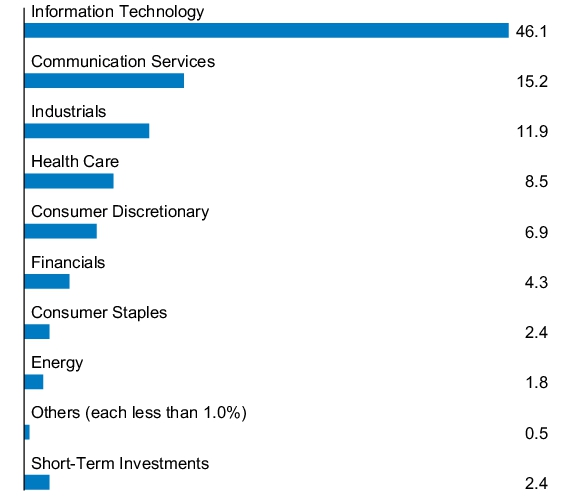
PORTFOLIO COMPOSITION - SECTOR
(% of Total Investments)
|
| C000187976 [Member] |
|
| Shareholder Report [Line Items] |
|
| Fund Name |
JPMorgan Growth Advantage Fund
|
| Class Name |
Class R4 Shares
|
| Trading Symbol |
JGTUX
|
| Annual or Semi-Annual Statement [Text Block] |
This annual shareholder report contains important information about the JPMorgan Growth Advantage Fund (the "Fund") for the period of July 1, 2025 to June 30, 2026.
|
| Shareholder Report Annual or Semi-Annual |
annual shareholder report
|
| Additional Information [Text Block] |
You can find additional information about the Fund at www.jpmorganfunds.com/funddocuments. You can also request this information by contacting us at 1-800-480-4111, by sending an e-mail request to Funds.Website.Support@jpmorganfunds.com or by asking any financial intermediary that offers shares of the Fund.
|
| Additional Information Phone Number |
1-800-480-4111
|
| Additional Information Email |
Funds.Website.Support@jpmorganfunds.com
|
| Additional Information Website |
www.jpmorganfunds.com/funddocuments
|
| Expenses [Text Block] |
What were the Fund costs for the last year? (based on a hypothetical $10,000 investment)
| Fund (Class) |
Costs of a
$10,000 investment |
Costs paid as a percentage
of a $10,000 investment |
JPMorgan Growth Advantage Fund
(Class R4 Shares) |
$80 |
0.75% |
|
| Expenses Paid, Amount |
$ 80
|
| Expense Ratio, Percent |
0.75%
|
| Factors Affecting Performance [Text Block] |
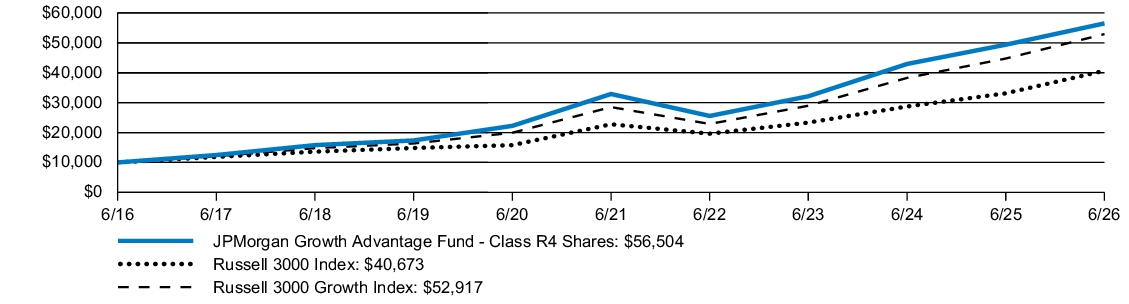
How did the Fund Perform? The Fund's Class R4 Shares returned 14.42% for the twelve months ended June 30, 2026. The Russell 3000 Index (the "Index") returned 22.82% and the Russell 3000 Growth Index returned 18.24% for the twelve months ended June 30, 2026. -
The Fund’s security selection in the technology and consumer discretionary sectors detracted from relative performance. -
The Fund’s underweight allocations to Lam Research and Alphabet detracted from relative performance. -
The Fund’s security selection in the industrials and telecommunications sectors contributed to relative performance. -
The Fund’s underweight allocation to Microsoft and overweight allocation to Teradyne contributed to relative performance.
|
| Performance Past Does Not Indicate Future [Text] |
The performance quoted is past performance and is not a guarantee of future results.
|
| Line Graph [Table Text Block] |
Fund Performance
|
| Average Annual Return [Table Text Block] |
| AVERAGE ANNUAL TOTAL RETURNS |
INCEPTION
DATE |
1 YEAR |
|
5 YEAR |
|
10 YEAR |
|
| JPMorgan Growth Advantage Fund (Class R4 Shares) |
May 31, 2017 |
14.42 |
% |
11.43 |
% |
18.91 |
% |
| Russell 3000 Index |
|
22.82 |
|
12.31 |
|
15.06 |
|
| Russell 3000 Growth Index |
|
18.24 |
|
13.17 |
|
18.13 |
|
|
| Performance Inception Date |
May 31, 2017
|
| No Deduction of Taxes [Text Block] |
Also, performance shown in this section does not reflect the deduction of taxes that a shareholder would pay on Fund distributions or on gains resulting from redemptions of Fund shares.
|
| Updated Performance Information Location [Text Block] |
Updated performance information is available by visiting www.jpmorganfunds.com or by calling 1-800-480-4111.
|
| Net Assets |
$ 22,367,408,000
|
| Holdings Count | Holding |
101
|
| Advisory Fees Paid, Amount |
$ 102,247,000
|
| Investment Company Portfolio Turnover |
51.00%
|
| Additional Fund Statistics [Text Block] |
KEY FUND STATISTICS
| Fund net assets (000's) |
$22,367,408 |
|
| Total number of portfolio holdings |
101 |
|
| Portfolio turnover rate |
51 |
% |
| Total advisory fees paid (000's) |
$102,247 |
|
|
| Holdings [Text Block] |
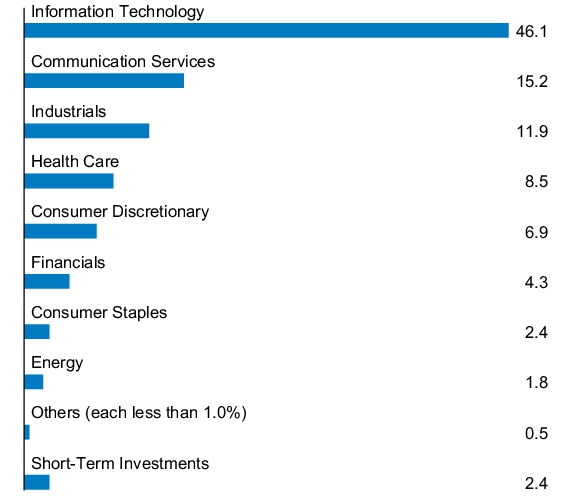
PORTFOLIO COMPOSITION - SECTOR
(% of Total Investments)
|
| C000187975 [Member] |
|
| Shareholder Report [Line Items] |
|
| Fund Name |
JPMorgan Growth Advantage Fund
|
| Class Name |
Class R3 Shares
|
| Trading Symbol |
JGTTX
|
| Annual or Semi-Annual Statement [Text Block] |
This annual shareholder report contains important information about the JPMorgan Growth Advantage Fund (the "Fund") for the period of July 1, 2025 to June 30, 2026.
|
| Shareholder Report Annual or Semi-Annual |
annual shareholder report
|
| Additional Information [Text Block] |
You can find additional information about the Fund at www.jpmorganfunds.com/funddocuments. You can also request this information by contacting us at 1-800-480-4111, by sending an e-mail request to Funds.Website.Support@jpmorganfunds.com or by asking any financial intermediary that offers shares of the Fund.
|
| Additional Information Phone Number |
1-800-480-4111
|
| Additional Information Email |
Funds.Website.Support@jpmorganfunds.com
|
| Additional Information Website |
www.jpmorganfunds.com/funddocuments
|
| Expenses [Text Block] |
What were the Fund costs for the last year? (based on a hypothetical $10,000 investment)
| Fund (Class) |
Costs of a
$10,000 investment |
Costs paid as a percentage
of a $10,000 investment |
JPMorgan Growth Advantage Fund
(Class R3 Shares) |
$107 |
1.00% |
|
| Expenses Paid, Amount |
$ 107
|
| Expense Ratio, Percent |
1.00%
|
| Factors Affecting Performance [Text Block] |
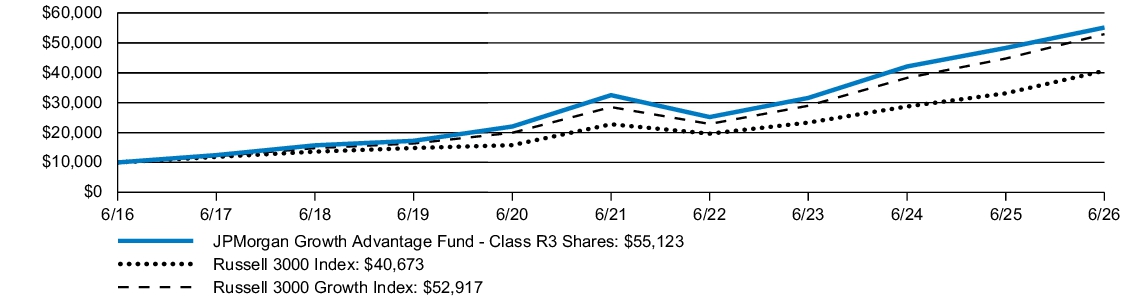
How did the Fund Perform? The Fund's Class R3 Shares returned 14.14% for the twelve months ended June 30, 2026. The Russell 3000 Index (the "Index") returned 22.82% and the Russell 3000 Growth Index returned 18.24% for the twelve months ended June 30, 2026. -
The Fund’s security selection in the technology and consumer discretionary sectors detracted from relative performance. -
The Fund’s underweight allocations to Lam Research and Alphabet detracted from relative performance. -
The Fund’s security selection in the industrials and telecommunications sectors contributed to relative performance. -
The Fund’s underweight allocation to Microsoft and overweight allocation to Teradyne contributed to relative performance.
|
| Performance Past Does Not Indicate Future [Text] |
The performance quoted is past performance and is not a guarantee of future results.
|
| Line Graph [Table Text Block] |
Fund Performance
|
| Average Annual Return [Table Text Block] |
| AVERAGE ANNUAL TOTAL RETURNS |
INCEPTION
DATE |
1 YEAR |
|
5 YEAR |
|
10 YEAR |
|
| JPMorgan Growth Advantage Fund (Class R3 Shares) |
May 31, 2017 |
14.14 |
% |
11.14 |
% |
18.61 |
% |
| Russell 3000 Index |
|
22.82 |
|
12.31 |
|
15.06 |
|
| Russell 3000 Growth Index |
|
18.24 |
|
13.17 |
|
18.13 |
|
|
| Performance Inception Date |
May 31, 2017
|
| No Deduction of Taxes [Text Block] |
Also, performance shown in this section does not reflect the deduction of taxes that a shareholder would pay on Fund distributions or on gains resulting from redemptions of Fund shares.
|
| Updated Performance Information Location [Text Block] |
Updated performance information is available by visiting www.jpmorganfunds.com or by calling 1-800-480-4111.
|
| Net Assets |
$ 22,367,408,000
|
| Holdings Count | Holding |
101
|
| Advisory Fees Paid, Amount |
$ 102,247,000
|
| Investment Company Portfolio Turnover |
51.00%
|
| Additional Fund Statistics [Text Block] |
KEY FUND STATISTICS
| Fund net assets (000's) |
$22,367,408 |
|
| Total number of portfolio holdings |
101 |
|
| Portfolio turnover rate |
51 |
% |
| Total advisory fees paid (000's) |
$102,247 |
|
|
| Holdings [Text Block] |
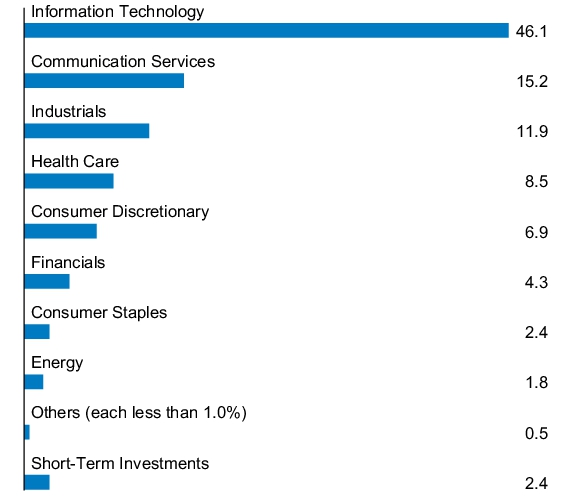
PORTFOLIO COMPOSITION - SECTOR
(% of Total Investments)
|
| C000190884 [Member] |
|
| Shareholder Report [Line Items] |
|
| Fund Name |
JPMorgan Growth Advantage Fund
|
| Class Name |
Class R2 Shares
|
| Trading Symbol |
JGRJX
|
| Annual or Semi-Annual Statement [Text Block] |
This annual shareholder report contains important information about the JPMorgan Growth Advantage Fund (the "Fund") for the period of July 1, 2025 to June 30, 2026.
|
| Shareholder Report Annual or Semi-Annual |
annual shareholder report
|
| Additional Information [Text Block] |
You can find additional information about the Fund at www.jpmorganfunds.com/funddocuments. You can also request this information by contacting us at 1-800-480-4111, by sending an e-mail request to Funds.Website.Support@jpmorganfunds.com or by asking any financial intermediary that offers shares of the Fund.
|
| Additional Information Phone Number |
1-800-480-4111
|
| Additional Information Email |
Funds.Website.Support@jpmorganfunds.com
|
| Additional Information Website |
www.jpmorganfunds.com/funddocuments
|
| Expenses [Text Block] |
What were the Fund costs for the last year? (based on a hypothetical $10,000 investment)
| Fund (Class) |
Costs of a
$10,000 investment |
Costs paid as a percentage
of a $10,000 investment |
JPMorgan Growth Advantage Fund
(Class R2 Shares) |
$134 |
1.25% |
|
| Expenses Paid, Amount |
$ 134
|
| Expense Ratio, Percent |
1.25%
|
| Factors Affecting Performance [Text Block] |
How did the Fund Perform? The Fund's Class R2 Shares returned 13.86% for the twelve months ended June 30, 2026. The Russell 3000 Index (the "Index") returned 22.82% and the Russell 3000 Growth Index returned 18.24% for the twelve months ended June 30, 2026. -
The Fund’s security selection in the technology and consumer discretionary sectors detracted from relative performance. -
The Fund’s underweight allocations to Lam Research and Alphabet detracted from relative performance. -
The Fund’s security selection in the industrials and telecommunications sectors contributed to relative performance. -
The Fund’s underweight allocation to Microsoft and overweight allocation to Teradyne contributed to relative performance.
|
| Performance Past Does Not Indicate Future [Text] |
The performance quoted is past performance and is not a guarantee of future results.
|
| Line Graph [Table Text Block] |
Fund Performance
|
| Average Annual Return [Table Text Block] |
| AVERAGE ANNUAL TOTAL RETURNS |
INCEPTION
DATE |
1 YEAR |
|
5 YEAR |
|
10 YEAR |
|
| JPMorgan Growth Advantage Fund (Class R2 Shares) |
July 31, 2017 |
13.86 |
% |
10.87 |
% |
18.31 |
% |
| Russell 3000 Index |
|
22.82 |
|
12.31 |
|
15.06 |
|
| Russell 3000 Growth Index |
|
18.24 |
|
13.17 |
|
18.13 |
|
|
| Performance Inception Date |
Jul. 31, 2017
|
| No Deduction of Taxes [Text Block] |
Also, performance shown in this section does not reflect the deduction of taxes that a shareholder would pay on Fund distributions or on gains resulting from redemptions of Fund shares.
|
| Updated Performance Information Location [Text Block] |
Updated performance information is available by visiting www.jpmorganfunds.com or by calling 1-800-480-4111.
|
| Net Assets |
$ 22,367,408,000
|
| Holdings Count | Holding |
101
|
| Advisory Fees Paid, Amount |
$ 102,247,000
|
| Investment Company Portfolio Turnover |
51.00%
|
| Additional Fund Statistics [Text Block] |
KEY FUND STATISTICS
| Fund net assets (000's) |
$22,367,408 |
|
| Total number of portfolio holdings |
101 |
|
| Portfolio turnover rate |
51 |
% |
| Total advisory fees paid (000's) |
$102,247 |
|
|
| Holdings [Text Block] |
PORTFOLIO COMPOSITION - SECTOR
(% of Total Investments)
|
| C000033247 [Member] |
|
| Shareholder Report [Line Items] |
|
| Fund Name |
JPMorgan Growth Advantage Fund
|
| Class Name |
Class I Shares
|
| Trading Symbol |
JGASX
|
| Annual or Semi-Annual Statement [Text Block] |
This annual shareholder report contains important information about the JPMorgan Growth Advantage Fund (the "Fund") for the period of July 1, 2025 to June 30, 2026.
|
| Shareholder Report Annual or Semi-Annual |
annual shareholder report
|
| Additional Information [Text Block] |
You can find additional information about the Fund at www.jpmorganfunds.com/funddocuments. You can also request this information by contacting us at 1-800-480-4111, by sending an e-mail request to Funds.Website.Support@jpmorganfunds.com or by asking any financial intermediary that offers shares of the Fund.
|
| Additional Information Phone Number |
1-800-480-4111
|
| Additional Information Email |
Funds.Website.Support@jpmorganfunds.com
|
| Additional Information Website |
www.jpmorganfunds.com/funddocuments
|
| Expenses [Text Block] |
What were the Fund costs for the last year? (based on a hypothetical $10,000 investment)
| Fund (Class) |
Costs of a
$10,000 investment |
Costs paid as a percentage
of a $10,000 investment |
JPMorgan Growth Advantage Fund
(Class I Shares) |
$79 |
0.74% |
|
| Expenses Paid, Amount |
$ 79
|
| Expense Ratio, Percent |
0.74%
|
| Factors Affecting Performance [Text Block] |
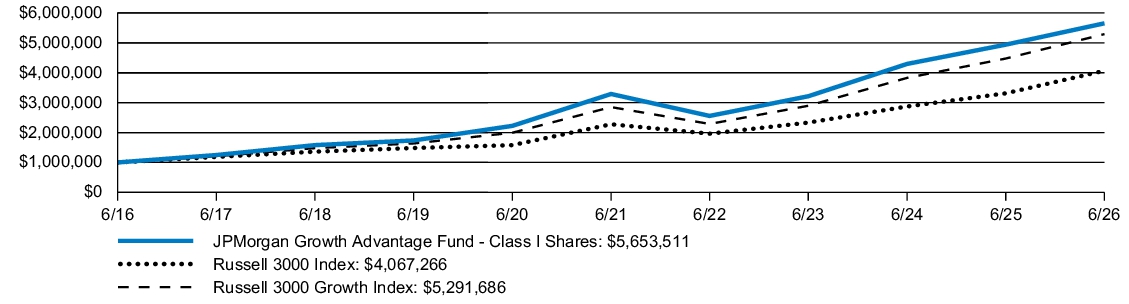
How did the Fund Perform? The Fund's Class I Shares returned 14.45% for the twelve months ended June 30, 2026. The Russell 3000 Index (the "Index") returned 22.82% and the Russell 3000 Growth Index returned 18.24% for the twelve months ended June 30, 2026. -
The Fund’s security selection in the technology and consumer discretionary sectors detracted from relative performance. -
The Fund’s underweight allocations to Lam Research and Alphabet detracted from relative performance. -
The Fund’s security selection in the industrials and telecommunications sectors contributed to relative performance. -
The Fund’s underweight allocation to Microsoft and overweight allocation to Teradyne contributed to relative performance.
|
| Performance Past Does Not Indicate Future [Text] |
The performance quoted is past performance and is not a guarantee of future results.
|
| Line Graph [Table Text Block] |
Fund Performance
|
| Average Annual Return [Table Text Block] |
| AVERAGE ANNUAL TOTAL RETURNS |
INCEPTION
DATE |
1 YEAR |
|
5 YEAR |
|
10 YEAR |
|
| JPMorgan Growth Advantage Fund (Class I Shares) |
May 1, 2006 |
14.45 |
% |
11.44 |
% |
18.91 |
% |
| Russell 3000 Index |
|
22.82 |
|
12.31 |
|
15.06 |
|
| Russell 3000 Growth Index |
|
18.24 |
|
13.17 |
|
18.13 |
|
|
| Performance Inception Date |
May 01, 2006
|
| No Deduction of Taxes [Text Block] |
Also, performance shown in this section does not reflect the deduction of taxes that a shareholder would pay on Fund distributions or on gains resulting from redemptions of Fund shares.
|
| Updated Performance Information Location [Text Block] |
Updated performance information is available by visiting www.jpmorganfunds.com or by calling 1-800-480-4111.
|
| Net Assets |
$ 22,367,408,000
|
| Holdings Count | Holding |
101
|
| Advisory Fees Paid, Amount |
$ 102,247,000
|
| Investment Company Portfolio Turnover |
51.00%
|
| Additional Fund Statistics [Text Block] |
KEY FUND STATISTICS
| Fund net assets (000's) |
$22,367,408 |
|
| Total number of portfolio holdings |
101 |
|
| Portfolio turnover rate |
51 |
% |
| Total advisory fees paid (000's) |
$102,247 |
|
|
| Holdings [Text Block] |
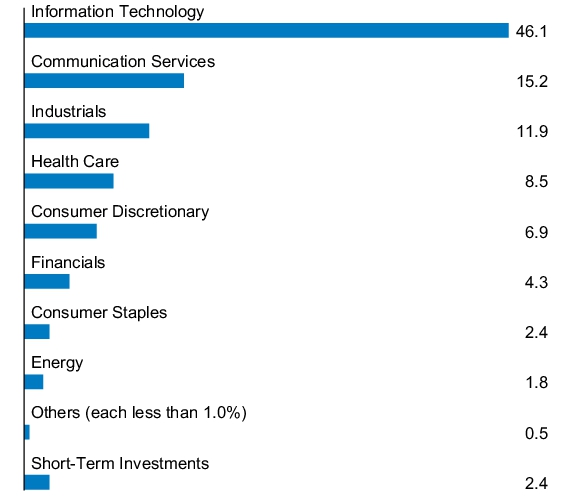
PORTFOLIO COMPOSITION - SECTOR
(% of Total Investments)
|
| C000034442 [Member] |
|
| Shareholder Report [Line Items] |
|
| Fund Name |
JPMorgan Growth Advantage Fund
|
| Class Name |
Class C Shares
|
| Trading Symbol |
JGACX
|
| Annual or Semi-Annual Statement [Text Block] |
This annual shareholder report contains important information about the JPMorgan Growth Advantage Fund (the "Fund") for the period of July 1, 2025 to June 30, 2026.
|
| Shareholder Report Annual or Semi-Annual |
annual shareholder report
|
| Additional Information [Text Block] |
You can find additional information about the Fund at www.jpmorganfunds.com/funddocuments. You can also request this information by contacting us at 1-800-480-4111, by sending an e-mail request to Funds.Website.Support@jpmorganfunds.com or by asking any financial intermediary that offers shares of the Fund.
|
| Additional Information Phone Number |
1-800-480-4111
|
| Additional Information Email |
Funds.Website.Support@jpmorganfunds.com
|
| Additional Information Website |
www.jpmorganfunds.com/funddocuments
|
| Expenses [Text Block] |
What were the Fund costs for the last year? (based on a hypothetical $10,000 investment)
| Fund (Class) |
Costs of a
$10,000 investment |
Costs paid as a percentage
of a $10,000 investment |
JPMorgan Growth Advantage Fund
(Class C Shares) |
$159 |
1.49% |
|
| Expenses Paid, Amount |
$ 159
|
| Expense Ratio, Percent |
1.49%
|
| Factors Affecting Performance [Text Block] |
How did the Fund Perform? The Fund's Class C Shares, without a sales charge, returned 13.57% for the twelve months ended June 30, 2026. The Russell 3000 Index (the "Index") returned 22.82% and the Russell 3000 Growth Index returned 18.24% for the twelve months ended June 30, 2026. -
The Fund’s security selection in the technology and consumer discretionary sectors detracted from relative performance. -
The Fund’s underweight allocations to Lam Research and Alphabet detracted from relative performance. -
The Fund’s security selection in the industrials and telecommunications sectors contributed to relative performance. -
The Fund’s underweight allocation to Microsoft and overweight allocation to Teradyne contributed to relative performance.
|
| Performance Past Does Not Indicate Future [Text] |
The performance quoted is past performance and is not a guarantee of future results.
|
| Line Graph [Table Text Block] |
Fund Performance
|
| Average Annual Return [Table Text Block] |
| AVERAGE ANNUAL TOTAL RETURNS |
INCEPTION
DATE |
1 YEAR |
|
5 YEAR |
|
10 YEAR |
|
| JPMorgan Growth Advantage Fund (Class C Shares) |
May 1, 2006 |
12.57 |
% |
10.61 |
% |
18.14 |
% |
| JPMorgan Growth Advantage Fund (Class C Shares) - excluding sales charge |
|
13.57 |
|
10.61 |
|
18.14 |
|
| Russell 3000 Index |
|
22.82 |
|
12.31 |
|
15.06 |
|
| Russell 3000 Growth Index |
|
18.24 |
|
13.17 |
|
18.13 |
|
|
| Performance Inception Date |
May 01, 2006
|
| No Deduction of Taxes [Text Block] |
Also, performance shown in this section does not reflect the deduction of taxes that a shareholder would pay on Fund distributions or on gains resulting from redemptions of Fund shares.
|
| Updated Performance Information Location [Text Block] |
Updated performance information is available by visiting www.jpmorganfunds.com or by calling 1-800-480-4111.
|
| Net Assets |
$ 22,367,408,000
|
| Holdings Count | Holding |
101
|
| Advisory Fees Paid, Amount |
$ 102,247,000
|
| Investment Company Portfolio Turnover |
51.00%
|
| Additional Fund Statistics [Text Block] |
KEY FUND STATISTICS
| Fund net assets (000's) |
$22,367,408 |
|
| Total number of portfolio holdings |
101 |
|
| Portfolio turnover rate |
51 |
% |
| Total advisory fees paid (000's) |
$102,247 |
|
|
| Holdings [Text Block] |
PORTFOLIO COMPOSITION - SECTOR
(% of Total Investments)
|
| C000012318 [Member] |
|
| Shareholder Report [Line Items] |
|
| Fund Name |
JPMorgan Growth Advantage Fund
|
| Class Name |
Class A Shares
|
| Trading Symbol |
VHIAX
|
| Annual or Semi-Annual Statement [Text Block] |
This annual shareholder report contains important information about the JPMorgan Growth Advantage Fund (the "Fund") for the period of July 1, 2025 to June 30, 2026.
|
| Shareholder Report Annual or Semi-Annual |
annual shareholder report
|
| Additional Information [Text Block] |
You can find additional information about the Fund at www.jpmorganfunds.com/funddocuments. You can also request this information by contacting us at 1-800-480-4111, by sending an e-mail request to Funds.Website.Support@jpmorganfunds.com or by asking any financial intermediary that offers shares of the Fund.
|
| Additional Information Phone Number |
1-800-480-4111
|
| Additional Information Email |
Funds.Website.Support@jpmorganfunds.com
|
| Additional Information Website |
www.jpmorganfunds.com/funddocuments
|
| Expenses [Text Block] |
What were the Fund costs for the last year? (based on a hypothetical $10,000 investment)
| Fund (Class) |
Costs of a
$10,000 investment |
Costs paid as a percentage
of a $10,000 investment |
JPMorgan Growth Advantage Fund
(Class A Shares) |
$106 |
0.99% |
|
| Expenses Paid, Amount |
$ 106
|
| Expense Ratio, Percent |
0.99%
|
| Factors Affecting Performance [Text Block] |
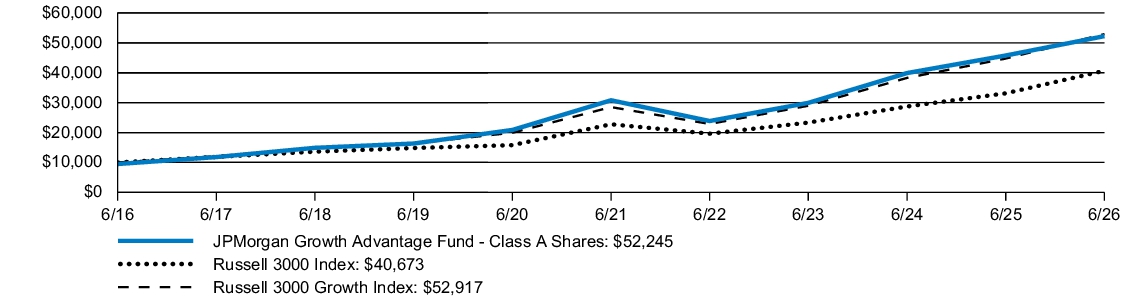
How did the Fund Perform? The Fund's Class A Shares, without a sales charge, returned 14.15% for the twelve months ended June 30, 2026. The Russell 3000 Index (the "Index") returned 22.82% and the Russell 3000 Growth Index returned 18.24% for the twelve months ended June 30, 2026. -
The Fund’s security selection in the technology and consumer discretionary sectors detracted from relative performance. -
The Fund’s underweight allocations to Lam Research and Alphabet detracted from relative performance. -
The Fund’s security selection in the industrials and telecommunications sectors contributed to relative performance. -
The Fund’s underweight allocation to Microsoft and overweight allocation to Teradyne contributed to relative performance.
|
| Performance Past Does Not Indicate Future [Text] |
The performance quoted is past performance and is not a guarantee of future results.
|
| Line Graph [Table Text Block] |
Fund Performance
|
| Average Annual Return [Table Text Block] |
| AVERAGE ANNUAL TOTAL RETURNS |
INCEPTION
DATE |
1 YEAR |
|
5 YEAR |
|
10 YEAR |
|
| JPMorgan Growth Advantage Fund (Class A Shares) |
October 29, 1999 |
8.17 |
% |
9.96 |
% |
17.98 |
% |
| JPMorgan Growth Advantage Fund (Class A Shares) - excluding sales charge |
|
14.15 |
|
11.16 |
|
18.62 |
|
| Russell 3000 Index |
|
22.82 |
|
12.31 |
|
15.06 |
|
| Russell 3000 Growth Index |
|
18.24 |
|
13.17 |
|
18.13 |
|
|
| Performance Inception Date |
Oct. 29, 1999
|
| No Deduction of Taxes [Text Block] |
Also, performance shown in this section does not reflect the deduction of taxes that a shareholder would pay on Fund distributions or on gains resulting from redemptions of Fund shares.
|
| Updated Performance Information Location [Text Block] |
Updated performance information is available by visiting www.jpmorganfunds.com or by calling 1-800-480-4111.
|
| Net Assets |
$ 22,367,408,000
|
| Holdings Count | Holding |
101
|
| Advisory Fees Paid, Amount |
$ 102,247,000
|
| Investment Company Portfolio Turnover |
51.00%
|
| Additional Fund Statistics [Text Block] |
KEY FUND STATISTICS
| Fund net assets (000's) |
$22,367,408 |
|
| Total number of portfolio holdings |
101 |
|
| Portfolio turnover rate |
51 |
% |
| Total advisory fees paid (000's) |
$102,247 |
|
|
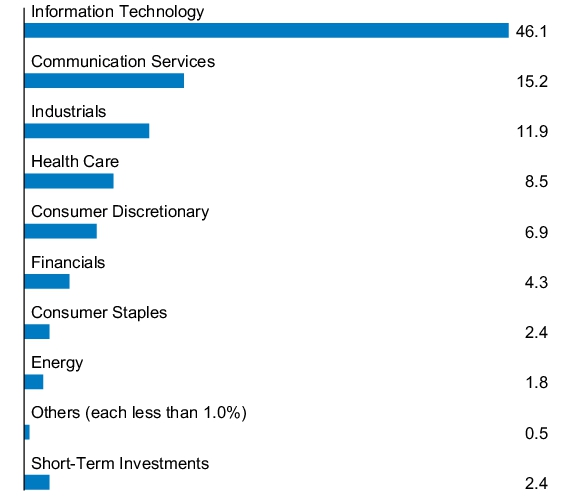
| Holdings [Text Block] |
PORTFOLIO COMPOSITION - SECTOR
(% of Total Investments)
|