Shareholder Report
Jun. 30, 2026
USD ($)
Holding
Fund Expenses
(Based on a hypothetical $10,000 investment)
| Fund (Class) | Costs of a $10,000 investment | Costs paid as a percentage of a $10,000 investment |
| AAM/Insight Select Income Fund (Class I/CPUIX) |
$60 | 0.59% |
Management's Discussion of Fund Performance
SUMMARY OF RESULTS
The following discussion compares the performance of the Fund to the Bloomberg US Credit Index to show how the Fund’s performance compares to the returns of similar investments for the reporting period. The fund seeks to provide current income and outperformed the stated benchmark by investing primarily in US investment grade corporate bonds, high yield corporate bonds, taxable municipals, US dollar denominated sovereign and foreign agency bonds, Asset-backed securities, and other forms of investment grade structured credit.
TOP PERFORMANCE CONTRIBUTORS
- Sector allocation contributed positively with overweight to high yield and emerging markets corporates and underweight to US IG industrials contributing positively.
- Security selection contributed strongly to overall Fund performance as spreads compressed and subordinated bonds and hybrid structures outperformed. Selection was strongly positive particularly within IG financials and industrials. Corp Andina de Fomento, Bank of Nova Scotia, Avianca and Venture Global all contributed positively while Braskem, Eldorado and Argentina overweight and Panama underweight detracted somewhat from performance.
TOP PERFORMANCE DETRACTORS
- Duration and yield curve impacts were negative over the year as the portfolio periodically positioned overweight in the 5 yr part of the curve on the expectation of Fed cuts while the market priced in hikes based upon the tariffs and rising oil prices from the Iranian conflict. The treasury curve flattened as well with the long end rising 18bps while the 5yr rose 43.
Fund Performance
The following graph and chart compare the initial and subsequent account values at the end of each of the most recently completed 10 fiscal years of the Fund, or for the life of the Fund, if shorter. It assumes a $25,000 initial investment at the beginning of the first fiscal year in an appropriate, broad-based securities market index for the same period.
GROWTH OF $25,000
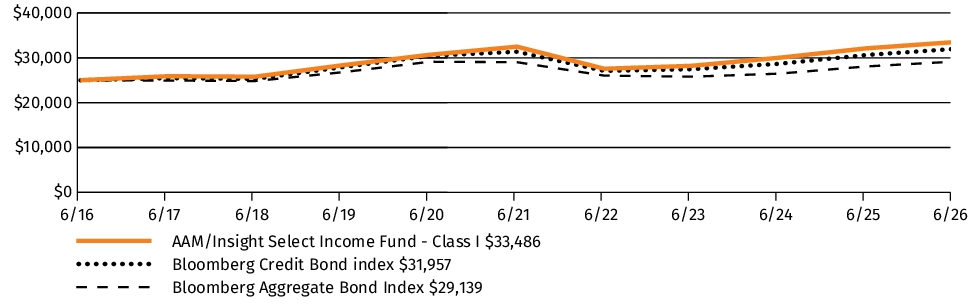
| AVERAGE ANNUAL TOTAL RETURN | 1 Year | 5 Years | 10 Years |
| AAM/Insight Select Income Fund (Class I/CPUIX) | 4.29% | 0.61% | 2.97% |
| Bloomberg Credit Bond Index | 4.34% | 0.38% | 2.49% |
| Bloomberg Aggregate Bond Index | 3.79% | 0.08% | 1.54% |
The graph and table do not reflect the deduction of taxes that a shareholder would pay on Fund distributions or redemption of Fund shares.
Visit https://www.aamlive.com/publicsite/mutual-funds-performance-selectincome for the most recent performance information.
Key Fund Statistics
The following table outlines key fund statistics that you should pay attention to.
| Fund net assets | $222,132,616 |
| Total number of portfolio holdings | 491 |
| Total advisory fees paid (net) | $481,925 |
| Portfolio turnover rate as of the end of the reporting period | 46% |
Graphical Representation of Holdings
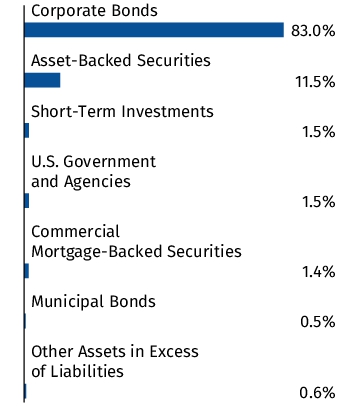
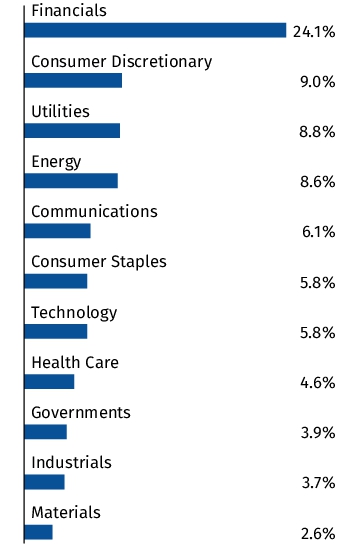
The tables below show the investment makeup of the Fund, representing percentage of the total net assets of the Fund. The Top Ten Holdings and Sector Allocation exclude short-term holdings, if any. Interest rate presented in the Top Ten Holdings are as of the reporting period end. The Sector Allocation chart represents Corporate Bonds held by the Fund.
Top Ten Holdings
| United States Treasury Bond, 4.62%, 2/15/2046 | 1.0% |
| NVIDIA Corp., 5.55%, 6/15/2046 | 1.0% |
| Bank of America Corp., 2.97%, 2/4/2033 | 0.8% |
| Mexico Government International Bond, 6.87%, 5/13/2037 | 0.7% |
| Morgan Stanley, 6.63%, 11/1/2034 | 0.7% |
| Goldman Sachs Group, Inc., 1.99%, 1/27/2032 | 0.6% |
| MetLife, Inc., 9.25%, 4/8/2038 | 0.6% |
| General Motors Co., 5.63%, 4/15/2030 | 0.6% |
| Bank of America Corp., 5.49%, 4/23/2037 | 0.6% |
| Bank of Nova Scotia, 7.35%, 4/27/2085 | 0.6% |
Asset Allocation
Sector Allocation
Top Ten Holdings
| United States Treasury Bond, 4.62%, 2/15/2046 | 1.0% |
| NVIDIA Corp., 5.55%, 6/15/2046 | 1.0% |
| Bank of America Corp., 2.97%, 2/4/2033 | 0.8% |
| Mexico Government International Bond, 6.87%, 5/13/2037 | 0.7% |
| Morgan Stanley, 6.63%, 11/1/2034 | 0.7% |
| Goldman Sachs Group, Inc., 1.99%, 1/27/2032 | 0.6% |
| MetLife, Inc., 9.25%, 4/8/2038 | 0.6% |
| General Motors Co., 5.63%, 4/15/2030 | 0.6% |
| Bank of America Corp., 5.49%, 4/23/2037 | 0.6% |
| Bank of Nova Scotia, 7.35%, 4/27/2085 | 0.6% |
Material Fund Changes
The Fund did not have any material changes that occurred since the beginning of the reporting period.
Changes in and Disagreements with Accountants
There were no changes in or disagreements with the Fund's accountants during the reporting period.
Fund Expenses
(Based on a hypothetical $10,000 investment)
| Fund (Class) | Costs of a $10,000 investment | Costs paid as a percentage of a $10,000 investment |
| AAM/Insight Select Income Fund (Class C/CPUCX) |
$163 | 1.60% |
Management's Discussion of Fund Performance
SUMMARY OF RESULTS
The following discussion compares the performance of the Fund to the Bloomberg US Credit Index to show how the Fund’s performance compares to the returns of similar investments for the reporting period. The fund seeks to provide current income and outperformed the stated benchmark by investing primarily in US investment grade corporate bonds, high yield corporate bonds, taxable municipals, US dollar denominated sovereign and foreign agency bonds, Asset-backed securities, and other forms of investment grade structured credit.
TOP PERFORMANCE CONTRIBUTORS
- Sector allocation contributed positively with overweight to high yield and emerging markets corporates and underweight to US IG industrials contributing positively.
- Security selection contributed strongly to overall Fund performance as spreads compressed and subordinated bonds and hybrid structures outperformed. Selection was strongly positive particularly within IG financials and industrials. Corp Andina de Fomento, Bank of Nova Scotia, Avianca and Venture Global all contributed positively while Braskem, Eldorado and Argentina overweight and Panama underweight detracted somewhat from performance.
TOP PERFORMANCE DETRACTORS
- Duration and yield curve impacts were negative over the year as the portfolio periodically positioned overweight in the 5 yr part of the curve on the expectation of Fed cuts while the market priced in hikes based upon the tariffs and rising oil prices from the Iranian conflict. The treasury curve flattened as well with the long end rising 18bps while the 5yr rose 43.
Fund Performance
The following graph and chart compare the initial and subsequent account values at the end of each of the most recently completed 10 fiscal years of the Fund, or for the life of the Fund, if shorter. It assumes a $10,000 initial investment at the beginning of the first fiscal year in an appropriate, broad-based securities market index for the same period.
GROWTH OF $10,000
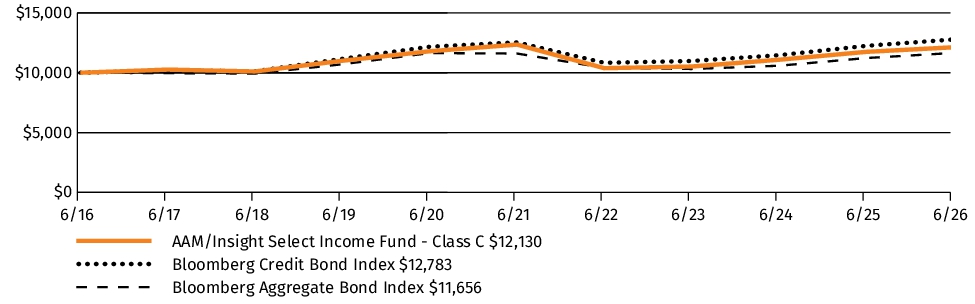
| AVERAGE ANNUAL TOTAL RETURN | 1 Year | 5 Years | 10 Years |
| AAM/Insight Select Income Fund (Class C/CPUCX)1 | 2.26% | -0.37% | 1.95% |
| AAM/Insight Select Income Fund (Class C/CPUCX) — excluding sales load | 3.25% | -0.37% | 1.95% |
| Bloomberg Credit Bond Index | 4.34% | 0.38% | 2.49% |
| Bloomberg Aggregate Bond Index | 3.79% | 0.08% | 1.54% |
|
1
|
A Contingent Deferred Sales Charge ("CDSC") of 1.00% may be imposed on certain purchases that are redeemed in whole or in part within 12 months of purchase.
|
* SEC rules require that a broad-based securities market index be provided to compare the performance in annual shareholder reports and prospectuses. The fund also continues to compare its performance to the Bloomberg Credit Bond Index. There is no change in the fund’s investment strategies as a result of the SEC rule.
The graph and table do not reflect the deduction of taxes that a shareholder would pay on Fund distributions or redemption of Fund shares.
Visit https://www.aamlive.com/publicsite/mutual-funds-performance-selectincome for the most recent performance information.
Key Fund Statistics
The following table outlines key fund statistics that you should pay attention to.
| Fund net assets | $222,132,616 |
| Total number of portfolio holdings | 491 |
| Total advisory fees paid (net) | $481,925 |
| Portfolio turnover rate as of the end of the reporting period | 46% |
Graphical Representation of Holdings
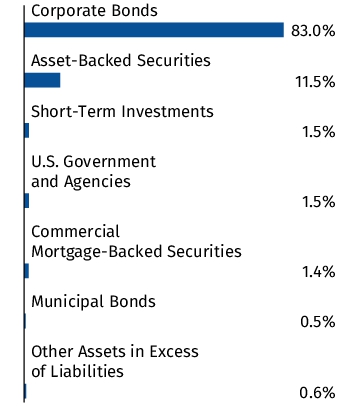
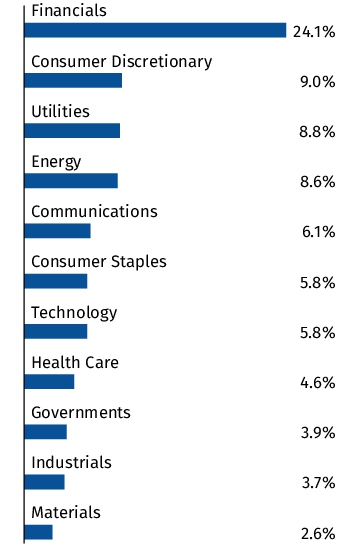
The tables below show the investment makeup of the Fund, representing percentage of the total net assets of the Fund. The Top Ten Holdings and Sector Allocation exclude short-term holdings, if any. Interest rate presented in the Top Ten Holdings are as of the reporting period end. The Sector Allocation chart represents Corporate Bonds held by the Fund.
Top Ten Holdings
| United States Treasury Bond, 4.62%, 2/15/2046 | 1.0% |
| NVIDIA Corp., 5.55%, 6/15/2046 | 1.0% |
| Bank of America Corp., 2.97%, 2/4/2033 | 0.8% |
| Mexico Government International Bond, 6.87%, 5/13/2037 | 0.7% |
| Morgan Stanley, 6.63%, 11/1/2034 | 0.7% |
| Goldman Sachs Group, Inc., 1.99%, 1/27/2032 | 0.6% |
| MetLife, Inc., 9.25%, 4/8/2038 | 0.6% |
| General Motors Co., 5.63%, 4/15/2030 | 0.6% |
| Bank of America Corp., 5.49%, 4/23/2037 | 0.6% |
| Bank of Nova Scotia, 7.35%, 4/27/2085 | 0.6% |
Asset Allocation
Sector Allocation
Top Ten Holdings
| United States Treasury Bond, 4.62%, 2/15/2046 | 1.0% |
| NVIDIA Corp., 5.55%, 6/15/2046 | 1.0% |
| Bank of America Corp., 2.97%, 2/4/2033 | 0.8% |
| Mexico Government International Bond, 6.87%, 5/13/2037 | 0.7% |
| Morgan Stanley, 6.63%, 11/1/2034 | 0.7% |
| Goldman Sachs Group, Inc., 1.99%, 1/27/2032 | 0.6% |
| MetLife, Inc., 9.25%, 4/8/2038 | 0.6% |
| General Motors Co., 5.63%, 4/15/2030 | 0.6% |
| Bank of America Corp., 5.49%, 4/23/2037 | 0.6% |
| Bank of Nova Scotia, 7.35%, 4/27/2085 | 0.6% |
Material Fund Changes
The Fund did not have any material changes that occurred since the beginning of the reporting period.
Changes in and Disagreements with Accountants
There were no changes in or disagreements with the Fund's accountants during the reporting period.
Fund Expenses
(Based on a hypothetical $10,000 investment)
| Fund (Class) | Costs of a $10,000 investment | Costs paid as a percentage of a $10,000 investment |
| AAM/Insight Select Income Fund (Class A/CPUAX) |
$87 | 0.85% |
Management's Discussion of Fund Performance
SUMMARY OF RESULTS
The following discussion compares the performance of the Fund to the Bloomberg US Credit Index to show how the Fund’s performance compares to the returns of similar investments for the reporting period. The fund seeks to provide current income and outperformed the stated benchmark by investing primarily in US investment grade corporate bonds, high yield corporate bonds, taxable municipals, US dollar denominated sovereign and foreign agency bonds, Asset-backed securities, and other forms of investment grade structured credit.
TOP PERFORMANCE CONTRIBUTORS
- Sector allocation contributed positively with overweight to high yield and emerging markets corporates and underweight to US IG industrials contributing positively.
- Security selection contributed strongly to overall Fund performance as spreads compressed and subordinated bonds and hybrid structures outperformed. Selection was strongly positive particularly within IG financials and industrials. Corp Andina de Fomento, Bank of Nova Scotia, Avianca and Venture Global all contributed positively while Braskem, Eldorado and Argentina overweight and Panama underweight detracted somewhat from performance.
TOP PERFORMANCE DETRACTORS
- Duration and yield curve impacts were negative over the year as the portfolio periodically positioned overweight in the 5 yr part of the curve on the expectation of Fed cuts while the market priced in hikes based upon the tariffs and rising oil prices from the Iranian conflict. The treasury curve flattened as well with the long end rising 18bps while the 5yr rose 43.
Fund Performance
The following graph and chart compare the initial and subsequent account values at the end of each of the most recently completed 10 fiscal years of the Fund, or for the life of the Fund, if shorter. It assumes a $10,000 initial investment at the beginning of the first fiscal year in an appropriate, broad-based securities market index for the same period.
GROWTH OF $10,000
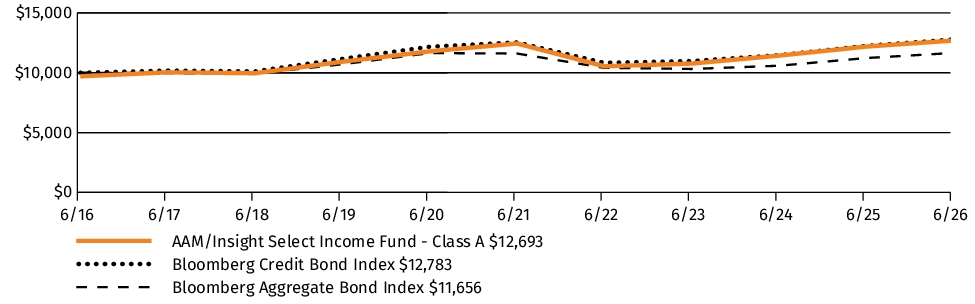
| AVERAGE ANNUAL TOTAL RETURN | 1 Year | 5 Years | 10 Years |
| AAM/Insight Select Income Fund (Class A/CPUAX)1 | 0.98% | -0.21% | 2.41% |
| AAM/Insight Select Income Fund (Class A/CPUAX) — excluding sales load | 4.13% | 0.40% | 2.72% |
| Bloomberg Credit Bond Index | 4.34% | 0.38% | 2.49% |
| Bloomberg Aggregate Bond Index | 3.79% | 0.08% | 1.54% |
|
1
|
Maximum sales charge (load) of 3.00% of offering price.
|
* SEC rules require that a broad-based securities market index be provided to compare the performance in annual shareholder reports and prospectuses. The fund also continues to compare its performance to the Bloomberg Credit Bond Index. There is no change in the fund’s investment strategies as a result of the SEC rule.
The graph and table do not reflect the deduction of taxes that a shareholder would pay on Fund distributions or redemption of Fund shares.
Visit https://www.aamlive.com/publicsite/mutual-funds-performance-selectincome for the most recent performance information.
Key Fund Statistics
The following table outlines key fund statistics that you should pay attention to.
| Fund net assets | $222,132,616 |
| Total number of portfolio holdings | 491 |
| Total advisory fees paid (net) | $481,925 |
| Portfolio turnover rate as of the end of the reporting period | 46% |
Graphical Representation of Holdings
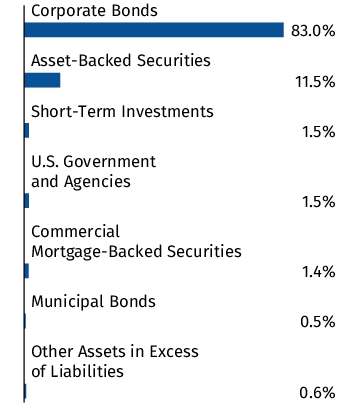
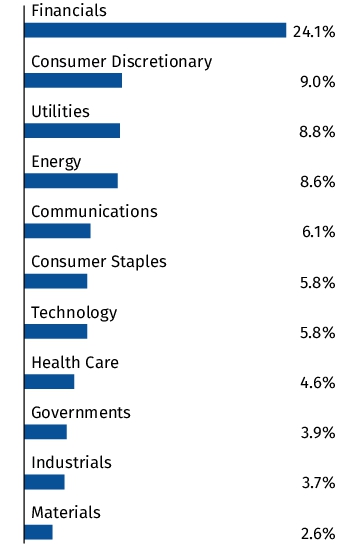
The tables below show the investment makeup of the Fund, representing percentage of the total net assets of the Fund. The Top Ten Holdings and Sector Allocation exclude short-term holdings, if any. Interest rate presented in the Top Ten Holdings are as of the reporting period end. The Sector Allocation chart represents Corporate Bonds held by the Fund.
Top Ten Holdings
| United States Treasury Bond, 4.62%, 2/15/2046 | 1.0% |
| NVIDIA Corp., 5.55%, 6/15/2046 | 1.0% |
| Bank of America Corp., 2.97%, 2/4/2033 | 0.8% |
| Mexico Government International Bond, 6.87%, 5/13/2037 | 0.7% |
| Morgan Stanley, 6.63%, 11/1/2034 | 0.7% |
| Goldman Sachs Group, Inc., 1.99%, 1/27/2032 | 0.6% |
| MetLife, Inc., 9.25%, 4/8/2038 | 0.6% |
| General Motors Co., 5.63%, 4/15/2030 | 0.6% |
| Bank of America Corp., 5.49%, 4/23/2037 | 0.6% |
| Bank of Nova Scotia, 7.35%, 4/27/2085 | 0.6% |
Asset Allocation
Sector Allocation
Top Ten Holdings
| United States Treasury Bond, 4.62%, 2/15/2046 | 1.0% |
| NVIDIA Corp., 5.55%, 6/15/2046 | 1.0% |
| Bank of America Corp., 2.97%, 2/4/2033 | 0.8% |
| Mexico Government International Bond, 6.87%, 5/13/2037 | 0.7% |
| Morgan Stanley, 6.63%, 11/1/2034 | 0.7% |
| Goldman Sachs Group, Inc., 1.99%, 1/27/2032 | 0.6% |
| MetLife, Inc., 9.25%, 4/8/2038 | 0.6% |
| General Motors Co., 5.63%, 4/15/2030 | 0.6% |
| Bank of America Corp., 5.49%, 4/23/2037 | 0.6% |
| Bank of Nova Scotia, 7.35%, 4/27/2085 | 0.6% |
Material Fund Changes
The Fund did not have any material changes that occurred since the beginning of the reporting period.
Changes in and Disagreements with Accountants
There were no changes in or disagreements with the Fund's accountants during the reporting period.
Fund Expenses
(Based on a hypothetical $10,000 investment)
| Fund (Class) | Costs of a $10,000 investment | Costs paid as a percentage of a $10,000 investment |
| AAM/HIMCO Short Duration Fund (Class A/ASDAX) |
$85 | 0.84% |
Management's Discussion of Fund Performance
SUMMARY OF RESULTS
For the 12-month period ending June 30, 2026, the AAM/HIMCO Short Duration Fund Class A produced positive performance of 3.49%, before applicable sales charges. The Bloomberg 1-3 year U.S. Government/Credit Index (“Index”) returned 3.14% over the same period. The Fund was primarily invested in U.S. Treasuries, investment grade corporates, high yield corporates, bank loans, securitized sectors and cash. The securitized sectors included asset-backed securities (ABS), commercial mortgage-backed securities (CMBS) and collateralized loan obligations (CLOs).
TOP PERFORMANCE CONTRIBUTORS
- Sector allocation was the primary source of positive performance, particularly the out-of-benchmark allocations to ABS, CMBS, bank loans, CLOs and high yield corporates due to spread tightening and the positive carry
- The underweight to U.S. Treasuries was also of benefit
- Security selection within the Industrial and financial sub-sectors of investment grade corporates was a positive contributor
- A shorter interest rate duration position relative to the Index was a contributor given the increase in interest rates over the course of the 12-month period
TOP PERFORMANCE DETRACTORS
- The portfolio’s cash position was a drag on performance given the relative outperformance of the spread sectors
- The Fund did not have any direct holdings in the emerging market sector which detracted from the positive performance relative to the Index
Fund Performance
The following graph and chart compare the initial and subsequent account values at the end of each of the most recently completed 10 fiscal years of the Fund, or for the life of the Fund, if shorter. It assumes a $10,000 initial investment at the beginning of the first fiscal year in an appropriate, broad-based securities market index for the same period.
GROWTH OF $10,000
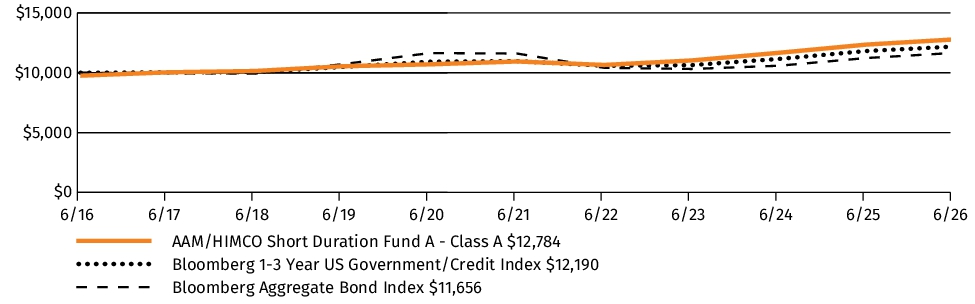
| AVERAGE ANNUAL TOTAL RETURN | 1 Year | 5 Years | 10 Years |
| AAM/HIMCO Short Duration Fund (Class A/ASDAX)1 | 0.90% | 2.64% | 2.49% |
| AAM/HIMCO Short Duration Fund (Class A/ASDAX) — excluding sales load | 3.49% | 3.16% | 2.74% |
| Bloomberg 1-3 Year US Government/Credit Index | 3.14% | 2.12% | 2.00% |
| Bloomberg Aggregate Bond Index* | 3.79% | 0.08% | 1.54% |
|
1
|
Maximum sales charge (load) of 2.50% of offering price.
|
* SEC rules require that a broad-based securities market index be provided to compare the performance in annual shareholder reports and prospectuses. The fund also continues to compare its performance to the Bloomberg 1-3 Year US Government/Credit Index. There is no change in the fund’s investment strategies as a result of the SEC rule.
The graph and table do not reflect the deduction of taxes that a shareholder would pay on Fund distributions or redemption of Fund shares.
Visit https://www.aamlive.com/publicsite/mutual-funds-performance-himco for the most recent performance information.
Key Fund Statistics
The following table outlines key fund statistics that you should pay attention to.
| Fund net assets | $430,862,985 |
| Total number of portfolio holdings | 308 |
| Total advisory fees paid (net) | $1,157,688 |
| Portfolio turnover rate as of the end of the reporting period | 30% |
Graphical Representation of Holdings
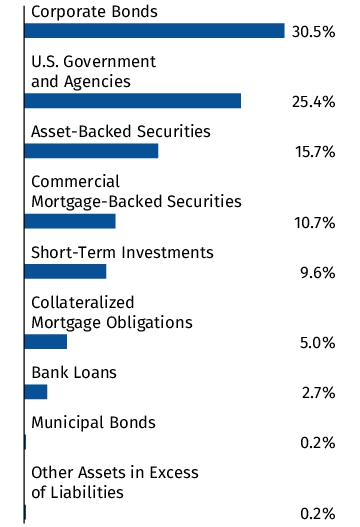
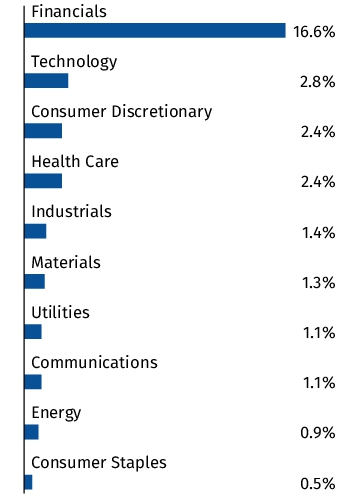
The tables below show the investment makeup of the Fund, representing percentage of the total net assets of the Fund. The Top Ten Holdings and Sector Allocation exclude short-term holdings, if any. Interest rate presented in the Top Ten Holdings are as of the reporting period end. The Sector Allocation chart represents Corporate Bonds held by the Fund.
Top Ten Holdings
| United States Treasury Note, 4.37%, 11/30/2028 | 2.4% |
| United States Treasury Note, 4.25%, 2/28/2029 | 2.3% |
| United States Treasury Note, 4.62%, 9/15/2026 | 2.3% |
| United States Treasury Note, 4.25%, 3/15/2027 | 2.3% |
| United States Treasury Note, 4.13%, 9/30/2027 | 2.3% |
| United States Treasury Note, 4.00%, 2/29/2028 | 2.3% |
| United States Treasury Note, 4.00%, 1/31/2029 | 2.3% |
| United States Treasury Note, 4.00%, 7/31/2029 | 2.3% |
| United States Treasury Note, 3.88%, 11/30/2029 | 2.3% |
| United States Treasury Note, 3.50%, 9/30/2029 | 2.3% |
Asset Allocation
Sector Allocation
Top Ten Holdings
| United States Treasury Note, 4.37%, 11/30/2028 | 2.4% |
| United States Treasury Note, 4.25%, 2/28/2029 | 2.3% |
| United States Treasury Note, 4.62%, 9/15/2026 | 2.3% |
| United States Treasury Note, 4.25%, 3/15/2027 | 2.3% |
| United States Treasury Note, 4.13%, 9/30/2027 | 2.3% |
| United States Treasury Note, 4.00%, 2/29/2028 | 2.3% |
| United States Treasury Note, 4.00%, 1/31/2029 | 2.3% |
| United States Treasury Note, 4.00%, 7/31/2029 | 2.3% |
| United States Treasury Note, 3.88%, 11/30/2029 | 2.3% |
| United States Treasury Note, 3.50%, 9/30/2029 | 2.3% |
Material Fund Changes
The Fund did not have any material changes that occurred since the beginning of the reporting period.
Changes in and Disagreements with Accountants
There were no changes in or disagreements with the Fund's accountants during the reporting period.
Fund Expenses
(Based on a hypothetical $10,000 investment)
| Fund (Class) | Costs of a $10,000 investment | Costs paid as a percentage of a $10,000 investment |
| AAM/HIMCO Short Duration Fund (Class C/ASDCX) |
$161 | 1.59% |
Management's Discussion of Fund Performance
SUMMARY OF RESULTS
For the 12-month period ending June 30, 2026, the AAM/HIMCO Short Duration Fund Class C produced positive performance of 2.78%, before applicable sales charges. The Bloomberg 1-3 Year U.S. Government/Credit Index (“Index”) returned 3.14% over the same period. The Fund was primarily invested in U.S. Treasuries, investment grade corporates, high yield corporates, bank loans, securitized sectors and cash. The securitized sectors included asset-backed securities (ABS), commercial mortgage-backed securities (CMBS) and collateralized loan obligations (CLOs).
TOP PERFORMANCE CONTRIBUTORS
- Sector allocation was the primary source of positive performance, particularly the out-of-benchmark allocations to ABS, CMBS, bank loans, CLOs and high yield corporates due to spread tightening and the positive carry
- The underweight to U.S. Treasuries was also of benefit
- Security selection within the Industrial and financial sub-sectors of investment grade corporates was a positive contributor
- A shorter interest rate duration position relative to the Index was a contributor given the increase in interest rates over the course of the 12-month period
TOP PERFORMANCE DETRACTORS
- The portfolio’s cash position was a drag on performance given the relative outperformance of the spread sectors
- The Fund did not have any direct holdings in the emerging market sector which detracted from the positive performance relative to the Index
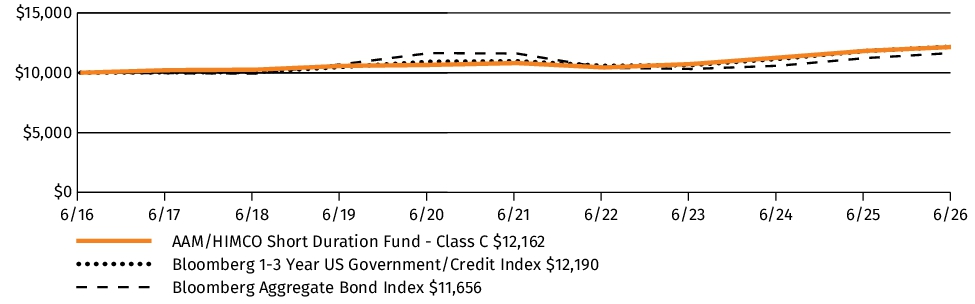
Fund Performance
The following graph and chart compare the initial and subsequent account values at the end of each of the most recently completed 10 fiscal years of the Fund, or for the life of the Fund, if shorter. It assumes a $10,000 initial investment at the beginning of the first fiscal year in an appropriate, broad-based securities market index for the same period.
GROWTH OF $10,000
| AVERAGE ANNUAL TOTAL RETURN | 1 Year | 5 Years | 10 Years |
| AAM/HIMCO Short Duration Fund (Class C/ASDCX)1 | 1.78% | 2.38% | 1.98% |
| AAM/HIMCO Short Duration Fund (Class C/ASDCX) — excluding sales load | 2.78% | 2.38% | 1.98% |
| Bloomberg 1-3 Year US Government/Credit Index | 3.14% | 2.12% | 2.00% |
| Bloomberg Aggregate Bond Index* | 3.79% | 0.08% | 1.54% |
|
1
|
A Contingent Deferred Sales Charge ("CDSC") of 1.00% may be imposed on certain purchases that are redeemed in whole or in part within 12 months of purchase.
|
* SEC rules require that a broad-based securities market index be provided to compare the performance in annual shareholder reports and prospectuses. The fund also continues to compare its performance to the Bloomberg 1-3 Year US Government/Credit Index. There is no change in the fund’s investment strategies as a result of the SEC rule.
The graph and table do not reflect the deduction of taxes that a shareholder would pay on Fund distributions or redemption of Fund shares.
Visit https://www.aamlive.com/publicsite/mutual-funds-performance-himco for the most recent performance information.
Key Fund Statistics
The following table outlines key fund statistics that you should pay attention to.
| Fund net assets | $430,862,985 |
| Total number of portfolio holdings | 308 |
| Total advisory fees paid (net) | $1,157,688 |
| Portfolio turnover rate as of the end of the reporting period | 30% |
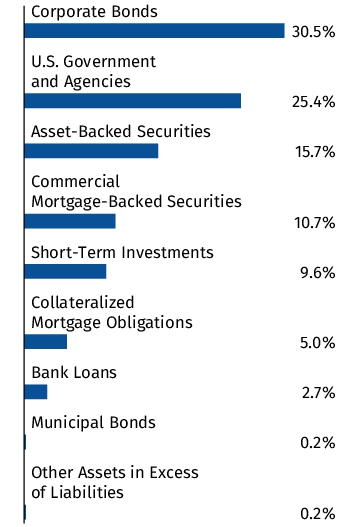
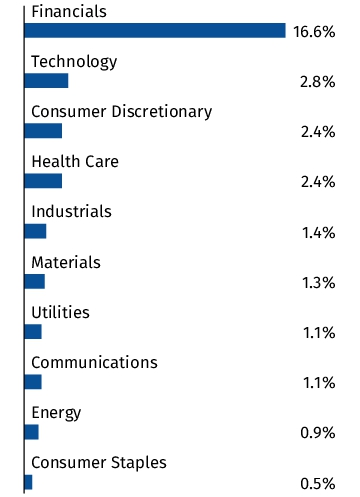
Graphical Representation of Holdings
The tables below show the investment makeup of the Fund, representing percentage of the total net assets of the Fund. The Top Ten Holdings and Sector Allocation exclude short-term holdings, if any. Interest rate presented in the Top Ten Holdings are as of the reporting period end. The Sector Allocation chart represents Corporate Bonds held by the Fund.
Top Ten Holdings
| United States Treasury Note, 4.37%, 11/30/2028 | 2.4% |
| United States Treasury Note, 4.25%, 2/28/2029 | 2.3% |
| United States Treasury Note, 4.62%, 9/15/2026 | 2.3% |
| United States Treasury Note, 4.25%, 3/15/2027 | 2.3% |
| United States Treasury Note, 4.13%, 9/30/2027 | 2.3% |
| United States Treasury Note, 4.00%, 2/29/2028 | 2.3% |
| United States Treasury Note, 4.00%, 1/31/2029 | 2.3% |
| United States Treasury Note, 4.00%, 7/31/2029 | 2.3% |
| United States Treasury Note, 3.88%, 11/30/2029 | 2.3% |
| United States Treasury Note, 3.50%, 9/30/2029 | 2.3% |
Asset Allocation
Sector Allocation
Top Ten Holdings
| United States Treasury Note, 4.37%, 11/30/2028 | 2.4% |
| United States Treasury Note, 4.25%, 2/28/2029 | 2.3% |
| United States Treasury Note, 4.62%, 9/15/2026 | 2.3% |
| United States Treasury Note, 4.25%, 3/15/2027 | 2.3% |
| United States Treasury Note, 4.13%, 9/30/2027 | 2.3% |
| United States Treasury Note, 4.00%, 2/29/2028 | 2.3% |
| United States Treasury Note, 4.00%, 1/31/2029 | 2.3% |
| United States Treasury Note, 4.00%, 7/31/2029 | 2.3% |
| United States Treasury Note, 3.88%, 11/30/2029 | 2.3% |
| United States Treasury Note, 3.50%, 9/30/2029 | 2.3% |
Material Fund Changes
The Fund did not have any material changes that occurred since the beginning of the reporting period.
Changes in and Disagreements with Accountants
There were no changes in or disagreements with the Fund's accountants during the reporting period.
Fund Expenses
(Based on a hypothetical $10,000 investment)
| Fund (Class) | Costs of a $10,000 investment | Costs paid as a percentage of a $10,000 investment |
| AAM/HIMCO Short Duration Fund (Class I/ASDIX) |
$60 | 0.59% |
Management's Discussion of Fund Performance
SUMMARY OF RESULTS
For the 12-month period ending June 30, 2026, the AAM/HIMCO Short Duration Fund Class I produced positive performance of 3.84%. The Bloomberg 1-3 Year U.S. Government/Credit Index (“Index”) returned 3.14% over the same period. The Fund was primarily invested in U.S. Treasuries, investment grade corporates, high yield corporates, bank loans, securitized sectors and cash. The securitized sectors included asset-backed securities (ABS), commercial mortgage-backed securities (CMBS) and collateralized loan obligations (CLOs).
TOP PERFORMANCE CONTRIBUTORS
- Sector allocation was the primary source of positive performance, particularly the out-of-benchmark allocations to ABS, CMBS, bank loans, CLOs and high yield corporates due to spread tightening and the positive carry
- The underweight to U.S. Treasuries was also of benefit
- Security selection within the Industrial and financial sub-sectors of investment grade corporates was a positive contributor
- A shorter interest rate duration position relative to the Index was a contributor given the increase in interest rates over the course of the 12-month period
TOP PERFORMANCE DETRACTORS
- The portfolio’s cash position was a drag on performance given the relative outperformance of the spread sectors
- The Fund did not have any direct holdings in the emerging market sector which detracted from the positive performance relative to the Index
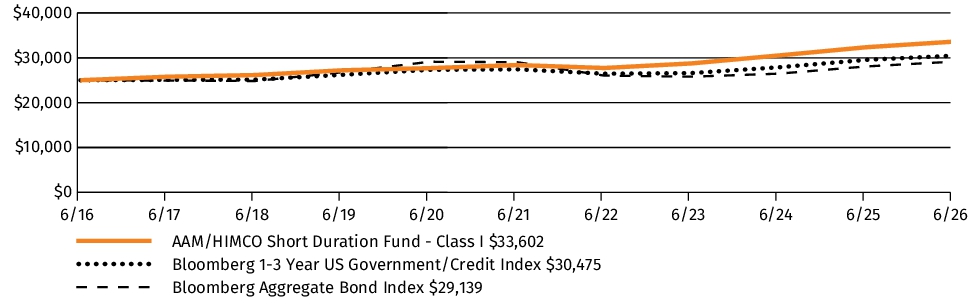
Fund Performance
The following graph and chart compare the initial and subsequent account values at the end of each of the most recently completed 10 fiscal years of the Fund, or for the life of the Fund, if shorter. It assumes a $25,000 initial investment at the beginning of the first fiscal year in an appropriate, broad-based securities market index for the same period.
GROWTH OF $25,000
| AVERAGE ANNUAL TOTAL RETURN | 1 Year | 5 Years | 10 Years |
| AAM/HIMCO Short Duration Fund (Class I/ASDIX) | 3.84% | 3.44% | 3.00% |
| Bloomberg 1-3 Year US Government/Credit Index | 3.14% | 2.12% | 2.00% |
| Bloomberg Aggregate Bond Index* | 3.79% | 0.08% | 1.54% |
* SEC rules require that a broad-based securities market index be provided to compare the performance in annual shareholder reports and prospectuses. The fund also continues to compare its performance to the Bloomberg 1-3 Year US Government/Credit Index. There is no change in the fund’s investment strategies as a result of the SEC rule.
The graph and table do not reflect the deduction of taxes that a shareholder would pay on Fund distributions or redemption of Fund shares.
Visit https://www.aamlive.com/publicsite/mutual-funds-performance-himco for the most recent performance information.
Key Fund Statistics
The following table outlines key fund statistics that you should pay attention to.
| Fund net assets | $430,862,985 |
| Total number of portfolio holdings | 308 |
| Total advisory fees paid (net) | $1,157,688 |
| Portfolio turnover rate as of the end of the reporting period | 30% |
Graphical Representation of Holdings
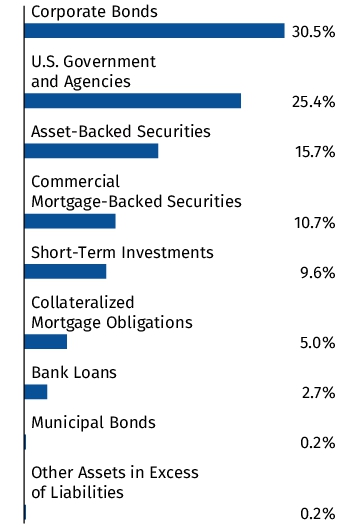
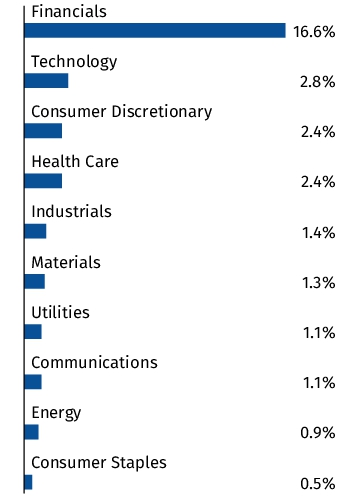
The tables below show the investment makeup of the Fund, representing percentage of the total net assets of the Fund. The Top Ten Holdings and Sector Allocation exclude short-term holdings, if any. Interest rate presented in the Top Ten Holdings are as of the reporting period end. The Sector Allocation chart represents Corporate Bonds held by the Fund.
Top Ten Holdings
| United States Treasury Note, 4.37%, 11/30/2028 | 2.4% |
| United States Treasury Note, 4.25%, 2/28/2029 | 2.3% |
| United States Treasury Note, 4.62%, 9/15/2026 | 2.3% |
| United States Treasury Note, 4.25%, 3/15/2027 | 2.3% |
| United States Treasury Note, 4.13%, 9/30/2027 | 2.3% |
| United States Treasury Note, 4.00%, 2/29/2028 | 2.3% |
| United States Treasury Note, 4.00%, 1/31/2029 | 2.3% |
| United States Treasury Note, 4.00%, 7/31/2029 | 2.3% |
| United States Treasury Note, 3.88%, 11/30/2029 | 2.3% |
| United States Treasury Note, 3.50%, 9/30/2029 | 2.3% |
Asset Allocation
Sector Allocation
Top Ten Holdings
| United States Treasury Note, 4.37%, 11/30/2028 | 2.4% |
| United States Treasury Note, 4.25%, 2/28/2029 | 2.3% |
| United States Treasury Note, 4.62%, 9/15/2026 | 2.3% |
| United States Treasury Note, 4.25%, 3/15/2027 | 2.3% |
| United States Treasury Note, 4.13%, 9/30/2027 | 2.3% |
| United States Treasury Note, 4.00%, 2/29/2028 | 2.3% |
| United States Treasury Note, 4.00%, 1/31/2029 | 2.3% |
| United States Treasury Note, 4.00%, 7/31/2029 | 2.3% |
| United States Treasury Note, 3.88%, 11/30/2029 | 2.3% |
| United States Treasury Note, 3.50%, 9/30/2029 | 2.3% |
Material Fund Changes
The Fund did not have any material changes that occurred since the beginning of the reporting period.
Changes in and Disagreements with Accountants
There were no changes in or disagreements with the Fund's accountants during the reporting period.