Shareholder Report |
12 Months Ended | |||||||||||||||||||||||||||||||||||||||||||||||||||||||||||||||||||||||||
|---|---|---|---|---|---|---|---|---|---|---|---|---|---|---|---|---|---|---|---|---|---|---|---|---|---|---|---|---|---|---|---|---|---|---|---|---|---|---|---|---|---|---|---|---|---|---|---|---|---|---|---|---|---|---|---|---|---|---|---|---|---|---|---|---|---|---|---|---|---|---|---|---|---|---|
|
Jun. 30, 2026
USD ($)
$ / shares
| ||||||||||||||||||||||||||||||||||||||||||||||||||||||||||||||||||||||||||
| Shareholder Report [Line Items] | ||||||||||||||||||||||||||||||||||||||||||||||||||||||||||||||||||||||||||
| Document Type | N-CSR | |||||||||||||||||||||||||||||||||||||||||||||||||||||||||||||||||||||||||
| Amendment Flag | false | |||||||||||||||||||||||||||||||||||||||||||||||||||||||||||||||||||||||||
| Registrant Name | Manager Directed Portfolios | |||||||||||||||||||||||||||||||||||||||||||||||||||||||||||||||||||||||||
| Entity Central Index Key | 0001359057 | |||||||||||||||||||||||||||||||||||||||||||||||||||||||||||||||||||||||||
| Entity Investment Company Type | N-1A | |||||||||||||||||||||||||||||||||||||||||||||||||||||||||||||||||||||||||
| Document Period End Date | Jun. 30, 2026 | |||||||||||||||||||||||||||||||||||||||||||||||||||||||||||||||||||||||||
| Shareholder Report Annual or Semi-Annual | annual shareholder report | |||||||||||||||||||||||||||||||||||||||||||||||||||||||||||||||||||||||||
| Institutional Shares | ||||||||||||||||||||||||||||||||||||||||||||||||||||||||||||||||||||||||||
| Shareholder Report [Line Items] | ||||||||||||||||||||||||||||||||||||||||||||||||||||||||||||||||||||||||||
| Fund Name | Hood River Emerging Markets Fund | |||||||||||||||||||||||||||||||||||||||||||||||||||||||||||||||||||||||||
| Class Name | Institutional Shares | |||||||||||||||||||||||||||||||||||||||||||||||||||||||||||||||||||||||||
| Trading Symbol | HREOX | |||||||||||||||||||||||||||||||||||||||||||||||||||||||||||||||||||||||||
| Annual or Semi-Annual Statement [Text Block] | This annual shareholder report contains important information about the Hood River Emerging Markets Fund (the “Fund”) for the period of November 24, 2025 (commencement of operations) to June 30, 2026. | |||||||||||||||||||||||||||||||||||||||||||||||||||||||||||||||||||||||||
| Additional Information [Text Block] | You can find additional information about the Fund at https://hoodrivercapital.com/emerging-markets-fund/. You can also request this information by contacting us at (800) 497-2960 or info@hoodrivercapital.com. | |||||||||||||||||||||||||||||||||||||||||||||||||||||||||||||||||||||||||
| Material Fund Change Notice [Text Block] | This report describes changes to the Fund that occurred during the reporting period.
|
|||||||||||||||||||||||||||||||||||||||||||||||||||||||||||||||||||||||||
| Additional Information Phone Number | (800) 497-2960 | |||||||||||||||||||||||||||||||||||||||||||||||||||||||||||||||||||||||||
| Additional Information Email | info@hoodrivercapital.com. | |||||||||||||||||||||||||||||||||||||||||||||||||||||||||||||||||||||||||
| Additional Information Website | https://hoodrivercapital.com/emerging-markets-fund/ | |||||||||||||||||||||||||||||||||||||||||||||||||||||||||||||||||||||||||
| Expenses [Text Block] | WHAT WERE THE FUND COSTS From November 24, 2025 to June 30, 2026? (based on a hypothetical $10,000 investment)*
|
[1],[2] | ||||||||||||||||||||||||||||||||||||||||||||||||||||||||||||||||||||||||
| Expenses Paid, Amount | $ 105 | |||||||||||||||||||||||||||||||||||||||||||||||||||||||||||||||||||||||||
| Expense Ratio, Percent | 1.25% | |||||||||||||||||||||||||||||||||||||||||||||||||||||||||||||||||||||||||
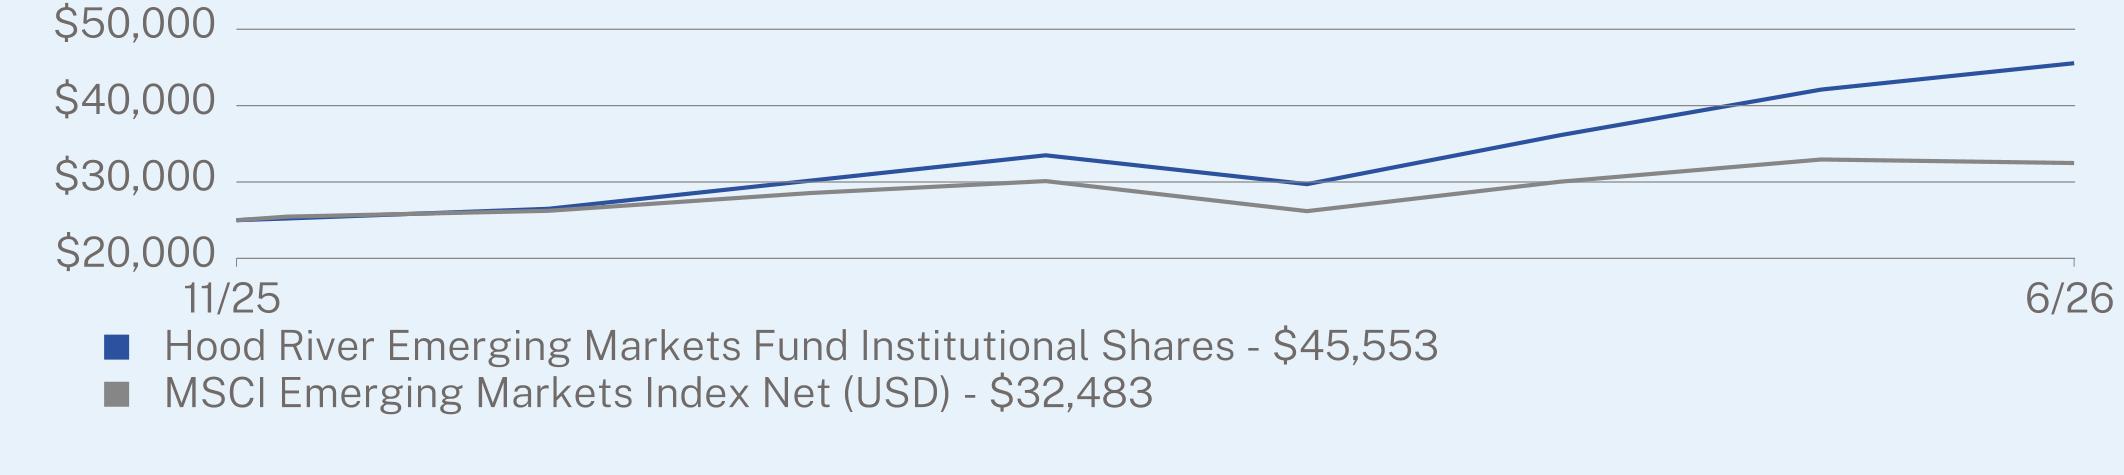
| Factors Affecting Performance [Text Block] | HOW DID THE FUND PERFORM SINCE INCEPTION AND WHAT AFFECTED ITS PERFORMANCE? During the Fund’s initial fiscal period, emerging market equities benefited from improving corporate earnings and increasing differentiation across countries, industries, and individual companies. Although geopolitical developments and evolving monetary policy contributed to periods of market volatility, market performance reflected a growing emphasis on company-specific fundamentals. Against this backdrop, the Fund remained focused on identifying investment opportunities across the emerging markets universe through disciplined fundamental research. The Emerging Markets Fund Institutional Share Class (HREOX) returned +82.21% since the Fund’s inception on November 24, 2025 through June 30, 2026, versus +29.93% for the MSCI Emerging Markets Index. WHAT FACTORS INFLUENCED PERFORMANCE Stock selection was the primary driver of relative results during the period. Notably, strong contributions came from the information technology and industrials sectors, while materials and communication services modestly detracted from performance. The Fund employs a disciplined, bottom-up investment process emphasizing fundamental research and independent security selection. Portfolio holdings are selected based on our assessment of each company’s competitive position, financial characteristics, valuation, and long-term business prospects, while maintaining diversified exposure across countries and industries within the emerging markets universe.
|
|||||||||||||||||||||||||||||||||||||||||||||||||||||||||||||||||||||||||
| Performance Past Does Not Indicate Future [Text] | The Fund’s past performance is not a good predictor of the Fund’s future performance. | |||||||||||||||||||||||||||||||||||||||||||||||||||||||||||||||||||||||||
| Line Graph [Table Text Block] | ![]() |
|||||||||||||||||||||||||||||||||||||||||||||||||||||||||||||||||||||||||
| Average Annual Return [Table Text Block] | ANNUAL AVERAGE TOTAL RETURN (%)
|
|||||||||||||||||||||||||||||||||||||||||||||||||||||||||||||||||||||||||
| No Deduction of Taxes [Text Block] | The graph and table do not reflect the deduction of taxes that a shareholder would pay on Fund distributions or redemption of Fund shares. | |||||||||||||||||||||||||||||||||||||||||||||||||||||||||||||||||||||||||
| Updated Performance Information Location [Text Block] | Visit https://hoodrivercapital.com/emerging-markets-fund/ for more recent performance information.
|
|||||||||||||||||||||||||||||||||||||||||||||||||||||||||||||||||||||||||
| Net Assets | $ 58,916,338 | |||||||||||||||||||||||||||||||||||||||||||||||||||||||||||||||||||||||||
| Holdings Count | $ / shares | 73 | |||||||||||||||||||||||||||||||||||||||||||||||||||||||||||||||||||||||||
| Advisory Fees Paid, Amount | $ 0 | |||||||||||||||||||||||||||||||||||||||||||||||||||||||||||||||||||||||||
| Investment Company Portfolio Turnover | 138.00% | |||||||||||||||||||||||||||||||||||||||||||||||||||||||||||||||||||||||||
| Additional Fund Statistics [Text Block] | KEY FUND STATISTICS (as of June 30, 2026)
|
|||||||||||||||||||||||||||||||||||||||||||||||||||||||||||||||||||||||||
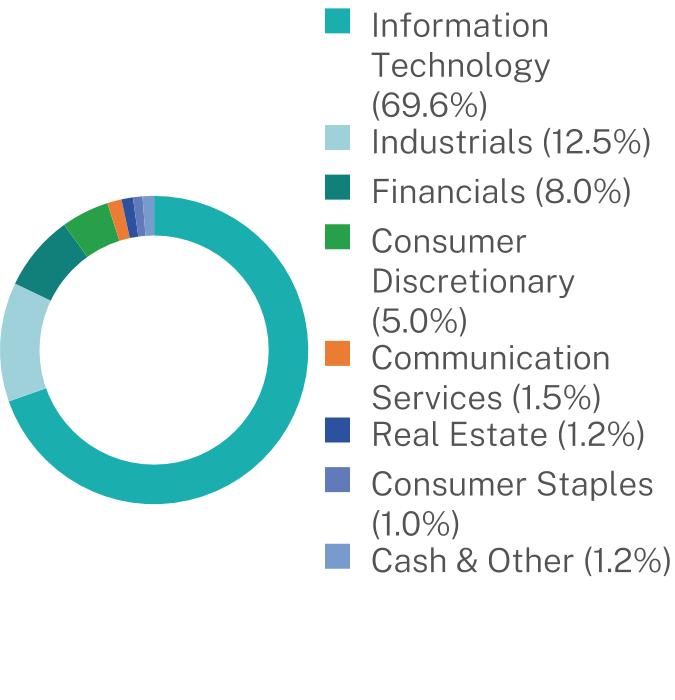
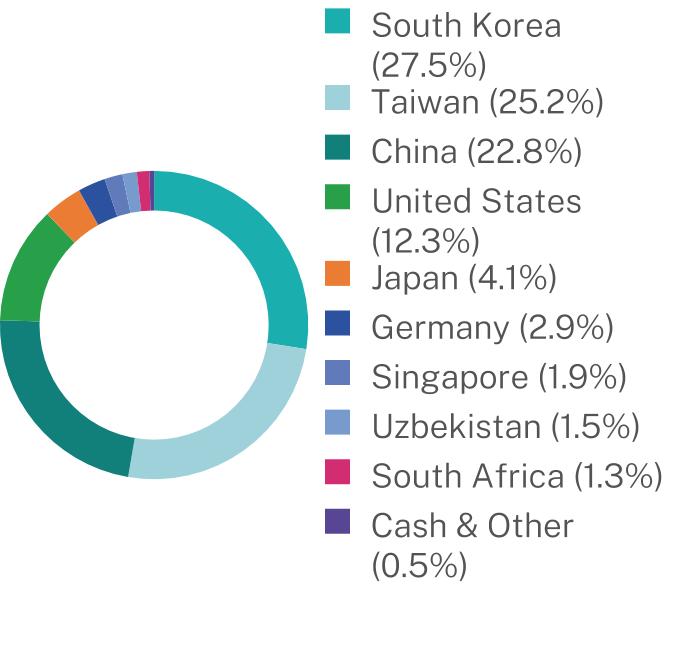
| Holdings [Text Block] | WHAT DID THE FUND INVEST IN? (as of June 30, 2026) Sector Breakdown (% of Net Assets) * ![]()
Geographic Breakdown (% of Net Assets) ![]() |
[3] | ||||||||||||||||||||||||||||||||||||||||||||||||||||||||||||||||||||||||
| Updated Prospectus Web Address | https://hoodrivercapital.com/emerging-markets-fund/ | |||||||||||||||||||||||||||||||||||||||||||||||||||||||||||||||||||||||||
| Investor Shares | ||||||||||||||||||||||||||||||||||||||||||||||||||||||||||||||||||||||||||
| Shareholder Report [Line Items] | ||||||||||||||||||||||||||||||||||||||||||||||||||||||||||||||||||||||||||
| Fund Name | Hood River Emerging Markets Fund | |||||||||||||||||||||||||||||||||||||||||||||||||||||||||||||||||||||||||
| Class Name | Investor Shares | |||||||||||||||||||||||||||||||||||||||||||||||||||||||||||||||||||||||||
| Trading Symbol | HREIX | |||||||||||||||||||||||||||||||||||||||||||||||||||||||||||||||||||||||||
| Annual or Semi-Annual Statement [Text Block] | This annual shareholder report contains important information about the Hood River Emerging Markets Fund (the “Fund”) for the period of November 24, 2025 (commencement of operations) to June 30, 2026. | |||||||||||||||||||||||||||||||||||||||||||||||||||||||||||||||||||||||||
| Additional Information [Text Block] | You can find additional information about the Fund at https://hoodrivercapital.com/emerging-markets-fund/. You can also request this information by contacting us at (800) 497-2960 or info@hoodrivercapital.com. | |||||||||||||||||||||||||||||||||||||||||||||||||||||||||||||||||||||||||
| Material Fund Change Notice [Text Block] | This report describes changes to the Fund that occurred during the reporting period.
|
|||||||||||||||||||||||||||||||||||||||||||||||||||||||||||||||||||||||||
| Additional Information Phone Number | (800) 497-2960 | |||||||||||||||||||||||||||||||||||||||||||||||||||||||||||||||||||||||||
| Additional Information Email | info@hoodrivercapital.com. | |||||||||||||||||||||||||||||||||||||||||||||||||||||||||||||||||||||||||
| Additional Information Website | https://hoodrivercapital.com/emerging-markets-fund/ | |||||||||||||||||||||||||||||||||||||||||||||||||||||||||||||||||||||||||
| Expenses [Text Block] | WHAT WERE THE FUND COSTS From November 24, 2025 to June 30, 2026? (based on a hypothetical $10,000 investment)*
|
[4],[5] | ||||||||||||||||||||||||||||||||||||||||||||||||||||||||||||||||||||||||
| Expenses Paid, Amount | $ 126 | |||||||||||||||||||||||||||||||||||||||||||||||||||||||||||||||||||||||||
| Expense Ratio, Percent | 1.50% | |||||||||||||||||||||||||||||||||||||||||||||||||||||||||||||||||||||||||
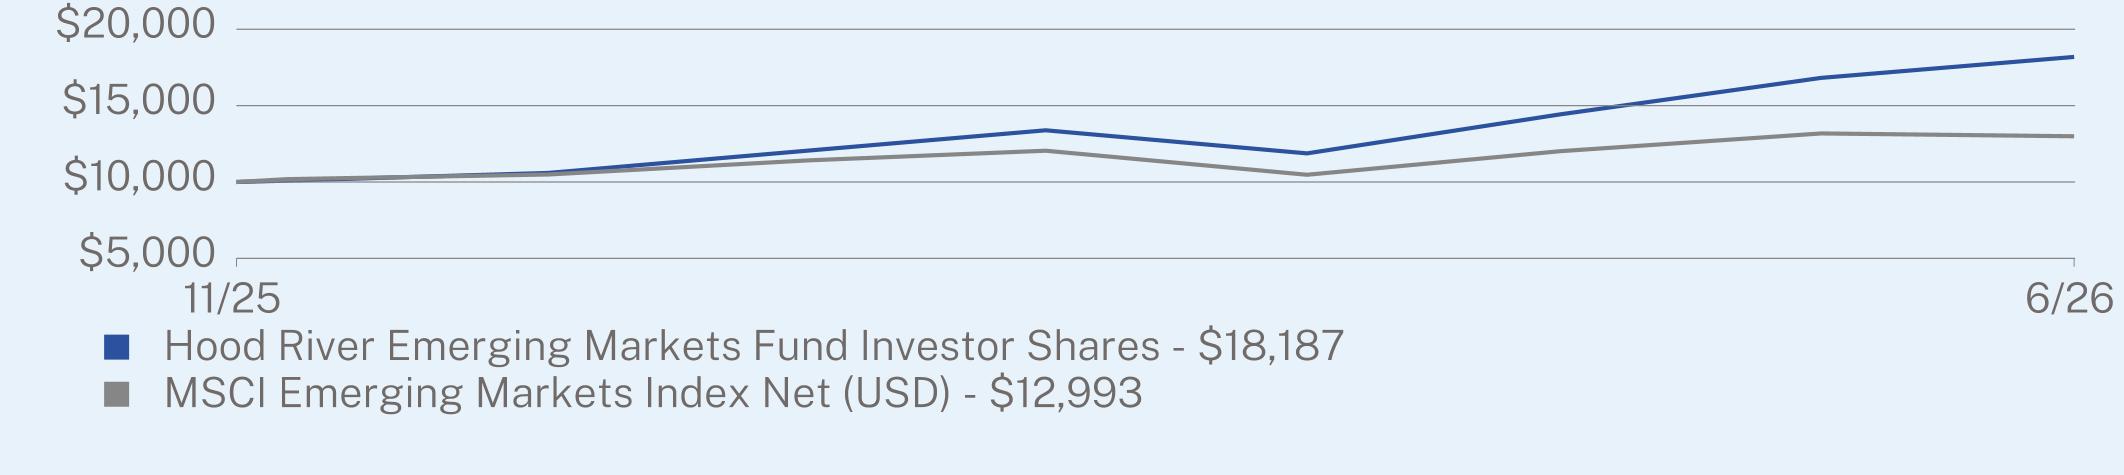
| Factors Affecting Performance [Text Block] | HOW DID THE FUND PERFORM SINCE INCEPTION AND WHAT AFFECTED ITS PERFORMANCE? During the Fund’s initial fiscal period, emerging market equities benefited from improving corporate earnings and increasing differentiation across countries, industries, and individual companies. Although geopolitical developments and evolving monetary policy contributed to periods of market volatility, market performance reflected a growing emphasis on company-specific fundamentals. Against this backdrop, the Fund remained focused on identifying investment opportunities across the emerging markets universe through disciplined fundamental research. The Emerging Markets Fund Investor Share Class (HREIX) returned +81.87% since the Fund’s inception on November 24, 2025 through June 30, 2026, versus +29.93% for the MSCI Emerging Markets Index. WHAT FACTORS INFLUENCED PERFORMANCE Stock selection was the primary driver of relative results during the period. Notably, strong contributions came from the information technology and industrials sectors, while materials and communication services modestly detracted from performance. The Fund employs a disciplined, bottom-up investment process emphasizing fundamental research and independent security selection. Portfolio holdings are selected based on our assessment of each company’s competitive position, financial characteristics, valuation, and long-term business prospects, while maintaining diversified exposure across countries and industries within the emerging markets universe.
|
|||||||||||||||||||||||||||||||||||||||||||||||||||||||||||||||||||||||||
| Performance Past Does Not Indicate Future [Text] | The Fund’s past performance is not a good predictor of the Fund’s future performance. | |||||||||||||||||||||||||||||||||||||||||||||||||||||||||||||||||||||||||
| Line Graph [Table Text Block] | ![]() |
|||||||||||||||||||||||||||||||||||||||||||||||||||||||||||||||||||||||||
| Average Annual Return [Table Text Block] | ANNUAL AVERAGE TOTAL RETURN (%)
|
|||||||||||||||||||||||||||||||||||||||||||||||||||||||||||||||||||||||||
| No Deduction of Taxes [Text Block] | The graph and table do not reflect the deduction of taxes that a shareholder would pay on Fund distributions or redemption of Fund shares. | |||||||||||||||||||||||||||||||||||||||||||||||||||||||||||||||||||||||||
| Updated Performance Information Location [Text Block] | Visit https://hoodrivercapital.com/emerging-markets-fund/ for more recent performance information.
|
|||||||||||||||||||||||||||||||||||||||||||||||||||||||||||||||||||||||||
| Net Assets | $ 58,916,338 | |||||||||||||||||||||||||||||||||||||||||||||||||||||||||||||||||||||||||
| Holdings Count | $ / shares | 73 | |||||||||||||||||||||||||||||||||||||||||||||||||||||||||||||||||||||||||
| Advisory Fees Paid, Amount | $ 0 | |||||||||||||||||||||||||||||||||||||||||||||||||||||||||||||||||||||||||
| Investment Company Portfolio Turnover | 138.00% | |||||||||||||||||||||||||||||||||||||||||||||||||||||||||||||||||||||||||
| Additional Fund Statistics [Text Block] | KEY FUND STATISTICS (as of June 30, 2026)
|
|||||||||||||||||||||||||||||||||||||||||||||||||||||||||||||||||||||||||
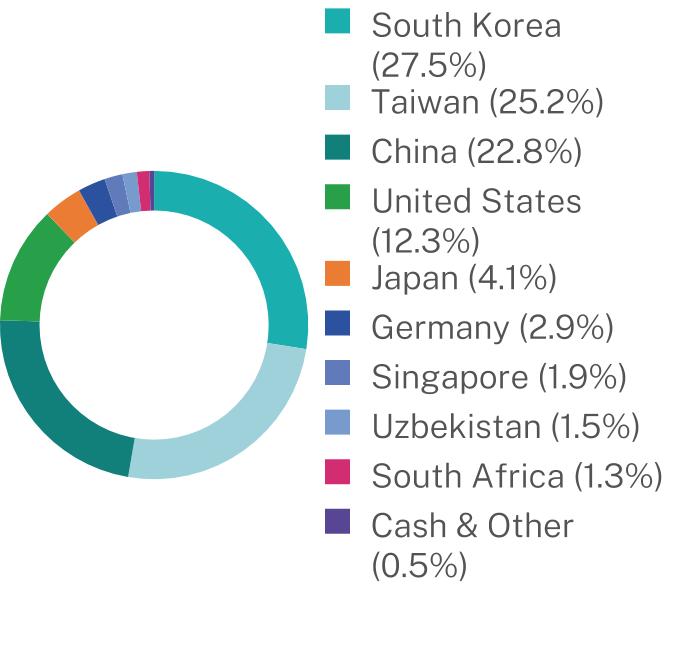
| Holdings [Text Block] | WHAT DID THE FUND INVEST IN? (as of June 30, 2026) Sector Breakdown (% of Net Assets) * ![]()
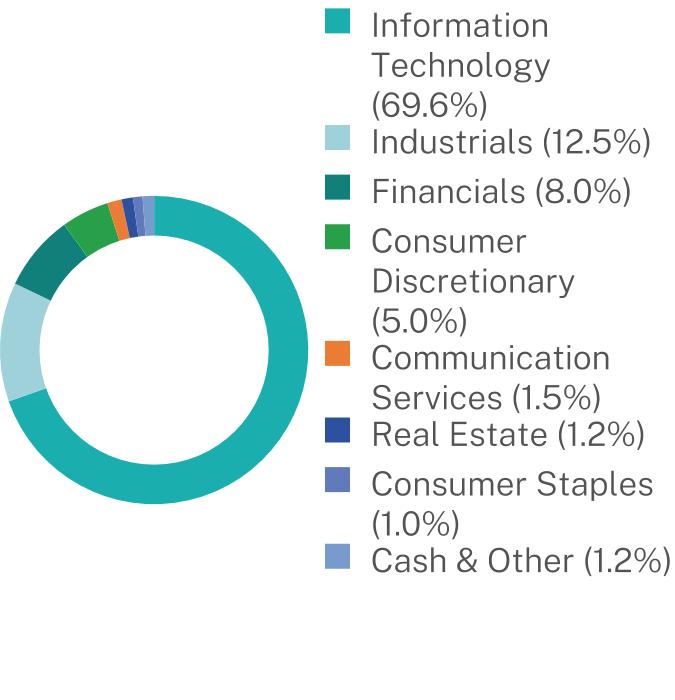
Geographic Breakdown (% of Net Assets) ![]() |
[6] | ||||||||||||||||||||||||||||||||||||||||||||||||||||||||||||||||||||||||
| Updated Prospectus Web Address | https://hoodrivercapital.com/emerging-markets-fund/ | |||||||||||||||||||||||||||||||||||||||||||||||||||||||||||||||||||||||||
| Retirement Shares | ||||||||||||||||||||||||||||||||||||||||||||||||||||||||||||||||||||||||||
| Shareholder Report [Line Items] | ||||||||||||||||||||||||||||||||||||||||||||||||||||||||||||||||||||||||||
| Fund Name | Hood River Emerging Markets Fund | |||||||||||||||||||||||||||||||||||||||||||||||||||||||||||||||||||||||||
| Class Name | Retirement Shares | |||||||||||||||||||||||||||||||||||||||||||||||||||||||||||||||||||||||||
| Trading Symbol | HRERX | |||||||||||||||||||||||||||||||||||||||||||||||||||||||||||||||||||||||||
| Annual or Semi-Annual Statement [Text Block] | This annual shareholder report contains important information about the Hood River Emerging Markets Fund (the “Fund”) for the period of November 24, 2025 (commencement of operations) to June 30, 2026. | |||||||||||||||||||||||||||||||||||||||||||||||||||||||||||||||||||||||||
| Additional Information [Text Block] | You can find additional information about the Fund at https://hoodrivercapital.com/emerging-markets-fund/. You can also request this information by contacting us at (800) 497-2960 or info@hoodrivercapital.com. | |||||||||||||||||||||||||||||||||||||||||||||||||||||||||||||||||||||||||
| Material Fund Change Notice [Text Block] | This report describes changes to the Fund that occurred during the reporting period.
|
|||||||||||||||||||||||||||||||||||||||||||||||||||||||||||||||||||||||||
| Additional Information Phone Number | (800) 497-2960 | |||||||||||||||||||||||||||||||||||||||||||||||||||||||||||||||||||||||||
| Additional Information Email | info@hoodrivercapital.com. | |||||||||||||||||||||||||||||||||||||||||||||||||||||||||||||||||||||||||
| Additional Information Website | https://hoodrivercapital.com/emerging-markets-fund/ | |||||||||||||||||||||||||||||||||||||||||||||||||||||||||||||||||||||||||
| Expenses [Text Block] | WHAT WERE THE FUND COSTS From November 24, 2025 to June 30, 2026? (based on a hypothetical $10,000 investment)*
|
[7],[8] | ||||||||||||||||||||||||||||||||||||||||||||||||||||||||||||||||||||||||
| Expenses Paid, Amount | $ 97 | |||||||||||||||||||||||||||||||||||||||||||||||||||||||||||||||||||||||||
| Expense Ratio, Percent | 1.15% | |||||||||||||||||||||||||||||||||||||||||||||||||||||||||||||||||||||||||
| Factors Affecting Performance [Text Block] | HOW DID THE FUND PERFORM SINCE INCEPTION AND WHAT AFFECTED ITS PERFORMANCE? During the Fund’s initial fiscal period, emerging market equities benefited from improving corporate earnings and increasing differentiation across countries, industries, and individual companies. Although geopolitical developments and evolving monetary policy contributed to periods of market volatility, market performance reflected a growing emphasis on company-specific fundamentals. Against this backdrop, the Fund remained focused on identifying investment opportunities across the emerging markets universe through disciplined fundamental research. The Emerging Markets Fund Retirement Share Class (HRERX) returned +82.33% since the Fund’s inception on November 24, 2025 through June 30, 2026, versus +29.93% for the MSCI Emerging Markets Index. WHAT FACTORS INFLUENCED PERFORMANCE Stock selection was the primary driver of relative results during the period. Notably, strong contributions came from the information technology and industrials sectors, while materials and communication services modestly detracted from performance. The Fund employs a disciplined, bottom-up investment process emphasizing fundamental research and independent security selection. Portfolio holdings are selected based on our assessment of each company’s competitive position, financial characteristics, valuation, and long-term business prospects, while maintaining diversified exposure across countries and industries within the emerging markets universe.
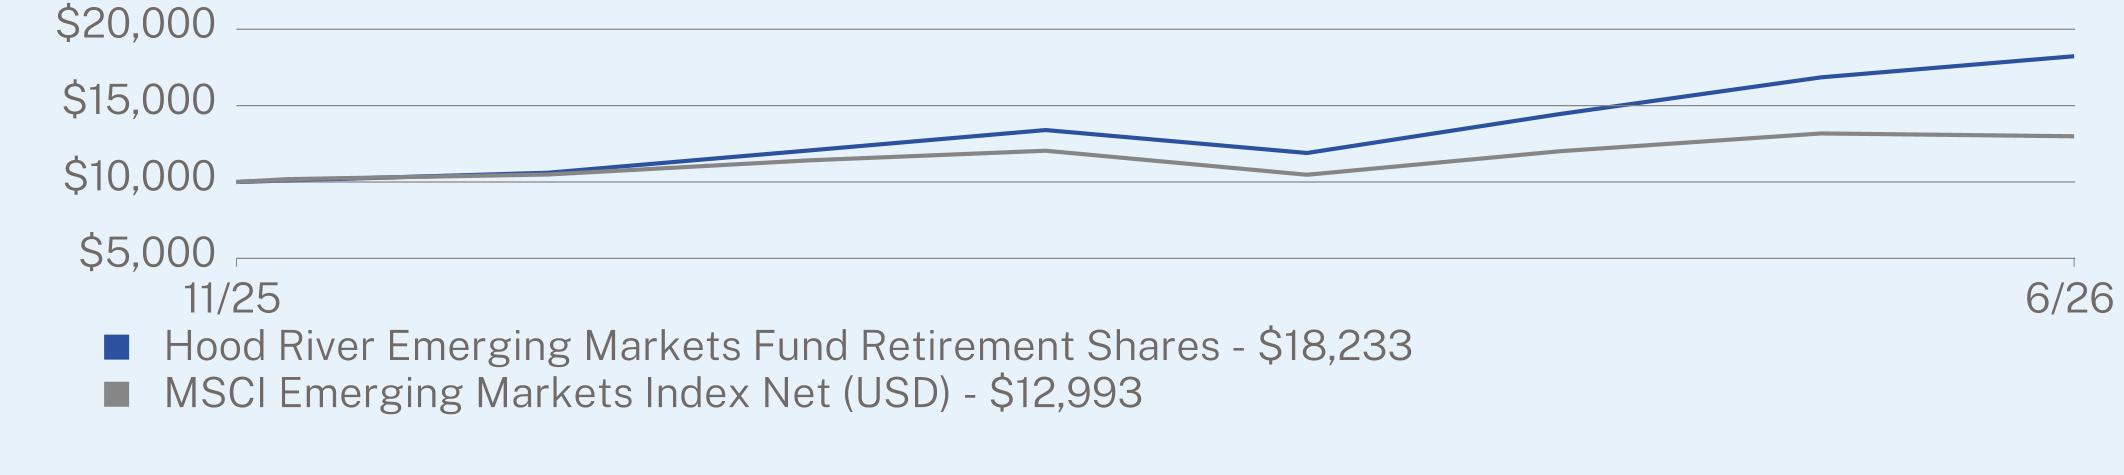
|
|||||||||||||||||||||||||||||||||||||||||||||||||||||||||||||||||||||||||
| Performance Past Does Not Indicate Future [Text] | The Fund’s past performance is not a good predictor of the Fund’s future performance. | |||||||||||||||||||||||||||||||||||||||||||||||||||||||||||||||||||||||||
| Line Graph [Table Text Block] | ![]() |
|||||||||||||||||||||||||||||||||||||||||||||||||||||||||||||||||||||||||
| Average Annual Return [Table Text Block] | ANNUAL AVERAGE TOTAL RETURN (%)
|
|||||||||||||||||||||||||||||||||||||||||||||||||||||||||||||||||||||||||
| No Deduction of Taxes [Text Block] | The graph and table do not reflect the deduction of taxes that a shareholder would pay on Fund distributions or redemption of Fund shares. | |||||||||||||||||||||||||||||||||||||||||||||||||||||||||||||||||||||||||
| Updated Performance Information Location [Text Block] | Visit https://hoodrivercapital.com/emerging-markets-fund/ for more recent performance information.
|
|||||||||||||||||||||||||||||||||||||||||||||||||||||||||||||||||||||||||
| Net Assets | $ 58,916,338 | |||||||||||||||||||||||||||||||||||||||||||||||||||||||||||||||||||||||||
| Holdings Count | $ / shares | 73 | |||||||||||||||||||||||||||||||||||||||||||||||||||||||||||||||||||||||||
| Advisory Fees Paid, Amount | $ 0 | |||||||||||||||||||||||||||||||||||||||||||||||||||||||||||||||||||||||||
| Investment Company Portfolio Turnover | 138.00% | |||||||||||||||||||||||||||||||||||||||||||||||||||||||||||||||||||||||||
| Additional Fund Statistics [Text Block] | KEY FUND STATISTICS (as of June 30, 2026)
|
|||||||||||||||||||||||||||||||||||||||||||||||||||||||||||||||||||||||||
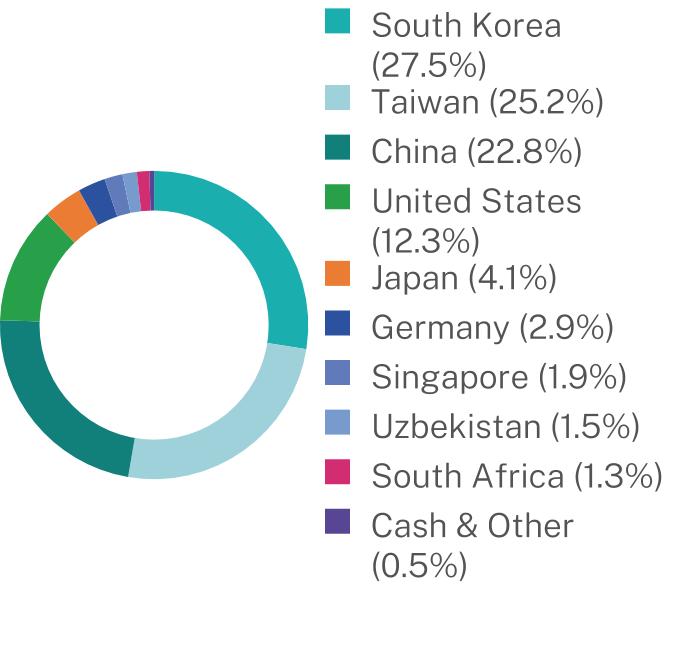
| Holdings [Text Block] | WHAT DID THE FUND INVEST IN? (as of June 30, 2026) Sector Breakdown (% of Net Assets) * ![]()
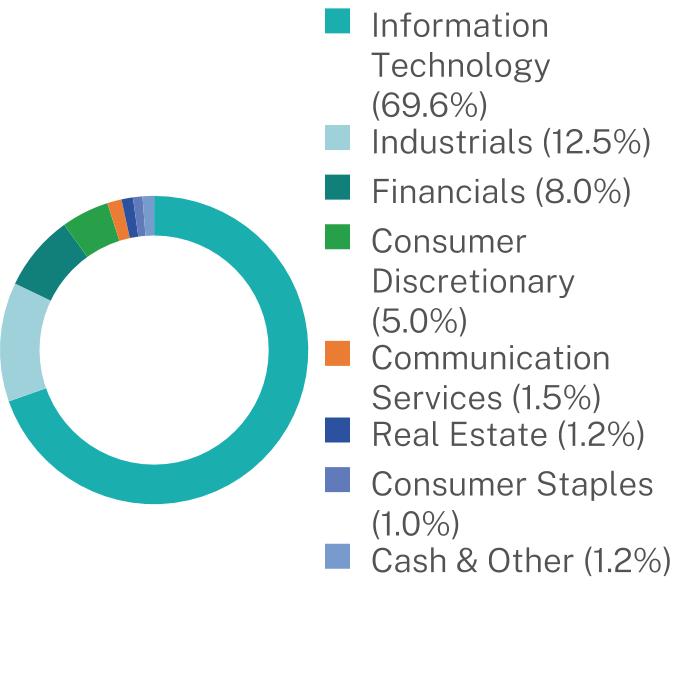
Geographic Breakdown (% of Net Assets) ![]() |
[9] | ||||||||||||||||||||||||||||||||||||||||||||||||||||||||||||||||||||||||
| Updated Prospectus Web Address | https://hoodrivercapital.com/emerging-markets-fund/ | |||||||||||||||||||||||||||||||||||||||||||||||||||||||||||||||||||||||||
| Institutional Shares | ||||||||||||||||||||||||||||||||||||||||||||||||||||||||||||||||||||||||||
| Shareholder Report [Line Items] | ||||||||||||||||||||||||||||||||||||||||||||||||||||||||||||||||||||||||||
| Fund Name | Hood River International Opportunity Fund | |||||||||||||||||||||||||||||||||||||||||||||||||||||||||||||||||||||||||
| Class Name | Institutional Shares | |||||||||||||||||||||||||||||||||||||||||||||||||||||||||||||||||||||||||
| Trading Symbol | HRIOX | |||||||||||||||||||||||||||||||||||||||||||||||||||||||||||||||||||||||||
| Annual or Semi-Annual Statement [Text Block] | This annual shareholder report contains important information about the Hood River International Opportunity Fund (the “Fund”) for the period of July 1, 2025 to June 30, 2026. | |||||||||||||||||||||||||||||||||||||||||||||||||||||||||||||||||||||||||
| Additional Information [Text Block] | You can find additional information about the Fund at https://hoodrivercapital.com/international-opportunity-fund/. You can also request this information by contacting us at (800) 497-2960 or info@hoodrivercapital.com. | |||||||||||||||||||||||||||||||||||||||||||||||||||||||||||||||||||||||||
| Additional Information Phone Number | (800) 497-2960 | |||||||||||||||||||||||||||||||||||||||||||||||||||||||||||||||||||||||||
| Additional Information Email | info@hoodrivercapital.com. | |||||||||||||||||||||||||||||||||||||||||||||||||||||||||||||||||||||||||
| Additional Information Website | https://hoodrivercapital.com/international-opportunity-fund/ | |||||||||||||||||||||||||||||||||||||||||||||||||||||||||||||||||||||||||
| Expenses [Text Block] | WHAT WERE THE FUND COSTS FOR THE PAST YEAR? (based on a hypothetical $10,000 investment)
|
|||||||||||||||||||||||||||||||||||||||||||||||||||||||||||||||||||||||||
| Expenses Paid, Amount | $ 176 | |||||||||||||||||||||||||||||||||||||||||||||||||||||||||||||||||||||||||
| Expense Ratio, Percent | 1.25% | |||||||||||||||||||||||||||||||||||||||||||||||||||||||||||||||||||||||||
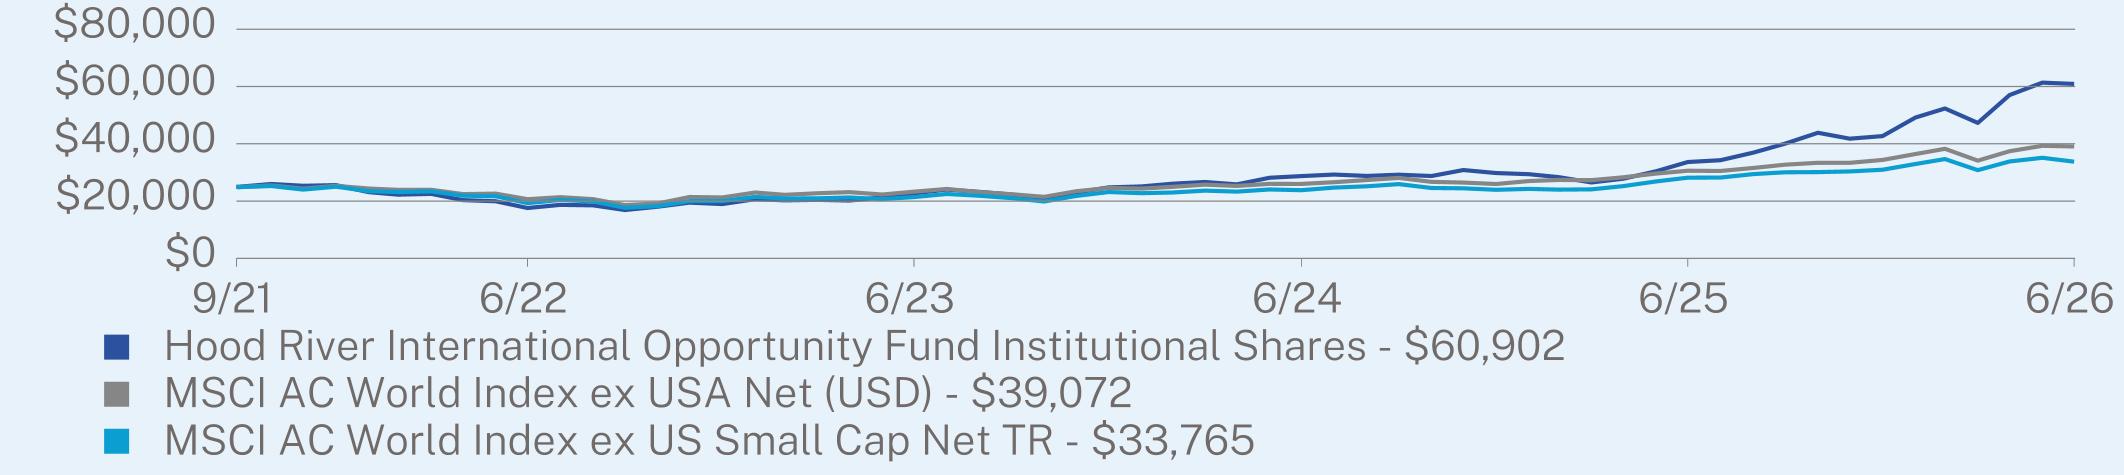
| Factors Affecting Performance [Text Block] | HOW DID THE FUND PERFORM LAST YEAR AND WHAT AFFECTED ITS PERFORMANCE? Over the past twelve months, international equity markets generally outperformed U.S. markets as market leadership broadened beyond a narrow group of U.S. mega-cap companies. Against this backdrop, the Fund remained focused on seeking to identify attractively valued international small- and mid-cap companies through disciplined, bottom-up fundamental research while navigating periods of heightened volatility driven by geopolitical developments and changing macroeconomic conditions. The International Opportunity Fund Institutional Share Class (HRIOX) returned +80.95% for the 12 months ending June 30, 2026, versus +19.83% for the MSCI AC World Index ex US Small Cap. WHAT FACTORS INFLUENCED PERFORMANCE Stock selection was the primary driver of relative results during the period. Notably, strong contributions came from the information technology, industrials and materials sectors, while consumer staples, consumer discretionary and communication services detracted from performance. Through it all, our investment philosophy and disciplined process remain our foundation. We continue to rely on a bottom-up approach to seek to identify companies with durable, long-term earnings growth. While market dislocations may obscure fundamentals in the short term, they tend to reassert themselves just as swiftly. We believe our edge lies in remaining true to our process and staying alert to the best opportunities in the most inefficient segments of the market.
|
|||||||||||||||||||||||||||||||||||||||||||||||||||||||||||||||||||||||||
| Performance Past Does Not Indicate Future [Text] | The Fund’s past performance is not a good predictor of the Fund’s future performance. | |||||||||||||||||||||||||||||||||||||||||||||||||||||||||||||||||||||||||
| Line Graph [Table Text Block] | ![]() |
|||||||||||||||||||||||||||||||||||||||||||||||||||||||||||||||||||||||||
| Average Annual Return [Table Text Block] | ANNUAL AVERAGE TOTAL RETURN (%)
|
|||||||||||||||||||||||||||||||||||||||||||||||||||||||||||||||||||||||||
| No Deduction of Taxes [Text Block] | The graph and table do not reflect the deduction of taxes that a shareholder would pay on Fund distributions or redemption of Fund shares. | |||||||||||||||||||||||||||||||||||||||||||||||||||||||||||||||||||||||||
| Updated Performance Information Location [Text Block] | Visit https://hoodrivercapital.com/international-opportunity-fund/ for more recent performance information.
|
|||||||||||||||||||||||||||||||||||||||||||||||||||||||||||||||||||||||||
| Net Assets | $ 623,010,415 | |||||||||||||||||||||||||||||||||||||||||||||||||||||||||||||||||||||||||
| Holdings Count | $ / shares | 95 | |||||||||||||||||||||||||||||||||||||||||||||||||||||||||||||||||||||||||
| Advisory Fees Paid, Amount | $ 2,750,726 | |||||||||||||||||||||||||||||||||||||||||||||||||||||||||||||||||||||||||
| Investment Company Portfolio Turnover | 108.00% | |||||||||||||||||||||||||||||||||||||||||||||||||||||||||||||||||||||||||
| Additional Fund Statistics [Text Block] | KEY FUND STATISTICS (as of June 30, 2026)
|
|||||||||||||||||||||||||||||||||||||||||||||||||||||||||||||||||||||||||
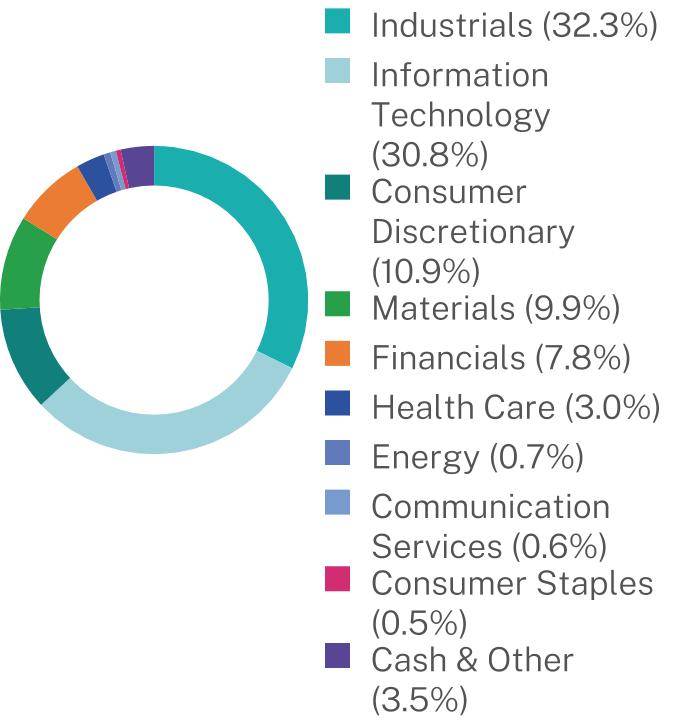
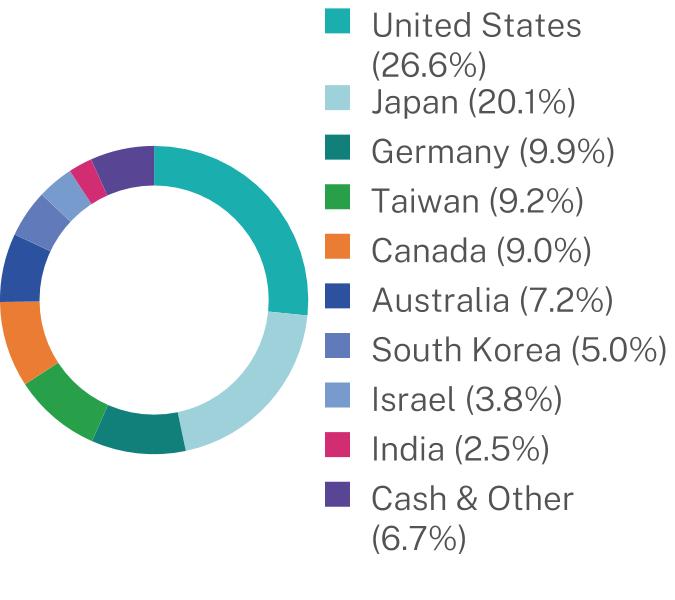
| Holdings [Text Block] | WHAT DID THE FUND INVEST IN? (as of June 30, 2026) Sector Breakdown (% of Net Assets) * ![]()
Geographic Breakdown (% of Net Assets) ![]() |
[10] | ||||||||||||||||||||||||||||||||||||||||||||||||||||||||||||||||||||||||
| Updated Prospectus Web Address | https://hoodrivercapital.com/international-opportunity-fund/ | |||||||||||||||||||||||||||||||||||||||||||||||||||||||||||||||||||||||||
| Investor Shares | ||||||||||||||||||||||||||||||||||||||||||||||||||||||||||||||||||||||||||
| Shareholder Report [Line Items] | ||||||||||||||||||||||||||||||||||||||||||||||||||||||||||||||||||||||||||
| Fund Name | Hood River International Opportunity Fund | |||||||||||||||||||||||||||||||||||||||||||||||||||||||||||||||||||||||||
| Class Name | Investor Shares | |||||||||||||||||||||||||||||||||||||||||||||||||||||||||||||||||||||||||
| Trading Symbol | HRIIX | |||||||||||||||||||||||||||||||||||||||||||||||||||||||||||||||||||||||||
| Annual or Semi-Annual Statement [Text Block] | This annual shareholder report contains important information about the Hood River International Opportunity Fund (the “Fund”) for the period of July 1, 2025 to June 30, 2026. | |||||||||||||||||||||||||||||||||||||||||||||||||||||||||||||||||||||||||
| Additional Information [Text Block] | You can find additional information about the Fund at https://hoodrivercapital.com/international-opportunity-fund/. You can also request this information by contacting us at (800) 497-2960 or info@hoodrivercapital.com. | |||||||||||||||||||||||||||||||||||||||||||||||||||||||||||||||||||||||||
| Additional Information Phone Number | (800) 497-2960 | |||||||||||||||||||||||||||||||||||||||||||||||||||||||||||||||||||||||||
| Additional Information Email | info@hoodrivercapital.com. | |||||||||||||||||||||||||||||||||||||||||||||||||||||||||||||||||||||||||
| Additional Information Website | https://hoodrivercapital.com/international-opportunity-fund/ | |||||||||||||||||||||||||||||||||||||||||||||||||||||||||||||||||||||||||
| Expenses [Text Block] | WHAT WERE THE FUND COSTS FOR THE PAST YEAR? (based on a hypothetical $10,000 investment)
|
|||||||||||||||||||||||||||||||||||||||||||||||||||||||||||||||||||||||||
| Expenses Paid, Amount | $ 197 | |||||||||||||||||||||||||||||||||||||||||||||||||||||||||||||||||||||||||
| Expense Ratio, Percent | 1.40% | |||||||||||||||||||||||||||||||||||||||||||||||||||||||||||||||||||||||||
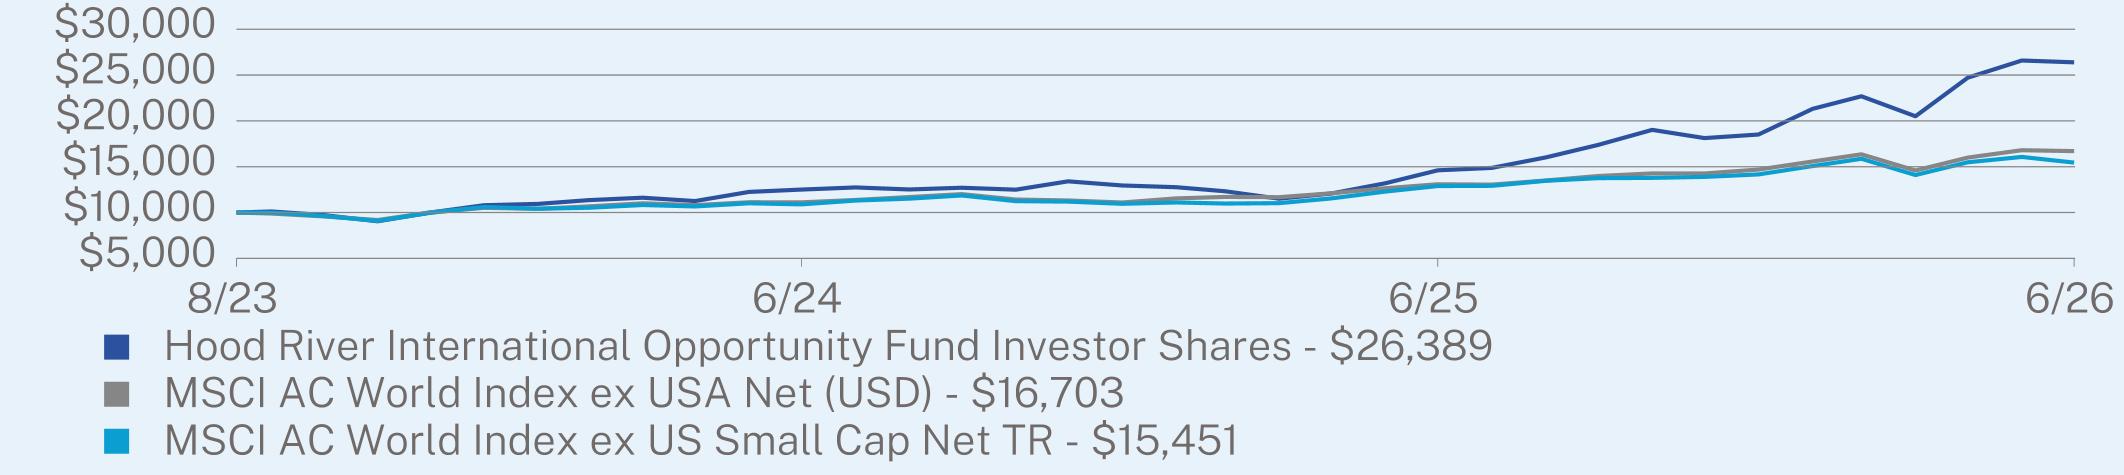
| Factors Affecting Performance [Text Block] | HOW DID THE FUND PERFORM LAST YEAR AND WHAT AFFECTED ITS PERFORMANCE? Over the past twelve months, international equity markets generally outperformed U.S. markets as market leadership broadened beyond a narrow group of U.S. mega-cap companies. Against this backdrop, the Fund remained focused on seeking to identify attractively valued international small- and mid-cap companies through disciplined, bottom-up fundamental research while navigating periods of heightened volatility driven by geopolitical developments and changing macroeconomic conditions. The International Opportunity Fund Investor Share Class (HRIIX) returned +80.65% for the 12 months ending June 30, 2026, versus +19.83% for the MSCI AC World Index ex US Small Cap. WHAT FACTORS INFLUENCED PERFORMANCE Stock selection was the primary driver of relative results during the period. Notably, strong contributions came from the information technology, industrials and materials sectors, while consumer staples, consumer discretionary and communication services detracted from performance. Through it all, our investment philosophy and disciplined process remain our foundation. We continue to rely on a bottom-up approach to seek to identify companies with durable, long-term earnings growth. While market dislocations may obscure fundamentals in the short term, they tend to reassert themselves just as swiftly. We believe our edge lies in remaining true to our process and staying alert to the best opportunities in the most inefficient segments of the market.
|
|||||||||||||||||||||||||||||||||||||||||||||||||||||||||||||||||||||||||
| Performance Past Does Not Indicate Future [Text] | The Fund’s past performance is not a good predictor of the Fund’s future performance. | |||||||||||||||||||||||||||||||||||||||||||||||||||||||||||||||||||||||||
| Line Graph [Table Text Block] | ![]() |
|||||||||||||||||||||||||||||||||||||||||||||||||||||||||||||||||||||||||
| Average Annual Return [Table Text Block] | ANNUAL AVERAGE TOTAL RETURN (%)
|
|||||||||||||||||||||||||||||||||||||||||||||||||||||||||||||||||||||||||
| No Deduction of Taxes [Text Block] | The graph and table do not reflect the deduction of taxes that a shareholder would pay on Fund distributions or redemption of Fund shares. | |||||||||||||||||||||||||||||||||||||||||||||||||||||||||||||||||||||||||
| Updated Performance Information Location [Text Block] | Visit https://hoodrivercapital.com/international-opportunity-fund/ for more recent performance information.
|
|||||||||||||||||||||||||||||||||||||||||||||||||||||||||||||||||||||||||
| Net Assets | $ 623,010,415 | |||||||||||||||||||||||||||||||||||||||||||||||||||||||||||||||||||||||||
| Holdings Count | $ / shares | 95 | |||||||||||||||||||||||||||||||||||||||||||||||||||||||||||||||||||||||||
| Advisory Fees Paid, Amount | $ 2,750,726 | |||||||||||||||||||||||||||||||||||||||||||||||||||||||||||||||||||||||||
| Investment Company Portfolio Turnover | 108.00% | |||||||||||||||||||||||||||||||||||||||||||||||||||||||||||||||||||||||||
| Additional Fund Statistics [Text Block] | KEY FUND STATISTICS (as of June 30, 2026)
|
|||||||||||||||||||||||||||||||||||||||||||||||||||||||||||||||||||||||||
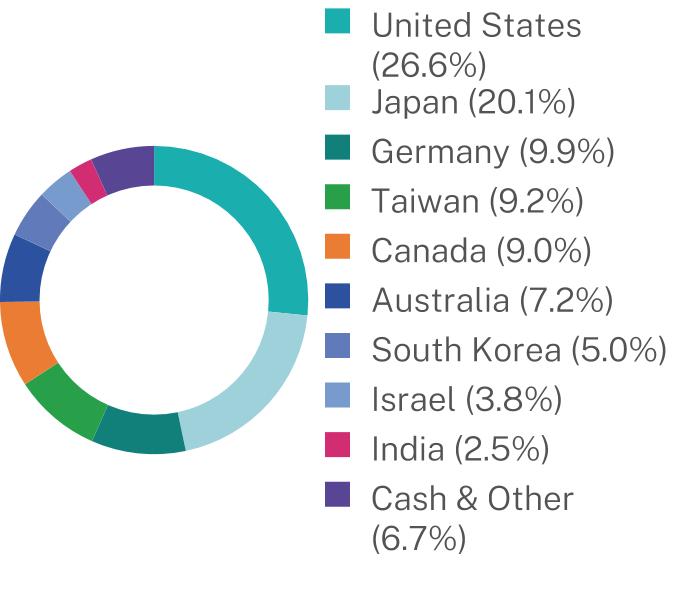
| Holdings [Text Block] | WHAT DID THE FUND INVEST IN? (as of June 30, 2026) Sector Breakdown (% of Net Assets) * ![]()
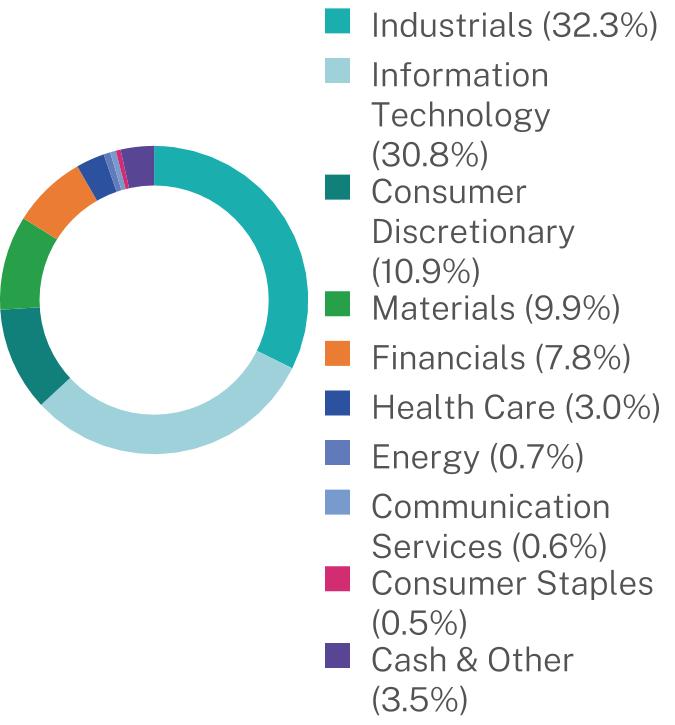
Geographic Breakdown (% of Net Assets) ![]() |
[11] | ||||||||||||||||||||||||||||||||||||||||||||||||||||||||||||||||||||||||
| Updated Prospectus Web Address | https://hoodrivercapital.com/international-opportunity-fund/ | |||||||||||||||||||||||||||||||||||||||||||||||||||||||||||||||||||||||||
| Retirement Shares | ||||||||||||||||||||||||||||||||||||||||||||||||||||||||||||||||||||||||||
| Shareholder Report [Line Items] | ||||||||||||||||||||||||||||||||||||||||||||||||||||||||||||||||||||||||||
| Fund Name | Hood River International Opportunity Fund | |||||||||||||||||||||||||||||||||||||||||||||||||||||||||||||||||||||||||
| Class Name | Retirement Shares | |||||||||||||||||||||||||||||||||||||||||||||||||||||||||||||||||||||||||
| Trading Symbol | HRITX | |||||||||||||||||||||||||||||||||||||||||||||||||||||||||||||||||||||||||
| Annual or Semi-Annual Statement [Text Block] | This annual shareholder report contains important information about the Hood River International Opportunity Fund (the “Fund”) for the period of July 1, 2025 to June 30, 2026. | |||||||||||||||||||||||||||||||||||||||||||||||||||||||||||||||||||||||||
| Additional Information [Text Block] | You can find additional information about the Fund at https://hoodrivercapital.com/international-opportunity-fund/. You can also request this information by contacting us at (800) 497-2960 or info@hoodrivercapital.com. | |||||||||||||||||||||||||||||||||||||||||||||||||||||||||||||||||||||||||
| Additional Information Phone Number | (800) 497-2960 | |||||||||||||||||||||||||||||||||||||||||||||||||||||||||||||||||||||||||
| Additional Information Email | info@hoodrivercapital.com. | |||||||||||||||||||||||||||||||||||||||||||||||||||||||||||||||||||||||||
| Additional Information Website | https://hoodrivercapital.com/international-opportunity-fund/ | |||||||||||||||||||||||||||||||||||||||||||||||||||||||||||||||||||||||||
| Expenses [Text Block] | WHAT WERE THE FUND COSTS FOR THE PAST YEAR? (based on a hypothetical $10,000 investment)
|
|||||||||||||||||||||||||||||||||||||||||||||||||||||||||||||||||||||||||
| Expenses Paid, Amount | $ 162 | |||||||||||||||||||||||||||||||||||||||||||||||||||||||||||||||||||||||||
| Expense Ratio, Percent | 1.15% | |||||||||||||||||||||||||||||||||||||||||||||||||||||||||||||||||||||||||
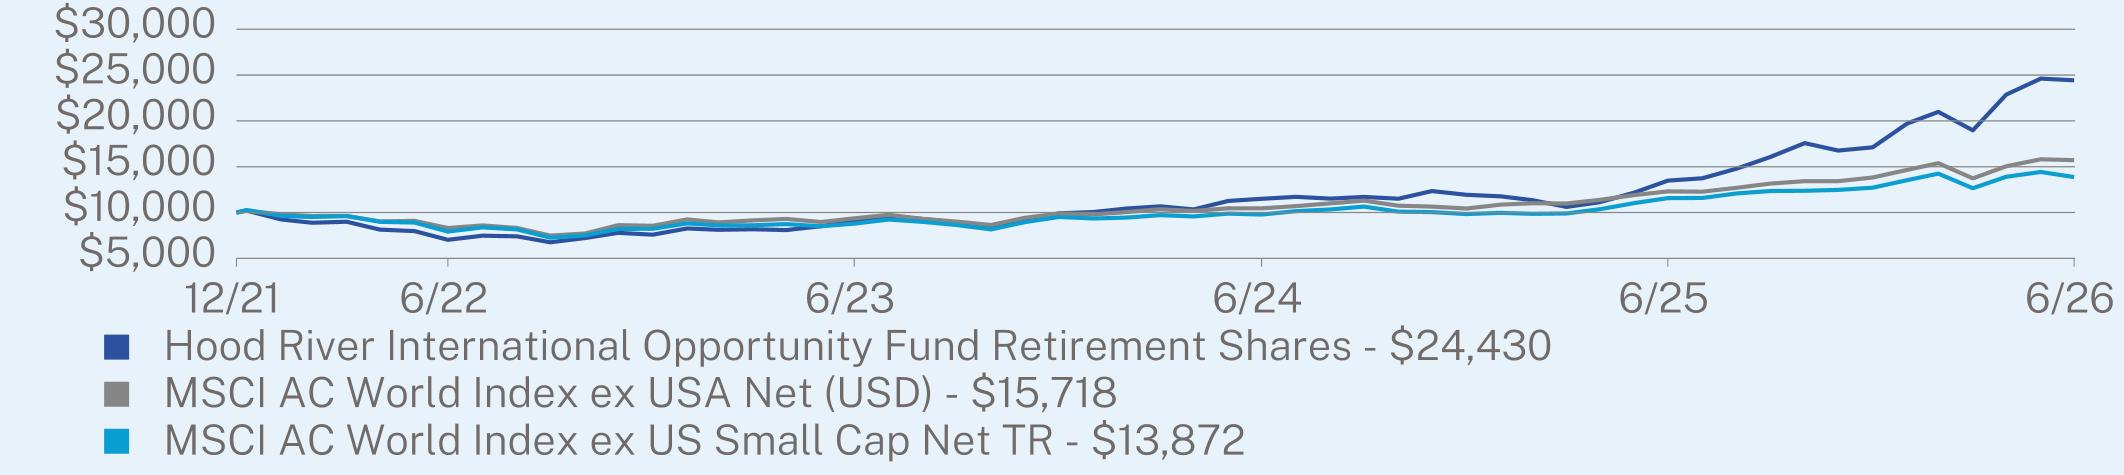
| Factors Affecting Performance [Text Block] | HOW DID THE FUND PERFORM LAST YEAR AND WHAT AFFECTED ITS PERFORMANCE? Over the past twelve months, international equity markets generally outperformed U.S. markets as market leadership broadened beyond a narrow group of U.S. mega-cap companies. Against this backdrop, the Fund remained focused on seeking to identify attractively valued international small- and mid-cap companies through disciplined, bottom-up fundamental research while navigating periods of heightened volatility driven by geopolitical developments and changing macroeconomic conditions. The International Opportunity Fund Retirement Share Class (HRITX) returned +81.15% for the 12 months ending June 30, 2026, versus +19.83% for the MSCI AC World Index ex US Small Cap. WHAT FACTORS INFLUENCED PERFORMANCE Stock selection was the primary driver of relative results during the period. Notably, strong contributions came from the information technology, industrials and materials sectors, while consumer staples, consumer discretionary and communication services detracted from performance. Through it all, our investment philosophy and disciplined process remain our foundation. We continue to rely on a bottom-up approach to seek to identify companies with durable, long-term earnings growth. While market dislocations may obscure fundamentals in the short term, they tend to reassert themselves just as swiftly. We believe our edge lies in remaining true to our process and staying alert to the best opportunities in the most inefficient segments of the market.
|
|||||||||||||||||||||||||||||||||||||||||||||||||||||||||||||||||||||||||
| Performance Past Does Not Indicate Future [Text] | The Fund’s past performance is not a good predictor of the Fund’s future performance. | |||||||||||||||||||||||||||||||||||||||||||||||||||||||||||||||||||||||||
| Line Graph [Table Text Block] | ![]() |
|||||||||||||||||||||||||||||||||||||||||||||||||||||||||||||||||||||||||
| Average Annual Return [Table Text Block] | ANNUAL AVERAGE TOTAL RETURN (%)
|
|||||||||||||||||||||||||||||||||||||||||||||||||||||||||||||||||||||||||
| No Deduction of Taxes [Text Block] | The graph and table do not reflect the deduction of taxes that a shareholder would pay on Fund distributions or redemption of Fund shares. | |||||||||||||||||||||||||||||||||||||||||||||||||||||||||||||||||||||||||
| Updated Performance Information Location [Text Block] | Visit https://hoodrivercapital.com/international-opportunity-fund/ for more recent performance information.
|
|||||||||||||||||||||||||||||||||||||||||||||||||||||||||||||||||||||||||
| Net Assets | $ 623,010,415 | |||||||||||||||||||||||||||||||||||||||||||||||||||||||||||||||||||||||||
| Holdings Count | $ / shares | 95 | |||||||||||||||||||||||||||||||||||||||||||||||||||||||||||||||||||||||||
| Advisory Fees Paid, Amount | $ 2,750,726 | |||||||||||||||||||||||||||||||||||||||||||||||||||||||||||||||||||||||||
| Investment Company Portfolio Turnover | 108.00% | |||||||||||||||||||||||||||||||||||||||||||||||||||||||||||||||||||||||||
| Additional Fund Statistics [Text Block] | KEY FUND STATISTICS (as of June 30, 2026)
|
|||||||||||||||||||||||||||||||||||||||||||||||||||||||||||||||||||||||||
| Holdings [Text Block] | WHAT DID THE FUND INVEST IN? (as of June 30, 2026) Sector Breakdown (% of Net Assets) * ![]()
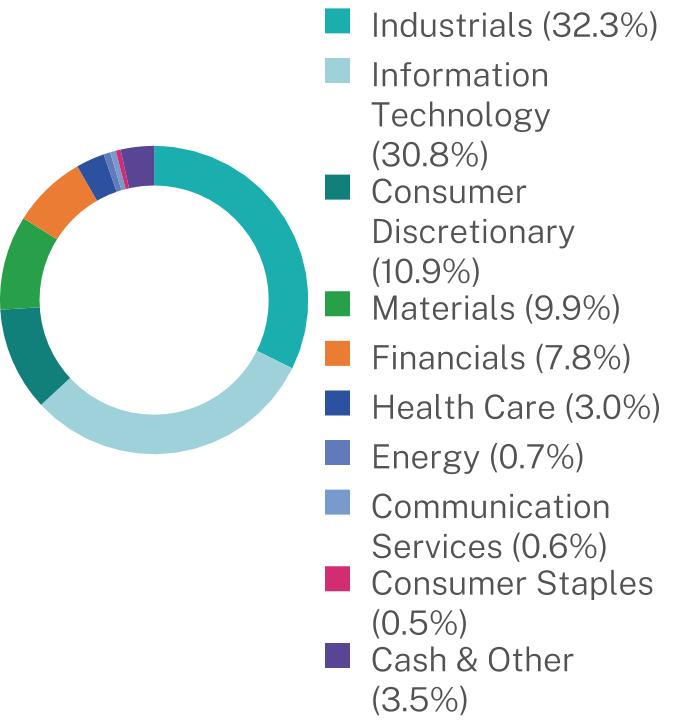
Geographic Breakdown (% of Net Assets) ![]() |
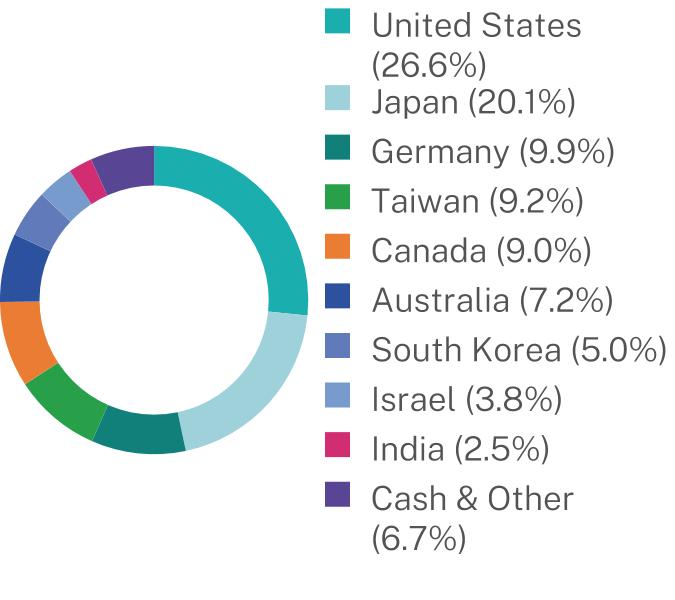
[12] | ||||||||||||||||||||||||||||||||||||||||||||||||||||||||||||||||||||||||
| Updated Prospectus Web Address | https://hoodrivercapital.com/international-opportunity-fund/ | |||||||||||||||||||||||||||||||||||||||||||||||||||||||||||||||||||||||||
| Institutional Shares | ||||||||||||||||||||||||||||||||||||||||||||||||||||||||||||||||||||||||||
| Shareholder Report [Line Items] | ||||||||||||||||||||||||||||||||||||||||||||||||||||||||||||||||||||||||||
| Fund Name | Hood River New Opportunities Fund | |||||||||||||||||||||||||||||||||||||||||||||||||||||||||||||||||||||||||
| Class Name | Institutional Shares | |||||||||||||||||||||||||||||||||||||||||||||||||||||||||||||||||||||||||
| Trading Symbol | HRNOX | |||||||||||||||||||||||||||||||||||||||||||||||||||||||||||||||||||||||||
| Annual or Semi-Annual Statement [Text Block] | This annual shareholder report contains important information about the Hood River New Opportunities Fund (the “Fund”) for the period of July 1, 2025 to June 30, 2026. | |||||||||||||||||||||||||||||||||||||||||||||||||||||||||||||||||||||||||
| Additional Information [Text Block] | You can find additional information about the Fund at https://hoodrivercapital.com/new-opportunities-fund/. You can also request this information by contacting us at (800) 497-2960 or info@hoodrivercapital.com. | |||||||||||||||||||||||||||||||||||||||||||||||||||||||||||||||||||||||||
| Additional Information Phone Number | (800) 497-2960 | |||||||||||||||||||||||||||||||||||||||||||||||||||||||||||||||||||||||||
| Additional Information Email | info@hoodrivercapital.com. | |||||||||||||||||||||||||||||||||||||||||||||||||||||||||||||||||||||||||
| Additional Information Website | https://hoodrivercapital.com/new-opportunities-fund/ | |||||||||||||||||||||||||||||||||||||||||||||||||||||||||||||||||||||||||
| Expenses [Text Block] | WHAT WERE THE FUND COSTS FOR THE PAST YEAR? (based on a hypothetical $10,000 investment)
|
|||||||||||||||||||||||||||||||||||||||||||||||||||||||||||||||||||||||||
| Expenses Paid, Amount | $ 128 | |||||||||||||||||||||||||||||||||||||||||||||||||||||||||||||||||||||||||
| Expense Ratio, Percent | 0.95% | |||||||||||||||||||||||||||||||||||||||||||||||||||||||||||||||||||||||||
| Factors Affecting Performance [Text Block] | HOW DID THE FUND PERFORM LAST YEAR AND WHAT AFFECTED ITS PERFORMANCE? During the fiscal year ended June 30, 2026, U.S. small/mid-cap growth equities advanced despite periods of heightened volatility driven by geopolitical developments, changing interest rate expectations, and shifts in investor sentiment. Although market conditions evolved throughout the year, corporate fundamentals generally remained resilient, and company execution continued to be an important differentiator of investment performance. The Hood River New Opportunities Fund Institutional Share Class (HRNOX) returned +70.48% for the twelve months ending June 30, 2026 compared to +32.94% for the Russell 2500® Growth Index. WHAT FACTORS INFLUENCED PERFORMANCE The Fund’s outperformance over the trailing 12 months was driven primarily by strong stock selection. Key contributors included positions in the information technology, financials and materials sectors, while consumer staples, consumer discretionary and real estate modestly detracted from relative performance. Throughout the fiscal year, portfolio decisions continued to be guided by fundamental company research and valuation discipline, with an emphasis on seeking to identify businesses demonstrating durable earnings growth and sustainable competitive advantages. The investment team remained focused on long-term business fundamentals, evaluating individual companies on their merits rather than repositioning the portfolio in response to short-term market developments.
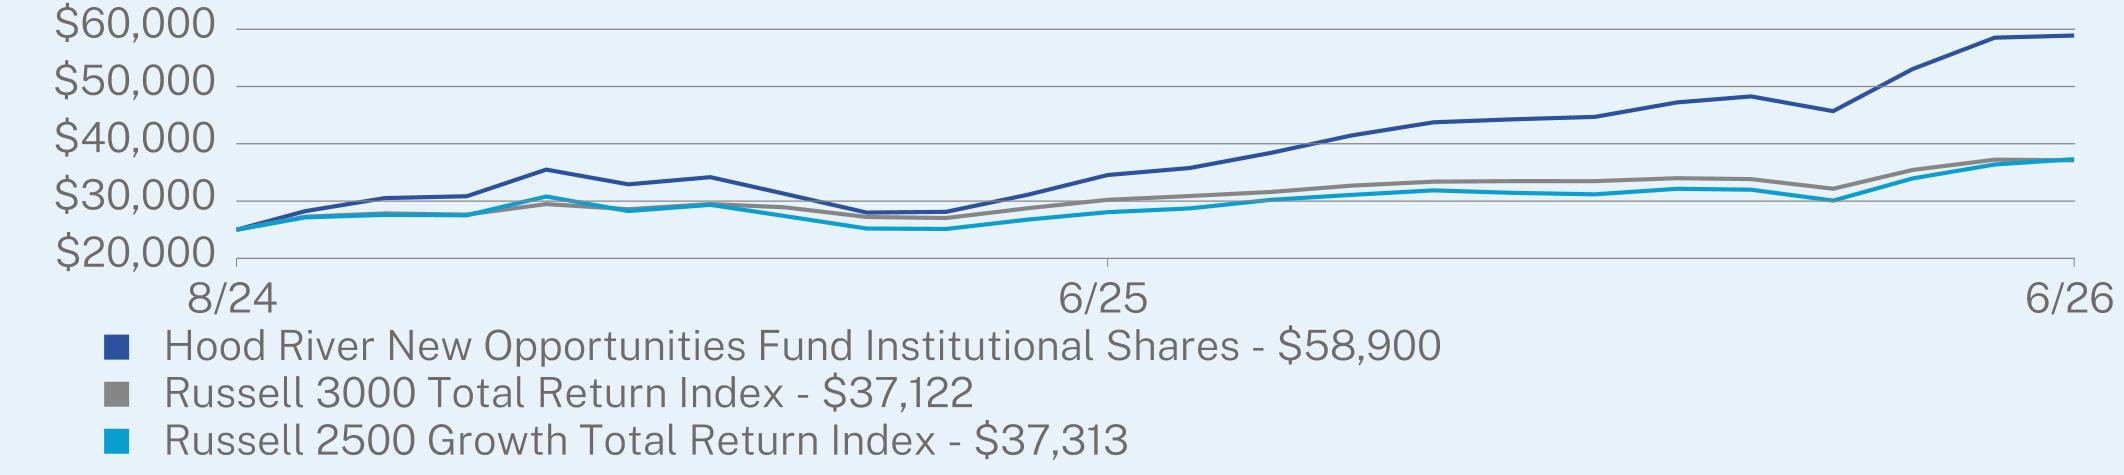
|
|||||||||||||||||||||||||||||||||||||||||||||||||||||||||||||||||||||||||
| Performance Past Does Not Indicate Future [Text] | The Fund’s past performance is not a good predictor of the Fund’s future performance. | |||||||||||||||||||||||||||||||||||||||||||||||||||||||||||||||||||||||||
| Line Graph [Table Text Block] | ![]() |
|||||||||||||||||||||||||||||||||||||||||||||||||||||||||||||||||||||||||
| Average Annual Return [Table Text Block] | ANNUAL AVERAGE TOTAL RETURN (%)
|
|||||||||||||||||||||||||||||||||||||||||||||||||||||||||||||||||||||||||
| No Deduction of Taxes [Text Block] | The graph and table do not reflect the deduction of taxes that a shareholder would pay on Fund distributions or redemption of Fund shares. | |||||||||||||||||||||||||||||||||||||||||||||||||||||||||||||||||||||||||
| Updated Performance Information Location [Text Block] | Visit https://hoodrivercapital.com/new-opportunities-fund/ for more recent performance information.
|
|||||||||||||||||||||||||||||||||||||||||||||||||||||||||||||||||||||||||
| Net Assets | $ 1,267,114,959 | |||||||||||||||||||||||||||||||||||||||||||||||||||||||||||||||||||||||||
| Holdings Count | $ / shares | 120 | |||||||||||||||||||||||||||||||||||||||||||||||||||||||||||||||||||||||||
| Advisory Fees Paid, Amount | $ 3,768,545 | |||||||||||||||||||||||||||||||||||||||||||||||||||||||||||||||||||||||||
| Investment Company Portfolio Turnover | 69.00% | |||||||||||||||||||||||||||||||||||||||||||||||||||||||||||||||||||||||||
| Additional Fund Statistics [Text Block] | KEY FUND STATISTICS (as of June 30, 2026)
|
|||||||||||||||||||||||||||||||||||||||||||||||||||||||||||||||||||||||||
| Holdings [Text Block] | WHAT DID THE FUND INVEST IN? (as of June 30, 2026) Sector Breakdown (% of Net Assets) * ![]()
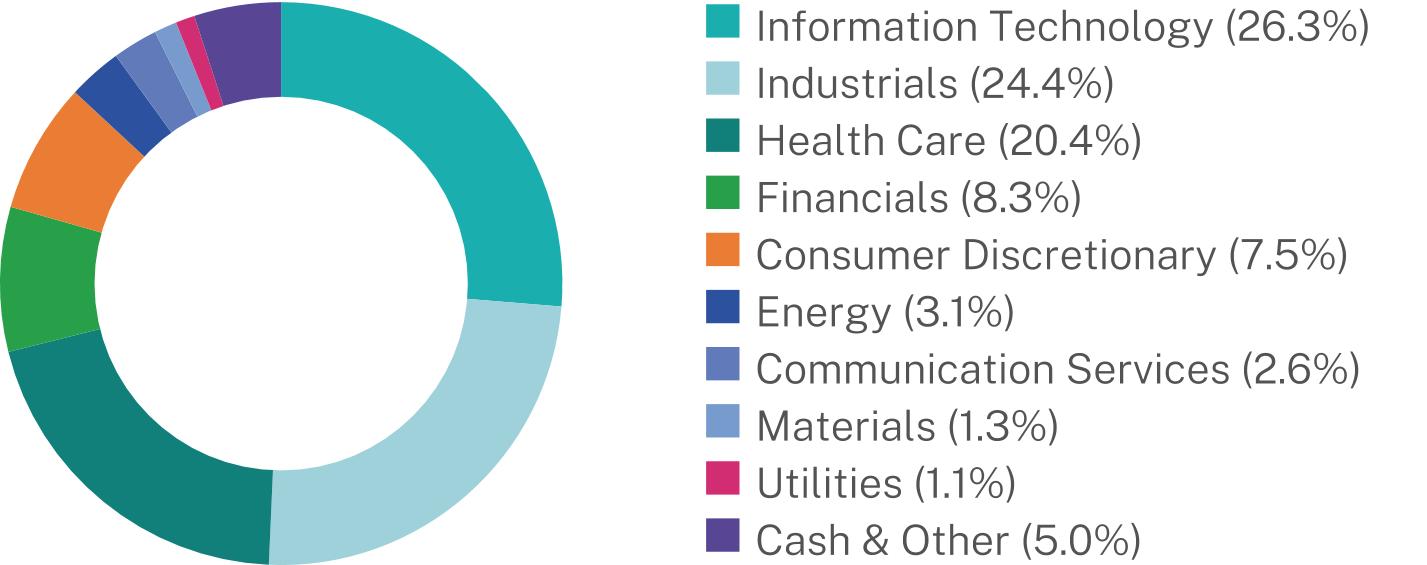
|
[13] | ||||||||||||||||||||||||||||||||||||||||||||||||||||||||||||||||||||||||
| Updated Prospectus Web Address | https://hoodrivercapital.com/new-opportunities-fund/ | |||||||||||||||||||||||||||||||||||||||||||||||||||||||||||||||||||||||||
| Investor Shares | ||||||||||||||||||||||||||||||||||||||||||||||||||||||||||||||||||||||||||
| Shareholder Report [Line Items] | ||||||||||||||||||||||||||||||||||||||||||||||||||||||||||||||||||||||||||
| Fund Name | Hood River New Opportunities Fund | |||||||||||||||||||||||||||||||||||||||||||||||||||||||||||||||||||||||||
| Class Name | Investor Shares | |||||||||||||||||||||||||||||||||||||||||||||||||||||||||||||||||||||||||
| Trading Symbol | HRNIX | |||||||||||||||||||||||||||||||||||||||||||||||||||||||||||||||||||||||||
| Annual or Semi-Annual Statement [Text Block] | This annual shareholder report contains important information about the Hood River New Opportunities Fund (the “Fund”) for the period of July 1, 2025 to June 30, 2026. | |||||||||||||||||||||||||||||||||||||||||||||||||||||||||||||||||||||||||
| Additional Information [Text Block] | You can find additional information about the Fund at https://hoodrivercapital.com/new-opportunities-fund/. You can also request this information by contacting us at (800) 497-2960 or info@hoodrivercapital.com. | |||||||||||||||||||||||||||||||||||||||||||||||||||||||||||||||||||||||||
| Additional Information Phone Number | (800) 497-2960 | |||||||||||||||||||||||||||||||||||||||||||||||||||||||||||||||||||||||||
| Additional Information Email | info@hoodrivercapital.com. | |||||||||||||||||||||||||||||||||||||||||||||||||||||||||||||||||||||||||
| Additional Information Website | https://hoodrivercapital.com/new-opportunities-fund/ | |||||||||||||||||||||||||||||||||||||||||||||||||||||||||||||||||||||||||
| Expenses [Text Block] | WHAT WERE THE FUND COSTS FOR THE PAST YEAR? (based on a hypothetical $10,000 investment)
|
|||||||||||||||||||||||||||||||||||||||||||||||||||||||||||||||||||||||||
| Expenses Paid, Amount | $ 162 | |||||||||||||||||||||||||||||||||||||||||||||||||||||||||||||||||||||||||
| Expense Ratio, Percent | 1.20% | |||||||||||||||||||||||||||||||||||||||||||||||||||||||||||||||||||||||||
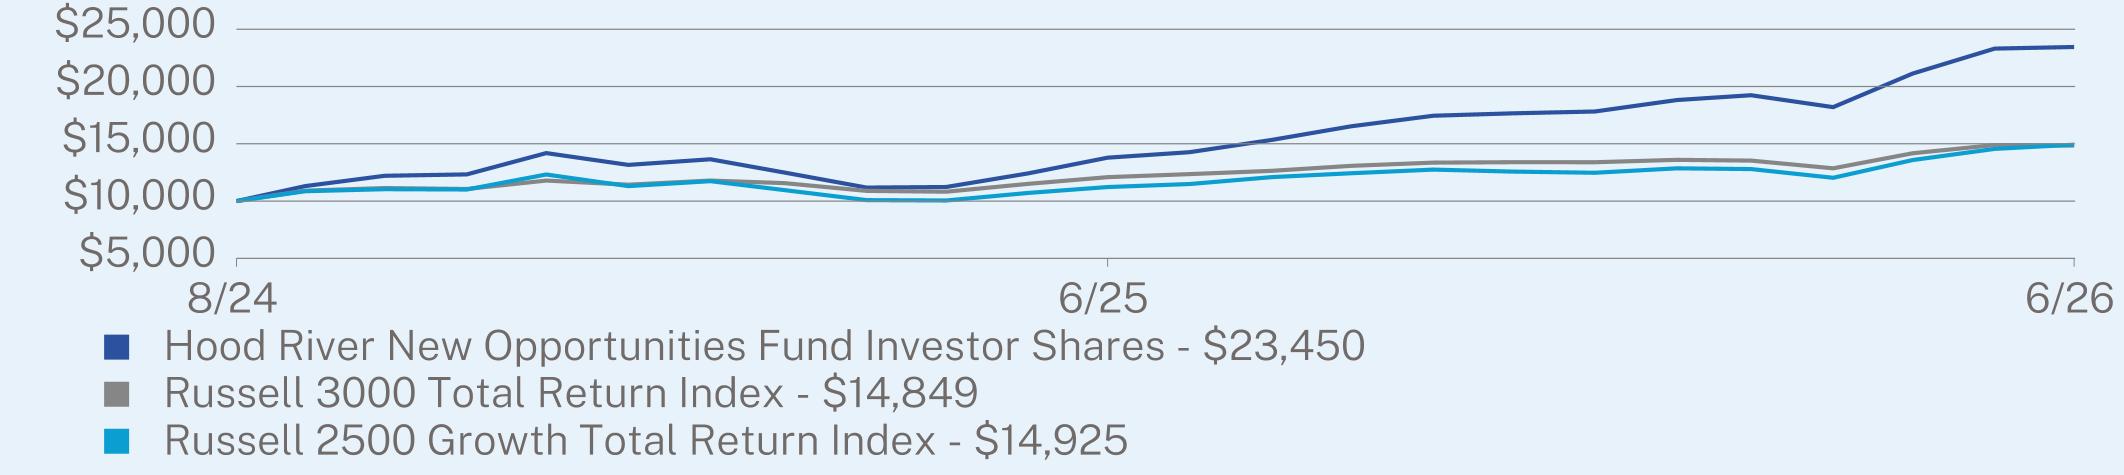
| Factors Affecting Performance [Text Block] | HOW DID THE FUND PERFORM LAST YEAR AND WHAT AFFECTED ITS PERFORMANCE? During the fiscal year ended June 30, 2026, U.S. small/mid-cap growth equities advanced despite periods of heightened volatility driven by geopolitical developments, changing interest rate expectations, and shifts in investor sentiment. Although market conditions evolved throughout the year, corporate fundamentals generally remained resilient, and company execution continued to be an important differentiator of investment performance. The Hood River New Opportunities Fund Investor Share Class (HRNIX) returned +70.05% for the twelve months ending June 30, 2026 compared to +32.94% for the Russell 2500® Growth Index. WHAT FACTORS INFLUENCED PERFORMANCE The Fund’s outperformance over the trailing 12 months was driven primarily by strong stock selection. Key contributors included positions in the information technology, financials and materials sectors, while consumer staples, consumer discretionary and real estate modestly detracted from relative performance. Throughout the fiscal year, portfolio decisions continued to be guided by fundamental company research and valuation discipline, with an emphasis on seeking to identify businesses demonstrating durable earnings growth and sustainable competitive advantages. The investment team remained focused on long-term business fundamentals, evaluating individual companies on their merits rather than repositioning the portfolio in response to short-term market developments.
|
|||||||||||||||||||||||||||||||||||||||||||||||||||||||||||||||||||||||||
| Performance Past Does Not Indicate Future [Text] | The Fund’s past performance is not a good predictor of the Fund’s future performance. | |||||||||||||||||||||||||||||||||||||||||||||||||||||||||||||||||||||||||
| Line Graph [Table Text Block] | ![]() |
|||||||||||||||||||||||||||||||||||||||||||||||||||||||||||||||||||||||||
| Average Annual Return [Table Text Block] | ANNUAL AVERAGE TOTAL RETURN (%)
|
|||||||||||||||||||||||||||||||||||||||||||||||||||||||||||||||||||||||||
| No Deduction of Taxes [Text Block] | The graph and table do not reflect the deduction of taxes that a shareholder would pay on Fund distributions or redemption of Fund shares. | |||||||||||||||||||||||||||||||||||||||||||||||||||||||||||||||||||||||||
| Updated Performance Information Location [Text Block] | Visit https://hoodrivercapital.com/new-opportunities-fund/ for more recent performance information.
|
|||||||||||||||||||||||||||||||||||||||||||||||||||||||||||||||||||||||||
| Net Assets | $ 1,267,114,959 | |||||||||||||||||||||||||||||||||||||||||||||||||||||||||||||||||||||||||
| Holdings Count | $ / shares | 120 | |||||||||||||||||||||||||||||||||||||||||||||||||||||||||||||||||||||||||
| Advisory Fees Paid, Amount | $ 3,768,545 | |||||||||||||||||||||||||||||||||||||||||||||||||||||||||||||||||||||||||
| Investment Company Portfolio Turnover | 69.00% | |||||||||||||||||||||||||||||||||||||||||||||||||||||||||||||||||||||||||
| Additional Fund Statistics [Text Block] | KEY FUND STATISTICS (as of June 30, 2026)
|
|||||||||||||||||||||||||||||||||||||||||||||||||||||||||||||||||||||||||
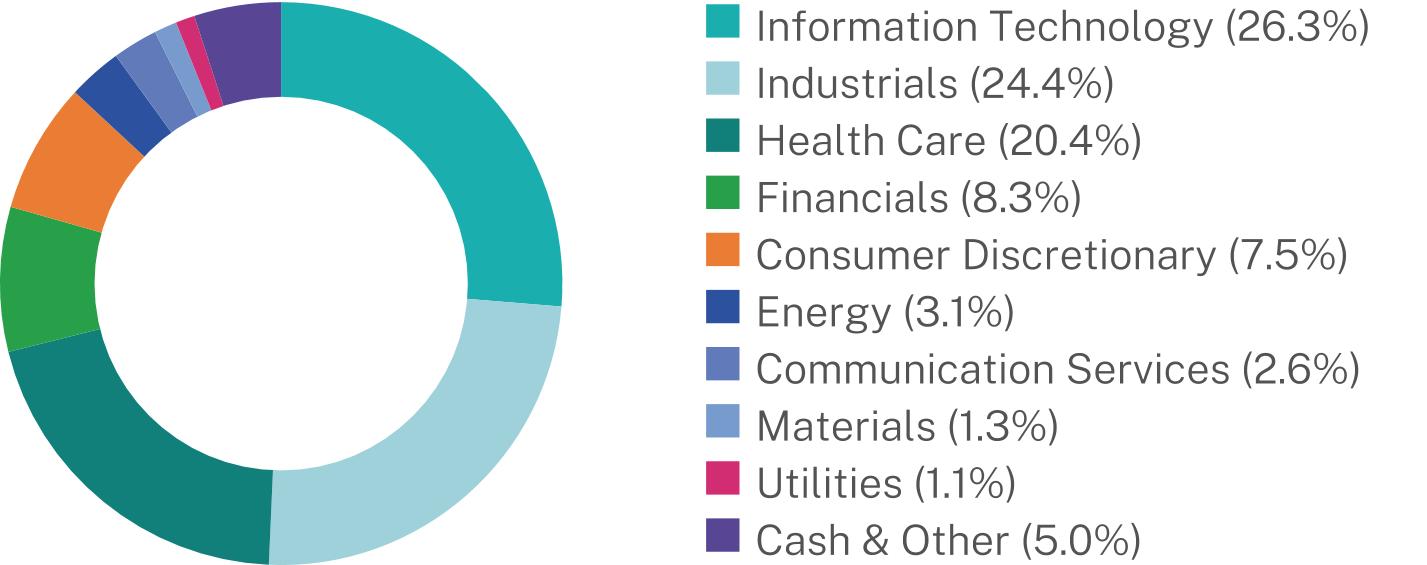
| Holdings [Text Block] | WHAT DID THE FUND INVEST IN? (as of June 30, 2026) Sector Breakdown (% of Net Assets) * ![]()
|
[14] | ||||||||||||||||||||||||||||||||||||||||||||||||||||||||||||||||||||||||
| Updated Prospectus Web Address | https://hoodrivercapital.com/new-opportunities-fund/ | |||||||||||||||||||||||||||||||||||||||||||||||||||||||||||||||||||||||||
| Retirement Shares | ||||||||||||||||||||||||||||||||||||||||||||||||||||||||||||||||||||||||||
| Shareholder Report [Line Items] | ||||||||||||||||||||||||||||||||||||||||||||||||||||||||||||||||||||||||||
| Fund Name | Hood River New Opportunities Fund | |||||||||||||||||||||||||||||||||||||||||||||||||||||||||||||||||||||||||
| Class Name | Retirement Shares | |||||||||||||||||||||||||||||||||||||||||||||||||||||||||||||||||||||||||
| Trading Symbol | HRNRX | |||||||||||||||||||||||||||||||||||||||||||||||||||||||||||||||||||||||||
| Annual or Semi-Annual Statement [Text Block] | This annual shareholder report contains important information about the Hood River New Opportunities Fund (the “Fund”) for the period of July 1, 2025 to June 30, 2026. | |||||||||||||||||||||||||||||||||||||||||||||||||||||||||||||||||||||||||
| Additional Information [Text Block] | You can find additional information about the Fund at https://hoodrivercapital.com/new-opportunities-fund/. You can also request this information by contacting us at (800) 497-2960 or info@hoodrivercapital.com. | |||||||||||||||||||||||||||||||||||||||||||||||||||||||||||||||||||||||||
| Additional Information Phone Number | (800) 497-2960 | |||||||||||||||||||||||||||||||||||||||||||||||||||||||||||||||||||||||||
| Additional Information Email | info@hoodrivercapital.com. | |||||||||||||||||||||||||||||||||||||||||||||||||||||||||||||||||||||||||
| Additional Information Website | https://hoodrivercapital.com/new-opportunities-fund/ | |||||||||||||||||||||||||||||||||||||||||||||||||||||||||||||||||||||||||
| Expenses [Text Block] | WHAT WERE THE FUND COSTS FOR THE PAST YEAR? (based on a hypothetical $10,000 investment)
|
|||||||||||||||||||||||||||||||||||||||||||||||||||||||||||||||||||||||||
| Expenses Paid, Amount | $ 115 | |||||||||||||||||||||||||||||||||||||||||||||||||||||||||||||||||||||||||
| Expense Ratio, Percent | 0.85% | |||||||||||||||||||||||||||||||||||||||||||||||||||||||||||||||||||||||||
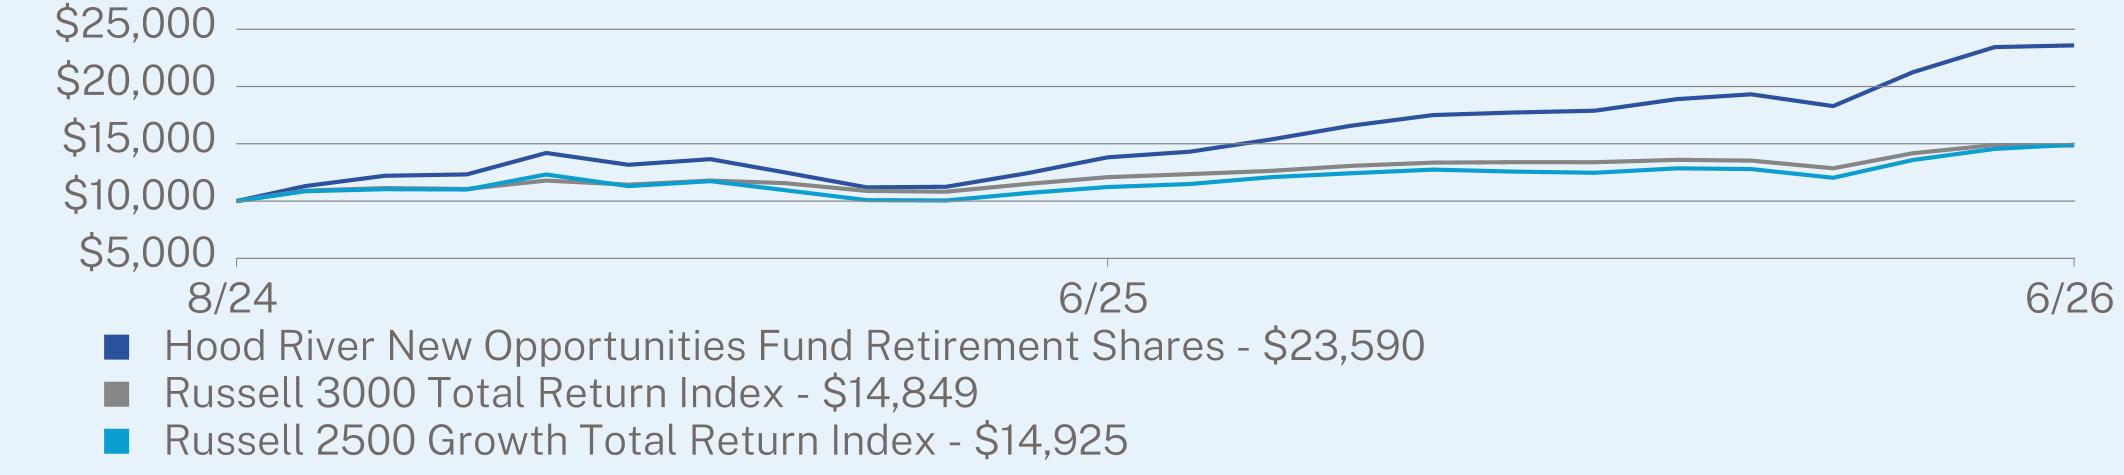
| Factors Affecting Performance [Text Block] | HOW DID THE FUND PERFORM LAST YEAR AND WHAT AFFECTED ITS PERFORMANCE? During the fiscal year ended June 30, 2026, U.S. small/mid-cap growth equities advanced despite periods of heightened volatility driven by geopolitical developments, changing interest rate expectations, and shifts in investor sentiment. Although market conditions evolved throughout the year, corporate fundamentals generally remained resilient, and company execution continued to be an important differentiator of investment performance. The Hood River New Opportunities Fund Retirement Share Class (HRNRX) returned +70.69% for the twelve months ending June 30, 2026 compared to +32.94% for the Russell 2500® Growth Index. WHAT FACTORS INFLUENCED PERFORMANCE The Fund’s outperformance over the trailing 12 months was driven primarily by strong stock selection. Key contributors included positions in the information technology, financials and materials sectors, while consumer staples, consumer discretionary and real estate modestly detracted from relative performance. Throughout the fiscal year, portfolio decisions continued to be guided by fundamental company research and valuation discipline, with an emphasis on seeking to identify businesses demonstrating durable earnings growth and sustainable competitive advantages. The investment team remained focused on long-term business fundamentals, evaluating individual companies on their merits rather than repositioning the portfolio in response to short-term market developments.
|
|||||||||||||||||||||||||||||||||||||||||||||||||||||||||||||||||||||||||
| Performance Past Does Not Indicate Future [Text] | The Fund’s past performance is not a good predictor of the Fund’s future performance. | |||||||||||||||||||||||||||||||||||||||||||||||||||||||||||||||||||||||||
| Line Graph [Table Text Block] | ![]() |
|||||||||||||||||||||||||||||||||||||||||||||||||||||||||||||||||||||||||
| Average Annual Return [Table Text Block] | ANNUAL AVERAGE TOTAL RETURN (%)
|
|||||||||||||||||||||||||||||||||||||||||||||||||||||||||||||||||||||||||
| No Deduction of Taxes [Text Block] | The graph and table do not reflect the deduction of taxes that a shareholder would pay on Fund distributions or redemption of Fund shares. | |||||||||||||||||||||||||||||||||||||||||||||||||||||||||||||||||||||||||
| Updated Performance Information Location [Text Block] | Visit https://hoodrivercapital.com/new-opportunities-fund/ for more recent performance information.
|
|||||||||||||||||||||||||||||||||||||||||||||||||||||||||||||||||||||||||
| Net Assets | $ 1,267,114,959 | |||||||||||||||||||||||||||||||||||||||||||||||||||||||||||||||||||||||||
| Holdings Count | $ / shares | 120 | |||||||||||||||||||||||||||||||||||||||||||||||||||||||||||||||||||||||||
| Advisory Fees Paid, Amount | $ 3,768,545 | |||||||||||||||||||||||||||||||||||||||||||||||||||||||||||||||||||||||||
| Investment Company Portfolio Turnover | 69.00% | |||||||||||||||||||||||||||||||||||||||||||||||||||||||||||||||||||||||||
| Additional Fund Statistics [Text Block] | KEY FUND STATISTICS (as of June 30, 2026)
|
|||||||||||||||||||||||||||||||||||||||||||||||||||||||||||||||||||||||||
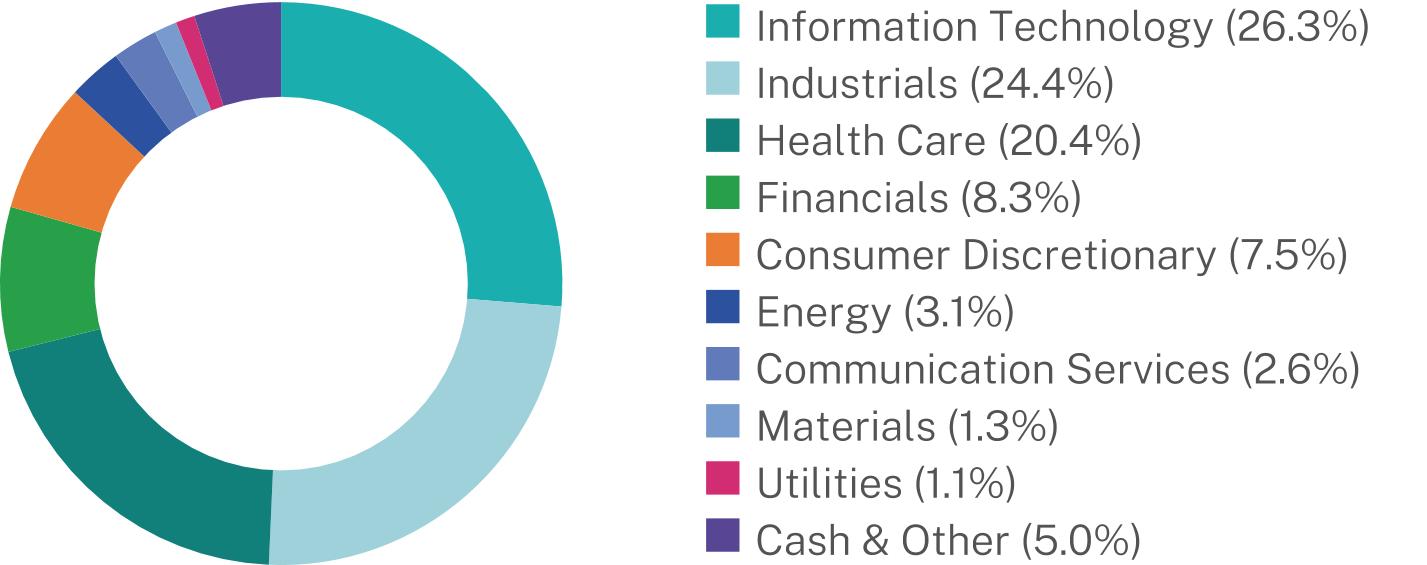
| Holdings [Text Block] | WHAT DID THE FUND INVEST IN? (as of June 30, 2026) Sector Breakdown (% of Net Assets) * ![]()
|
[15] | ||||||||||||||||||||||||||||||||||||||||||||||||||||||||||||||||||||||||
| Updated Prospectus Web Address | https://hoodrivercapital.com/new-opportunities-fund/ | |||||||||||||||||||||||||||||||||||||||||||||||||||||||||||||||||||||||||
| Institutional Shares | ||||||||||||||||||||||||||||||||||||||||||||||||||||||||||||||||||||||||||
| Shareholder Report [Line Items] | ||||||||||||||||||||||||||||||||||||||||||||||||||||||||||||||||||||||||||
| Fund Name | Hood River Small-Cap Growth Fund | |||||||||||||||||||||||||||||||||||||||||||||||||||||||||||||||||||||||||
| Class Name | Institutional Shares | |||||||||||||||||||||||||||||||||||||||||||||||||||||||||||||||||||||||||
| Trading Symbol | HRSMX | |||||||||||||||||||||||||||||||||||||||||||||||||||||||||||||||||||||||||
| Annual or Semi-Annual Statement [Text Block] | This annual shareholder report contains important information about the Hood River Small-Cap Growth Fund (the “Fund”) for the period of July 1, 2025 to June 30, 2026. | |||||||||||||||||||||||||||||||||||||||||||||||||||||||||||||||||||||||||
| Additional Information [Text Block] | You can find additional information about the Fund at https://hoodrivercapital.com/us-small-cap-growth-fund/. You can also request this information by contacting us at (800) 497-2960 or info@hoodrivercapital.com. | |||||||||||||||||||||||||||||||||||||||||||||||||||||||||||||||||||||||||
| Additional Information Phone Number | (800) 497-2960 | |||||||||||||||||||||||||||||||||||||||||||||||||||||||||||||||||||||||||
| Additional Information Email | info@hoodrivercapital.com. | |||||||||||||||||||||||||||||||||||||||||||||||||||||||||||||||||||||||||
| Additional Information Website | https://hoodrivercapital.com/us-small-cap-growth-fund/ | |||||||||||||||||||||||||||||||||||||||||||||||||||||||||||||||||||||||||
| Expenses [Text Block] | WHAT WERE THE FUND COSTS FOR THE PAST YEAR? (based on a hypothetical $10,000 investment)
|
|||||||||||||||||||||||||||||||||||||||||||||||||||||||||||||||||||||||||
| Expenses Paid, Amount | $ 144 | |||||||||||||||||||||||||||||||||||||||||||||||||||||||||||||||||||||||||
| Expense Ratio, Percent | 1.06% | |||||||||||||||||||||||||||||||||||||||||||||||||||||||||||||||||||||||||
| Factors Affecting Performance [Text Block] | HOW DID THE FUND PERFORM LAST YEAR AND WHAT AFFECTED ITS PERFORMANCE? During the fiscal year ended June 30, 2026, U.S. small-cap growth equities advanced despite periods of heightened volatility driven by geopolitical developments, changing interest rate expectations, and shifts in investor sentiment. Although market conditions evolved throughout the year, corporate fundamentals generally remained resilient, and company execution continued to be an important differentiator of investment performance. The Hood River Small Cap Growth Fund Institutional Share Class (HRSMX) returned +71.52% for the twelve months ended June 30, 2026, compared to +38.74% for the Russell 2000® Growth Index. WHAT FACTORS INFLUENCED PERFORMANCE The Fund’s outperformance over the trailing 12 months was driven primarily by strong stock selection. Key contributors included positions in the information technology, industrials and financials sectors, while healthcare, consumer discretionary and consumer staples detracted from relative performance. Throughout the fiscal year, portfolio decisions continued to be guided by fundamental company research and valuation discipline, with an emphasis on seeking to identify businesses demonstrating durable earnings growth and sustainable competitive advantages. The investment team remained focused on long-term business fundamentals, evaluating individual companies on their merits rather than repositioning the portfolio in response to short-term market developments.
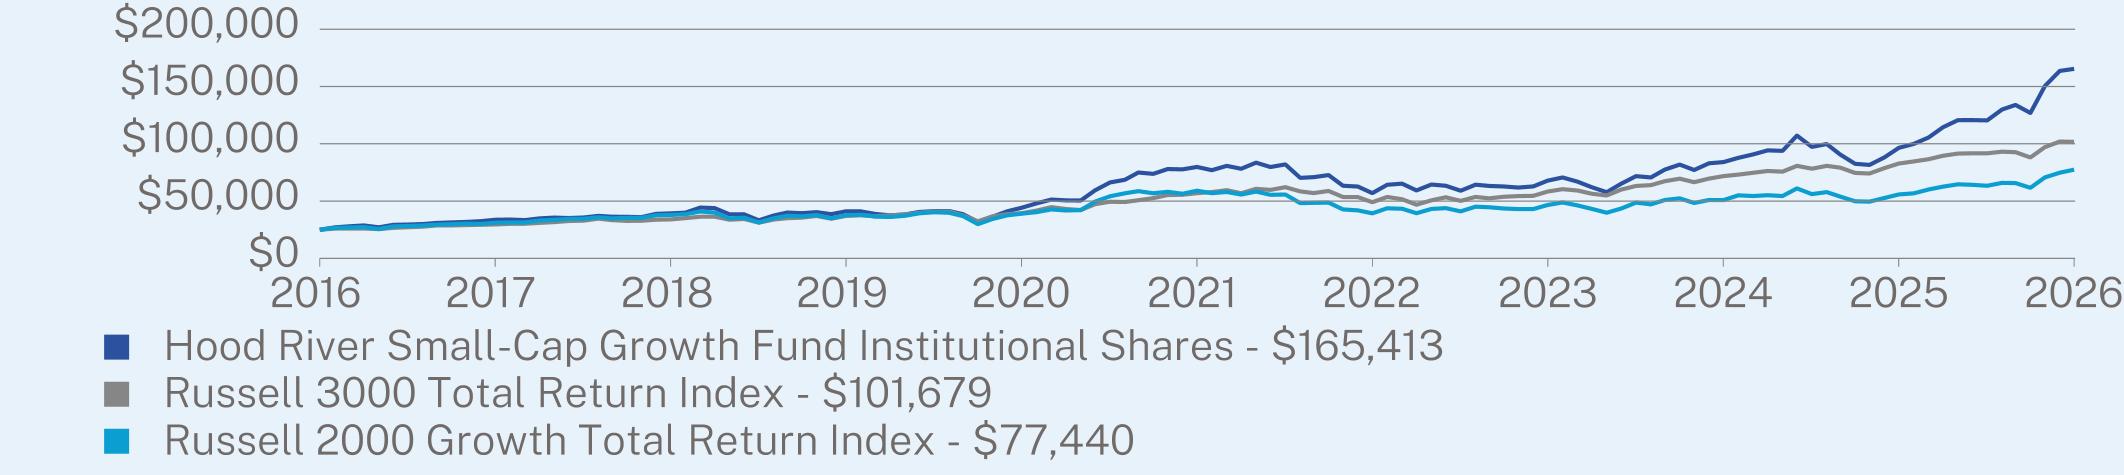
|
|||||||||||||||||||||||||||||||||||||||||||||||||||||||||||||||||||||||||
| Performance Past Does Not Indicate Future [Text] | The Fund’s past performance is not a good predictor of the Fund’s future performance. | |||||||||||||||||||||||||||||||||||||||||||||||||||||||||||||||||||||||||
| Line Graph [Table Text Block] | ![]() |
|||||||||||||||||||||||||||||||||||||||||||||||||||||||||||||||||||||||||
| Average Annual Return [Table Text Block] | ANNUAL AVERAGE TOTAL RETURN (%)
|
|||||||||||||||||||||||||||||||||||||||||||||||||||||||||||||||||||||||||
| No Deduction of Taxes [Text Block] | The graph and table do not reflect the deduction of taxes that a shareholder would pay on Fund distributions or redemption of Fund shares. | |||||||||||||||||||||||||||||||||||||||||||||||||||||||||||||||||||||||||
| Updated Performance Information Location [Text Block] | Visit https://hoodrivercapital.com/us-small-cap-growth-fund/ for more recent performance information.
|
|||||||||||||||||||||||||||||||||||||||||||||||||||||||||||||||||||||||||
| Net Assets | $ 6,649,932,603 | |||||||||||||||||||||||||||||||||||||||||||||||||||||||||||||||||||||||||
| Holdings Count | $ / shares | 111 | |||||||||||||||||||||||||||||||||||||||||||||||||||||||||||||||||||||||||
| Advisory Fees Paid, Amount | $ 46,185,281 | |||||||||||||||||||||||||||||||||||||||||||||||||||||||||||||||||||||||||
| Investment Company Portfolio Turnover | 70.00% | |||||||||||||||||||||||||||||||||||||||||||||||||||||||||||||||||||||||||
| Additional Fund Statistics [Text Block] | KEY FUND STATISTICS (as of June 30, 2026)
|
|||||||||||||||||||||||||||||||||||||||||||||||||||||||||||||||||||||||||
| Holdings [Text Block] | WHAT DID THE FUND INVEST IN? (as of June 30, 2026) Sector Breakdown (% of Net Assets) * ![]()
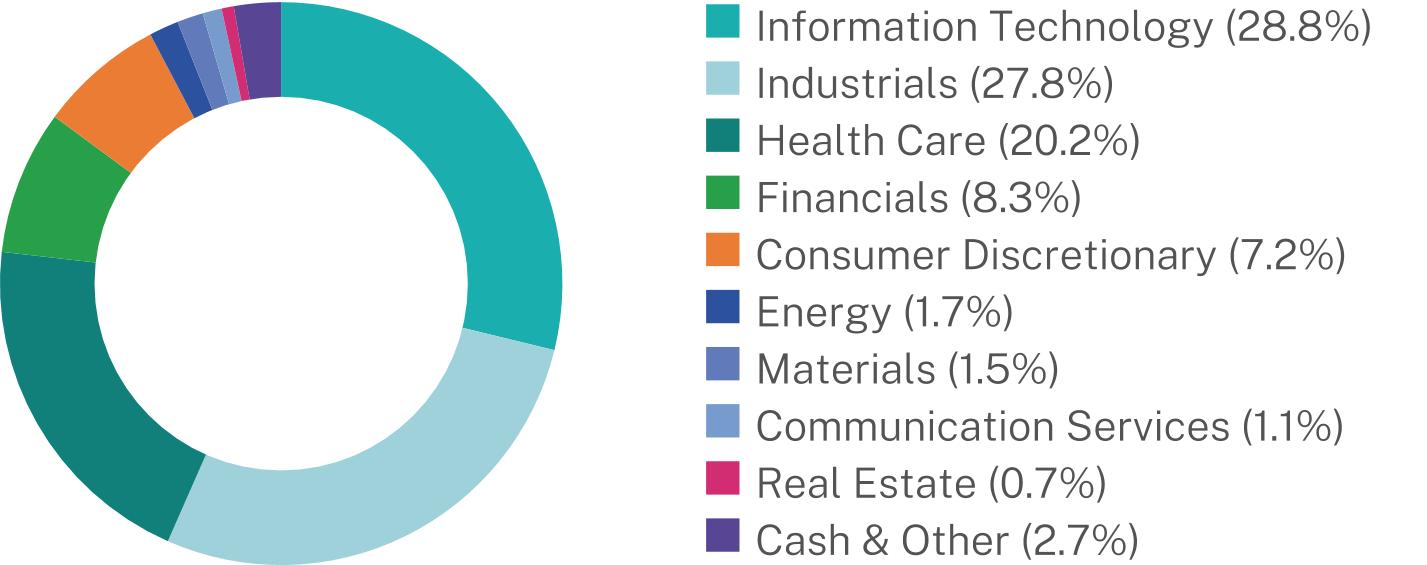
|
[16] | ||||||||||||||||||||||||||||||||||||||||||||||||||||||||||||||||||||||||
| Updated Prospectus Web Address | https://hoodrivercapital.com/us-small-cap-growth-fund/ | |||||||||||||||||||||||||||||||||||||||||||||||||||||||||||||||||||||||||
| Investor Shares | ||||||||||||||||||||||||||||||||||||||||||||||||||||||||||||||||||||||||||
| Shareholder Report [Line Items] | ||||||||||||||||||||||||||||||||||||||||||||||||||||||||||||||||||||||||||
| Fund Name | Hood River Small-Cap Growth Fund | |||||||||||||||||||||||||||||||||||||||||||||||||||||||||||||||||||||||||
| Class Name | Investor Shares | |||||||||||||||||||||||||||||||||||||||||||||||||||||||||||||||||||||||||
| Trading Symbol | HRSRX | |||||||||||||||||||||||||||||||||||||||||||||||||||||||||||||||||||||||||
| Annual or Semi-Annual Statement [Text Block] | This annual shareholder report contains important information about the Hood River Small-Cap Growth Fund (the “Fund”) for the period of July 1, 2025 to June 30, 2026. | |||||||||||||||||||||||||||||||||||||||||||||||||||||||||||||||||||||||||
| Additional Information [Text Block] | You can find additional information about the Fund at https://hoodrivercapital.com/us-small-cap-growth-fund/. You can also request this information by contacting us at (800) 497-2960 or info@hoodrivercapital.com. | |||||||||||||||||||||||||||||||||||||||||||||||||||||||||||||||||||||||||
| Additional Information Phone Number | (800) 497-2960 | |||||||||||||||||||||||||||||||||||||||||||||||||||||||||||||||||||||||||
| Additional Information Email | info@hoodrivercapital.com. | |||||||||||||||||||||||||||||||||||||||||||||||||||||||||||||||||||||||||
| Additional Information Website | https://hoodrivercapital.com/us-small-cap-growth-fund/ | |||||||||||||||||||||||||||||||||||||||||||||||||||||||||||||||||||||||||
| Expenses [Text Block] | WHAT WERE THE FUND COSTS FOR THE PAST YEAR? (based on a hypothetical $10,000 investment)
|
|||||||||||||||||||||||||||||||||||||||||||||||||||||||||||||||||||||||||
| Expenses Paid, Amount | $ 178 | |||||||||||||||||||||||||||||||||||||||||||||||||||||||||||||||||||||||||
| Expense Ratio, Percent | 1.31% | |||||||||||||||||||||||||||||||||||||||||||||||||||||||||||||||||||||||||
| Factors Affecting Performance [Text Block] | HOW DID THE FUND PERFORM LAST YEAR AND WHAT AFFECTED ITS PERFORMANCE? During the fiscal year ended June 30, 2026, U.S. small-cap growth equities advanced despite periods of heightened volatility driven by geopolitical developments, changing interest rate expectations, and shifts in investor sentiment. Although market conditions evolved throughout the year, corporate fundamentals generally remained resilient, and company execution continued to be an important differentiator of investment performance. The Hood River Small Cap Growth Fund Investor Share Class (HRSRX) returned +71.09% for the twelve months ended June 30, 2026, compared to +38.74% for the Russell 2000® Growth Index. WHAT FACTORS INFLUENCED PERFORMANCE The Fund’s outperformance over the trailing 12 months was driven primarily by strong stock selection. Key contributors included positions in the information technology, industrials and financials sectors, while healthcare, consumer discretionary and consumer staples detracted from relative performance. Throughout the fiscal year, portfolio decisions continued to be guided by fundamental company research and valuation discipline, with an emphasis on seeking to identify businesses demonstrating durable earnings growth and sustainable competitive advantages. The investment team remained focused on long-term business fundamentals, evaluating individual companies on their merits rather than repositioning the portfolio in response to short-term market developments.
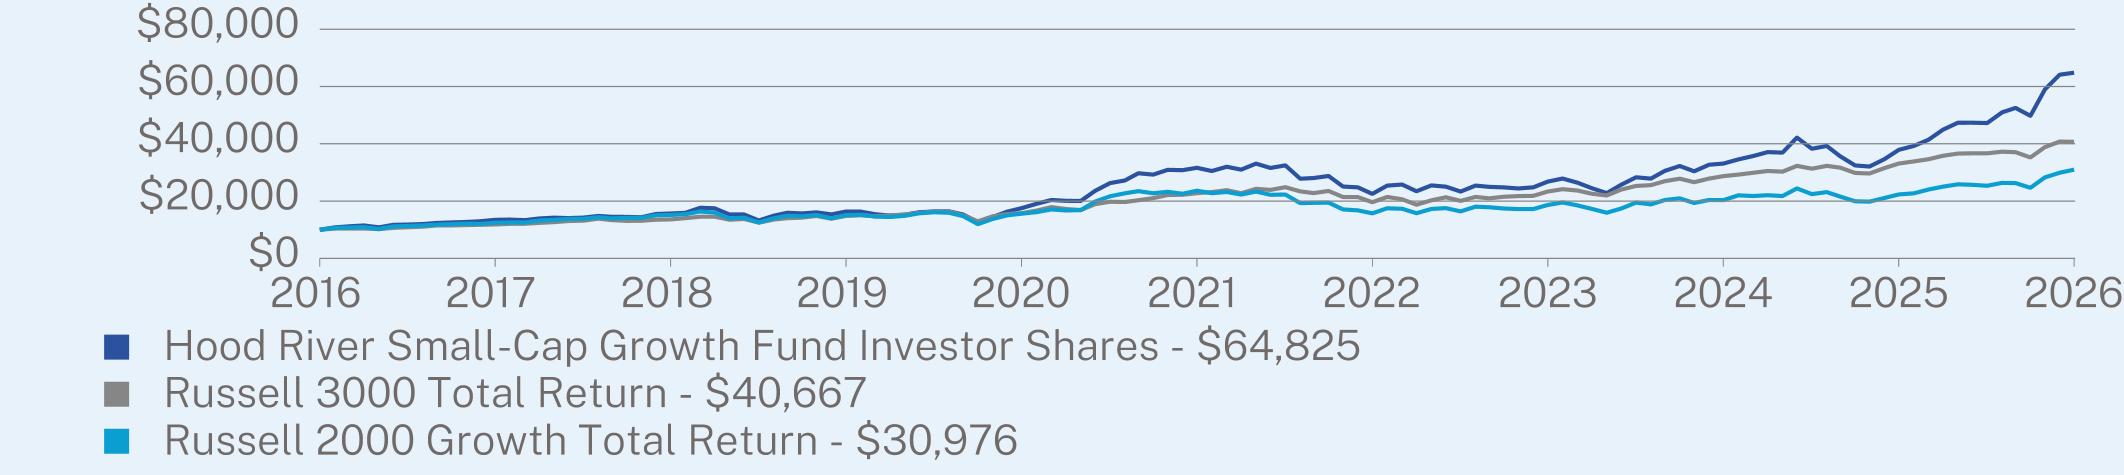
|
|||||||||||||||||||||||||||||||||||||||||||||||||||||||||||||||||||||||||
| Performance Past Does Not Indicate Future [Text] | The Fund’s past performance is not a good predictor of the Fund’s future performance. | |||||||||||||||||||||||||||||||||||||||||||||||||||||||||||||||||||||||||
| Line Graph [Table Text Block] | ![]() |
|||||||||||||||||||||||||||||||||||||||||||||||||||||||||||||||||||||||||
| Average Annual Return [Table Text Block] | ANNUAL AVERAGE TOTAL RETURN (%)
|
|||||||||||||||||||||||||||||||||||||||||||||||||||||||||||||||||||||||||
| No Deduction of Taxes [Text Block] | The graph and table do not reflect the deduction of taxes that a shareholder would pay on Fund distributions or redemption of Fund shares. | |||||||||||||||||||||||||||||||||||||||||||||||||||||||||||||||||||||||||
| Updated Performance Information Location [Text Block] | Visit https://hoodrivercapital.com/us-small-cap-growth-fund/ for more recent performance information.
|
|||||||||||||||||||||||||||||||||||||||||||||||||||||||||||||||||||||||||
| Net Assets | $ 6,649,932,603 | |||||||||||||||||||||||||||||||||||||||||||||||||||||||||||||||||||||||||
| Holdings Count | $ / shares | 111 | |||||||||||||||||||||||||||||||||||||||||||||||||||||||||||||||||||||||||
| Advisory Fees Paid, Amount | $ 46,185,281 | |||||||||||||||||||||||||||||||||||||||||||||||||||||||||||||||||||||||||
| Investment Company Portfolio Turnover | 70.00% | |||||||||||||||||||||||||||||||||||||||||||||||||||||||||||||||||||||||||
| Additional Fund Statistics [Text Block] | KEY FUND STATISTICS (as of June 30, 2026)
|
|||||||||||||||||||||||||||||||||||||||||||||||||||||||||||||||||||||||||
| Holdings [Text Block] | WHAT DID THE FUND INVEST IN? (as of June 30, 2026) Sector Breakdown (% of Net Assets) * ![]()
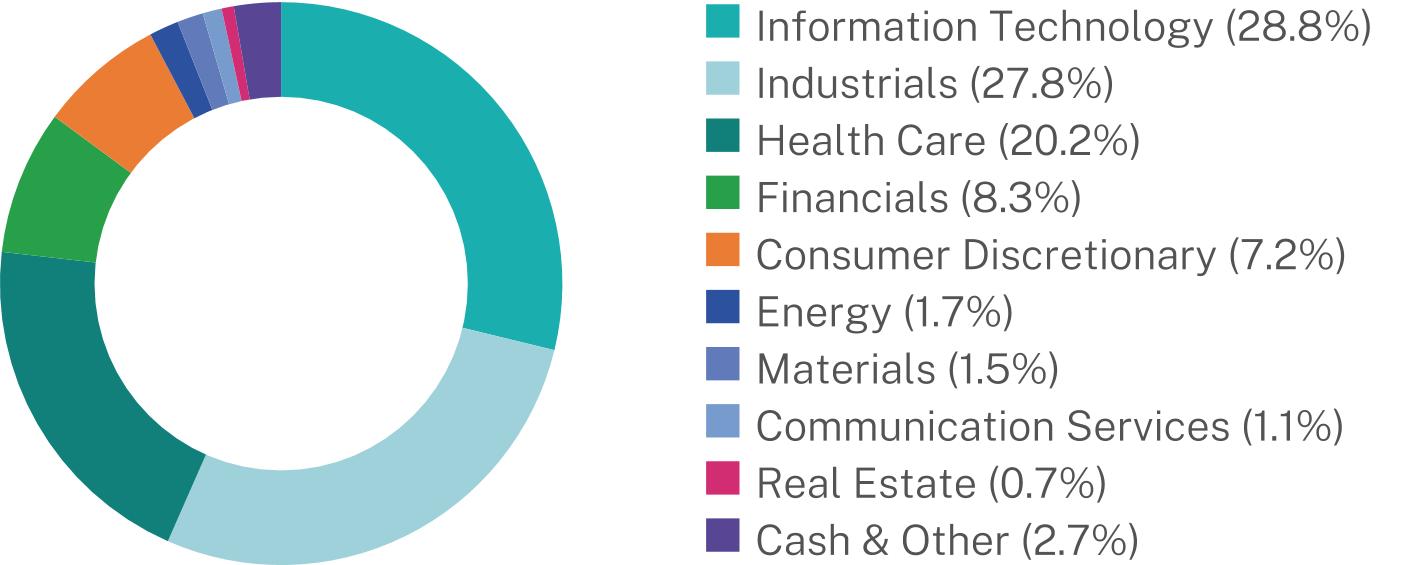
|
[17] | ||||||||||||||||||||||||||||||||||||||||||||||||||||||||||||||||||||||||
| Updated Prospectus Web Address | https://hoodrivercapital.com/us-small-cap-growth-fund/ | |||||||||||||||||||||||||||||||||||||||||||||||||||||||||||||||||||||||||
| Retirement Shares | ||||||||||||||||||||||||||||||||||||||||||||||||||||||||||||||||||||||||||
| Shareholder Report [Line Items] | ||||||||||||||||||||||||||||||||||||||||||||||||||||||||||||||||||||||||||
| Fund Name | Hood River Small-Cap Growth Fund | |||||||||||||||||||||||||||||||||||||||||||||||||||||||||||||||||||||||||
| Class Name | Retirement Shares | |||||||||||||||||||||||||||||||||||||||||||||||||||||||||||||||||||||||||
| Trading Symbol | HRSIX | |||||||||||||||||||||||||||||||||||||||||||||||||||||||||||||||||||||||||
| Annual or Semi-Annual Statement [Text Block] | This annual shareholder report contains important information about the Hood River Small-Cap Growth Fund (the “Fund”) for the period of July 1, 2025 to June 30, 2026. | |||||||||||||||||||||||||||||||||||||||||||||||||||||||||||||||||||||||||
| Additional Information [Text Block] | You can find additional information about the Fund at https://hoodrivercapital.com/us-small-cap-growth-fund/. You can also request this information by contacting us at (800) 497-2960 or info@hoodrivercapital.com. | |||||||||||||||||||||||||||||||||||||||||||||||||||||||||||||||||||||||||
| Additional Information Phone Number | (800) 497-2960 | |||||||||||||||||||||||||||||||||||||||||||||||||||||||||||||||||||||||||
| Additional Information Email | info@hoodrivercapital.com. | |||||||||||||||||||||||||||||||||||||||||||||||||||||||||||||||||||||||||
| Additional Information Website | https://hoodrivercapital.com/us-small-cap-growth-fund/ | |||||||||||||||||||||||||||||||||||||||||||||||||||||||||||||||||||||||||
| Expenses [Text Block] | WHAT WERE THE FUND COSTS FOR THE PAST YEAR? (based on a hypothetical $10,000 investment)
|
|||||||||||||||||||||||||||||||||||||||||||||||||||||||||||||||||||||||||
| Expenses Paid, Amount | $ 130 | |||||||||||||||||||||||||||||||||||||||||||||||||||||||||||||||||||||||||
| Expense Ratio, Percent | 0.96% | |||||||||||||||||||||||||||||||||||||||||||||||||||||||||||||||||||||||||
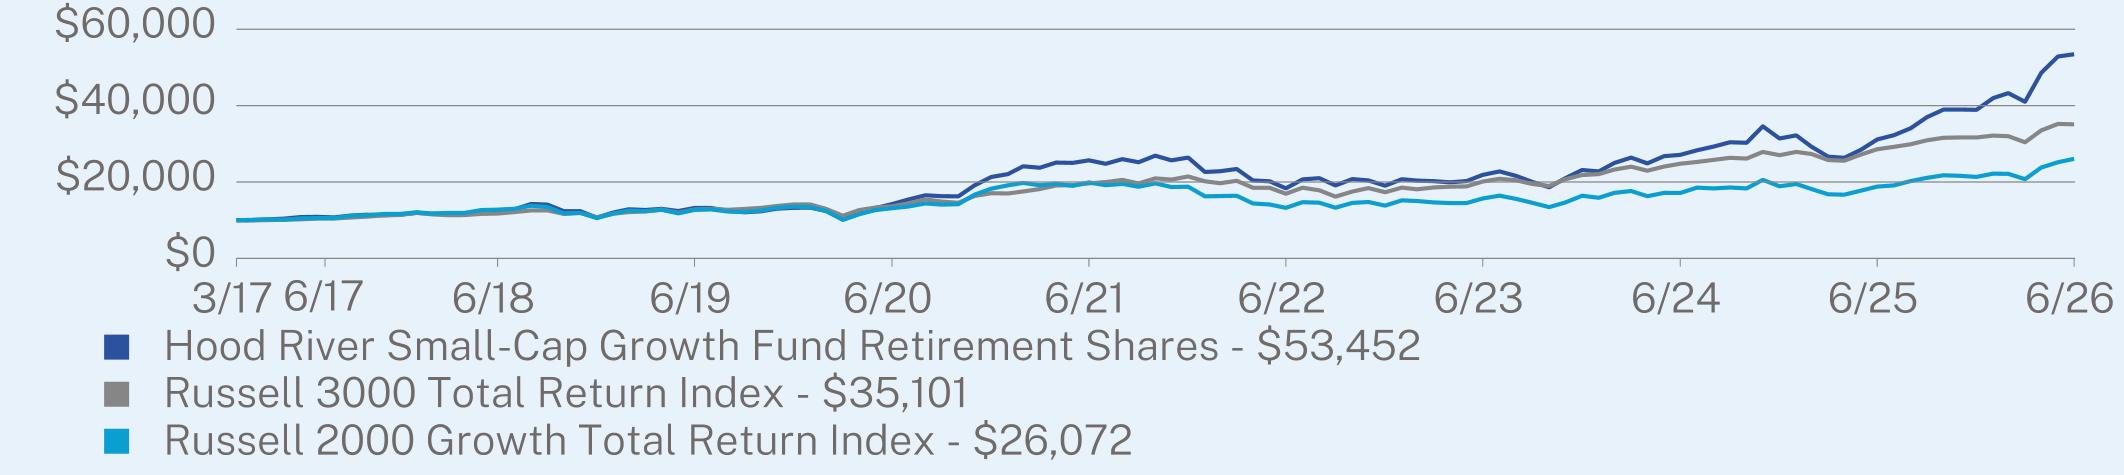
| Factors Affecting Performance [Text Block] | HOW DID THE FUND PERFORM LAST YEAR AND WHAT AFFECTED ITS PERFORMANCE? During the fiscal year ended June 30, 2026, U.S. small-cap growth equities advanced despite periods of heightened volatility driven by geopolitical developments, changing interest rate expectations, and shifts in investor sentiment. Although market conditions evolved throughout the year, corporate fundamentals generally remained resilient, and company execution continued to be an important differentiator of investment performance. The Hood River Small Cap Growth Fund Retirement Share Class (HRSIX) returned +71.69% for the twelve months ended June 30, 2026, compared to +38.74% for the Russell 2000® Growth Index. WHAT FACTORS INFLUENCED PERFORMANCE The Fund’s outperformance over the trailing 12 months was driven primarily by strong stock selection. Key contributors included positions in the information technology, industrials and financials sectors, while healthcare, consumer discretionary and consumer staples detracted from relative performance. Throughout the fiscal year, portfolio decisions continued to be guided by fundamental company research and valuation discipline, with an emphasis on seeking to identify businesses demonstrating durable earnings growth and sustainable competitive advantages. The investment team remained focused on long-term business fundamentals, evaluating individual companies on their merits rather than repositioning the portfolio in response to short-term market developments.
|
|||||||||||||||||||||||||||||||||||||||||||||||||||||||||||||||||||||||||
| Performance Past Does Not Indicate Future [Text] | The Fund’s past performance is not a good predictor of the Fund’s future performance. | |||||||||||||||||||||||||||||||||||||||||||||||||||||||||||||||||||||||||
| Line Graph [Table Text Block] | ![]() |
|||||||||||||||||||||||||||||||||||||||||||||||||||||||||||||||||||||||||
| Average Annual Return [Table Text Block] | ANNUAL AVERAGE TOTAL RETURN (%)
|
|||||||||||||||||||||||||||||||||||||||||||||||||||||||||||||||||||||||||
| No Deduction of Taxes [Text Block] | The graph and table do not reflect the deduction of taxes that a shareholder would pay on Fund distributions or redemption of Fund shares. | |||||||||||||||||||||||||||||||||||||||||||||||||||||||||||||||||||||||||
| Updated Performance Information Location [Text Block] | Visit https://hoodrivercapital.com/us-small-cap-growth-fund/ for more recent performance information.
|
|||||||||||||||||||||||||||||||||||||||||||||||||||||||||||||||||||||||||
| Net Assets | $ 6,649,932,603 | |||||||||||||||||||||||||||||||||||||||||||||||||||||||||||||||||||||||||
| Holdings Count | $ / shares | 111 | |||||||||||||||||||||||||||||||||||||||||||||||||||||||||||||||||||||||||
| Advisory Fees Paid, Amount | $ 46,185,281 | |||||||||||||||||||||||||||||||||||||||||||||||||||||||||||||||||||||||||
| Investment Company Portfolio Turnover | 70.00% | |||||||||||||||||||||||||||||||||||||||||||||||||||||||||||||||||||||||||
| Additional Fund Statistics [Text Block] | KEY FUND STATISTICS (as of June 30, 2026)
|
|||||||||||||||||||||||||||||||||||||||||||||||||||||||||||||||||||||||||
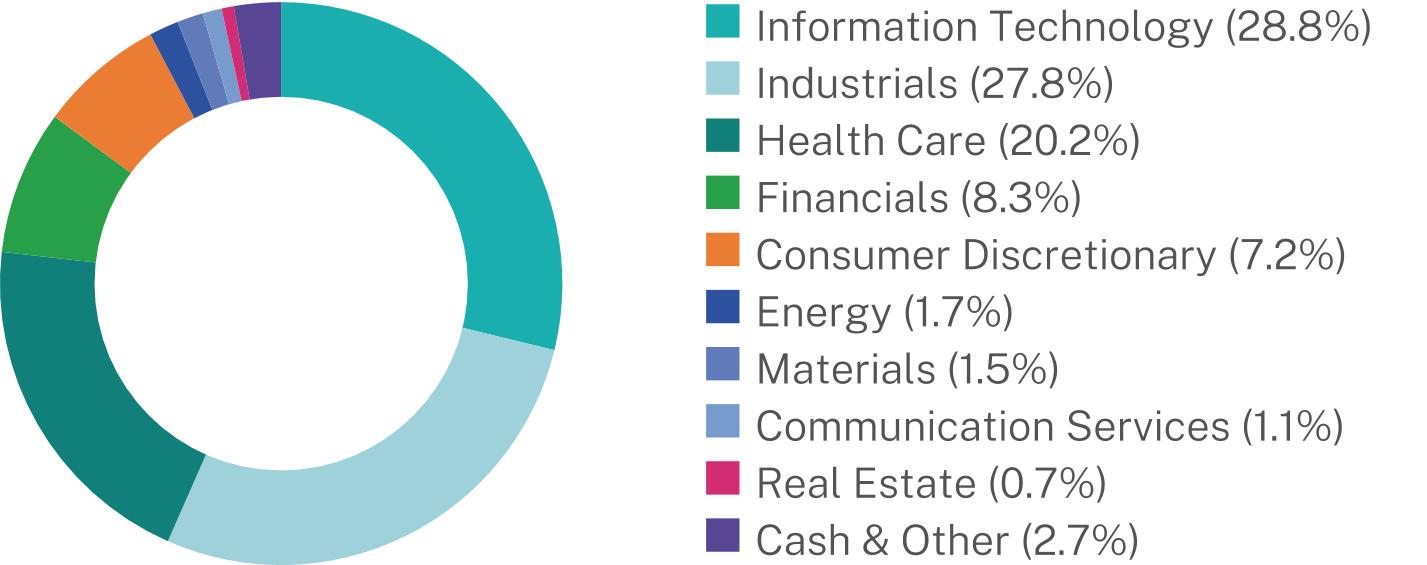
| Holdings [Text Block] | WHAT DID THE FUND INVEST IN? (as of June 30, 2026) Sector Breakdown (% of Net Assets) * ![]()
|
[18] | ||||||||||||||||||||||||||||||||||||||||||||||||||||||||||||||||||||||||
| Updated Prospectus Web Address | https://hoodrivercapital.com/us-small-cap-growth-fund/ | |||||||||||||||||||||||||||||||||||||||||||||||||||||||||||||||||||||||||
| ||||||||||||||||||||||||||||||||||||||||||||||||||||||||||||||||||||||||||