Fund Costs
(based on hypothetical $10,000 investment)
| Fund | Costs of a $10,000 investment | Costs paid as a percentage of a $10,000 investment (annualized) |
| Berkshire Focus Fund | $127.38 | 1.94% |
Management’s Discussion of Performance

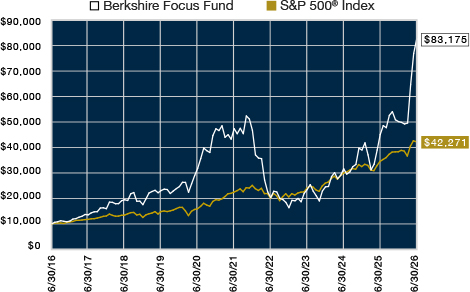
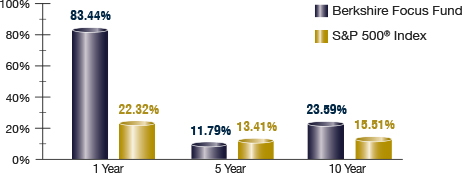
For the six-month period ended June 30, 2026, the Berkshire Focus Fund significantly outperformed its primary benchmark index. The Fund generated a total return of 64.82% while the S&P 500® Index—which we consider to be the Fund’s primary benchmark index—produced a total return of 10.21% over the same period. A $10,000 investment in our Fund over 10 years starting on June 30, 2016, grew to $83,175. This was a +23.59% average annual compounded return. A $10,000 investment in the S&P 500® over the same period grew to $42,271. This was a +15.51% average annual compounded return.
During the first half of 2026, the artificial intelligence (AI) build-out shifted decisively from software deployment into an aggressive, hardware-centric scramble to solve severe physical-world bottlenecks. While broader markets grappled with "higher-for-longer" interest rate anxieties and the outbreak of the Iran war, hardware infrastructure effectively decoupled from these macro and geopolitical headwinds. Capital across the industry rotated violently away from traditional software applications and legacy platforms prone to AI-driven disruption, reallocating instead into hard assets as hyperscalers accelerated capital expenditures to unprecedented levels. This massive deployment of capital ran into severe constraints on compute and an acute supply squeeze in high-bandwidth memory. By maintaining our deliberate portfolio positioning and concentrating heavily on key semiconductor leaders, we successfully positioned the portfolio at the exact choke points of the AI revolution. Looking ahead, we see immense opportunity across the AI landscape, particularly within companies structurally positioned to capture outsized gains from the accelerating capital deployment toward advanced silicon architectures and large-scale datacenter infrastructure.
Our investments in Advanced Micro Devices (AMD), Arm Holdings (ARM), Bloom Energy (BE), Marvell Technology (MRVL), Micron Technology (MU), Nebius (NBIS) and Western Digital (WDC) were all contributors to the Fund’s performance during the period. However, some of our investments detracted from the Fund’s performance—these included Broadcom (AVGO), NVIDIA (NVDA), Palantir (PLTR), Cloudflare (NET) and MongoDB (MDB).
Fund Statistics
Net Assets: $461.3 million
Portfolio Holdings: 27
Portfolio Turnover: 1980.9%
Total Advisory Fees Paid: $2,525,156