Shareholder Report
|
12 Months Ended |
|
Jun. 30, 2026
USD ($)
Holding
|
|---|
| Shareholder Report [Line Items] |
|
| Document Type |
N-CSR
|
| Amendment Flag |
false
|
| Registrant Name |
ASSET MANAGEMENT FUND
|
| Entity Central Index Key |
0000705318
|
| Entity Investment Company Type |
N-1A
|
| Document Period End Date |
Jun. 30, 2026
|
| Shareholder Report Annual or Semi-Annual |
Annual Shareholder Report
|
| C000189198 |
|
| Shareholder Report [Line Items] |
|
| Fund Name |
AAMA Equity Fund
|
| Trading Symbol |
AMFEX
|
| Annual or Semi-Annual Statement [Text Block] |
This annual shareholder report contains important information about AAMA Equity Fund for the period of July 1, 2025 to June 30, 2026.
|
| Additional Information [Text Block] |
You can find additional information about the Fund at https://www.aamafunds.com/prospectuses-and-reports.html. You can also request this information by contacting us at (800) 701-9502
|
| Additional Information Phone Number |
(800) 701-9502
|
| Additional Information Website |
https://www.aamafunds.com/prospectuses-and-reports.html
|
| Expenses [Text Block] |
What were the Fund’s annualized costs for the last year?(based on a hypothetical $10,000 investment) Table SummaryFund Name | Costs of a $10,000 investment | Costs paid as a percentage of a $10,000 investment |
|---|
AAMA Equity Fund | $130 | 1.16% |
|---|
|
| Expenses Paid, Amount |
$ 130
|
| Expense Ratio, Percent |
1.16%
|
| Factors Affecting Performance [Text Block] |
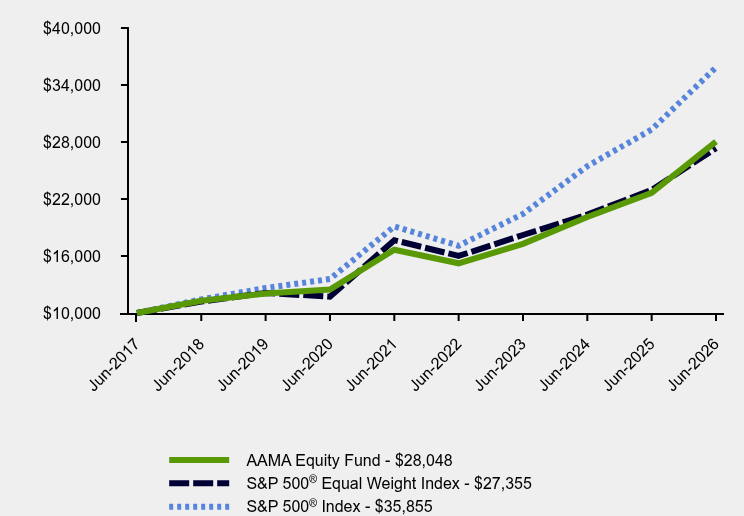
How did the Fund perform during the reporting period? The AAMA Equity Fund returned 23.81% for the twelve months ended June 30, 2026. This may be compared to the S&P 500® Index return of 22.32% and the S&P 500® Equal Weight Index return of 19.20%. The S&P MidCap 400® and SmallCap 600® indices returned 25.87% and 37.49%, respectively. The difference between the capitalization-weighted and equal-weighted indices has narrowed from January to June 2026, although large cap technology issues, led by semi-conductor companies continue to dominate recent market returns. Relative to the Equal-Weighted S&P 500®, The AAMA Equity Fund equity holdings experienced a 8.6% active return contribution over the last twelve months and 23.3% over the last three years. Sector allocations have impacted the active return modestly (1.70% for 1 year and 3.22% over three years). Stock selection boosted active returns by 6.89% for 1 year and 20.13% over three years. The Fund has been over-weight technology and communications companies and under-weight financial companies. The AAMA Equity Fund continues to maintain a portfolio of high-quality large cap companies. One key measure of quality is the Debt to EBITDA ratio. The Fund’s equity holdings average 2.29 times leverage, which is significantly less than the 4.00 leverage for a universe of 1100 large companies. We appreciate your investment in our Funds and encourage you to continue to work with your Financial Advisor in allocating your portfolio to achieve your long-term investment goals and objectives. |
| Performance Past Does Not Indicate Future [Text] |
The Fund’s past performance is not a good predictor of how the Fund will perform in the future.
|
| Line Graph [Table Text Block] |
Table Summary | AAMA Equity Fund | S&P 500® Equal Weight Index | S&P 500® Index |
|---|
Jun-2017 | $10,000 | $10,000 | $10,000 |
|---|
Jun-2018 | $11,285 | $11,198 | $11,437 |
|---|
Jun-2019 | $12,058 | $12,114 | $12,629 |
|---|
Jun-2020 | $12,469 | $11,721 | $13,577 |
|---|
Jun-2021 | $16,664 | $17,664 | $19,115 |
|---|
Jun-2022 | $15,232 | $16,007 | $17,086 |
|---|
Jun-2023 | $17,277 | $18,210 | $20,434 |
|---|
Jun-2024 | $20,109 | $20,357 | $25,452 |
|---|
Jun-2025 | $22,655 | $22,949 | $29,311 |
|---|
Jun-2026 | $28,048 | $27,355 | $35,855 |
|---|
|
| Average Annual Return [Table Text Block] |
Table Summary | 1 Year | 5 Years | Since Inception (June 30, 2017) |
|---|
AAMA Equity Fund | 23.81% | 10.98% | 12.14% |
|---|
S&P 500® Equal Weight Index | 19.20% | 9.14% | 11.83% |
|---|
S&P 500® Index | 22.32% | 13.41% | 15.24% |
|---|
|
| Performance Inception Date |
Jun. 30, 2017
|
| No Deduction of Taxes [Text Block] |
The graph and table do not reflect the deduction of taxes that a shareholder would pay on fund distributions or redemption of fund shares.
|
| AssetsNet |
$ 401,223,580
|
| Holdings Count | Holding |
39
|
| Advisory Fees Paid, Amount |
$ 3,911,176
|
| InvestmentCompanyPortfolioTurnover |
0.00%
|
| Additional Fund Statistics [Text Block] |
- Net Assets$401,223,580
- Number of Portfolio Holdings39
- Advisory Fee $3,911,176
- Portfolio Turnover0%
|
| Holdings [Text Block] |
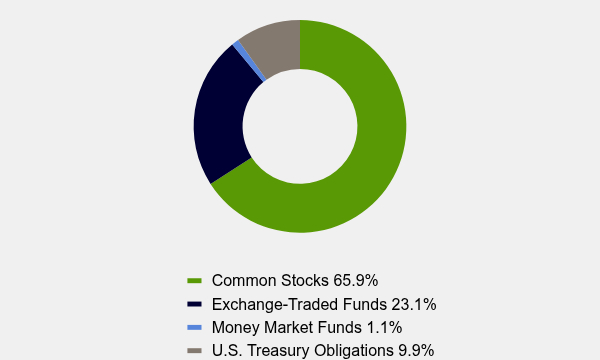
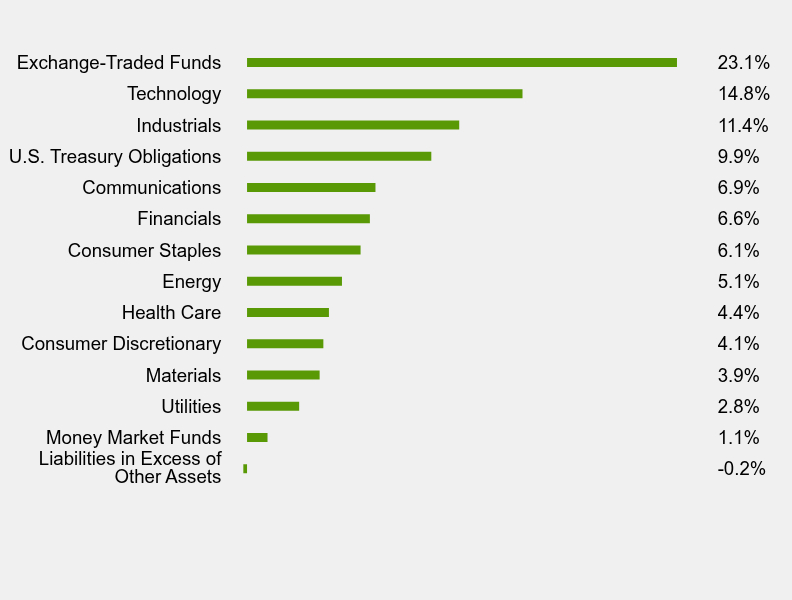
Asset Weighting (% of total investments)Table SummaryValue | Value |
|---|
Common Stocks | 65.9% | Exchange-Traded Funds | 23.1% | Money Market Funds | 1.1% | U.S. Treasury Obligations | 9.9% | Sector Weighting (% of net assets)Table SummaryValue | Value |
|---|
Liabilities in Excess of Other Assets | -0.2% | Money Market Funds | 1.1% | Utilities | 2.8% | Materials | 3.9% | Consumer Discretionary | 4.1% | Health Care | 4.4% | Energy | 5.1% | Consumer Staples | 6.1% | Financials | 6.6% | Communications | 6.9% | U.S. Treasury Obligations | 9.9% | Industrials | 11.4% | Technology | 14.8% | Exchange-Traded Funds | 23.1% | |
| Largest Holdings [Text Block] |
Top 10 Holdings (% of net assets)Table SummaryHolding Name | % of Net Assets |
|---|
Vanguard S&P 500 ETF | 12.5% |
|---|
iShares Core S&P 500 ETF | 10.6% |
|---|
U.S. Treasury Bills, 3.658%, due 07/23/26 | 6.2% |
|---|
Freeport-McMoRan, Inc. | 3.9% |
|---|
Cisco Systems, Inc. | 3.9% |
|---|
U.S. Treasury Bills, 3.756%, due 09/24/26 | 3.7% |
|---|
WW Grainger, Inc. | 3.4% |
|---|
Alphabet, Inc. - Class A | 3.4% |
|---|
Exxon Mobil Corporation | 3.1% |
|---|
Johnson & Johnson | 3.0% |
|---|
|
| Material Fund Change [Text Block] |
No material changes occurred during the year ended June 30, 2026. |
| C000189199 |
|
| Shareholder Report [Line Items] |
|
| Fund Name |
AAMA Income Fund
|
| Trading Symbol |
AMFIX
|
| Annual or Semi-Annual Statement [Text Block] |
This annual shareholder report contains important information about AAMA Income Fund for the period of July 1, 2025 to June 30, 2026.
|
| Additional Information [Text Block] |
You can find additional information about the Fund at https://www.aamafunds.com/prospectuses-and-reports.html. You can also request this information by contacting us at (800) 701-9502
|
| Additional Information Phone Number |
(800) 701-9502
|
| Additional Information Website |
https://www.aamafunds.com/prospectuses-and-reports.html
|
| Expenses [Text Block] |
What were the Fund’s annualized costs for the last year?(based on a hypothetical $10,000 investment) Table SummaryFund Name | Costs of a $10,000 investment | Costs paid as a percentage of a $10,000 investment |
|---|
AAMA Income Fund | $84 | 0.83% |
|---|
|
| Expenses Paid, Amount |
$ 84
|
| Expense Ratio, Percent |
0.83%
|
| Performance Past Does Not Indicate Future [Text] |
The Fund’s past performance is not a good predictor of how the Fund will perform in the future.
|
| Line Graph [Table Text Block] |
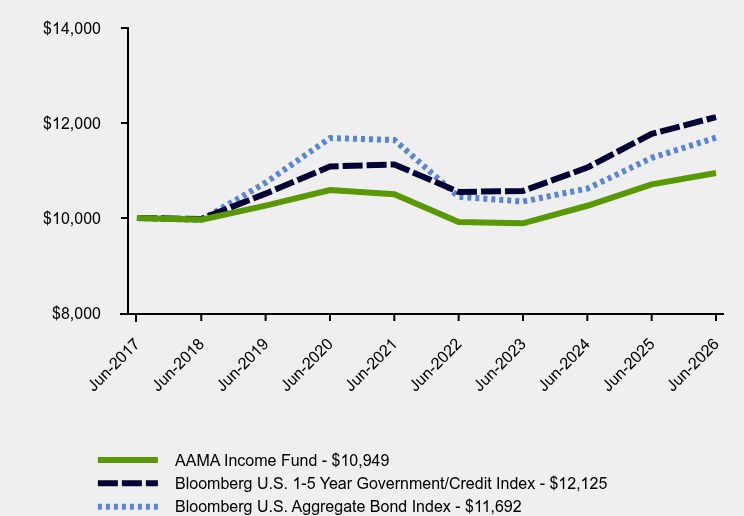
Table Summary | AAMA Income Fund | Bloomberg U.S. 1-5 Year Government/Credit Index | Bloomberg U.S. Aggregate Bond Index |
|---|
Jun-2017 | $10,000 | $10,000 | $10,000 |
|---|
Jun-2018 | $9,966 | $9,980 | $9,960 |
|---|
Jun-2019 | $10,262 | $10,513 | $10,744 |
|---|
Jun-2020 | $10,587 | $11,084 | $11,683 |
|---|
Jun-2021 | $10,502 | $11,128 | $11,644 |
|---|
Jun-2022 | $9,917 | $10,549 | $10,446 |
|---|
Jun-2023 | $9,888 | $10,570 | $10,348 |
|---|
Jun-2024 | $10,258 | $11,062 | $10,620 |
|---|
Jun-2025 | $10,709 | $11,772 | $11,265 |
|---|
Jun-2026 | $10,949 | $12,125 | $11,692 |
|---|
|
| Average Annual Return [Table Text Block] |
Average Annual Total Returns Table Summary | 1 Year | 5 Years | Since Inception (June 30, 2017) |
|---|
AAMA Income Fund | 2.24% | 0.84% | 1.01% |
|---|
Bloomberg U.S. 1-5 Year Government/Credit Index | 3.00% | 1.73% | 2.16% |
|---|
Bloomberg U.S. Aggregate Bond Index | 3.79% | 0.08% | 1.75% |
|---|
The Fund’s past performance is not a good predictor of how the Fund will perform in the future. The graph and table do not reflect the deduction of taxes that a shareholder would pay on fund distributions or redemption of fund shares. For updated performance call (800) 701-9502. |
| Performance Inception Date |
Jun. 30, 2017
|
| No Deduction of Taxes [Text Block] |
The graph and table do not reflect the deduction of taxes that a shareholder would pay on fund distributions or redemption of fund shares.
|
| AssetsNet |
$ 117,759,269
|
| Holdings Count | Holding |
20
|
| Advisory Fees Paid, Amount |
$ 745,585
|
| InvestmentCompanyPortfolioTurnover |
18.00%
|
| Additional Fund Statistics [Text Block] |
- Net Assets$117,759,269
- Number of Portfolio Holdings20
- Advisory Fee (net of waivers)$745,585
- Portfolio Turnover18%
|
| Holdings [Text Block] |
Asset Weighting (% of total investments)Table SummaryValue | Value |
|---|
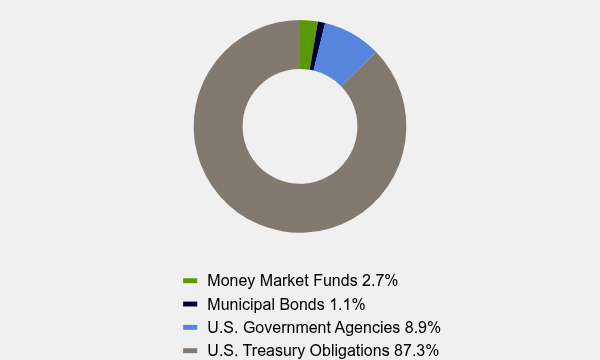
Money Market Funds | 2.7% | Municipal Bonds | 1.1% | U.S. Government Agencies | 8.9% | U.S. Treasury Obligations | 87.3% | Sector Weighting (% of net assets)Table SummaryValue | Value |
|---|
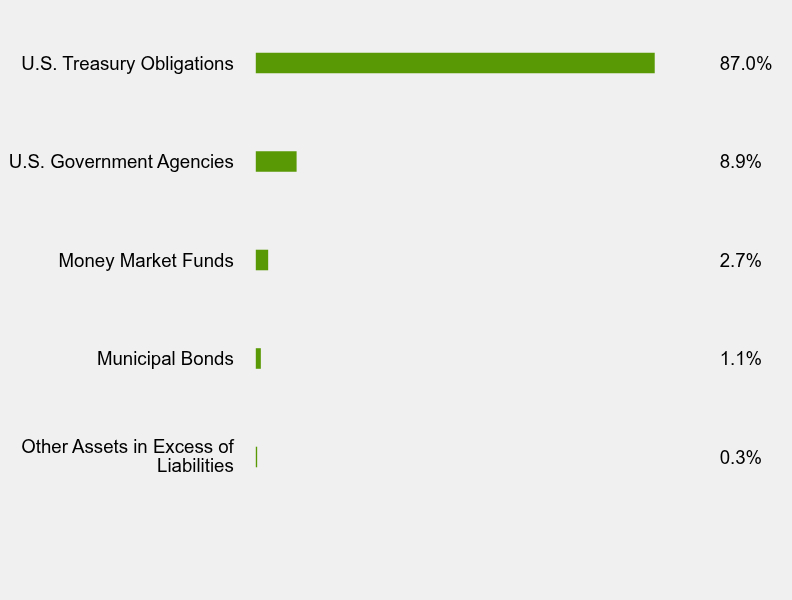
Other Assets in Excess of Liabilities | 0.3% | Municipal Bonds | 1.1% | Money Market Funds | 2.7% | U.S. Government Agencies | 8.9% | U.S. Treasury Obligations | 87.0% | Top 10 Holdings (% of net assets)Table SummaryHolding Name | % of Net Assets |
|---|
U.S. Treasury Notes, 4.625%, due 11/15/26 | 12.8% |
|---|
U.S. Treasury Notes, 3.500%, due 11/30/30 | 8.3% |
|---|
U.S. Treasury Notes, 0.500%, due 04/30/27 | 8.2% |
|---|
U.S. Treasury Notes, 1.125%, due 02/29/28 | 8.1% |
|---|
Federal National Mortgage Association, 0.750%, due 10/08/27 | 4.9% |
|---|
U.S. Treasury Notes, 4.125%, due 10/31/27 | 4.2% |
|---|
U.S. Treasury Notes, 4.125%, due 03/31/29 | 4.2% |
|---|
U.S. Treasury Notes, 4.125%, due 11/30/29 | 4.2% |
|---|
U.S. Treasury Notes, 4.000%, due 05/31/28 | 4.2% |
|---|
U.S. Treasury Notes, 4.000%, due 07/31/29 | 4.2% |
|---|
|
| Material Fund Change [Text Block] |
No material changes occurred during the year ended June 30, 2026. |
| C000041028 |
|
| Shareholder Report [Line Items] |
|
| Fund Name |
Large Cap Equity Fund
|
| Class Name |
Class AMF
|
| Trading Symbol |
IICAX
|
| Annual or Semi-Annual Statement [Text Block] |
This annual shareholder report contains important information about Large Cap Equity Fund for the period of July 1, 2025 to June 30, 2026.
|
| Additional Information [Text Block] |
You can find additional information about the Fund at https://www.amffunds.com/html/materials.html. You can also request this information by contacting us at 1-800-247-9780
|
| Additional Information Phone Number |
1-800-247-9780
|
| Additional Information Website |
https://www.amffunds.com/html/materials.html
|
| Expenses [Text Block] |
What were the Fund’s annualized costs for the last year?(based on a hypothetical $10,000 investment) Table SummaryClass Name | Costs of a $10,000 investment | Costs paid as a percentage of a $10,000 investment |
|---|
Class AMF | $180 | 1.65% |
|---|
|
| Expenses Paid, Amount |
$ 180
|
| Expense Ratio, Percent |
1.65%
|
| Factors Affecting Performance [Text Block] |
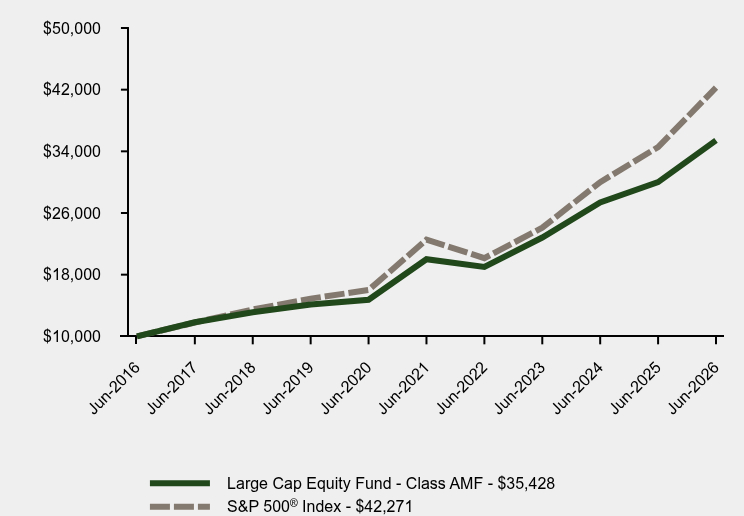
How did the Fund perform during the reporting period? For the twelve months ended June 30, 2026, the Large Cap Equity Fund Class AMF Shares returned 18.08% while the S&P 500® Index (Total Return) generated 22.32%. The Morningstar Large Blend category average returned 20.23%. According to Morningstar, this places the Fund in the top 68% of all Large Cap Blend stock funds for the past year. For the three-and-five year periods ended June 30, 2026, the Fund ranked in the 78th percentile and the 51st percentile, respectively, of the Morningstar Large Blend Category. For the twelve months ended June 30, 2026, high yield, value and low volatility stocks underperformed the benchmark while momentum and growth outperformed. Since the Fund is oriented to value and higher than average dividend yield, this primarily caused the underperformance vs the benchmark. The Fund’s investment adviser, System Two Advisors, continues to prefer companies with low share prices relative to cash flow and sales, and higher than average dividend yields. These are factors that we believe provide more stability and less volatility when markets underperform. In fact, the Fund continues to generate lower return volatility than the S&P 500® Index as well as the average fund in the Morningstar Large Blend category. The Fund’s investment adviser, System Two Advisors, relies on a blend of fundamental and quantitative analysis. We believe that the investment process of System Two Advisors provides an attractive risk-adjusted approach for our shareholders. |
| Performance Past Does Not Indicate Future [Text] |
The Fund’s past performance is not a good predictor of how the Fund will perform in the future.
|
| Line Graph [Table Text Block] |
Table Summary | Large Cap Equity Fund - Class AMF | S&P 500® Index |
|---|
Jun-2016 | $10,000 | $10,000 |
|---|
Jun-2017 | $11,820 | $11,790 |
|---|
Jun-2018 | $13,120 | $13,484 |
|---|
Jun-2019 | $14,128 | $14,889 |
|---|
Jun-2020 | $14,751 | $16,006 |
|---|
Jun-2021 | $20,004 | $22,536 |
|---|
Jun-2022 | $18,992 | $20,144 |
|---|
Jun-2023 | $22,820 | $24,091 |
|---|
Jun-2024 | $27,373 | $30,006 |
|---|
Jun-2025 | $30,004 | $34,556 |
|---|
Jun-2026 | $35,428 | $42,271 |
|---|
|
| Average Annual Return [Table Text Block] |
Table Summary | 1 Year | 5 Years | 10 Years |
|---|
Large Cap Equity Fund - Class AMF | 18.08% | 12.11% | 13.48% |
|---|
S&P 500® Index | 22.32% | 13.41% | 15.51% |
|---|
|
| No Deduction of Taxes [Text Block] |
The graph and table do not reflect the deduction of taxes that a shareholder would pay on fund distributions or redemption of fund shares.
|
| AssetsNet |
$ 53,202,091
|
| Holdings Count | Holding |
57
|
| Advisory Fees Paid, Amount |
$ 287,309
|
| InvestmentCompanyPortfolioTurnover |
13.00%
|
| Additional Fund Statistics [Text Block] |
- Net Assets$53,202,091
- Number of Portfolio Holdings57
- Advisory Fee (net of waivers)$287,309
- Portfolio Turnover13%
|
| Holdings [Text Block] |
Asset Weighting (% of total investments)Table SummaryValue | Value |
|---|
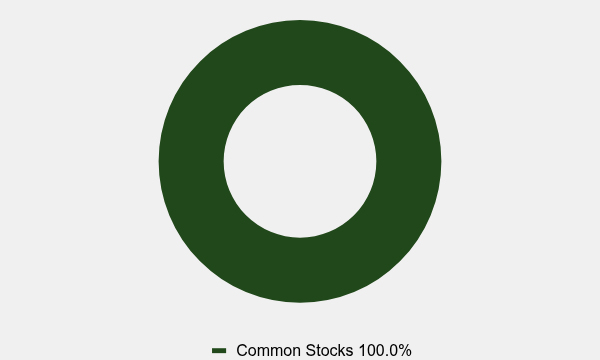
Common Stocks | 100.0% | Sector Weighting (% of net assets)Table SummaryValue | Value |
|---|
Other Assets in Excess of Liabilities | 4.6% | Materials | 1.8% | Utilities | 1.9% | Real Estate | 2.3% | Energy | 2.5% | Consumer Staples | 6.7% | Communication Services | 7.5% | Industrials | 8.8% | Consumer Discretionary | 9.2% | Health Care | 9.4% | Financials | 15.9% | Information Technology | 29.4% | |
| Largest Holdings [Text Block] |
Top 10 Holdings (% of net assets)Table SummaryHolding Name | % of Net Assets |
|---|
KLA Corporation | 5.4% |
|---|
Progressive Corporation (The) | 4.4% |
|---|
CSX Corporation | 4.3% |
|---|
Alphabet, Inc. - Class A | 4.1% |
|---|
Apple, Inc. | 3.9% |
|---|
Arista Networks, Inc. | 3.8% |
|---|
Cummins, Inc. | 3.8% |
|---|
Broadcom, Inc. | 3.7% |
|---|
NVIDIA Corporation | 3.6% |
|---|
Mastercard, Inc. - Class A | 3.2% |
|---|
|
| Material Fund Change [Text Block] |
No material changes occurred during the year ended June 30, 2026. |
| C000072278 |
|
| Shareholder Report [Line Items] |
|
| Fund Name |
Large Cap Equity Fund
|
| Class Name |
Class H
|
| Trading Symbol |
IICHX
|
| Annual or Semi-Annual Statement [Text Block] |
This annual shareholder report contains important information about Large Cap Equity Fund for the period of July 1, 2025 to June 30, 2026.
|
| Additional Information [Text Block] |
You can find additional information about the Fund at https://www.amffunds.com/html/materials.html. You can also request this information by contacting us at 1-800-247-9780
|
| Additional Information Phone Number |
1-800-247-9780
|
| Additional Information Website |
https://www.amffunds.com/html/materials.html
|
| Expenses [Text Block] |
What were the Fund’s annualized costs for the last year?(based on a hypothetical $10,000 investment) Table SummaryClass Name | Costs of a $10,000 investment | Costs paid as a percentage of a $10,000 investment |
|---|
Class H | $168 | 1.54% |
|---|
|
| Expenses Paid, Amount |
$ 168
|
| Expense Ratio, Percent |
1.54%
|
| Factors Affecting Performance [Text Block] |
How did the Fund perform during the reporting period? For the twelve months ended June 30, 2026, the Large Cap Equity Fund Class H Shares returned 18.20% while the S&P 500® Index (Total Return) generated 22.32%. The Morningstar Large Blend category average returned 20.23%. According to Morningstar, this places the Fund in the top 68% of all Large Cap Blend stock funds for the past year. For the three-and-five year periods ended June 30, 2026, the Fund ranked in the 78th percentile and the 51st percentile, respectively, of the Morningstar Large Blend Category. For the twelve months ended June 30, 2026, high yield, value and low volatility stocks underperformed the benchmark while momentum and growth outperformed. Since the Fund is oriented to value and higher than average dividend yield, this primarily caused the underperformance vs the benchmark. The Fund’s investment adviser, System Two Advisors, continues to prefer companies with low share prices relative to cash flow and sales, and higher than average dividend yields. These are factors that we believe provide more stability and less volatility when markets underperform. In fact, the Fund continues to generate lower return volatility than the S&P 500® Index as well as the average fund in the Morningstar Large Blend category. The Fund’s investment adviser, System Two Advisors, relies on a blend of fundamental and quantitative analysis. We believe that the investment process of System Two Advisors provides an attractive risk-adjusted approach for our shareholders. |
| Performance Past Does Not Indicate Future [Text] |
The Fund’s past performance is not a good predictor of how the Fund will perform in the future.
|
| Line Graph [Table Text Block] |
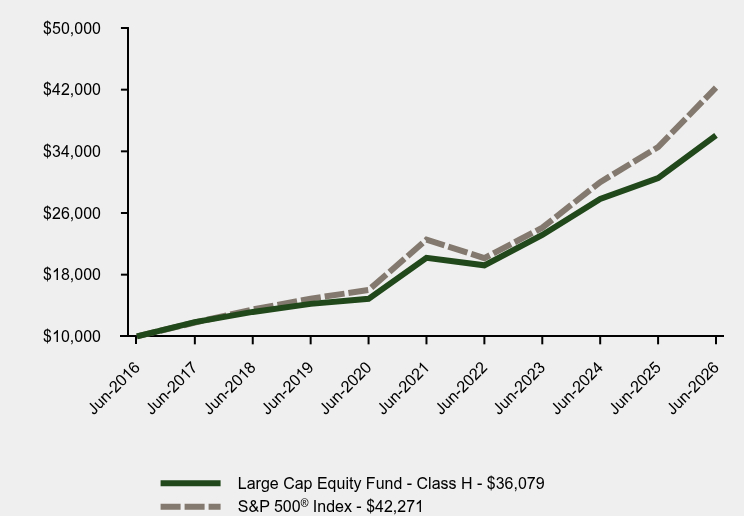
Table Summary | Large Cap Equity Fund - Class H | S&P 500® Index |
|---|
Jun-2016 | $10,000 | $10,000 |
|---|
Jun-2017 | $11,843 | $11,790 |
|---|
Jun-2018 | $13,169 | $13,484 |
|---|
Jun-2019 | $14,213 | $14,889 |
|---|
Jun-2020 | $14,862 | $16,006 |
|---|
Jun-2021 | $20,191 | $22,536 |
|---|
Jun-2022 | $19,211 | $20,144 |
|---|
Jun-2023 | $23,145 | $24,091 |
|---|
Jun-2024 | $27,829 | $30,006 |
|---|
Jun-2025 | $30,523 | $34,556 |
|---|
Jun-2026 | $36,079 | $42,271 |
|---|
|
| Average Annual Return [Table Text Block] |
Table Summary | 1 Year | 5 Years | 10 Years |
|---|
Large Cap Equity Fund - Class H | 18.20% | 12.31% | 13.69% |
|---|
S&P 500® Index | 22.32% | 13.41% | 15.51% |
|---|
|
| No Deduction of Taxes [Text Block] |
The graph and table do not reflect the deduction of taxes that a shareholder would pay on fund distributions or redemption of fund shares.
|
| AssetsNet |
$ 53,202,091
|
| Holdings Count | Holding |
57
|
| Advisory Fees Paid, Amount |
$ 287,309
|
| InvestmentCompanyPortfolioTurnover |
13.00%
|
| Additional Fund Statistics [Text Block] |
- Net Assets$53,202,091
- Number of Portfolio Holdings57
- Advisory Fee (net of waivers)$287,309
- Portfolio Turnover13%
|
| Holdings [Text Block] |
Asset Weighting (% of total investments)Table SummaryValue | Value |
|---|
Common Stocks | 100.0% | Sector Weighting (% of net assets)Table SummaryValue | Value |
|---|
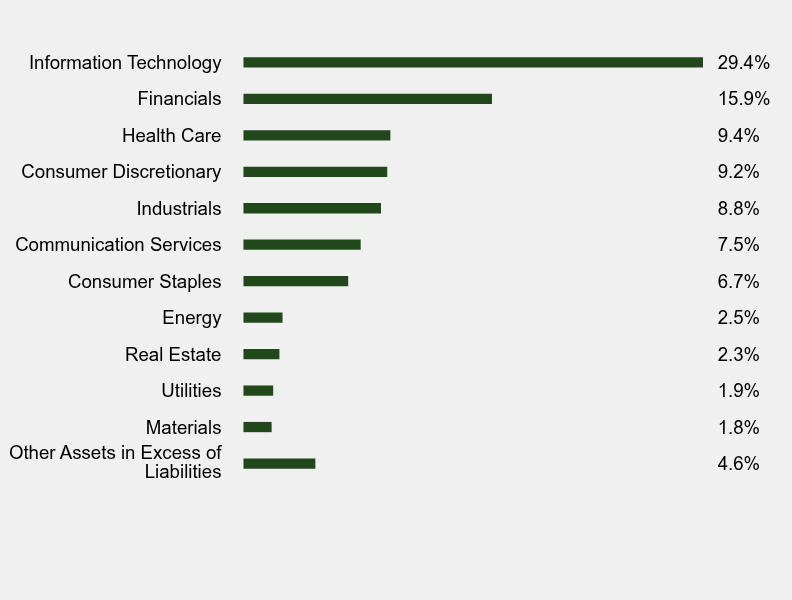
Other Assets in Excess of Liabilities | 4.6% | Materials | 1.8% | Utilities | 1.9% | Real Estate | 2.3% | Energy | 2.5% | Consumer Staples | 6.7% | Communication Services | 7.5% | Industrials | 8.8% | Consumer Discretionary | 9.2% | Health Care | 9.4% | Financials | 15.9% | Information Technology | 29.4% | |
| Largest Holdings [Text Block] |
Top 10 Holdings (% of net assets)Table SummaryHolding Name | % of Net Assets |
|---|
KLA Corporation | 5.4% |
|---|
Progressive Corporation (The) | 4.4% |
|---|
CSX Corporation | 4.3% |
|---|
Alphabet, Inc. - Class A | 4.1% |
|---|
Apple, Inc. | 3.9% |
|---|
Arista Networks, Inc. | 3.8% |
|---|
Cummins, Inc. | 3.8% |
|---|
Broadcom, Inc. | 3.7% |
|---|
NVIDIA Corporation | 3.6% |
|---|
Mastercard, Inc. - Class A | 3.2% |
|---|
|
| Material Fund Change [Text Block] |
No material changes occurred during the year ended June 30, 2026. |