Exhibit 99.3
Hydro-Québec
Financial Results
KEY FIGURES
Second Quarter of 2026
| NET INCOME |
|
INVESTMENTS |
| $170M |
|
$1,868M |
|
|
|
ELECTRICITY SALES
IN QUÉBEC |
|
ELECTRICITY SALES OUTSIDE QUÉBEC |
|
|
|
| 39.5 TWh |
|
3.6 TWh |
|
|
|
| $3,364M |
|
$421M |
First Semester of 2026
| NET INCOME |
|
INVESTMENTS |
| $2,020M |
|
$3,439M |
|
|
|
ELECTRICITY SALES
IN QUÉBEC |
|
ELECTRICITY SALES OUTSIDE QUÉBEC |
|
|
|
| 98.8 TWh |
|
7.5 TWh
|
|
|
|
| $8,471M |
|
$947M |
| |
|
Management's Discussion and Analysis |
| |
|
|
| First semester in context |
|
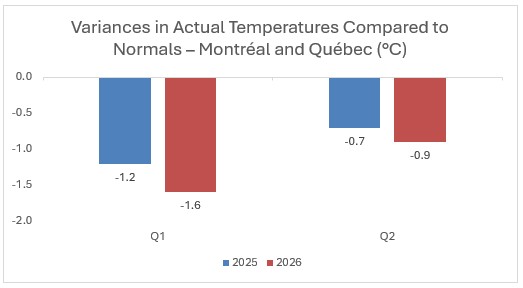
The results for the first half of 2026 are set against the backdrop of the low runoff conditions observed over the last three years. Natural water inflows during this period have been lower than normal overall, due in particular to decreased precipitation and spring runoff, resulting in historically low levels in large reservoirs. The company’s financial performance also reflects a context characterized by periods of intense cold, particularly at the end of January, when peak demand in Québec exceeded 38,000 MW for seven consecutive days, a historic high. Temperatures were an average of 9°C colder than climate normals during this period. These conditions impacted the management of energy reserves and resulted in a decrease in revenue from sales outside Québec, as well as an increase in electricity purchases, primarily in the first quarter, when prices are usually high. It should also be noted that the security of Québec’s energy supply was never compromised. |
| |
|
|
| Quarterly results |
|
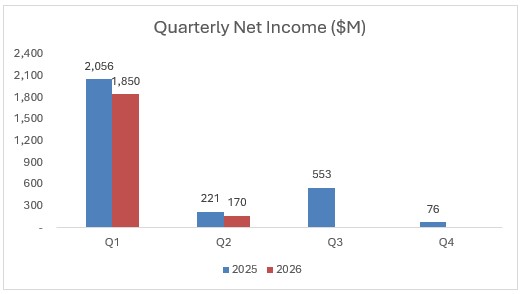
For the second quarter of 2026, Hydro-Québec’s net income totalled $170 million, a $51-million decrease compared to the $221 million recorded for the same period last year.
On markets outside Québec, electricity sales rose by $158 million, mainly due to the commercial commissioning of the Appalaches–Maine interconnection (“NECEC”) at the start of the year. On the Québec market, sales increased by $133 million compared to the same quarter of 2025, primarily on account of the indexation of rates on April 1, 2026. These favourable factors were, however, mitigated by the $229-million increase in electricity purchases resulting from the prudent management of reservoirs, as well as the $47-million impact of the recognition of regulatory variance accounts. It should be recalled that in March, further to a request made by Hydro-Québec as part of its 2026–2028 rate application, the Régie de l’énergie acknowledged that the use of all the variance accounts that were inoperative under An Act to simplify the process for establishing electricity distribution rates once again became applicable. Finally, financial expenses increased by $47 million, essentially due to the impact of new debt issues on interest expense, taking into account the increase in the borrowing program in connection with the planned investment activities under the Action Plan 2035.
|
| |
|
|
| |
|
|
| Summary of results for the first semester |
|
Hydro-Québec's net income totalled $2,020 million for the first half of 2026, a decrease of $257 million compared to the $2,277 million recorded for the same period the previous year. The company was in fact forced to reduce its short-term sales on markets outside Québec, and purchase more electricity when prices were high, primarily in the first quarter. However, these unfavourable factors were mitigated by the growth in sales on the Québec market and by the impact of the recognition of regulatory variance accounts. Regarding financial expenses, they also rose, taking into account the increase in the borrowing program in connection with investment activities. |
| |
|
|
| Consolidated results for the first semester |
|
Revenue totalled $9,820 million, a $329-million increase compared to the $9,491 million recorded in the first half of 2025.
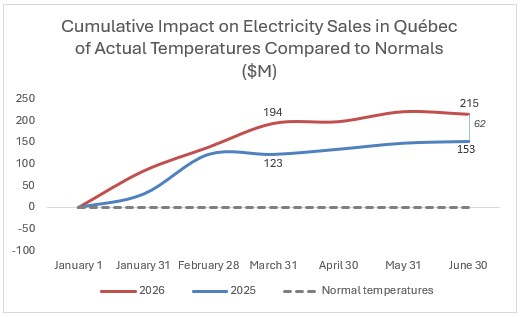
In Québec, sales were $408 million higher than in the same period of the previous year, when they had reached $8,063 million. The effect of temperatures, particularly those of winter 2026, which were colder than the previous year, resulted in an increase in sales of 0.6 TWh, or $62 million. As heating accounts for the vast majority of electricity consumption during the winter months, any drop in temperatures during this season has a favourable impact on the volume of electricity sales and related revenue. This impact was particularly felt during the months of January and March, when temperatures were, on average, 1°C lower than those of 2025. The increase is also due to the indexation of rates on April 1, 2025 and 2026, which resulted in a $237-million increase in revenue. Lastly, the favourable aluminum price fluctuation led to a $69-million increase in revenue associated with special contracts with certain large industrial customers.
|
| |
|
 |
| |
|
 |
| |
|
|
| |
|
Electricity sales on external markets totalled $947 million, a $114-million decrease from the $1,061 million recorded for the same period in 2025. This decrease is mainly due to a 2.3-TWh decrease in short-term sales, the impact of which was largely mitigated by an increase in sales under long-term contracts. In fact, given the below-normal natural water inflows and the high demand on the transmission system in Québec resulting from winter temperatures, short-term sales on the markets were considerably lower than those for the same period in 2025. Sales under long-term contracts increased, partly due to the commercial commissioning of the NECEC project. It should be noted that this 20-year contract is expected to generate stable and significant income for its duration, while over the long-term, providing increased flexibility thanks to the use of the interconnection line for both energy exports and imports based on market conditions. |
| |
|
Revenue from other activities increased by $46 million compared to a year ago. This increase is due in part to the $87-million gain recognized on the disposal of Hydro-Québec's investment in Dana TM4. |
| |
|
|
| |
|
Total expenses amounted to $6,401 million, $497 million more than the $5,904 million recorded during the same period in 2025. This difference is due to two factors. On one hand, electricity purchases increased by $675 million, mainly due to an increase in short-term supplies purchased on the markets, in particular to meet Québec's needs during periods of intense cold in the first quarter and to restore energy reserves. A part of these purchases had to be made at higher prices, due in part to increased energy demand. On the other hand, given that the actual cost of electricity supplies was higher than the costs forecast by the Régie de l'énergie's rate-setting purposes, Hydro-Québec was able to recognize a $301million regulatory asset in regulatory deferrals, which led to a reduction in total expenses. |
| |
|
|
| |
|
Financial expenses totalled $1,399 million, a $89-million increase from the $1,310 million recorded in the previous year. This increase is essentially due to the impact of new debt issues on interest expense. |
| |
|
|
| Investments |
|
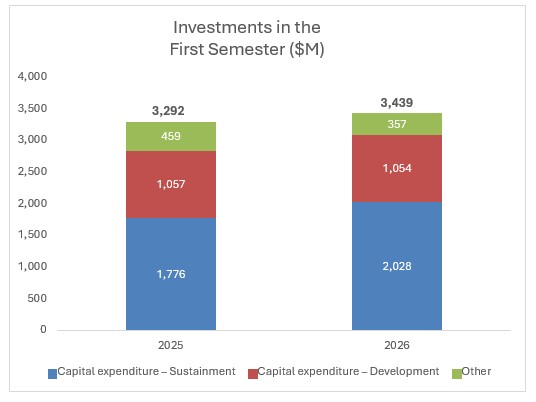
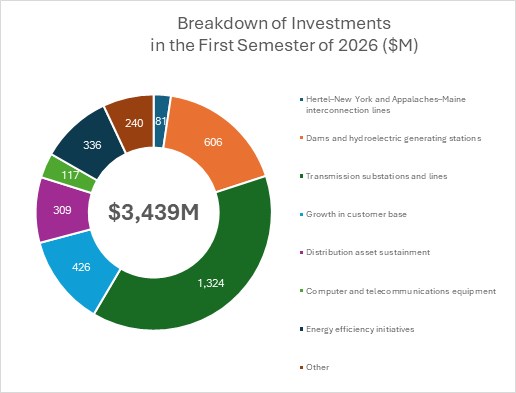
Investments during the first half of 2026 totalled $3,439 million, compared to $3,292 million for the same period in 2025. They are mainly composed of investments in property, plant and equipment and intangible assets, as well as investments in the regulatory asset with respect to costs related to energy efficiency and demand response initiatives. These investments are in connection with several priorities of the Action Plan 2035. They reflect the company's commitment to reliable, high-quality service through sustained investment in its generating, transmission and distribution facilities, as well as to helping its customers consume energy more efficiently and achieve significant savings on their electricity bills. |
| |
|
|
| |
|
|
| |
|
More specifically, investments in property, plant and equipment and intangible assets totalled $3,082 million during the first half of 2026, compared to $2,833 million for the same period of last year. |
| |
|
|
| |
|
Investments in asset sustainment totalled $2,028 million. In particular, Hydro-Québec continued to invest in its generating facilities to ensure their long-term operability and maximize their output. Work is underway at Rapide-Blanc and Carillon generating stations in the Mauricie and Laurentides regions, respectively, and at the Bersimis-2 development in the Côte-Nord region. Regarding power transmission, the company continued the installation of two new converter units at Châteauguay substation in the Montérégie region, as well as modernizing equipment and systems, including the replacement of grid control systems, special protection systems and substation protections and controls. It also continued the work on the architecture development plan for the 315-kV system on the island of Montréal. At the same time, it carried out work to optimize the operation of the distribution system and to maintain and improve the quality of its distribution assets. |
| |
|
Investments in development projects totalled $1,054 million. In particular, Hydro-Québec allocated significant funds to various projects to meet the needs of a growing customer base in Québec and increase output capacity. As an example, investments are being made in Jean-Lesage, Outardes-2 and René-Lévesque generating stations, in the Côte-Nord region, to increase their capacity. Furthermore, the Hertel-New York interconnection line, built to connect with the Champlain Hudson Power Express ("CHPE") line to supply New York City, was commissioned in May. It should be recalled that the NECEC project, namely the 1,200 MW interconnection line between Québec and New England, was commissioned in January. |
| |
|
|
| |
|
|
| |
|
|
| |
|
These amounts are in addition to the direct investments made by Hydro-Québec's external partners. Collectively, such investments provide major support to the Québec economy. |
| |
|
|
| Financing |
|
During the second quarter of 2026, Hydro-Québec carried out three fixed-rate issues on the Canadian capital market: an issue of medium-term notes maturing in 2033 for an amount of $0.6 billion, at a cost of 3.87%, and two bond issues maturing in 2065 for an amount of $0.9 billion, at an average cost of 4.65%. |
| |
|
|
| |
|
These financing activities raised $1.5 billion. That is in addition to the funds raised in the first quarter, bringing the year-to-date total to $4.9 billion. |
| |
|
|
| |
|
The proceeds are being used, in particular, to finance part of the investment program and to repay maturing debt. |
CONSOLIDATED FINANCIAL STATEMENTS
(UNAUDITED)
Consolidated Statements of Operations
In millions of Canadian dollars
(unaudited) |
|
|
Three months ended
June 30 |
|
|
Six months ended
June 30 |
|
| |
Notes |
|
2026 |
|
|
2025 |
|
|
2026 |
|
|
2025 |
|
| Revenue |
4 |
|
4,035 |
|
|
3,716 |
|
|
9,820 |
|
|
9,491 |
|
| Expenses |
|
|
|
|
|
|
|
|
|
|
|
|
|
| Operations |
|
|
1,202 |
|
|
1,206 |
|
|
2,359 |
|
|
2,280 |
|
| Other components of employee future benefit cost |
9 |
|
(244 |
) |
|
(229 |
) |
|
(488 |
) |
|
(458 |
) |
| Electricity purchases |
|
|
1,050 |
|
|
821 |
|
|
2,589 |
|
|
1,914 |
|
| Depreciation and amortization |
|
|
837 |
|
|
768 |
|
|
1,612 |
|
|
1,525 |
|
| Taxes |
|
|
284 |
|
|
267 |
|
|
663 |
|
|
643 |
|
| Regulatory deferrals |
|
|
27 |
|
|
- |
|
|
(334 |
) |
|
- |
|
| |
|
|
3,156 |
|
|
2,833 |
|
|
6,401 |
|
|
5,904 |
|
| Income before financial expenses |
|
|
879 |
|
|
883 |
|
|
3,419 |
|
|
3,587 |
|
| Financial expenses |
5 |
|
709 |
|
|
662 |
|
|
1,399 |
|
|
1,310 |
|
| Net income |
|
|
170 |
|
|
221 |
|
|
2,020 |
|
|
2,277 |
|
Consolidated Statements of Comprehensive Income
In millions of Canadian dollars
(unaudited) |
|
|
Three months ended
June 30 |
|
|
Six months ended
June 30 |
|
| |
Notes |
|
2026 |
|
|
2025 |
|
|
2026 |
|
|
2025 |
|
| Net income |
|
|
170 |
|
|
221 |
|
|
2,020 |
|
|
2,277 |
|
| Other comprehensive income (loss) |
10 |
|
|
|
|
|
|
|
|
|
|
|
|
| Net change in items designated as cash flow hedges |
7 |
|
41 |
|
|
183 |
|
|
(88 |
) |
|
212 |
|
| Net change in translation differences |
|
|
35 |
|
|
(106 |
) |
|
51 |
|
|
(107 |
) |
| Net change in items designated as net investment hedges |
7 |
|
(40 |
) |
|
101 |
|
|
(80 |
) |
|
99 |
|
| Other |
|
|
- |
|
|
4 |
|
|
- |
|
|
21 |
|
| |
|
|
36 |
|
|
182 |
|
|
(117 |
) |
|
225 |
|
| Comprehensive income |
|
|
206 |
|
|
403 |
|
|
1,903 |
|
|
2,502 |
|
The accompanying notes are an integral part of the consolidated financial statements.
Consolidated Balance Sheets
In millions of Canadian dollars
(unaudited) |
Notes |
|
As at June 30,
2026 |
|
|
As at December 31,
2025 |
|
| ASSETS |
|
|
|
|
|
|
|
| Current assets |
|
|
|
|
|
|
|
| Cash and cash equivalents |
|
|
4,399 |
|
|
2,660 |
|
| Short-term investments |
|
|
2,861 |
|
|
1,634 |
|
| Accounts receivable and other assets |
|
|
5,072 |
|
|
4,947 |
|
| |
|
|
12,332 |
|
|
9,241 |
|
| Property, plant and equipment and intangible assets |
|
|
85,651 |
|
|
83,935 |
|
| Regulatory assets |
|
|
2,661 |
|
|
2,038 |
|
| Employee future benefit assets |
|
|
9,319 |
|
|
8,978 |
|
| Other assets |
6 |
|
4,500 |
|
|
3,841 |
|
| |
|
|
114,463 |
|
|
108,033 |
|
| LIABILITIES |
|
|
|
|
|
|
|
| Current liabilities |
|
|
|
|
|
|
|
| Borrowings |
|
|
2,376 |
|
|
1 |
|
| Accounts payable and other liabilities |
|
|
4,711 |
|
|
5,000 |
|
| Dividend payable |
|
|
- |
|
|
2,180 |
|
| Current portion of long-term debt |
7 |
|
480 |
|
|
794 |
|
| |
|
|
7,567 |
|
|
7,975 |
|
| Long-term debt |
7 |
|
69,470 |
|
|
64,757 |
|
| Employee future benefit liabilities |
|
|
1,196 |
|
|
1,188 |
|
| Other liabilities |
|
|
4,208 |
|
|
3,953 |
|
| |
|
|
82,441 |
|
|
77,873 |
|
| EQUITY |
|
|
|
|
|
|
|
| Share capital |
|
|
4,374 |
|
|
4,374 |
|
| Retained earnings |
|
|
26,281 |
|
|
24,302 |
|
| Accumulated other comprehensive income |
10 |
|
1,367 |
|
|
1,484 |
|
| |
|
|
32,022 |
|
|
30,160 |
|
| |
|
|
114,463 |
|
|
108,033 |
|
| Contingencies |
11 |
|
|
|
|
|
|
The accompanying notes are an integral part of the consolidated financial statements.
On behalf of the Board of Directors,
| /s/ Geneviève Brouillette |
/s/ Manon Brouillette |
| Chair of the Audit Committee |
Chair of the Board |
Consolidated Statements of Changes in Equity
In millions of Canadian dollars
(unaudited) |
|
|
Six months ended
June 30 |
|
| |
Note |
|
Share capital |
|
|
Retained
earnings |
|
|
Accumulated other
comprehensive income |
|
|
Total equity |
|
| Balance as at December 31, 2025 |
|
|
4,374 |
|
|
24,302 |
|
|
1,484 |
|
|
30,160 |
|
| Net income |
|
|
|
|
|
2,020 |
|
|
|
|
|
2,020 |
|
| Other comprehensive income (loss) |
10 |
|
|
|
|
|
|
|
(117 |
) |
|
(117 |
) |
| Other |
|
|
|
|
|
(41 |
) |
|
|
|
|
(41 |
) |
| Balance as at June 30, 2026 |
|
|
4,374 |
|
|
26,281 |
|
|
1,367 |
|
|
32,022 |
|
| Balance as at December 31, 2024 |
|
|
4,374 |
|
|
23,576 |
|
|
757 |
|
|
28,707 |
|
| Net income |
|
|
|
|
|
2,277 |
|
|
|
|
|
2,277 |
|
| Other comprehensive income (loss) |
10 |
|
|
|
|
|
|
|
225 |
|
|
225 |
|
| Balance as at June 30, 2025 |
|
|
4,374 |
|
|
25,853 |
|
|
982 |
|
|
31,209 |
|
The accompanying notes are an integral part of the consolidated financial statements.
Consolidated Statements of Cash Flows
In millions of Canadian dollars
(unaudited) |
|
|
Three months ended
June 30 |
|
|
Six months ended
June 30 |
|
| |
Notes |
|
2026 |
|
|
2025 |
|
|
2026 |
|
|
2025 |
|
| Operating activities |
|
|
|
|
|
|
|
|
|
|
|
|
|
| Net income |
|
|
170 |
|
|
221 |
|
|
2,020 |
|
|
2,277 |
|
| Adjustments to determine net cash flows from operating activities |
|
|
|
|
|
|
|
|
|
|
|
|
|
| Depreciation and amortization |
|
|
837 |
|
|
768 |
|
|
1,612 |
|
|
1,525 |
|
| Deficit of net cost recognized with respect to amounts paid for employee future benefits |
|
|
(166 |
) |
|
(145 |
) |
|
(332 |
) |
|
(291 |
) |
| Gain on disposal of an equity method investment |
6 |
|
- |
|
|
- |
|
|
(90 |
) |
|
- |
|
| Other |
|
|
42 |
|
|
(84 |
) |
|
66 |
|
|
(58 |
) |
| Regulatory assets and liabilities |
|
|
(169 |
) |
|
(229 |
) |
|
(608 |
) |
|
(387 |
) |
| Change in non-cash working capital items |
8 |
|
1,267 |
|
|
1,547 |
|
|
(430 |
) |
|
53 |
|
| |
|
|
1,981 |
|
|
2,078 |
|
|
2,238 |
|
|
3,119 |
|
| Investing activities |
|
|
|
|
|
|
|
|
|
|
|
|
|
| Additions to property, plant and equipment and intangible assets |
|
|
(1,657 |
) |
|
(1,603 |
) |
|
(3,082 |
) |
|
(2,833 |
) |
| Acquisition of short-term investments |
|
|
(1,136 |
) |
|
(1,671 |
) |
|
(2,600 |
) |
|
(3,235 |
) |
| Acquisition of sinking fund securities |
|
|
(491 |
) |
|
(212 |
) |
|
(491 |
) |
|
(313 |
) |
| Disposal of short-term investments |
|
|
351 |
|
|
358 |
|
|
1,380 |
|
|
693 |
|
| Disposal of an equity method investment |
6 |
|
- |
|
|
- |
|
|
263 |
|
|
- |
|
| Increase in equity method investments |
|
|
(91 |
) |
|
(75 |
) |
|
(138 |
) |
|
(96 |
) |
| Other |
|
|
(16 |
) |
|
(38 |
) |
|
(11 |
) |
|
(20 |
) |
| |
|
|
(3,040 |
) |
|
(3,241 |
) |
|
(4,679 |
) |
|
(5,804 |
) |
| Financing activities |
|
|
|
|
|
|
|
|
|
|
|
|
|
| Issuance of long-term debt |
|
|
1,494 |
|
|
2,193 |
|
|
4,930 |
|
|
3,929 |
|
| Repayment of long-term debt |
|
|
(370 |
) |
|
(31 |
) |
|
(761 |
) |
|
(148 |
) |
| Cash receipts arising from credit risk management |
|
|
825 |
|
|
703 |
|
|
1,556 |
|
|
1,360 |
|
| Cash payments arising from credit risk management |
|
|
(871 |
) |
|
(713 |
) |
|
(1,740 |
) |
|
(1,347 |
) |
| Net change in debt securities with maturities of three months or less |
|
|
(312 |
) |
|
(1,165 |
) |
|
1,540 |
|
|
1,624 |
|
| Issuance of short-term borrowings with maturities greater than three months |
|
|
669 |
|
|
259 |
|
|
1,319 |
|
|
963 |
|
| Repayment of short-term borrowings with maturities greater than three months |
|
|
(519 |
) |
|
(385 |
) |
|
(519 |
) |
|
(385 |
) |
| Dividend paid |
|
|
- |
|
|
- |
|
|
(2,180 |
) |
|
(1,997 |
) |
| Other |
|
|
- |
|
|
(1 |
) |
|
28 |
|
|
18 |
|
| |
|
|
916 |
|
|
860 |
|
|
4,173 |
|
|
4,017 |
|
| Foreign currency effect on cash and cash equivalents |
|
|
4 |
|
|
(25 |
) |
|
7 |
|
|
(29 |
) |
| Net change in cash and cash equivalents |
|
|
(139 |
) |
|
(328 |
) |
|
1,739 |
|
|
1,303 |
|
| Cash and cash equivalents, beginning of period |
|
|
4,538 |
|
|
5,477 |
|
|
2,660 |
|
|
3,846 |
|
| Cash and cash equivalents, end of period |
|
|
4,399 |
|
|
5,149 |
|
|
4,399 |
|
|
5,149 |
|
| Supplementary cash flow information |
8 |
|
|
|
|
|
|
|
|
|
|
|
|
The accompanying notes are an integral part of the consolidated financial statements.
NOTES TO CONSOLIDATED FINANCIAL STATEMENTS
(UNAUDITED)
For the three- and six-month periods ended June 30, 2026 and 2025
Amounts in tables are in millions of Canadian dollars, unless otherwise indicated.
Note 1 - Basis of Presentation
Hydro‑Québec’s consolidated financial statements have been prepared in accordance with United States generally accepted accounting principles.
These quarterly consolidated financial statements, including these notes, do not contain all the required information regarding annual consolidated financial statements and should therefore be read in conjunction with the consolidated financial statements and accompanying notes in Hydro‑Québec’s Annual Report 2025.
The accounting policies used to prepare the quarterly consolidated financial statements are consistent with those presented in Hydro-Québec’s Annual Report 2025.
Hydro-Québec’s quarterly results are not necessarily indicative of results for the year on account of seasonal temperature fluctuations. Because of higher electricity demand during winter months, revenue from electricity sales in Québec is higher during the first and fourth quarters.
Management has reviewed events occurring until September 3, 2026, the date of approval of these quarterly consolidated financial statements by the Board of Directors, to determine whether circumstances warranted consideration of events subsequent to the balance sheet date.
Note 2 - Changes in Accounting Policies
Standard issued but not yet adopted
Intangible assets
In September 2025, the Financial Accounting Standards Board (“FASB”) issued Accounting Standards Update (“ASU”) 2025-06, Intangibles—Goodwill and Other—Internal-Use Software (Subtopic 350-40)—Targeted Improvements to the Accounting for Internal-Use Software.
This ASU makes targeted improvements to accounting for internal-use software. Specifically, it removes all references to software development project stages and establishes a new cost capitalization criterion based on management’s authorization and the probable-to-complete recognition threshold. It can be applied using one of three transition approaches: prospective, retrospective or modified prospective basis, to the financial statements for quarterly and annual periods beginning on or after January 1, 2028. Hydro‑Québec is currently examining the impact of this ASU on its consolidated financial statements.
Government grants
In December 2025, the FASB issued ASU 2025-10, Government Grants (Topic 832)-Accounting for Government Grants Received by Business Entities.
This ASU provides guidance on the initial measurement, recognition, presentation and disclosure of government grants. It can be applied using one of three approaches: a modified prospective approach, a modified retrospective approach or a retrospective approach to the quarterly and annual financial statements of years as of January 1, 2029. Hydro-Québec is currently examining the impact of this ASU on its consolidated financial statements.
Environmental Credits and Environmental Credit Obligations
In May 2026, the FASB issued ASU 2026-02, Environmental Credits and Environmental Credit Obligations (Topic 818).
This ASU provides guidance for the recognition, measurement, presentation and disclosure of environmental credits and environmental credit obligations. It must be applied on a modified retrospective basis with a cumulative adjustment to the quarterly and annual financial statements beginning on or after January 1, 2028. Hydro-Québec is currently examining the impact of this ASU on its consolidated financial statements.
Distribution activities
As of April 1, 2026, in accordance with Decision D-2026-036 issued on March 26, 2026, rendered as part of the 2026–2028 regulatory cycle, rate increases of 3.0% for residential customers, and 3.8% for commercial, institutional and industrial customers were approved.
The Régie de l’énergie du Québec (the “Régie”) acknowledged in its March 13, 2026, Decision D-2026-033, the update of regulatory principles and accounting practices. In accordance with this decision, all variance accounts that were inoperative under An Act to simplify the process for establishing electricity distribution rates (S.Q. 2019, c. 27), became useful and available. These variances are recognized as regulatory assets or regulatory liabilities, as the case may be.
As at June 30, 2026, the main variance accounts are as follows:
Variances related to climate conditions
Variances between actual revenue and forecast revenue in rate filings, established based on climate normals, have been recognized as regulatory liability in the amount of $97 million as at June 30, 2026. The offset has been recognized under Revenue from other activities.
Variances related to electricity supplies
Variances in price and volume between actual electricity supplies and those forecast in rate filings recognized by the Régie for electricity rate-setting purposes have been accounted for as a regulatory asset in the amount of $301 million as of June 30, 2026. The offset has been recognized under Regulatory deferrals.
Note 4 - Revenue
| |
|
Three months ended
June 30 |
|
|
Six months ended
June 30 |
|
| |
|
2026 |
|
|
2025 |
|
|
2026 |
|
|
2025 |
|
| Revenue from ordinary activitiesa |
|
|
|
|
|
|
|
|
|
|
|
|
| Electricity sales |
|
|
|
|
|
|
|
|
|
|
|
|
| In Québec |
|
3,364 |
|
|
3,231 |
|
|
8,471 |
|
|
8,063 |
|
| Outside Québec |
|
421 |
|
|
263 |
|
|
947 |
|
|
1,061 |
|
| |
|
3,785 |
|
|
3,494 |
|
|
9,418 |
|
|
9,124 |
|
| Other revenue from ordinary activities |
|
150 |
|
|
157 |
|
|
220 |
|
|
231 |
|
| |
|
3,935 |
|
|
3,651 |
|
|
9,638 |
|
|
9,355 |
|
| Revenue from other activitiesb |
|
100 |
|
|
65 |
|
|
182 |
c |
|
136 |
|
| |
|
4,035 |
|
|
3,716 |
|
|
9,820 |
|
|
9,491 |
|
a) Including gains and losses on derivative instruments (see Note 7, Financial Instruments).
b) Including its share of income of equity method investments of $32 million and $59 million for the three- and six-month periods, respectively, ended June 30, 2026 ($18 million and $45 million for the corresponding periods of 2025).
c) Including a gain of $87 million arising from the disposal of an equity method investment (see Note 6, Other Assets).
Note 5 - Financial Expenses
| |
|
Three months ended
June 30 |
|
|
Six months ended
June 30 |
|
| |
|
2026 |
|
|
2025 |
|
|
2026 |
|
|
2025 |
|
| Net interest on long-term debta |
|
732 |
|
|
687 |
|
|
1,454 |
|
|
1,357 |
|
| Capitalized financial expenses |
|
(73 |
) |
|
(66 |
) |
|
(144 |
) |
|
(124 |
) |
| Net investment incomeb |
|
(30 |
) |
|
(36 |
) |
|
(67 |
) |
|
(75 |
) |
| Otherc |
|
80 |
|
|
77 |
|
|
156 |
|
|
152 |
|
| |
|
709 |
|
|
662 |
|
|
1,399 |
|
|
1,310 |
|
a) Including investment income of $20 million and $37 million for the three- and six-month periods, respectively, ended June 30, 2026 ($12 million and $22 million for the corresponding periods of 2025) from securities held in the sinking funds allocated to repaying the long-term debt. The voluntary sinking fund strategy aims to issue additional bonds and to invest the funds raised in securities issued by certain provincial governments in Canada, so as to ensure the availability of funds when these debts mature in 2035.
b) Including interest of $16 million and $26 million for the three- and six-month periods, respectively, ended June 30, 2026 ($21 million and $37 million for the corresponding periods of 2025) on short-term borrowings and cash received as collateral. As part of its liquidity risk management, Hydro-Québec has access to a commercial paper program whose limit is US$5 billion or equivalent in C$. The company aims to invest the funds raised in short-term investments and cash equivalents.
c) Including guarantee fees of $75 million and $151 million for the three- and six-month periods, respectively, ended June 30, 2026 ($70 million and $140 million for the corresponding periods of 2025) that were paid to the Québec government related to debt securities, which are charged at a rate of 0.5%.
Note 6 - Other Assets
| On January 20, 2026, Hydro-Québec completed the sale of its 45% interest in Dana TM4 pursuant to the exercise of its put option, for a cash consideration of $263 million (US$190 million). This transaction resulted in a gain of $87 million, net of |
|
transaction costs, recognized in Revenue from other activities. The gain includes the reclassification of $16 million from Accumulated other comprehensive income, arising from translation differences from previous periods. |
Note 7 - Financial Instruments
In the course of its operations, Hydro-Québec carries out transactions that expose it to certain financial risks, such as market and credit risk. Exposure to such risks and their impact on income are reduced through careful monitoring and implementation of strategies that include the use of derivative instruments.
Market risk
Market risk is the risk that the fair value or future cash flows of a financial instrument will fluctuate as a result of changes in market prices.
Currency risk
Hydro-Québec uses currency swaps and forward currency purchase contracts to manage the currency risk associated with U.S. dollar denominated short-term borrowings and long‑term debt and forward currency sales contracts to manage exposure associated with probable sales in U.S. dollars. When designated as hedging items, these derivative instruments are recognized as cash flow hedges.
Hydro-Québec also uses forward currency sales contracts to cover its net investment in a foreign operation whose functional currency is the U.S. dollar. When designated as hedging items, these derivative instruments are recognized as net investment hedges.
Interest rate risk
Hydro-Québec uses interest rate swaps to convert certain fixed‑rate debts into variable-rate debts and interest rate forward contracts to set the interest rate for certain future debt issues. When designated as hedging items, these derivative instruments are recognized based on the type of hedge: cash flow hedge or fair value hedge.
Price risk
Hydro-Québec uses mainly forward contracts and swaps to manage risk resulting from fluctuations in energy, aluminum and diesel prices. This aims to mitigate the impact of market price volatility on income from the sale and purchase of electricity and purchase of fuel indexed to these prices. When designated as hedging items, these derivative instruments are recognized as cash flow hedges.
The following table presents the notional amounts of forward contracts and swaps used to manage the main types of market risk:
| |
|
As at June 30,
2026 |
|
|
As at December 31,
2025 |
|
| Currency risk |
|
|
|
|
|
|
| Sale (US$ million) |
|
3,528 |
|
|
2,739 |
|
| Purchase (US$ million) |
|
4,007 |
|
|
2,870 |
|
|
|
|
|
|
|
|
| Interest rate risk |
|
|
|
|
|
|
| Variable-rate payer (C$ million) |
|
1,500 |
|
|
1,500 |
|
| Fixed-rate payer (C$ million) |
|
2,000 |
|
|
2,000 |
|
|
|
|
|
|
|
|
| Price risk |
|
|
|
|
|
|
| Electricity - Sale (TWh) |
|
1.9 |
|
|
4.9 |
|
| Electricity - Purchase (TWh) |
|
1.2 |
|
|
2.8 |
|
| Aluminum (tonnes) |
|
466,725 |
|
|
470,500 |
|
| Diesel (millions of litres) |
|
5.0 |
|
|
5.0 |
|
| Note 7 - Financial Instruments (continued) |
|
|
| |
|
|
|
Credit risk
Credit risk is the risk that one party to a financial asset will fail to meet its obligations.
Hydro-Québec is exposed to credit risk related to accounts receivable and other financial assets such as cash and cash equivalents, short-term investments, sinking funds, deposits and derivative instruments.
In terms of accounts receivable, this risk arises primarily from ongoing electricity sales inside and outside Québec. The risk exposure is limited due to Hydro-Québec’s large and diverse customer base in addition to measures put in place such as security deposits, scheduled prepayments, payment arrangements and service interruptions. Management therefore believes that Hydro‑Québec is not exposed to a high credit risk, particularly because sales in Québec are billed at rates that allow for recovery of costs based on the terms and conditions set by the Régie.
|
|
As at June 30, 2026, Accounts receivable and other assets included an amount of $2,214 million ($2,422 million as at December 31, 2025) from contracts concluded with customers, including $1,056 million ($1,732 million as at December 31, 2025) in unbilled electricity deliveries. Amounts in Accounts receivable and other assets were presented net of the allowance for credit losses of $437 million ($404 million as at December 31, 2025).
In order to reduce the exposure to credit risk related to other financial assets, Hydro-Québec deals with a number of issuers and financial institutions with high credit ratings. Furthermore, to offset exposure to risk related to derivative instruments, it has signed, with each counterparty, a collateral exchange agreement based on the International Swaps and Derivatives Association (“ISDA”) guidelines, which limits the market value of the portfolio. A variation of this market value beyond the agreed-upon limit will therefore result in a cash receipt or payment.
|
Fair value
Fair value of derivative instruments
The following tables present the fair value of derivative instruments, including the impact of offsets, by hedge type:
| |
|
|
|
|
|
|
|
|
|
|
As at June 30, 2026 |
|
| |
|
Fair value
hedges |
|
|
Cash flow
hedges |
|
|
Net investment
hedges |
|
|
Derivatives not
designated
as hedges |
|
|
Total |
|
| Assets |
|
|
|
|
|
|
|
|
|
|
|
|
|
|
|
| Currency contracts |
|
- |
|
|
496 |
|
|
- |
|
|
65 |
|
|
561 |
|
| Interest rate contracts |
|
108 |
|
|
1 |
|
|
- |
|
|
- |
|
|
109 |
|
| Price contracts |
|
- |
|
|
15 |
|
|
- |
|
|
69 |
|
|
84 |
|
| Gross amounts recognized |
|
108 |
|
|
512 |
|
|
- |
|
|
134 |
|
|
754 |
|
| Less |
|
|
|
|
|
|
|
|
|
|
|
|
|
|
|
| Impact of gross amounts offseta |
|
|
|
|
|
|
|
|
|
|
|
|
|
195 |
|
| Impact of cash received as collateralb |
|
|
|
|
|
|
|
|
|
|
|
|
|
466 |
|
| Net assets |
|
|
|
|
|
|
|
|
|
|
|
|
|
93 |
c |
| Liabilities |
|
|
|
|
|
|
|
|
|
|
|
|
|
|
|
| Currency contracts |
|
- |
|
|
19 |
|
|
63 |
|
|
17 |
|
|
99 |
|
| Interest rate contracts |
|
- |
|
|
43 |
|
|
- |
|
|
- |
|
|
43 |
|
| Price contracts |
|
- |
|
|
115 |
|
|
- |
|
|
64 |
|
|
179 |
|
| Gross amounts recognized |
|
- |
|
|
177 |
|
|
63 |
|
|
81 |
|
|
321 |
|
| Less |
|
|
|
|
|
|
|
|
|
|
|
|
|
|
|
| Impact of gross amounts offseta |
|
|
|
|
|
|
|
|
|
|
|
|
|
195 |
|
| Impact of cash paid as collateralb |
|
|
|
|
|
|
|
|
|
|
|
|
|
71 |
|
| Net liabilities |
|
|
|
|
|
|
|
|
|
|
|
|
|
55 |
d |
Note 7 - Financial Instruments (continued)
| |
|
|
|
|
|
|
|
|
|
|
As at December 31, 2025 |
|
| |
|
Fair value
hedges |
|
|
Cash flow
hedges |
|
|
Net investment
hedges |
|
|
Derivatives not
designated
as hedges |
|
|
Total |
|
| Assets |
|
|
|
|
|
|
|
|
|
|
|
|
|
|
|
| Currency contracts |
|
- |
|
|
527 |
|
|
1 |
|
|
16 |
|
|
544 |
|
| Interest rate contracts |
|
113 |
|
|
49 |
|
|
- |
|
|
- |
|
|
162 |
|
| Price contracts |
|
- |
|
|
- |
|
|
- |
|
|
60 |
|
|
60 |
|
| Gross amounts recognized |
|
113 |
|
|
576 |
|
|
1 |
|
|
76 |
|
|
766 |
|
| Less |
|
|
|
|
|
|
|
|
|
|
|
|
|
|
|
| Impact of gross amounts offseta |
|
|
|
|
|
|
|
|
|
|
|
|
|
111 |
|
| Impact of cash received as collateralb |
|
|
|
|
|
|
|
|
|
|
|
|
|
581 |
|
| Net assets |
|
|
|
|
|
|
|
|
|
|
|
|
|
74 |
c |
| Liabilities |
|
|
|
|
|
|
|
|
|
|
|
|
|
|
|
| Currency contracts |
|
- |
|
|
24 |
|
|
12 |
|
|
9 |
|
|
45 |
|
| Price contracts |
|
- |
|
|
131 |
|
|
- |
|
|
28 |
|
|
159 |
|
| Gross amounts recognized |
|
- |
|
|
155 |
|
|
12 |
|
|
37 |
|
|
204 |
|
| Less |
|
|
|
|
|
|
|
|
|
|
|
|
|
|
|
| Impact of gross amounts offseta |
|
|
|
|
|
|
|
|
|
|
|
|
|
111 |
|
| Impact of cash paid as collateralb |
|
|
|
|
|
|
|
|
|
|
|
|
|
38 |
|
| Net liabilities |
|
|
|
|
|
|
|
|
|
|
|
|
|
55 |
d |
a) The impact of gross amounts offset is related to contracts traded according to ISDA guidelines and constituting enforceable master netting arrangements. Such master netting arrangements apply to all derivative instrument contracts traded over the counter.
b) Cash amounts offset are amounts received or paid under collateral exchange agreements signed in compliance with ISDA guidelines.
c) As at June 30, 2026, $70 million was recorded in Accounts receivable and other assets ($62 million as at December 31, 2025) and $23 million in Other assets
($12 million as at December 31, 2025).
d) As at June 30, 2026, $48 million was recorded in Accounts payable and other liabilities ($45 million as at December 31, 2025) and $7 million in Other liabilities ($10 million as at December 31, 2025).
| Moreover, although certain derivative instruments cannot be offset for lack of enforceable master netting arrangements, margin calls may result in amounts received from or paid to clearing agents, based on the fair value of the instruments concerned. Hydro-Québec may also transfer Treasury bills to a clearing agent as financial collateral. As at June 30, 2026, an amount of $6 million receivable in consideration of net payments ($24 million as at December 31, 2025) and an amount of $27 million receivable in |
|
consideration of the transfer of Treasury bills ($46 million as at December 31, 2025) were included in Accounts receivable and other assets, whereas an amount of $1 million payable in consideration of net cash receipts was included in Accounts payable and other liabilities ($29 million as at December 31, 2025). When the Treasury bills mature, the clearing agent remits the proceeds, including interest, to Hydro-Québec. |
Fair value hierarchy
Fair value measurements of derivative instruments are classified according to a three-level hierarchy, based on the inputs used.
| |
|
|
|
|
As at June 30, 2026 |
|
|
|
|
|
As at December 31, 2025 |
|
| |
|
Level 1 |
a |
|
Level 2 |
b |
|
Level 3 |
c |
|
Total |
|
|
Level 1 |
a |
|
Level 2 |
b |
|
Level 3 |
c |
|
Total |
|
| Assets |
|
39 |
|
|
684 |
|
|
31 |
|
|
754 |
|
|
23 |
|
|
706 |
|
|
37 |
|
|
766 |
|
| Liabilities |
|
49 |
|
|
272 |
|
|
- |
|
|
321 |
|
|
38 |
|
|
165 |
|
|
1 |
|
|
204 |
|
| |
|
|
|
|
|
|
|
|
|
|
433 |
|
|
|
|
|
|
|
|
|
|
|
562 |
|
a) Fair values are derived from the closing price on the balance sheet date.
b) Fair values are obtained by discounting future cash flows, which are estimated on the basis of the spot rates, forward rates or forward prices (foreign exchange rates, interest rates, and energy, aluminum or diesel prices) in effect on the balance sheet date, and take into account the credit risk assessment. The valuation techniques make use of observable market inputs.
c) Fair values are not based on observable inputs. The valuation technique used to classify fixed price power purchase agreements of variable volumes is based on forward energy prices, taking the counterparty's historical consumption into consideration.
Note 7 - Financial Instruments (continued)
Impact of derivative instruments on income and other comprehensive income
The instruments traded, the impact of which is presented in the table below, reduce the volatility of income. Most of the derivative instruments are designated as hedges.
| |
|
Three months ended
June 30 |
|
|
Six months ended
June 30 |
|
| |
|
2026 |
|
|
2025 |
|
|
2026 |
|
|
2025 |
|
| Gains (losses) on derivatives recognized in income |
|
|
|
|
|
|
|
|
|
|
|
|
| Fair value hedges |
|
|
|
|
|
|
|
|
|
|
|
|
| Interest rate contractsa |
|
3 |
|
|
(26 |
) |
|
(7 |
) |
|
(4 |
) |
| Derivatives not designated as hedges |
|
|
|
|
|
|
|
|
|
|
|
|
| Currency contractsb |
|
13 |
|
|
(140 |
) |
|
29 |
|
|
(131 |
) |
| Price contractsb |
|
36 |
|
|
58 |
|
|
80 |
|
|
49 |
|
| |
|
52 |
|
|
(108) |
c |
|
102 |
|
|
(86) |
c |
| (Losses) gains on derivatives reclassified from other comprehensive income to income |
|
|
|
|
|
|
|
|
|
|
|
|
| Cash flow hedges |
|
|
|
|
|
|
|
|
|
|
|
|
| Currency contractsd |
|
47 |
|
|
(201 |
) |
|
105 |
|
|
(211 |
) |
| Interest rate contractsa |
|
1 |
|
|
- |
|
|
1 |
|
|
- |
|
| Price contractse |
|
(72 |
) |
|
17 |
|
|
(113 |
) |
|
(21 |
) |
| |
|
(24 |
) |
|
(184) |
c |
|
(7 |
) |
|
(232) |
c |
| (Losses) gains on derivatives recognized in other comprehensive income |
|
|
|
|
|
|
|
|
|
|
|
|
| Cash flow hedges |
|
|
|
|
|
|
|
|
|
|
|
|
| Currency contracts |
|
7 |
|
|
(140 |
) |
|
48 |
|
|
(121 |
) |
| Interest rate contracts |
|
(44 |
) |
|
142 |
|
|
(40 |
) |
|
131 |
|
| Price contracts |
|
54 |
|
|
(3 |
) |
|
(103 |
) |
|
(30 |
) |
| |
|
17 |
|
|
(1 |
) |
|
(95 |
) |
|
(20 |
) |
| Net investment hedges |
|
|
|
|
|
|
|
|
|
|
|
|
| Currency contracts |
|
(40 |
) |
|
101 |
|
|
(80 |
) |
|
99 |
|
| |
|
(23 |
) |
|
100 |
|
|
(175 |
) |
|
79 |
|
a) These amounts were recognized in Financial expenses.
b) These derivative instruments are essentially traded as part of integrated risk management. Their impact on income is recognized in the line items affected by the managed risk. Therefore, for the three- and six-month periods ended June 30, 2026, $22 million and $63 million, respectively, were recognized in Revenue ($66 million and $57 million for the corresponding periods of 2025), $1 million and $(2) million, respectively, in Electricity purchases ($1 million and a nil for the corresponding periods of 2025), as well as $26 million and $48 million, respectively, in Financial expenses [$(149) million and $(139) million for the corresponding periods of 2025].
c) The items Revenue, Electricity purchases, and Financial expenses totalled, respectively, $4,035 million, $1,050 million and $709 million, respectively, for the three-month period ended June 30, 2026, as well as $9,820 million, $2,589 million and $1,399 million, respectively, for the six-month period ended on that date ($3,716 million, $821 million and $662 million for the three-month period ended June 30, 2025, as well as $9,491 million, $1,914 million and $1,310 million for the six-month period ended on that date).
d) For the three- and six-month periods ended June 30, 2026, nil and $3 million, respectively, were recognized in Revenue [$(4) million and $(13) million for the corresponding periods of 2025], as well as $47 million and $102 million, respectively, in Financial expenses [$(197) million and $(198) million for the corresponding periods of 2025].
e) For the three- and six-month periods ended June 30, 2026, $(72) million and $(113) million, respectively, were recognized in Revenue [$17 million and $(21) million for the corresponding periods of 2025].
|
For the three- and six-month periods ended June 30, 2026 and 2025, Hydro‑Québec did not reclassify any amount from Accumulated other comprehensive income to income after having discontinued cash flow hedges.
As at June 30, 2026, Hydro-Québec estimated that the total gains and losses on derivative instruments in Accumulated other comprehensive income that would be reclassified to income in the
|
|
next 12 months amounted to a net loss of $107 million ($3 million as at June 30, 2025).
As at June 30, 2026, the maximum period during which Hydro-Québec hedged its exposure to the variability of cash flows related to anticipated transactions was four years (five years as at June 30, 2025).
|
Note 7 - Financial Instruments (continued)
Fair value of other financial instruments
The carrying amount of cash equivalents, accounts receivable, deposits and other short-term financial assets and liabilities corresponds to their fair value due to their short maturity.
Fair value measurements for other financial instruments are Level 2 measurements. Fair value is obtained by discounting future cash flows, based on rates observed on the balance sheet date for similar instruments traded on financial markets. These items are presented in the following table:
| |
|
As at June 30, 2026 |
|
|
As at December 31, 2025 |
|
| |
|
Carrying amount |
|
|
Fair value |
|
|
Carrying amount |
|
|
Fair value |
|
| Assets |
|
|
|
|
|
|
|
|
|
|
|
|
| Sinking fundsa, b |
|
2,475 |
|
|
2,520 |
|
|
1,973 |
|
|
1,993 |
|
| Liabilities |
|
|
|
|
|
|
|
|
|
|
|
|
| Long-term debtb |
|
69,950 |
c, d |
|
68,829 |
|
|
65,551 |
c, d |
|
63,787 |
|
a) The sinking funds allocated to repaying the long-term debt consist of securities issued by certain provincial governments in Canada.
b) Includes the current portion.
c) Includes an amount of $1,481 million as at June 30, 2026 ($1,483 million as at December 31, 2025), for debts subject to a fair value hedge, which resulted in an adjustment of $94 million as at June 30, 2026 ($101 million as at December 31, 2025), with respect to existing hedging relationships and of $(39) million as at June 30, 2026 [$(43) million as at December 31, 2025], for hedging relationships terminated by Hydro-Québec.
d) Excludes accrued interest in the amount of $1,055 million as at June 30, 2026 ($1,011 million as at December 31, 2025).
Note 8 - Supplementary Cash Flow Information
| |
|
Three months ended
June 30 |
|
|
Six months ended
June 30 |
|
| |
|
2026 |
|
|
2025 |
|
|
2026 |
|
|
2025 |
|
| Change in non-cash working capital items |
|
|
|
|
|
|
|
|
|
|
|
|
| Accounts receivable and other assets |
|
1,084 |
|
|
1,049 |
|
|
(149 |
) |
|
3 |
|
| Accounts payable and other liabilities |
|
183 |
|
|
498 |
|
|
(281 |
) |
|
50 |
|
| |
|
1,267 |
|
|
1,547 |
|
|
(430 |
) |
|
53 |
|
| Activities not affecting cash |
|
|
|
|
|
|
|
|
|
|
|
|
| Increase in property, plant and equipment and intangible assets |
|
39 |
|
|
35 |
|
|
71 |
|
|
66 |
|
| Increase in operating lease assets and liabilities |
|
118 |
|
|
3 |
|
|
131 |
|
|
13 |
|
| |
|
157 |
|
|
38 |
|
|
202 |
|
|
79 |
|
| Interest paid |
|
58 |
|
|
67 |
|
|
1,228 |
|
|
1,153 |
|
Note 9 - Employee Future Benefits
| |
|
Three months ended
June 30 |
|
| |
|
Pension Plan |
|
|
Other plans |
|
|
Total |
|
| |
|
2026 |
|
|
2025 |
|
|
2026 |
|
|
2025 |
|
|
2026 |
|
|
2025 |
|
| Current service cost |
|
88 |
|
|
93 |
|
|
13 |
|
|
12 |
|
|
101 |
|
|
105 |
|
| Other components of employee future benefit cost |
|
|
|
|
|
|
|
|
|
|
|
|
|
|
|
|
|
|
| Interest on obligations |
|
283 |
|
|
277 |
|
|
15 |
|
|
17 |
|
|
298 |
|
|
294 |
|
| Expected return on plan assets |
|
(541 |
) |
|
(521 |
) |
|
(1 |
) |
|
(2 |
) |
|
(542 |
) |
|
(523 |
) |
| |
|
(258 |
) |
|
(244 |
) |
|
14 |
|
|
15 |
|
|
(244 |
) |
|
(229 |
) |
| Net (credit) cost recognized |
|
(170 |
) |
|
(151 |
) |
|
27 |
|
|
27 |
|
|
(143 |
) |
|
(124 |
) |
| |
|
Six months ended
June 30 |
|
| |
|
Pension Plan |
|
|
Other plans |
|
|
Total |
|
| |
|
2026 |
|
|
2025 |
|
|
2026 |
|
|
2025 |
|
|
2026 |
|
|
2025 |
|
| Current service cost |
|
177 |
|
|
186 |
|
|
26 |
|
|
25 |
|
|
203 |
|
|
211 |
|
| Other components of employee future benefit cost |
|
|
|
|
|
|
|
|
|
|
|
|
|
|
|
|
|
|
| Interest on obligations |
|
565 |
|
|
555 |
|
|
31 |
|
|
32 |
|
|
596 |
|
|
587 |
|
| Expected return on plan assets |
|
(1,083 |
) |
|
(1,043 |
) |
|
(1 |
) |
|
(2 |
) |
|
(1,084 |
) |
|
(1,045 |
) |
| |
|
(518 |
) |
|
(488 |
) |
|
30 |
|
|
30 |
|
|
(488 |
) |
|
(458 |
) |
| Net (credit) cost recognized |
|
(341 |
) |
|
(302 |
) |
|
56 |
|
|
55 |
|
|
(285 |
) |
|
(247 |
) |
Note 10 - Accumulated Other Comprehensive Income
| |
|
|
|
|
|
|
|
|
|
|
|
|
|
Six months ended
June 30, 2026 |
|
| |
|
Cash flow
hedges |
|
|
Translation
differences |
|
|
Net investment
hedges |
|
|
Employee
future
benefits |
|
|
Other |
|
|
Accumulated other
comprehensive
income |
|
| Balance as at December 31, 2025 |
|
649 |
|
|
104 |
|
|
(69 |
) |
|
799 |
|
|
1 |
|
|
1,484 |
|
| Other comprehensive income (loss) before reclassifications |
|
(95 |
) |
|
67 |
|
|
(80 |
) |
|
- |
|
|
- |
|
|
(108 |
) |
| Less |
|
|
|
|
|
|
|
|
|
|
|
|
|
|
|
|
|
|
| (Losses) gains reclassified outside of Accumulated other comprehensive income |
|
(7 |
) |
|
16a |
|
|
- |
|
|
- |
|
|
- |
|
|
9 |
|
| Other comprehensive income (loss) |
|
(88 |
) |
|
51 |
|
|
(80 |
) |
|
- |
|
|
- |
|
|
(117 |
) |
| Balance as at June 30, 2026 |
|
561 |
|
|
155 |
|
|
(149 |
) |
|
799 |
|
|
1 |
|
|
1,367 |
|
| |
|
|
|
|
|
|
|
|
|
|
|
|
|
Six months ended
June 30, 2025 |
|
| |
|
Cash flow
hedges |
|
|
Translation
differences |
|
|
Net investment
hedges |
|
|
Employee
future
benefits |
|
|
Other |
|
|
Accumulated other
comprehensive
income |
|
| Balance as at December 31, 2024 |
|
471 |
|
|
184 |
|
|
(137 |
) |
|
210 |
|
|
29 |
|
|
757 |
|
| Other comprehensive income (loss) before reclassifications |
|
(20 |
) |
|
(107 |
) |
|
99 |
|
|
1 |
|
|
20 |
|
|
(7 |
) |
| Less |
|
|
|
|
|
|
|
|
|
|
|
|
|
|
|
|
|
|
Losses reclassified
outside of Accumulated other comprehensive income |
|
(232 |
) |
|
- |
|
|
- |
|
|
- |
|
|
- |
|
|
(232 |
) |
| Other comprehensive income (loss) |
|
212 |
|
|
(107 |
) |
|
99 |
|
|
1 |
|
|
20 |
|
|
225 |
|
| Balance as at June 30, 2025 |
|
683 |
|
|
77 |
|
|
(38 |
) |
|
211 |
|
|
49 |
|
|
982 |
|
a) Reclassification of a gain from Accumulated other comprehensive income to income, due to the disposal of an equity method investment (see Note 6, Other Assets).
Note 11 - Contingencies
|
Litigation
In the normal course of its development and operations, Hydro‑Québec is involved in claims and legal proceedings from time to time. Management believes that adequate provision has been made for such litigation. Consequently, it does not expect any material adverse effect of such contingent liabilities on the financial position or consolidated results of Hydro‑Québec.
Among other pending actions, certain First Nations and Inuit communities have instituted proceedings before the Québec courts against the governments of Canada and Québec and against Hydro‑Québec based on claims of Aboriginal rights and titles. For example, the Innu of Uashat mak Mani-utenam are claiming $1.5 billion as compensation, namely, for various activities carried out on the territory they claim, including the generation and transmission of electricity. Hydro-Québec is contesting the merits of this claim. In addition, the Innu of Pessamit have brought an action seeking the recognition of their Aboriginal rights and title to lands in Québec where certain Hydro‑Québec electricity generation and transmission facilities are located, including the Manic-Outardes and Bersimis hydroelectric complexes. They allege that these facilities infringe on their Aboriginal rights and title and are claiming $500 million in compensation. Although Hydro-Québec is contesting the merits of this claim, together with the government of Québec, it participated in negotiations with the Innu of Pessamit. In July 2026, the agreement submitted to the community for ratification was rejected.
In addition, proceedings have been instituted against Hydro‑Québec and Churchill Falls (Labrador) Corporation Limited [“CF(L)Co”] relative to the Churchill Falls hydroelectric complex in Labrador, which is owned and operated by CF(L)Co. In an action brought before the courts of Newfoundland and Labrador in October 2020, Innu Nation Inc. alleges that the construction and operation of this hydroelectric complex amount to a “common enterprise” of CF(L)Co and Hydro-Québec, and allegedly infringe on the Aboriginal rights and title of the Labrador Innu. Innu Nation Inc. seeks
|
|
a disgorgement of the profits that CF(L)Co and Hydro‑Québec have derived from the operation of this hydroelectric complex or, failing that, monetary compensation of $4 billion with regard to Hydro‑Québec. However, on June 4, 2025, Hydro-Québec and Innu Nation Inc. agreed on a memorandum of understanding (MOU) in which the parties committed to settling their dispute and establishing the foundations and principles of a new relationship. In September 2025, an agreement to this effect was submitted to the two communities that make up Innu Nation Inc. with a view to ratification. As elements required to ratify the agreement are currently pending, Hydro-Québec and Innu Nation Inc. are pursuing their collaboration and will decide on future steps together.
In another action brought in 2023 before the Québec Superior Court, the Innu of Uashat mak Mani-utenam and the Innu of Matimekush-Lac John allege that the Churchill Falls hydroelectric complex infringes on their Aboriginal rights and title, as well as their treaty rights. In addition to various judicial declarations and permanent injunction orders, these two communities are jointly claiming from Hydro‑Québec $2 billion in compensatory damages, $200 million in punitive damages, and additional damages in the form of an annual payment equivalent to 12.5% of 15% of Hydro‑Québec’s annual profits from the date of the commencement of the proceedings. Hydro-Québec is contesting the merits of this claim.
On October 27, 2025, the Kitigan Zibi Anishinabeg instituted proceedings before the Québec Superior Court based on the claims of Aboriginal rights and titles, targeting the Canadian and Québec governments as well as Hydro-Québec and the National Capital Commission, for damages totalling $5 billion. Regarding Hydro-Québec, they allege that economic benefits were gained from the Mercier hydroelectric dam, and are asking for compensation for loss of profits along with punitive damages. Hydro‑Québec is contesting the merits of this claim.
|
Note 12 - Information on the Operating Segment
Hydro-Québec has only one operating segment and manages its operations using a cross-functional approach. Its results and total assets are analyzed on a consolidated basis by the person acting as chief operating decision maker, i.e., the President and Chief Executive Officer. The latter uses net income to analyze actual and forecast results in order to assess Hydro-Québec's performance. Significant expenses that are submitted to the chief operating decision maker for this purpose on a regular basis over the course of the period are disclosed in the following table. Investments are also submitted to the chief operating decision maker.
| |
|
|
Three months ended
June 30 |
|
|
Six months ended
June 30 |
|
| |
Notes |
|
2026 |
|
|
2025 |
|
|
2026 |
|
|
2025 |
|
| Revenue |
4 |
|
4,035 |
|
|
3,716 |
|
|
9,820 |
|
|
9,491 |
|
| Expenses |
|
|
|
|
|
|
|
|
|
|
|
|
|
| Current operationsa |
|
|
1,085 |
|
|
1,057 |
|
|
2,143 |
|
|
2,023 |
|
| Electricity purchases |
|
|
1,050 |
|
|
821 |
|
|
2,589 |
|
|
1,914 |
|
| Depreciation and amortization |
|
|
837 |
|
|
768 |
|
|
1,612 |
|
|
1,525 |
|
| Regulatory deferrals |
|
|
27 |
|
|
- |
|
|
(334 |
) |
|
- |
|
| Otherb |
|
|
157 |
|
|
187 |
|
|
391 |
|
|
442 |
|
| Financial expenses |
5 |
|
709 |
|
|
662 |
|
|
1,399 |
|
|
1,310 |
|
| Net income |
|
|
170 |
|
|
221 |
|
|
2,020 |
|
|
2,277 |
|
| Investmentsc |
|
|
1,868 |
|
|
1,885 |
|
|
3,439 |
|
|
3,292 |
|
| Equity method investments on June 30 |
|
|
|
|
|
|
|
|
1,700 |
|
|
1,769 |
|
a) Current operational expenses are mainly composed of payroll, the cost of external services, acquisition costs of tangible and intangible property, and operating lease expenses.
b) Other expenses are composed of taxes, subsidiary expenses, other components of employee future benefit cost, as well as, current service cost of the Pension Plan.
c) The investments, as presented in this case for management purposes, are mainly composed of investments in property, plant and equipment and intangible assets, and also include investments in the regulatory asset with respect to costs related to energy efficiency and demand response initiatives.
CONSOLIDATED FINANCIAL HIGHLIGHTS
(UNAUDITED)
Amounts shown in tables are in millions of Canadian dollars.
| |
|
Three months ended
June 30 |
|
|
Six months ended
June 30 |
|
| Summary of Results |
|
2026 |
|
|
2025 |
|
|
Change (%) |
|
|
2026 |
|
|
2025 |
|
|
Change (%) |
|
| Revenue |
|
4,035 |
|
|
3,716 |
|
|
8.6 |
|
|
↑ |
|
|
9,820 |
|
|
9,491 |
|
|
3.5 |
|
|
↑ |
|
| Expenses |
|
3,156 |
|
|
2,833 |
|
|
11.4 |
|
|
↑ |
|
|
6,401 |
|
|
5,904 |
|
|
8.4 |
|
|
↑ |
|
| Financial expenses |
|
709 |
|
|
662 |
|
|
7.1 |
|
|
↑ |
|
|
1,399 |
|
|
1,310 |
|
|
6.8 |
|
|
↑ |
|
| Net income |
|
170 |
|
|
221 |
|
|
23.1 |
|
|
↓ |
|
|
2,020 |
|
|
2,277 |
|
|
11.3 |
|
|
↓ |
|