If you wish to view additional information about the Fund, including but not limited to the financial statements and holdings, please visit www.graniteshares.com
Phone: (844) 476 8747 – email: info@graniteshares.com
What were the fund’s costs for the last 12 months?
(based on hypothetical $10,000 investment)
| Expense Ratio (Actual) | 0.70% |
| Cost of a $10,000 Investment | $71.79 |
Hypothetical example: The cost shown is the amount you would pay on a $10,000 investment, assuming a return of 5.26% and an expense ratio of 0.70%.
How did the fund perform for the last 12 months?
During the period of June 30, 2025 to June 30, 2026, the Fund had a 5.82% return.
Over the same period the Benchmark had a return of 22.32%.
How did the fund perform since inception.
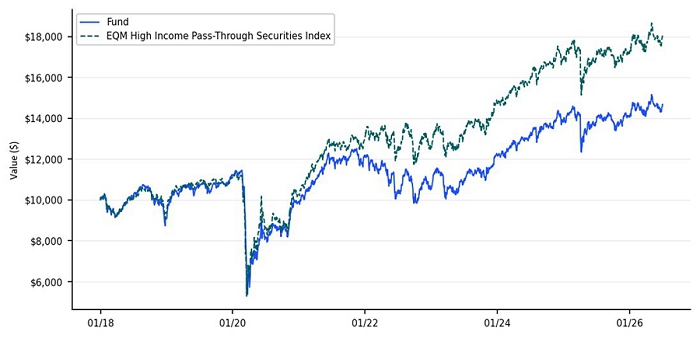
The $10,000 chart reflects a hypothetical $10,000 investment in the Fund. The chart uses total return NAV performance and assumes reinvestment of dividends and capital gains. The NAV performance includes all fund expenses.
Average Annual Total Returns
As of June 30, 2026
| 1 Year | 3 Year | 5 Year | 10 Year | Since
Inception (1/6/2015) | |
| GraniteShares HIPS US High Income ETF - NAV | 5.82% | 10.07% | 4.01% | 5.49% | 4.21% |
| S&P 500® Total Return Index | 22.32% | 20.61% | 13.41% | 15.51% | 14.16% |
| EQM High Income Pass-Through Securities Index/TFMS HIPS | 6.31% | 10.81% | 4.70% | 6.26% | 4.93% |
Fund Statistics
| Net Assets | $109,902,109 |
| Total Number of Holdings | 41 |
| Portfolio Turnover Rate | 52% |
| Inception Date | 1/6/2015 |
What does the Fund invest in?
The Fund attempts to invest all, or substantially all, of its assets in the securities that make up the EQM High Income PassThrough Securities Index.
Top 10 Holdings
As of June 30, 2026
| Holding | % of Total Investments |
| United States Treasury Bill | 30.88% |
| Two Harbors Investment Corp. | 2.08% |
| Plains All American Pipeline LP | 2.06% |
| Kimbell Royalty Partners LP | 2.03% |
| Dorchester Minerals LP | 2.02% |
| Delek Logistics Partners LP | 2.01% |
| BlackRock Enhanced Large Cap Core Fund, Inc. | 2.00% |
| Western Midstream Partners LP | 1.95% |
| CVR Partners LP | 1.92% |
| Capital Southwest Corp. | 1.91% |
Sector Breakdown
| Sector | % of Total Investments |
| Financial | 32.67% |
| Government | 30.88% |
| Energy | 17.48% |
| Closed End Funds | 17.05% |
| Basic Materials | 1.92% |
Material Fund Changes
There were no material fund changes during the period
If you wish to view additional information about the Fund, including but not limited to the financial statements and holdings, please visit www.graniteshares.com
Phone: (844) 476 8747 – email: info@graniteshares.com
What were the fund’s costs for the last 12 months?
(based on hypothetical $10,000 investment)
| Expense Ratio (Actual) | 0.25% |
| Cost of a $10,000 Investment | $28.07 |
Hypothetical example: The cost shown is the amount you would pay on a $10,000 investment, assuming a return of 24.61% and an expense ratio of 0.25%.
How did the fund perform for the last 12 months?
During the period of June 30, 2025 to June 30, 2026, the Fund had a 25.06% return.
Over the same period the Benchmark had a return of 25.46%.
How did the fund perform since inception.
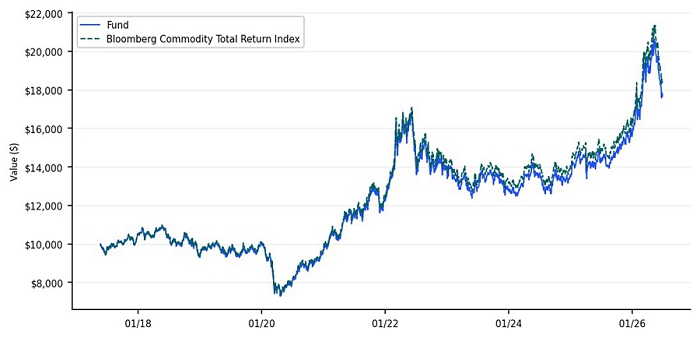
The $10,000 chart reflects a hypothetical $10,000 investment in the Fund. The chart uses total return NAV performance and assumes reinvestment of dividends and capital gains. The NAV performance includes all fund expenses.
Average Annual Total Returns
As of June 30, 2026
| 1 Year | 3 Year | 5 Year | Since
Inception (5/19/2017) | |
| GraniteShares Bloomberg Commodity Broad Strategy No K-1 ETF - NAV | 25.06% | 11.26% | 8.85% | 6.50% |
| Bloomberg Commodity Total Return Index | 25.46% | 11.69% | 9.37% | 6.92% |
Fund Statistics
| Net Assets | $121,498,610 |
| Total Number of Holdings | 40 |
| Portfolio Turnover Rate | 0% |
| Inception Date | 5/19/2017 |
What does the Fund invest in?
While the Fund generally seeks exposure to the commodity futures markets included in the Bloomberg Commodity Index.
The Fund seeks to enhance its performance, in part through a cash management strategy consisting of investments in investment grade fixed income securities issued by various U.S. public sector or corporate entities
Top 10 Holdings
As of June 30, 2026
| Holding | % of Total Investments |
| United States Treasury Bill | 41.00% |
| Gold 100 Oz Future | 6.38% |
| Brent Crude | 4.79% |
| WTI CRUDE FUTURE Sep16 | 3.86% |
| NATURAL GAS FUTR Sep26 | 3.70% |
| Copper | 3.18% |
| Soybean | 2.68% |
| Corn | 2.42% |
| Low Su Gasoil G Sep16 | 2.02% |
| LME PRI ALUM FUTR Sep26 | 1.86% |
Sector Breakdown
| Sector | % of Total Investments |
| Futures | 50.46% |
| Government | 41.00% |
| Broker Cash | 8.54% |
Material Fund Changes
There were no material fund changes during the period
If you wish to view additional information about the Fund, including but not limited to the financial statements and holdings, please visit www.graniteshares.com
Phone: (844) 476 8747 – email: info@graniteshares.com
What were the fund’s costs for the last 12 months?
(based on hypothetical $10,000 investment)
| Expense Ratio (Actual) | 0.60% |
| Cost of a $10,000 Investment | $60.24 |
Hypothetical example: The cost shown is the amount you would pay on a $10,000 investment, assuming a return of 0.76% and an expense ratio of 0.60%.
How did the fund perform for the last 12 months?
During the period of June 30, 2025 to June 30, 2026, the Fund had a -0.39% return.
Over the same period the Benchmark had a return of 0.19%.
How did the fund perform since inception.
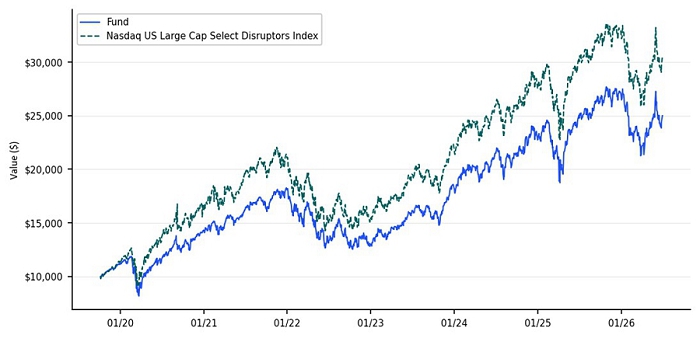
The $10,000 chart reflects a hypothetical $10,000 investment in the Fund. The chart uses total return NAV performance and assumes reinvestment of dividends and capital gains. The NAV performance includes all fund expenses.
Average Annual Total Returns
As of June 30, 2026
| 1 Year | 3 Year | 5 Year | Since
Inception (10/4/2019) | |
| GraniteShares Nasdaq Select Disruptors ETF - NAV | -0.39% | 15.66% | 9.02% | 14.56% |
| Nasdaq US Large Cap Select Disruptors Index | 0.19% | 15.74% | 8.84% | 17.39% |
Fund Statistics
| Net Assets | $46,556,053 |
| Total Number of Holdings | 50 |
| Portfolio Turnover Rate | 47% |
| Inception Date | 10/4/2019 |
What does the Fund invest in?
The Fund seeks to achieve its investment objective by investing, under normal circumstances, at least 80% of its assets (exclusive of collateral held from securities lending) in the securities included in the Nasdaq US Large Cap Select Disruptors Index.
Top 10 Holdings
As of June 30, 2026
| Holding | % of Total Investments |
| Microsoft Corp. | 8.65% |
| Alphabet, Inc. | 8.27% |
| Meta Platforms, Inc. | 6.06% |
| Eli Lilly & Co. | 6.05% |
| Johnson & Johnson | 4.80% |
| Cisco Systems, Inc. | 3.89% |
| Palo Alto Networks, Inc. | 3.38% |
| Arista Networks, Inc. | 2.66% |
| Crowdstrike Holdings, Inc. | 2.63% |
| Palantir Technologies, Inc. | 2.59% |
Sector Breakdown
| Sector | % of Total Investments |
| Technology | 38.46% |
| Consumer, Non-cyclical | 29.71% |
| Communications | 28.69% |
| Industrial | 2.57% |
| Financial | 0.57% |
Material Fund Changes
There were no material fund changes during the period
If you wish to view additional information about the Fund, including but not limited to the financial statements and holdings, please visit www.graniteshares.com
Phone: (844) 476 8747 – email: info@graniteshares.com
What were the fund’s costs for the last 12 months?
(based on hypothetical $10,000 investment)
| Expense Ratio (Actual) | 1.15% |
| Cost of a $10,000 Investment | $156.16 |
Hypothetical example: The cost shown is the amount you would pay on a $10,000 investment, assuming a return of 71.55% and an expense ratio of 1.15%.
How did the fund perform for the last 12 months?
During the period of June 30, 2025 to June 30, 2026, the Fund had a 75.94% return.
Over the same period the Benchmark had a return of 22.32%.
How did the fund perform since inception.
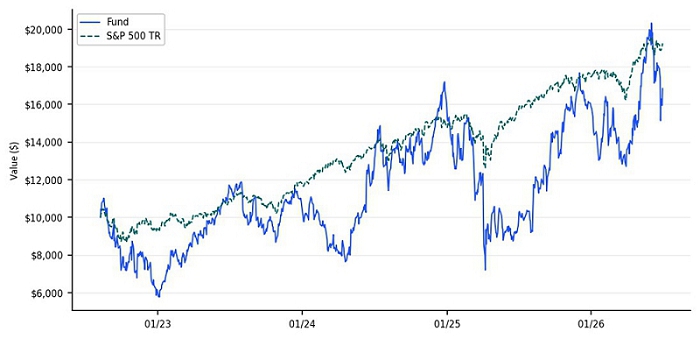
The $10,000 chart reflects a hypothetical $10,000 investment in the Fund. The chart uses total return NAV performance and assumes reinvestment of dividends and capital gains. The NAV performance includes all fund expenses.
Average Annual Total Returns
As of June 30, 2026
| 1 Year | 3 Year | Since
Inception (8/8/2022) | |
| GraniteShares 2x Long AAPL Daily ETF - NAV | 75.94% | 12.68% | 14.29% |
| S&P 500® Total Return Index | 22.32% | 20.61% | 18.18% |
Fund Statistics
| Net Assets | $18,340,919 |
| Total Number of Holdings | 2 |
| Portfolio Turnover Rate | 0% |
| Inception Date | 8/8/2022 |
What does the Fund invest in?
The Fund enters into financial instruments such as swaps and options on the common stock of Apple Inc (NASDAQ: AAPL).
The Fund may also invest in (1) U.S. Government securities, such as bills, notes and bonds issued by the U.S. Treasury; (2) money market funds; (3) short term bond ETFs and/or (4) corporate debt securities, such as commercial paper and other short-term unsecured promissory notes issued by businesses that are rated investment grade or of comparable quality as collateral for the Fund’s swap agreements
Top 10 Holdings
As of June 30, 2026
| Holding | % of Total Investments |
| United States Treasury Bill | 53.46% |
| AAPL EQUITY SWAP | 45.74% |
Sector Breakdown
| Sector | % of Total Investments |
| Government | 53.46% |
| Total Return Swap | 45.74% |
| Broker Cash | 0.80% |
Material Fund Changes
There were no material fund changes during the period
If you wish to view additional information about the Fund, including but not limited to the financial statements and holdings, please visit www.graniteshares.com
Phone: (844) 476 8747 – email: info@graniteshares.com
What were the fund’s costs for the last 12 months?
(based on hypothetical $10,000 investment)
| Expense Ratio (Actual) | 1.06% |
| Cost of a $10,000 Investment | $81.99 |
Hypothetical example: The cost shown is the amount you would pay on a $10,000 investment, assuming a return of -44.86% and an expense ratio of 1.06%.
How did the fund perform for the last 12 months?
During the period of June 30, 2025 to June 30, 2026, the Fund had a -44.33% return.
Over the same period the Benchmark had a return of 22.32%.
How did the fund perform since inception.
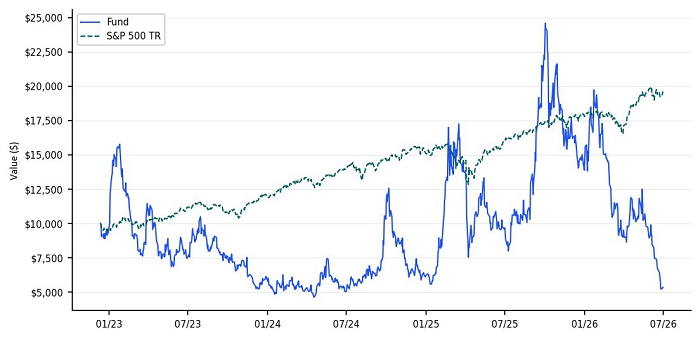
The $10,000 chart reflects a hypothetical $10,000 investment in the Fund. The chart uses total return NAV performance and assumes reinvestment of dividends and capital gains. The NAV performance includes all fund expenses.
Average Annual Total Returns
As of June 30, 2026
| 1 Year | 3 Year | Since
Inception (12/12/2022) | |
| GraniteShares 2x Long BABA Daily ETF - NAV | -44.33% | -10.66% | -15.32% |
| S&P 500® Total Return Index | 22.32% | 20.61% | 21.15% |
Fund Statistics
| Net Assets | $74,518,266 |
| Total Number of Holdings | 3 |
| Portfolio Turnover Rate | 0% |
| Inception Date | 12/12/2022 |
What does the Fund invest in?
The Fund enters into financial instruments such as swaps and options on the ADR of Alibaba Group Holding Limited (NYSE: BABA).
The Fund may invest in (1) U.S. Government securities, such as bills, notes and bonds issued by the U.S. Treasury; (2) money market funds; (3) short term bond ETFs and/or (4) corporate debt securities, such as commercial paper and other short-term unsecured promissory notes issued by businesses that are rated investment grade or of comparable quality as collateral for the Fund’s swap agreements.
Top 10 Holdings
As of June 30, 2026
| Holding | % of Total Investments |
| Recv Long Baba Trs Cs1 | 30.25% |
| BABA EQUITY SWAP | 26.70% |
| Recv Long Baba Trs Wf | 13.23% |
Sector Breakdown
| Sector | % of Total Investments |
| Total Return Swap | 70.17% |
| Broker Cash | 29.83% |
Material Fund Changes
There were no material fund changes during the period
If you wish to view additional information about the Fund, including but not limited to the financial statements and holdings, please visit www.graniteshares.com
Phone: (844) 476 8747 – email: info@graniteshares.com
What were the fund’s costs for the last 12 months?
(based on hypothetical $10,000 investment)
| Expense Ratio (Actual) | 1.01% |
| Cost of a $10,000 Investment | $55.69 |
Hypothetical example: The cost shown is the amount you would pay on a $10,000 investment, assuming a return of -89.90% and an expense ratio of 1.01%.
How did the fund perform for the last 12 months?
During the period of June 30, 2025 to June 30, 2026, the Fund had a -90.77% return.
Over the same period the Benchmark had a return of 22.32%.
How did the fund perform since inception.
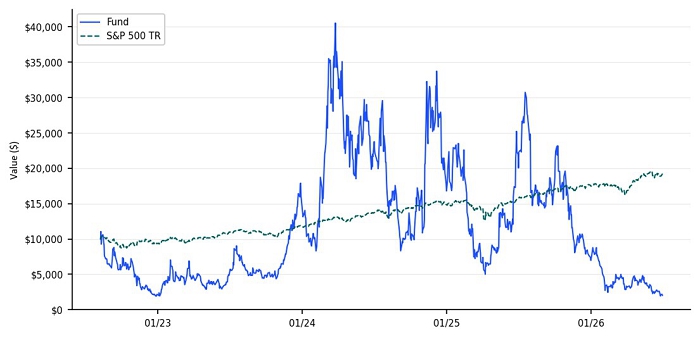
The $10,000 chart reflects a hypothetical $10,000 investment in the Fund. The chart uses total return NAV performance and assumes reinvestment of dividends and capital gains. The NAV performance includes all fund expenses.
Average Annual Total Returns
As of June 30, 2026
| 1 Year | 3 Year | Since
Inception (8/8/2022) | |
| GraniteShares 2x Long COIN Daily ETF - NAV | -90.77% | -25.34% | -36.48% |
| S&P 500® Total Return Index | 22.32% | 20.61% | 18.18% |
Fund Statistics
| Net Assets | $549,468,295 |
| Total Number of Holdings | 8 |
| Portfolio Turnover Rate | 0% |
| Inception Date | 8/8/2022 |
What does the Fund invest in?
The Fund enters into financial instruments such as swaps and options on the common stock of Coinbase Global Inc. (NASDAQ: COIN).
The Fund may invest in (1) U.S. Government securities, such as bills, notes and bonds issued by the U.S. Treasury; (2) money market funds; (3) short term bond ETFs and/or (4) corporate debt securities, such as commercial paper and other short-term unsecured promissory notes issued by businesses that are rated investment grade or of comparable quality as collateral for the Fund’s swap agreements
Top 10 Holdings
As of June 30, 2026
| Holding | % of Total Investments |
| COIN EQUITY SWAP | 18.63% |
| COIN EQUITY SWAP 1 | 9.92% |
| COIN EQUITY SWAP 3 | 9.18% |
| Recv Long 2x Coin Gs1 | 9.14% |
| Recv Long 2x Coin Bmo1 | 6.64% |
| COIN EQUITY SWAP 2 | 5.41% |
| Recv Long 2x Coin Bmo1 | 1.86% |
| United States Treasury Bill | 1.11% |
Sector Breakdown
| Sector | % of Total Investments |
| Total Return Swap | 60.78% |
| Broker Cash | 38.11% |
| Government | 1.11% |
Material Fund Changes
There were no material fund changes during the period
If you wish to view additional information about the Fund, including but not limited to the financial statements and holdings, please visit www.graniteshares.com
Phone: (844) 476 8747 – email: info@graniteshares.com
What were the fund’s costs for the last 12 months?
(based on hypothetical $10,000 investment)
| Expense Ratio (Actual) | 1.02% |
| Cost of a $10,000 Investment | $76.37 |
Hypothetical example: The cost shown is the amount you would pay on a $10,000 investment, assuming a return of -50.71% and an expense ratio of 1.02%.
How did the fund perform for the last 12 months?
During the period of June 30, 2025 to June 30, 2026, the Fund had a -53.21% return.
Over the same period the Benchmark had a return of 22.32%.
How did the fund perform since inception.
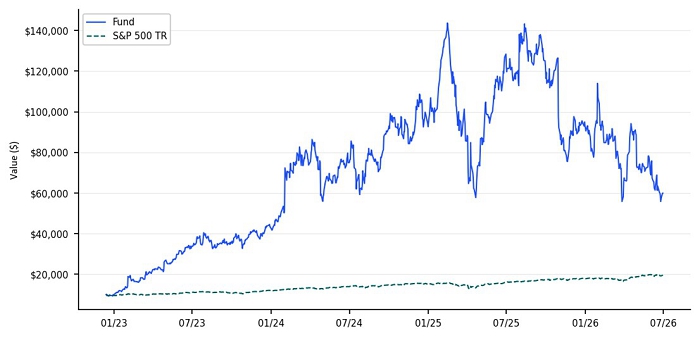
The $10,000 chart reflects a hypothetical $10,000 investment in the Fund. The chart uses total return NAV performance and assumes reinvestment of dividends and capital gains. The NAV performance includes all fund expenses.
Average Annual Total Returns
As of June 30, 2026
| 1 Year | 3 Year | Since
Inception (12/12/2022) | |
| GraniteShares 2x Long META Daily ETF - NAV | -53.21% | 21.00% | 69.13% |
| S&P 500® Total Return Index | 22.32% | 20.61% | 21.15% |
Fund Statistics
| Net Assets | $197,621,220 |
| Total Number of Holdings | 5 |
| Portfolio Turnover Rate | 0% |
| Inception Date | 12/12/2022 |
What does the Fund invest in?
The Fund enters into financial instruments such as swaps and options on the common stock of Meta Platforms Inc. (NASDAQ: META).
The Fund may invest in (1) U.S. Government securities, such as bills, notes and bonds issued by the U.S. Treasury; (2) money market funds; (3) short term bond ETFs and/or (4) corporate debt securities, such as commercial paper and other short-term unsecured promissory notes issued by businesses that are rated investment grade or of comparable quality as collateral for the Fund’s swap agreements
Top 10 Holdings
As of June 30, 2026
| Holding | % of Total Investments |
| META EQUITY SWAP 1 | 23.81% |
| Recv Meta Trs:30303m102 | 17.44% |
| Recv Long 2x Meta Trs Gs | 14.07% |
| META EQUITY SWAP | 13.36% |
| United States Treasury Bill | 3.47% |
Sector Breakdown
| Sector | % of Total Investments |
| Total Return Swap | 68.67% |
| Broker Cash | 27.86% |
| Government | 3.47% |
Material Fund Changes
There were no material fund changes during the period
If you wish to view additional information about the Fund, including but not limited to the financial statements and holdings, please visit www.graniteshares.com
Phone: (844) 476 8747 – email: info@graniteshares.com
What were the fund’s costs for the last 12 months?
(based on hypothetical $10,000 investment)
| Expense Ratio (Actual) | 1.02% |
| Cost of a $10,000 Investment | $119.74 |
Hypothetical example: The cost shown is the amount you would pay on a $10,000 investment, assuming a return of 35.30% and an expense ratio of 1.02%.
How did the fund perform for the last 12 months?
During the period of June 30, 2025 to June 30, 2026, the Fund had a 27.28% return.
Over the same period the Benchmark had a return of 22.32%.
How did the fund perform since inception.
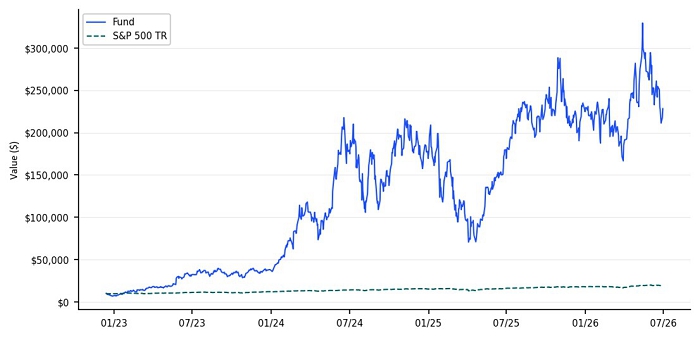
The $10,000 chart reflects a hypothetical $10,000 investment in the Fund. The chart uses total return NAV performance and assumes reinvestment of dividends and capital gains. The NAV performance includes all fund expenses.
Average Annual Total Returns
As of June 30, 2026
| 1 Year | 3 Year | Since
Inception (12/12/2022) | |
| GraniteShares 2x Long NVDA Daily ETF - NAV | 27.28% | 92.23% | 144.86% |
| S&P 500® Total Return Index | 22.32% | 20.61% | 21.15% |
Fund Statistics
| Net Assets | $4,051,374,858 |
| Total Number of Holdings | 11 |
| Portfolio Turnover Rate | 0% |
| Inception Date | 12/12/2022 |
What does the Fund invest in?
The Fund enters into financial instruments such as swaps and options on the common stock of NVIDIA Corp. (NASDAQ: NVDA).
The Fund may invest in (1) U.S. Government securities, such as bills, notes and bonds issued by the U.S. Treasury; (2) money market funds; (3) short term bond ETFs and/or (4) corporate debt securities, such as commercial paper and other short -term unsecured promissory notes issued by businesses that are rated investment grade or of comparable quality as collateral for the Fund’s swap agreements
Top 10 Holdings
As of June 30, 2026
| Holding | % of Total Investments |
| United States Treasury Bill | 59.71% |
| NVDA EQUITY SWAP | 23.38% |
| NVDA EQUITY SWAP 2 | 6.45% |
| NVDA EQUITY SWAP 1 | 3.29% |
| NVDA EQUITY SWAP 19 | 1.66% |
| NVDA EQUITY SWAP 5 | 1.01% |
| Recv Long Nvda Trs Gs2 | 0.92% |
| United States Treasury Bill | 0.69% |
| NVDA EQUITY SWAP 4 | 0.65% |
| NVDA EQUITY SWAP 7 | 0.00% |
Sector Breakdown
| Sector | % of Total Investments |
| Government | 60.40% |
| Total Return Swap | 37.35% |
| Broker Cash | 2.25% |
Material Fund Changes
There were no material fund changes during the period
If you wish to view additional information about the Fund, including but not limited to the financial statements and holdings, please visit www.graniteshares.com
Phone: (844) 476 8747 – email: info@graniteshares.com
What were the fund’s costs for the last 12 months?
(based on hypothetical $10,000 investment)
| Expense Ratio (Actual) | 1.27% |
| Cost of a $10,000 Investment | $91.11 |
Hypothetical example: The cost shown is the amount you would pay on a $10,000 investment, assuming a return of -56.32% and an expense ratio of 1.27%.
How did the fund perform for the last 12 months?
During the period of June 30, 2025 to June 30, 2026, the Fund had a -53.87% return.
Over the same period the Benchmark had a return of 22.32%.
How did the fund perform since inception.
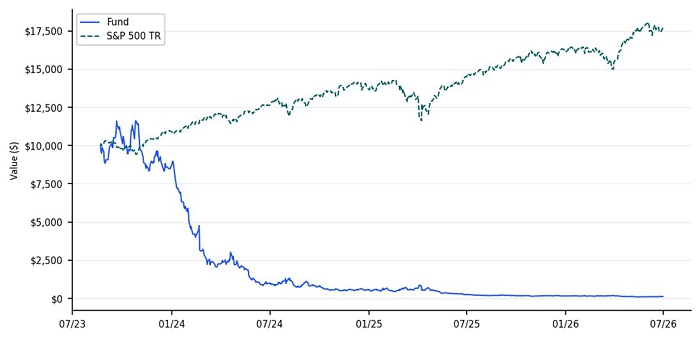
The $10,000 chart reflects a hypothetical $10,000 investment in the Fund. The chart uses total return NAV performance and assumes reinvestment of dividends and capital gains. The NAV performance includes all fund expenses.
Average Annual Total Returns
As of June 30, 2026
| 1 Year | Since
Inception (8/21/2023) | |
| GraniteShares 2x Short NVDA Daily ETF - NAV | -53.87% | -78.84% |
| S&P 500® Total Return Index | 22.32% | 22.12% |
Fund Statistics
| Net Assets | $60,726,077 |
| Total Number of Holdings | 3 |
| Portfolio Turnover Rate | 0% |
| Inception Date | 8/21/2023 |
What does the Fund invest in?
The Fund enters into financial instruments such as swaps and options on the common stock of NVIDIA Corp. (NASDAQ: NVDA).
The Fund may invest in (1) U.S. Government securities, such as bills, notes and bonds issued by the U.S. Treasury; (2) money market funds; (3) short term bond ETFs and/or (4) corporate debt securities, such as commercial paper and other short -term unsecured promissory notes issued by businesses that are rated investment grade or of comparable quality as collateral for the Fund’s swap agreements
Top 10 Holdings
As of June 30, 2026
| Holding | % of Total Investments |
| NVDA EQUITY SWAP | 37.83% |
| GRANITESHARES SHORT NVDA SWAP | % |
| Recv Short 2x Nvda Gs1 | 6.73% |
Sector Breakdown
| Sector | % of Total Investments |
| Total Return Swap | 55.69% |
| Broker Cash | 44.31% |
Material Fund Changes
There were no material fund changes during the period
If you wish to view additional information about the Fund, including but not limited to the financial statements and holdings, please visit www.graniteshares.com
Phone: (844) 476 8747 – email: info@graniteshares.com
What were the fund’s costs for the last 12 months?
(based on hypothetical $10,000 investment)
| Expense Ratio (Actual) | 1.15% |
| Cost of a $10,000 Investment | $139.53 |
Hypothetical example: The cost shown is the amount you would pay on a $10,000 investment, assuming a return of 42.65% and an expense ratio of 1.15%.
How did the fund perform for the last 12 months?
During the period of June 30, 2025 to June 30, 2026, the Fund had a 33.17% return.
Over the same period the Benchmark had a return of 22.32%.
How did the fund perform since inception.
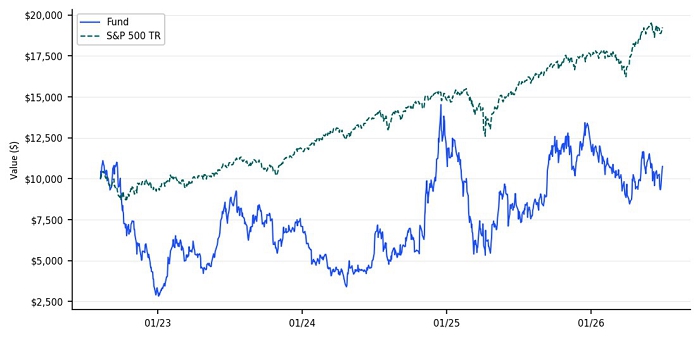
The $10,000 chart reflects a hypothetical $10,000 investment in the Fund. The chart uses total return NAV performance and assumes reinvestment of dividends and capital gains. The NAV performance includes all fund expenses.
Average Annual Total Returns
As of June 30, 2026
| 1 Year | 3 Year | Since
Inception (8/8/2022) | |
| GraniteShares 1.25x Long TSLA Daily ETF - NAV | 33.17% | 10.04% | 1.18% |
| S&P 500® Total Return Index | 22.32% | 20.61% | 18.18% |
Fund Statistics
| Net Assets | $12,358,227 |
| Total Number of Holdings | 2 |
| Portfolio Turnover Rate | 0% |
| Inception Date | 8/8/2022 |
What does the Fund invest in?
The Fund enters into financial instruments such as swaps and options on the common stock of Tesla Inc.
The Fund may invest in (1) U.S. Government securities, such as bills, notes and bonds issued by the U.S. Treasury; (2) money market funds; (3) short term bond ETFs and/or (4) corporate debt securities, such as commercial paper and other short-term unsecured promissory notes issued by businesses that are rated investment grade or of comparable quality as collateral for the Fund’s swap agreements
Top 10 Holdings
As of June 30, 2026
| Holding | % of Total Investments |
| United States Treasury Bill | 56.60% |
| Tesla, Inc. Equity Swap | 38.99% |
Sector Breakdown
| Sector | % of Total Investments |
| Government | 56.60% |
| Total Return Swap | 38.99% |
| Broker Cash | 4.41% |
Material Fund Changes
There were no material fund changes during the period
If you wish to view additional information about the Fund, including but not limited to the financial statements and holdings, please visit www.graniteshares.com
Phone: (844) 476 8747 – email: info@graniteshares.com
What were the fund’s costs for the last 12 months?
(based on hypothetical $10,000 investment)
| Expense Ratio (Actual) | 0.95% |
| Cost of a $10,000 Investment | $116.08 |
Hypothetical example: The cost shown is the amount you would pay on a $10,000 investment, assuming a return of 44.35% and an expense ratio of 0.95%.
How did the fund perform for the last 12 months?
During the period of June 30, 2025 to June 30, 2026, the Fund had a 28.93% return.
Over the same period the Benchmark had a return of 22.32%.
How did the fund perform since inception.
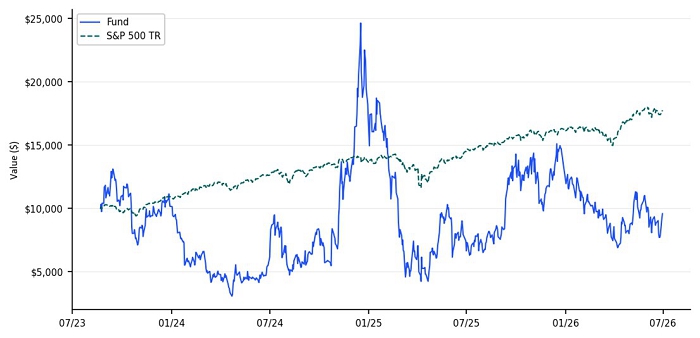
The $10,000 chart reflects a hypothetical $10,000 investment in the Fund. The chart uses total return NAV performance and assumes reinvestment of dividends and capital gains. The NAV performance includes all fund expenses.
Average Annual Total Returns
As of June 30, 2026
| 1 Year | Since
Inception (8/21/2023) | |
| GraniteShares 2x Long TSLA Daily ETF - NAV | 28.93% | -0.86% |
| S&P 500® Total Return Index | 22.32% | 22.12% |
Fund Statistics
| Net Assets | $107,260,452 |
| Total Number of Holdings | 6 |
| Portfolio Turnover Rate | 0% |
| Inception Date | 8/21/2023 |
What does the Fund invest in?
The Fund enters into financial instruments such as swaps and options on the common stock of Tesla Inc (NASDAQ: TSLA).
The Fund may invest in (1) U.S. Government securities, such as bills, notes and bonds issued by the U.S. Treasury; (2) money market funds; (3) short term bond ETFs and/or (4) corporate debt securities, such as commercial paper and other short -term unsecure d promissory notes issued by businesses that are rated investment grade or of comparable quality as collateral for the Fund’s swap agreements
Top 10 Holdings
As of June 30, 2026
| Holding | % of Total Investments |
| United States Treasury Bill | 28.76% |
| TSLA EQUITY SWAP | 24.49% |
| Recv Long Tsla 2x Trs Wf | 23.99% |
| GRANITESHARES LONG 2X TESLA TRS JPM | % |
| GRANITESHARES LONG TSLA SWAP BANK OF AMERICA | % |
| Recv Long Tsla Trs Cs | 0.05% |
Sector Breakdown
| Sector | % of Total Investments |
| Total Return Swap | 62.09% |
| Government | 28.76% |
| Broker Cash | 9.15% |
Material Fund Changes
There were no material fund changes during the period
If you wish to view additional information about the Fund, including but not limited to the financial statements and holdings, please visit www.graniteshares.com
Phone: (844) 476 8747 – email: info@graniteshares.com
What were the fund’s costs for the last 12 months?
(based on hypothetical $10,000 investment)
| Expense Ratio (Actual) | 0.95% |
| Cost of a $10,000 Investment | $61.87 |
Hypothetical example: The cost shown is the amount you would pay on a $10,000 investment, assuming a return of -69.74% and an expense ratio of 0.95%.
How did the fund perform for the last 12 months?
During the period of June 30, 2025 to June 30, 2026, the Fund had a -66.68% return.
Over the same period the Benchmark had a return of 22.32%.
How did the fund perform since inception.
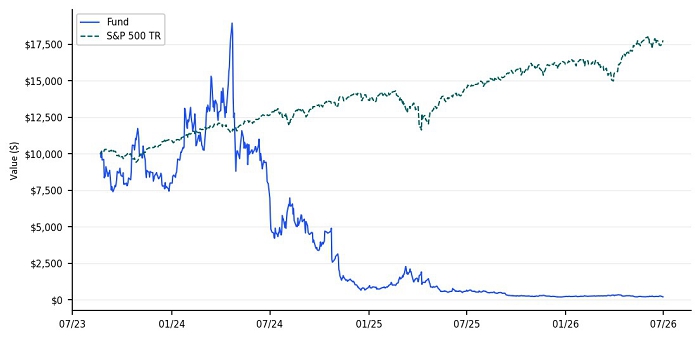
The $10,000 chart reflects a hypothetical $10,000 investment in the Fund. The chart uses total return NAV performance and assumes reinvestment of dividends and capital gains. The NAV performance includes all fund expenses.
Average Annual Total Returns
As of June 30, 2026
| 1 Year | Since
Inception (8/21/2023) | |
| GraniteShares 2x Short TSLA Daily ETF - NAV | -66.68% | -74.83% |
| S&P 500® Total Return Index | 22.32% | 22.12% |
Fund Statistics
| Net Assets | $39,023,823 |
| Total Number of Holdings | 5 |
| Portfolio Turnover Rate | 0% |
| Inception Date | 8/21/2023 |
What does the Fund invest in?
The Fund enters into financial instruments such as swaps and options on the common stock of Tesla Inc.
The Fund may invest in (1) U.S. Government securities, such as bills, notes and bonds issued by the U.S. Treasury; (2) money market funds; (3) short term bond ETFs and/or (4) corporate debt securities, such as commercial paper and other short-term unsecured promissory notes issued by businesses that are rated investment grade or of comparable quality as collateral for the Fund’s swap agreements
Top 10 Holdings
As of June 30, 2026
| Holding | % of Total Investments |
| GRANITESHARES SHORT TSLA SWAP BAML | % |
| Recv Short 2x Tsla Cf1 | 32.35% |
| TSLA EQUITY SWAP | 0.12% |
| GRANTIESHARES SHORT TSLA SWAP CLEAR STREET | % |
| Recv Short 2x Tsla Gs1 | 0.03% |
Sector Breakdown
| Sector | % of Total Investments |
| Total Return Swap | 76.23% |
| Broker Cash | 23.77% |
Material Fund Changes
There were no material fund changes during the period
If you wish to view additional information about the Fund, including but not limited to the financial statements and holdings, please visit www.graniteshares.com
Phone: (844) 476 8747 – email: info@graniteshares.com
What were the fund’s costs for the last 12 months?
(based on hypothetical $10,000 investment)
| Expense Ratio (Actual) | 1.12% |
| Cost of a $10,000 Investment | $84.21 |
Hypothetical example: The cost shown is the amount you would pay on a $10,000 investment, assuming a return of -50.04% and an expense ratio of 1.12%.
How did the fund perform for the last 12 months?
During the period of June 30, 2025 to June 30, 2026, the Fund had a -51.13% return.
Over the same period the Benchmark had a return of 22.32%.
How did the fund perform since inception.
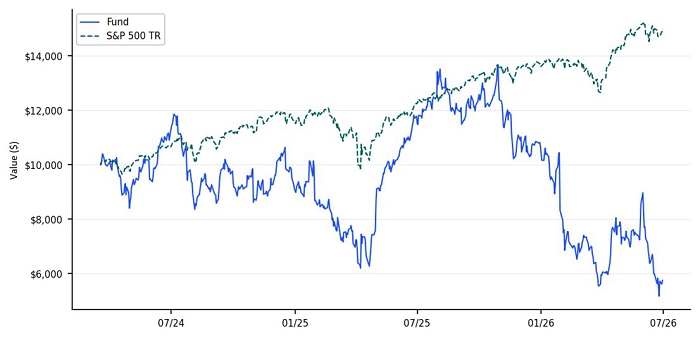
The $10,000 chart reflects a hypothetical $10,000 investment in the Fund. The chart uses total return NAV performance and assumes reinvestment of dividends and capital gains. The NAV performance includes all fund expenses.
Average Annual Total Returns
As of June 30, 2026
| 1 Year | Since
Inception (3/15/2024) | |
| GraniteShares 2x Long MSFT Daily ETF - NAV | -51.13% | -20.62% |
| S&P 500® Total Return Index | 22.32% | 19.65% |
Fund Statistics
| Net Assets | $125,577,456 |
| Total Number of Holdings | 2 |
| Portfolio Turnover Rate | 0% |
| Inception Date | 3/15/2024 |
What does the Fund invest in?
The Fund enters into financial instruments such as swaps and options on the common stock of Microsoft Corp. (NASDAQ: MSFT).
The Fund may invest in (1) U.S. Government securities, such as bills, notes and bonds issued by the U.S. Treasury; (2) money market funds; (3) short term bond ETFs and/or (4) corporate debt securities, such as commercial paper and other short-term unsecured promissory notes issued by businesses that are rated investment grade or of comparable quality as collateral for the Fund’s swap agreements
Top 10 Holdings
As of June 30, 2026
| Holding | % of Total Investments |
| Recv Long 2x Msft Trs Boa | 40.54% |
| MSFT EQUITY SWAP | 30.57% |
Sector Breakdown
| Sector | % of Total Investments |
| Total Return Swap | 71.11% |
| Broker Cash | 28.89% |
Material Fund Changes
There were no material fund changes during the period
If you wish to view additional information about the Fund, including but not limited to the financial statements and holdings, please visit www.graniteshares.com
Phone: (844) 476 8747 – email: info@graniteshares.com
What were the fund’s costs for the last 12 months?
(based on hypothetical $10,000 investment)
| Expense Ratio (Actual) | 1.01% |
| Cost of a $10,000 Investment | $585.60 |
Hypothetical example: The cost shown is the amount you would pay on a $10,000 investment, assuming a return of 957.20% and an expense ratio of 1.01%.
How did the fund perform for the last 12 months?
During the period of June 30, 2025 to June 30, 2026, the Fund had a 871.13% return.
Over the same period the Benchmark had a return of 22.32%.
How did the fund perform since inception.
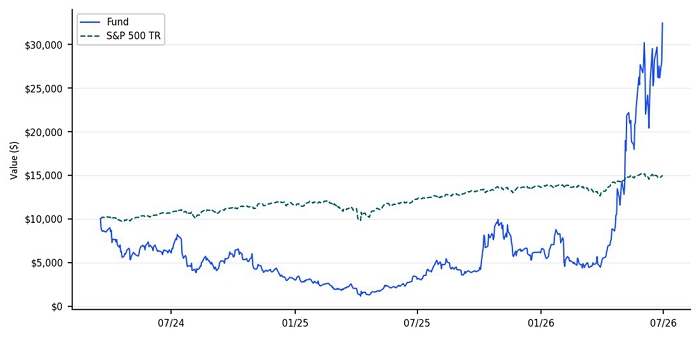
The $10,000 chart reflects a hypothetical $10,000 investment in the Fund. The chart uses total return NAV performance and assumes reinvestment of dividends and capital gains. The NAV performance includes all fund expenses.
Average Annual Total Returns
As of June 30, 2026
| 1 Year | Since
Inception (3/15/2024) | |
| GraniteShares 2x Long AMD Daily ETF - NAV | 871.13% | 68.53% |
| S&P 500® Total Return Index | 22.32% | 19.65% |
Fund Statistics
| Net Assets | $1,661,372,409 |
| Total Number of Holdings | 7 |
| Portfolio Turnover Rate | 0% |
| Inception Date | 3/15/2024 |
What does the Fund invest in?
The Fund enters into financial instruments such as swaps and options on the common stock of Advanced Micro Devices Inc. (NASDAQ: AMD).
The Fund may invest in (1) U.S. Government securities, such as bills, notes and bonds issued by the U.S. Treasury; (2) money market funds; (3) short term bond ETFs and/or (4) corporate debt securities, such as commercial paper and other short -term unsecured promissory notes issued by businesses that are rated investment grade or of comparable quality as collateral for the Fund’s swap agreements
Top 10 Holdings
As of June 30, 2026
| Holding | % of Total Investments |
| United States Treasury Bill | 48.77% |
| Recv Long 2x Amd Trs Nm | 9.11% |
| GRANITESHARES LONG AMD SWAP CANTOR | % |
| Recv Long 2x Amd Trs Bmo | 8.89% |
| Recv Long 2x Amd Trs Wf | 8.44% |
| AMD EQUITY SWAP | 5.99% |
| Recv Long 2x Amd Trs Cs | 5.69% |
Sector Breakdown
| Sector | % of Total Investments |
| Government | 48.77% |
| Total Return Swap | 47.16% |
| Broker Cash | 4.07% |
Material Fund Changes
There were no material fund changes during the period
If you wish to view additional information about the Fund, including but not limited to the financial statements and holdings, please visit www.graniteshares.com
Phone: (844) 476 8747 – email: info@graniteshares.com
What were the fund’s costs for the last 12 months?
(based on hypothetical $10,000 investment)
| Expense Ratio (Actual) | 1.12% |
| Cost of a $10,000 Investment | $111.24 |
Hypothetical example: The cost shown is the amount you would pay on a $10,000 investment, assuming a return of -1.55% and an expense ratio of 1.12%.
How did the fund perform for the last 12 months?
During the period of June 30, 2025 to June 30, 2026, the Fund had a -0.61% return.
Over the same period the Benchmark had a return of 22.32%.
How did the fund perform since inception.
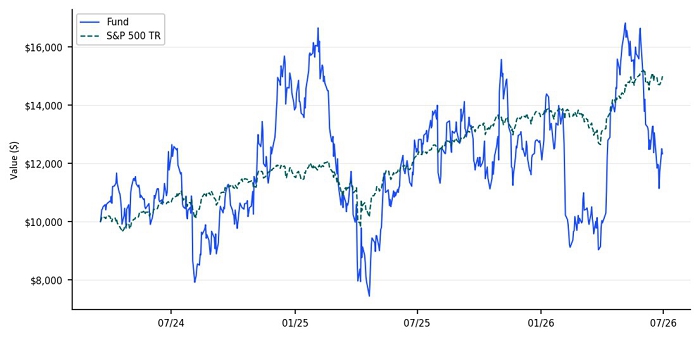
The $10,000 chart reflects a hypothetical $10,000 investment in the Fund. The chart uses total return NAV performance and assumes reinvestment of dividends and capital gains. The NAV performance includes all fund expenses.
Average Annual Total Returns
As of June 30, 2026
| 1 Year | Since
Inception (3/15/2024) | |
| GraniteShares 2x Long AMZN Daily ETF - NAV | -0.61% | 9.43% |
| S&P 500® Total Return Index | 22.32% | 19.65% |
Fund Statistics
| Net Assets | $45,189,060 |
| Total Number of Holdings | 2 |
| Portfolio Turnover Rate | 0% |
| Inception Date | 3/15/2024 |
What does the Fund invest in?
The Fund enters into financial instruments such as swaps and options on the common stock of Amazon.com (NASDAQ: AMZN).
The Fund may invest in (1) U.S. Government securities, such as bills, notes and bonds issued by the U.S. Treasury; (2) money market funds; (3) short term bond ETFs and/or (4) corporate debt securities, such as commercial paper and other short -term unsecured promissory notes issued by businesses that are rated investment grade or of comparable quality as collateral for the Fund’s swap agreements
Top 10 Holdings
As of June 30, 2026
| Holding | % of Total Investments |
| AMZN EQUITY SWAP | 59.42% |
| United States Treasury Bill | 30.45% |
Sector Breakdown
| Sector | % of Total Investments |
| Total Return Swap | 59.42% |
| Government | 30.45% |
| Broker Cash | 10.13% |
Material Fund Changes
There were no material fund changes during the period
If you wish to view additional information about the Fund, including but not limited to the financial statements and holdings, please visit www.graniteshares.com
Phone: (844) 476 8747 – email: info@graniteshares.com
What were the fund’s costs for the last 12 months?
(based on hypothetical $10,000 investment)
| Expense Ratio (Actual) | 1.10% |
| Cost of a $10,000 Investment | $122.09 |
Hypothetical example: The cost shown is the amount you would pay on a $10,000 investment, assuming a return of 22.42% and an expense ratio of 1.10%.
How did the fund perform for the last 12 months?
During the period of June 30, 2025 to June 30, 2026, the Fund had a 32.96% return.
Over the same period the Benchmark had a return of 22.32%.
How did the fund perform since inception.
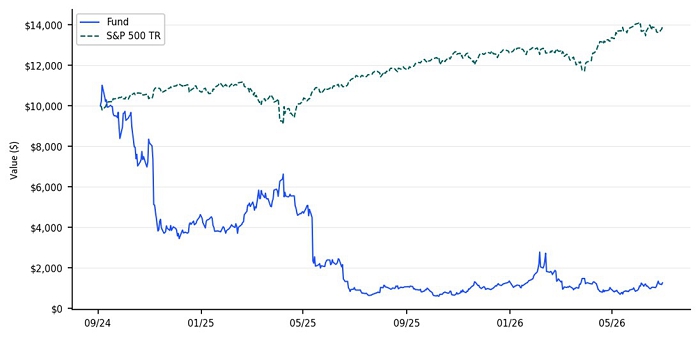
The $10,000 chart reflects a hypothetical $10,000 investment in the Fund. The chart uses total return NAV performance and assumes reinvestment of dividends and capital gains. The NAV performance includes all fund expenses.
Average Annual Total Returns
As of June 30, 2026
| 1 Year | Since
Inception (9/3/2024) | |
| GraniteShares 2x Short COIN Daily ETF - NAV | 32.96% | -67.33% |
| S&P 500® Total Return Index | 22.32% | 19.72% |
Fund Statistics
| Net Assets | $15,960,794 |
| Total Number of Holdings | 3 |
| Portfolio Turnover Rate | 0% |
| Inception Date | 9/3/2024 |
What does the Fund invest in?
The Fund enters into financial instruments such as swaps and options on the common stock of Coinbase Global Inc. (NASDAQ: COIN).
The Fund may invest in (1) U.S. Government securities, such as bills, notes and bonds issued by the U.S. Treasury; (2) money market funds; (3) short term bond ETFs and/or (4) corporate debt securities, such as commercial paper and other short-term unsecured promissory notes issued by businesses that are rated investment grade or of comparable quality as collateral for the Fund’s swap agreements
Top 10 Holdings
As of June 30, 2026
| Holding | % of Total Investments |
| United States Treasury Bill | 59.00% |
| Recv Short 2x Coin Nm1 | 20.82% |
| GRANITESHARES SHORT COIN SWAP MAREX | % |
Sector Breakdown
| Sector | % of Total Investments |
| Government | 59.00% |
| Total Return Swap | 37.35% |
| Broker Cash | 3.66% |
Material Fund Changes
There were no material fund changes during the period
If you wish to view additional information about the Fund, including but not limited to the financial statements and holdings, please visit www.graniteshares.com
Phone: (844) 476 8747 – email: info@graniteshares.com
What were the fund’s costs for the last 12 months?
(based on hypothetical $10,000 investment)
| Expense Ratio (Actual) | 1.01% |
| Cost of a $10,000 Investment | $78.68 |
Hypothetical example: The cost shown is the amount you would pay on a $10,000 investment, assuming a return of -44.58% and an expense ratio of 1.01%.
How did the fund perform for the last 12 months?
During the period of June 30, 2025 to June 30, 2026, the Fund had a -49.07% return.
Over the same period the Benchmark had a return of 22.32%.
How did the fund perform since inception.
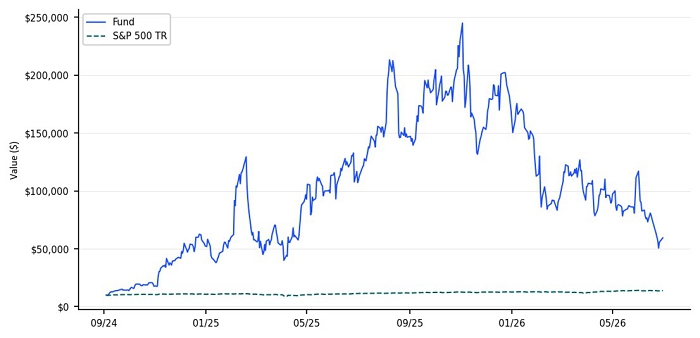
The $10,000 chart reflects a hypothetical $10,000 investment in the Fund. The chart uses total return NAV performance and assumes reinvestment of dividends and capital gains. The NAV performance includes all fund expenses.
Average Annual Total Returns
As of June 30, 2026
| 1 Year | Since
Inception (9/3/2024) | |
| GraniteShares 2x Long PLTR Daily ETF - NAV | -49.07% | 165.86% |
| S&P 500® Total Return Index | 22.32% | 19.72% |
Fund Statistics
| Net Assets | $296,774,632 |
| Total Number of Holdings | 6 |
| Portfolio Turnover Rate | 0% |
| Inception Date | 9/3/2024 |
What does the Fund invest in?
The Fund enters into financial instruments such as swaps and options on the common stock of Palantir Technologies Inc. (NASDAQ: PTLR).
The Fund may invest in (1) U.S. Government securities, such as bills, notes and bonds issued by the U.S. Treasury; (2) money market funds; (3) short term bond ETFs and/or (4) corporate debt securities, such as commercial paper and other short -term unsecured promissory notes issued by businesses that are rated investment grade or of comparable quality as collateral for the Fund’s swap agreements
Top 10 Holdings
As of June 30, 2026
| Holding | % of Total Investments |
| United States Treasury Bill | 28.45% |
| GRANITESHARES LONG PLTR SWAP CLEAR STREET | % |
| GRANITESHARES LONG PLTR SWAP COWEN | % |
| Recv Long 2x Pltr Trs Bmo | 11.72% |
| GRANITESHARES LONG PLTR SWAP NOMURA | % |
| Recv Long 2x Pltr Wf1 | 2.17% |
Sector Breakdown
| Sector | % of Total Investments |
| Total Return Swap | 51.43% |
| Government | 28.45% |
| Broker Cash | 20.12% |
Material Fund Changes
There were no material fund changes during the period
If you wish to view additional information about the Fund, including but not limited to the financial statements and holdings, please visit www.graniteshares.com
Phone: (844) 476 8747 – email: info@graniteshares.com
What were the fund’s costs for the last 12 months?
(based on hypothetical $10,000 investment)
| Expense Ratio (Actual) | 1.15% |
| Cost of a $10,000 Investment | $86.79 |
Hypothetical example: The cost shown is the amount you would pay on a $10,000 investment, assuming a return of -49.07% and an expense ratio of 1.15%.
How did the fund perform for the last 12 months?
During the period of June 30, 2025 to June 30, 2026, the Fund had a -50.36% return.
Over the same period the Benchmark had a return of 22.32%.
How did the fund perform since inception.
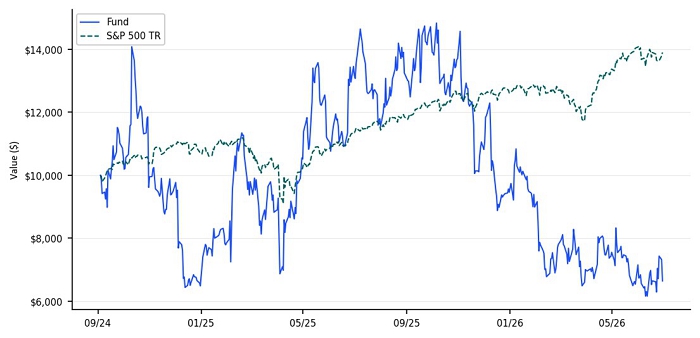
The $10,000 chart reflects a hypothetical $10,000 investment in the Fund. The chart uses total return NAV performance and assumes reinvestment of dividends and capital gains. The NAV performance includes all fund expenses.
Average Annual Total Returns
As of June 30, 2026
| 1 Year | Since
Inception (9/3/2024) | |
| GraniteShares 2x Long UBER Daily ETF - NAV | -50.36% | -20.29% |
| S&P 500® Total Return Index | 22.32% | 19.72% |
Fund Statistics
| Net Assets | $20,962,910 |
| Total Number of Holdings | 2 |
| Portfolio Turnover Rate | 0% |
| Inception Date | 9/3/2024 |
What does the Fund invest in?
The Fund enters into financial instruments such as swaps and options on the common stock of Uber Technologies Inc. (NYSE: UBER).
The Fund may invest in (1) U.S. Government securities, such as bills, notes and bonds issued by the U.S. Treasury; (2) money market funds; (3) short term bond ETFs and/or (4) corporate debt securities, such as commercial paper and other short -term unsecure d promissory notes issued by businesses that are rated investment grade or of comparable quality as collateral for the Fund’s swap agreements
Top 10 Holdings
As of June 30, 2026
| Holding | % of Total Investments |
| GRANITESHARES LONG UBER SWAP COWEN | % |
| United States Treasury Bill | 1.04% |
Sector Breakdown
| Sector | % of Total Investments |
| Total Return Swap | 72.58% |
| Broker Cash | 26.38% |
| Government | 1.04% |
Material Fund Changes
There were no material fund changes during the period
If you wish to view additional information about the Fund, including but not limited to the financial statements and holdings, please visit www.graniteshares.com
Phone: (844) 476 8747 – email: info@graniteshares.com
What were the fund’s costs for the last 12 months?
(based on hypothetical $10,000 investment)
| Expense Ratio (Actual) | 1.42% |
| Cost of a $10,000 Investment | $186.07 |
Hypothetical example: The cost shown is the amount you would pay on a $10,000 investment, assuming a return of 61.93% and an expense ratio of 1.42%.
How did the fund perform for the last 12 months?
During the period of June 30, 2025 to June 30, 2026, the Fund had a 50.90% return.
Over the same period the Benchmark had a return of 22.32%.
How did the fund perform since inception.
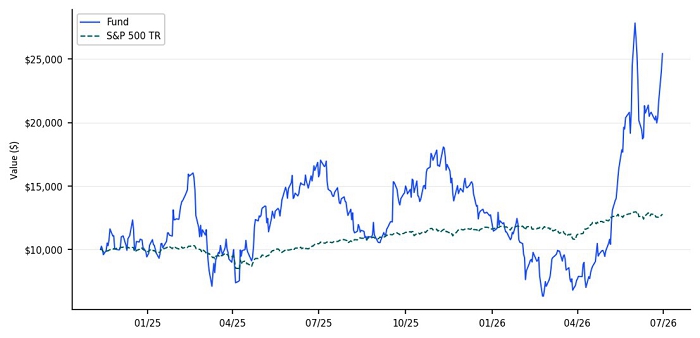
The $10,000 chart reflects a hypothetical $10,000 investment in the Fund. The chart uses total return NAV performance and assumes reinvestment of dividends and capital gains. The NAV performance includes all fund expenses.
Average Annual Total Returns
As of June 30, 2026
| 1 Year | Since
Inception (11/11/2024) | |
| GraniteShares 2x Long CRWD Daily ETF - NAV | 50.90% | 77.59% |
| S&P 500® Total Return Index | 22.32% | 16.10% |
Fund Statistics
| Net Assets | $53,005,212 |
| Total Number of Holdings | 2 |
| Portfolio Turnover Rate | 0% |
| Inception Date | 11/11/2024 |
What does the Fund invest in?
The Fund enters into financial instruments such as swaps and options on the common stock of CrowdStrike Holdings Inc. (NASDAQ: CRWD).
The Fund may invest in (1) U.S. Government securities, such as bills, notes and bonds issued by the U.S. Treasury; (2) money market funds; (3) short term bond ETFs and/or (4) corporate debt securities, such as commercial paper and other short-term unsecured promissory notes issued by businesses that are rated investment grade or of comparable quality as collateral for the Fund’s swap agreements
Top 10 Holdings
As of June 30, 2026
| Holding | % of Total Investments |
| United States Treasury Bill | 70.37% |
| Recv Long 2x Crwd Trs Nm1 | 29.63% |
Sector Breakdown
| Sector | % of Total Investments |
| Government | 70.37% |
| Total Return Swap | 29.63% |
Material Fund Changes
There were no material fund changes during the period
If you wish to view additional information about the Fund, including but not limited to the financial statements and holdings, please visit www.graniteshares.com
Phone: (844) 476 8747 – email: info@graniteshares.com
What were the fund’s costs for the last 12 months?
(based on hypothetical $10,000 investment)
| Expense Ratio (Actual) | 1.50% |
| Cost of a $10,000 Investment | $329.54 |
Hypothetical example: The cost shown is the amount you would pay on a $10,000 investment, assuming a return of 239.37% and an expense ratio of 1.50%.
How did the fund perform for the last 12 months?
During the period of June 30, 2025 to June 30, 2026, the Fund had a 233.91% return.
Over the same period the Benchmark had a return of 22.32%.
How did the fund perform since inception.
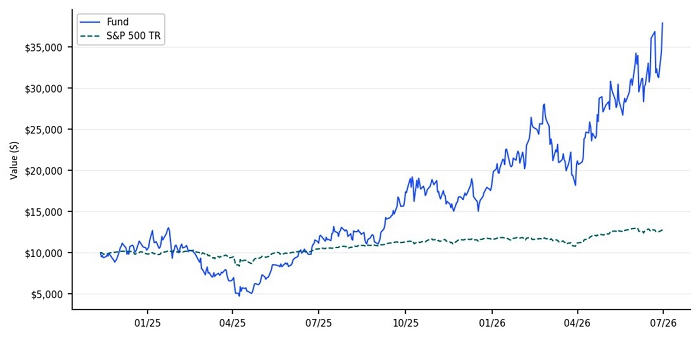
The $10,000 chart reflects a hypothetical $10,000 investment in the Fund. The chart uses total return NAV performance and assumes reinvestment of dividends and capital gains. The NAV performance includes all fund expenses.
Average Annual Total Returns
As of June 30, 2026
| 1 Year | Since
Inception (11/11/2024) | |
| GraniteShares 2x Long TSM Daily ETF - NAV | 233.91% | 122.18% |
| S&P 500® Total Return Index | 22.32% | 16.10% |
Fund Statistics
| Net Assets | $64,440,688 |
| Total Number of Holdings | 2 |
| Portfolio Turnover Rate | 0% |
| Inception Date | 11/11/2024 |
Material Fund Changes
There were no material fund changes during the period
What does the Fund invest in?
The Fund enters into financial instruments such as swaps and options on the ADR of Taiwan Semiconductor Manufacturing Co Ltd (NYSE: TSM).
The Fund may invest in (1) U.S. Government securities, such as bills, notes and bonds issued by the U.S. Treasury; (2) money market funds; (3) short term bond ETFs and/or (4) corporate debt securities, such as commercial paper and other short -term unsecure d promissory notes issued by businesses that are rated investment grade or of comparable quality as collateral for the Fund’s swap agreements.
Top 10 Holdings
As of June 30, 2026
| Holding | % of Total Investments |
| United States Treasury Bill | 61.20% |
| Recv Long 2x Tsm Trs Nm1 | 35.35% |
Sector Breakdown
| Sector | % of Total Investments |
| Government | 61.20% |
| Total Return Swap | 35.35% |
| Broker Cash | 3.45% |
Material Fund Changes
There were no material fund changes during the period
If you wish to view additional information about the Fund, including but not limited to the financial statements and holdings, please visit www.graniteshares.com
Phone: (844) 476 8747 – email: info@graniteshares.com
What were the fund’s costs for the last 12 months?
(based on hypothetical $10,000 investment)
| Expense Ratio (Actual) | 1.36% |
| Cost of a $10,000 Investment | $3,129.75 |
Hypothetical example: The cost shown is the amount you would pay on a $10,000 investment, assuming a return of 4390.44% and an expense ratio of 1.36%.
How did the fund perform for the last 12 months?
During the period of June 30, 2025 to June 30, 2026, the Fund had a 4217.12% return.
Over the same period the Benchmark had a return of 22.32%.
How did the fund perform since inception.
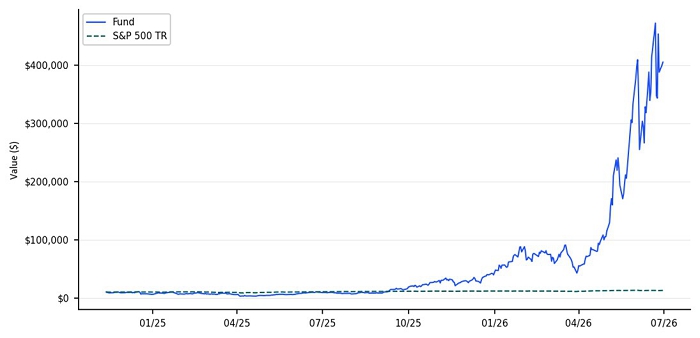
The $10,000 chart reflects a hypothetical $10,000 investment in the Fund. The chart uses total return NAV performance and assumes reinvestment of dividends and capital gains. The NAV performance includes all fund expenses.
Average Annual Total Returns
As of June 30, 2026
| 1 Year | Since
Inception (11/11/2024) | |
| GraniteShares 2x Long MU Daily ETF - NAV | 4217.12% | 813.19% |
| S&P 500® Total Return Index | 22.32% | 16.10% |
Fund Statistics
| Net Assets | $1,535,623,415 |
| Total Number of Holdings | 7 |
| Portfolio Turnover Rate | 0% |
| Inception Date | 11/11/2024 |
What does the Fund invest in?
The Fund enters into financial instruments such as swaps and options on the common stock of Micron Technology Inc. (NASDAQ: MU).
The Fund may invest in (1) U.S. Government securities, such as bills, notes and bonds issued by the U.S. Treasury; (2) money market funds; (3) short term bond ETFs and/or (4) corporate debt securities, such as commercial paper and other short-term unsecured promissory notes issued by businesses that are rated investment grade or of comparable quality as collateral for the Fund’s swap agreements
Top 10 Holdings
As of June 30, 2026
| Holding | % of Total Investments |
| United States Treasury Bill | 42.49% |
| Recv Long 2x Mu Trs Nm1 | 15.48% |
| Recv Long 2x Mu Trs Gs1 | 11.50% |
| Recv Long 2x Mu Trs Ms1 | 8.96% |
| Recv Long 2x Mu Trs HSBC | 8.16% |
| Recv Long 2x Mu Trs Wf1 | 6.97% |
| United States Treasury Bill | 1.41% |
Sector Breakdown
| Sector | % of Total Investments |
| Total Return Swap | 51.06% |
| Government | 43.90% |
| Broker Cash | 5.04% |
Material Fund Changes
There were no material fund changes during the period
If you wish to view additional information about the Fund, including but not limited to the financial statements and holdings, please visit www.graniteshares.com
Phone: (844) 476 8747 – email: info@graniteshares.com
What were the fund’s costs for the last 12 months?
(based on hypothetical $10,000 investment)
| Expense Ratio (Actual) | 1.25% |
| Cost of a $10,000 Investment | $69.56 |
Hypothetical example: The cost shown is the amount you would pay on a $10,000 investment, assuming a return of -89.14% and an expense ratio of 1.25%.
How did the fund perform for the last 12 months?
During the period of June 30, 2025 to June 30, 2026, the Fund had a -89.95% return.
Over the same period the Benchmark had a return of 22.32%.
How did the fund perform since inception.
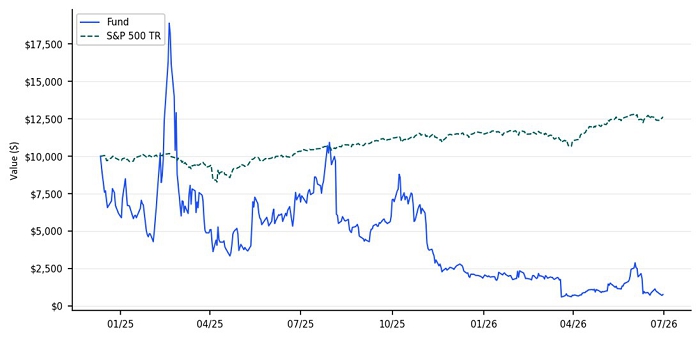
The $10,000 chart reflects a hypothetical $10,000 investment in the Fund. The chart uses total return NAV performance and assumes reinvestment of dividends and capital gains. The NAV performance includes all fund expenses.
Average Annual Total Returns
As of June 30, 2026
| 1 Year | Since
Inception (12/10/2024) | |
| GraniteShares 2x Long SMCI Daily ETF - NAV | -89.95% | -81.37% |
| S&P 500® Total Return Index | 22.32% | 16.46% |
Fund Statistics
| Net Assets | $39,220,767 |
| Total Number of Holdings | 4 |
| Portfolio Turnover Rate | 0% |
| Inception Date | 12/10/2024 |
What does the Fund invest in?
The Fund enters into financial instruments such as swaps and options on the common stock of Super Micro Computer Inc. (NASDAQ: SMCI).
The Fund may invest in (1) U.S. Government securities, such as bills, notes and bonds issued by the U.S. Treasury; (2) money market funds; (3) short term bond ETFs and/or (4) corporate debt securities, such as commercial paper and other short-term unsecured promissory notes issued by businesses that are rated investment grade or of comparable quality as collateral for the Fund’s swap agreements
Top 10 Holdings
As of June 30, 2026
| Holding | % of Total Investments |
| Recv Long 2x Smci Trs Cs1 | 39.44% |
| Recv Long 2x Smci Trs Mx1 | 16.97% |
| Recv Long Scmi Us Trs Nm1 | 12.91% |
| Recv Long 2x Smci Trs Cf | 0.00% |
Sector Breakdown
| Sector | % of Total Investments |
| Total Return Swap | 69.33% |
| Broker Cash | 30.67% |
Material Fund Changes
There were no material fund changes during the period
If you wish to view additional information about the Fund, including but not limited to the financial statements and holdings, please visit www.graniteshares.com
Phone: (844) 476 8747 – email: info@graniteshares.com
What were the fund’s costs for the last 12 months?
(based on hypothetical $10,000 investment)
| Expense Ratio (Actual) | 1.49% |
| Cost of a $10,000 Investment | $691.32 |
Hypothetical example: The cost shown is the amount you would pay on a $10,000 investment, assuming a return of 727.15% and an expense ratio of 1.49%.
How did the fund perform for the last 12 months?
During the period of June 30, 2025 to June 30, 2026, the Fund had a 715.35% return.
Over the same period the Benchmark had a return of 22.32%.
How did the fund perform since inception.
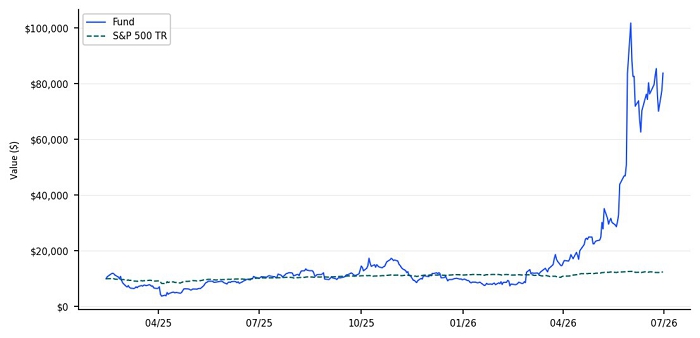
The $10,000 chart reflects a hypothetical $10,000 investment in the Fund. The chart uses total return NAV performance and assumes reinvestment of dividends and capital gains. The NAV performance includes all fund expenses.
Average Annual Total Returns
As of June 30, 2026
| 1 Year | Since
Inception (2/12/2025) | |
| GraniteShares 2x Long DELL Daily ETF - NAV | 715.35% | 351.80% |
| S&P 500® Total Return Index | 22.32% | 18.33% |
Fund Statistics
| Net Assets | $160,584,384 |
| Total Number of Holdings | 3 |
| Portfolio Turnover Rate | 0% |
| Inception Date | 2/12/2025 |
What does the Fund invest in?
The Fund enters into financial instruments such as swaps and options on the common stock of Dell Technologies Inc. (NYSE: DELL).
The Fund may invest in (1) U.S. Government securities, such as bills, notes and bonds issued by the U.S. Treasury; (2) money market funds; (3) short term bond ETFs and/or (4) corporate debt securities, such as commercial paper and other short-term unsecured promissory notes issued by businesses that are rated investment grade or of comparable quality as collateral for the Fund’s swap agreements
Top 10 Holdings
As of June 30, 2026
| Holding | % of Total Investments |
| United States Treasury Bill | 61.35% |
| Recv Long 2x Dell Cowen | 30.62% |
| GRANITESHARES 2X LONG DELL SWAP BAML | % |
Sector Breakdown
| Sector | % of Total Investments |
| Government | 61.35% |
| Total Return Swap | 35.63% |
| Broker Cash | 3.02% |
Material Fund Changes
There were no material fund changes during the period
If you wish to view additional information about the Fund, including but not limited to the financial statements and holdings, please visit www.graniteshares.com
Phone: (844) 476 8747 – email: info@graniteshares.com
What were the fund’s costs for the last 12 months?
(based on hypothetical $10,000 investment)
| Expense Ratio (Actual) | 1.33% |
| Cost of a $10,000 Investment | $1,381.08 |
Hypothetical example: The cost shown is the amount you would pay on a $10,000 investment, assuming a return of 1871.44% and an expense ratio of 1.33%.
How did the fund perform for the last 12 months?
During the period of June 30, 2025 to June 30, 2026, the Fund had a 1950.33% return.
Over the same period the Benchmark had a return of 22.32%.
How did the fund perform since inception.
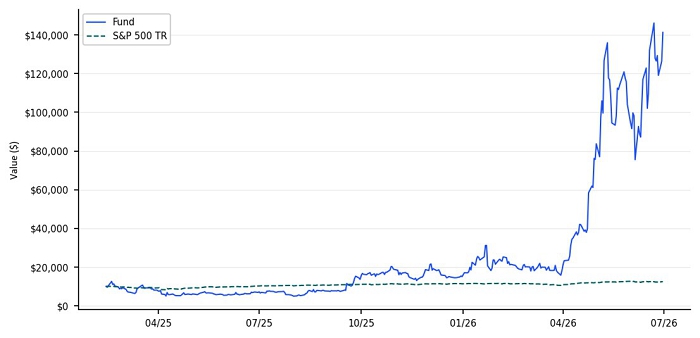
The $10,000 chart reflects a hypothetical $10,000 investment in the Fund. The chart uses total return NAV performance and assumes reinvestment of dividends and capital gains. The NAV performance includes all fund expenses.
Average Annual Total Returns
As of June 30, 2026
| 1 Year | Since
Inception (2/12/2025) | |
| GraniteShares 2x Long INTC Daily ETF - NAV | 1950.33% | 655.56% |
| S&P 500® Total Return Index | 22.32% | 18.33% |
Fund Statistics
| Net Assets | $808,915,226 |
| Total Number of Holdings | 4 |
| Portfolio Turnover Rate | 0% |
| Inception Date | 2/12/2025 |
What does the Fund invest in?
The Fund enters into financial instruments such as swaps and options on the common stock of Intel Corp. (NASDAQ: INTC).
The Fund may invest in (1) U.S. Government securities, such as bills, notes and bonds issued by the U.S. Treasury; (2) money market funds; (3) short term bond ETFs and/or (4) corporate debt securities, such as commercial paper and other short-term unsecured promissory notes issued by businesses that are rated investment grade or of comparable quality as collateral for the Fund’s swap agreements
Top 10 Holdings
As of June 30, 2026
| Holding | % of Total Investments |
| United States Treasury Bill | 49.11% |
| Recv Long 2x Intc Cowen | 18.80% |
| Recv Long Intc 2x Trs Cf1 | 13.16% |
| Recv Long Intc 2x Trs Wf1 | 12.78% |
Sector Breakdown
| Sector | % of Total Investments |
| Government | 49.11% |
| Total Return Swap | 44.75% |
| Broker Cash | 6.14% |
Material Fund Changes
There were no material fund changes during the period
If you wish to view additional information about the Fund, including but not limited to the financial statements and holdings, please visit www.graniteshares.com
Phone: (844) 476 8747 – email: info@graniteshares.com
What were the fund’s costs for the last 12 months?
(based on hypothetical $10,000 investment)
| Expense Ratio (Actual) | 1.50% |
| Cost of a $10,000 Investment | $149.72 |
Hypothetical example: The cost shown is the amount you would pay on a $10,000 investment, assuming a return of -0.41% and an expense ratio of 1.50%.
How did the fund perform for the last 12 months?
During the period of June 30, 2025 to June 30, 2026, the Fund had a -0.25% return.
Over the same period the Benchmark had a return of 22.32%.
How did the fund perform since inception.
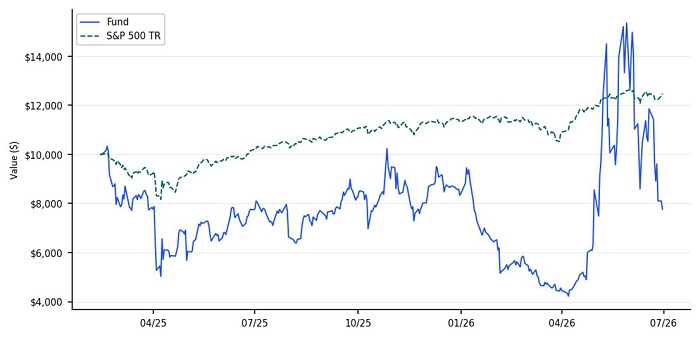
The $10,000 chart reflects a hypothetical $10,000 investment in the Fund. The chart uses total return NAV performance and assumes reinvestment of dividends and capital gains. The NAV performance includes all fund expenses.
Average Annual Total Returns
As of June 30, 2026
| 1 Year | Since
Inception (2/12/2025) | |
| GraniteShares 2x Long QCOM Daily ETF - NAV | -0.25% | -15.51% |
| S&P 500® Total Return Index | 22.32% | 18.33% |
Fund Statistics
| Net Assets | $136,171,312 |
| Total Number of Holdings | 2 |
| Portfolio Turnover Rate | 0% |
| Inception Date | 2/12/2025 |
What does the Fund invest in?
The Fund enters into financial instruments such as swaps and options on the common stock of Qualcomm Inc. (NASDAQ: QCOM).
The Fund may invest in (1) U.S. Government securities, such as bills, notes and bonds issued by the U.S. Treasury; (2) money market funds; (3) short term bond ETFs and/or (4) corporate debt securities, such as commercial paper and other short-term unsecured promissory notes issued by businesses that are rated investment grade or of comparable quality as collateral for the Fund’s swap agreements
Top 10 Holdings
As of June 30, 2026
| Holding | % of Total Investments |
| Recv Long 2x Qcom Cowen | 35.25% |
| Recv Long 2x Qcom Nm1 | 29.47% |
Sector Breakdown
| Sector | % of Total Investments |
| Total Return Swap | 64.72% |
| Broker Cash | 35.28% |
Material Fund Changes
There were no material fund changes during the period
If you wish to view additional information about the Fund, including but not limited to the financial statements and holdings, please visit www.graniteshares.com
Phone: (844) 476 8747 – email: info@graniteshares.com
What were the fund’s costs for the last 12 months?
(based on hypothetical $10,000 investment)
| Expense Ratio (Actual) | 1.39% |
| Cost of a $10,000 Investment | $94.00 |
Hypothetical example: The cost shown is the amount you would pay on a $10,000 investment, assuming a return of -64.34% and an expense ratio of 1.39%.
How did the fund perform for the last 12 months?
During the period of June 30, 2025 to June 30, 2026, the Fund had a -64.26% return.
Over the same period the Benchmark had a return of 22.32%.
How did the fund perform since inception.
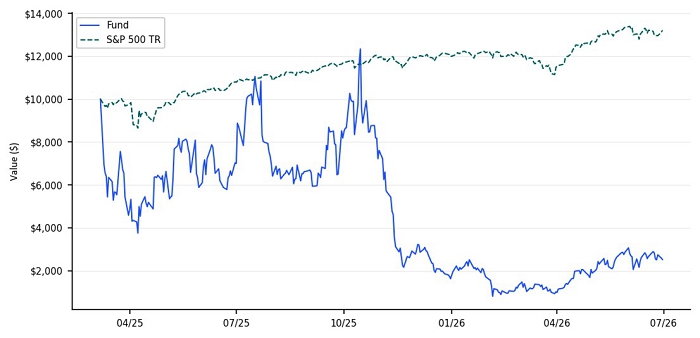
The $10,000 chart reflects a hypothetical $10,000 investment in the Fund. The chart uses total return NAV performance and assumes reinvestment of dividends and capital gains. The NAV performance includes all fund expenses.
Average Annual Total Returns
As of June 30, 2026
| 1 Year | Since
Inception (3/6/2025) | |
| GraniteShares 2x Long MARA Daily ETF - NAV | -64.26% | -61.65% |
| S&P 500® Total Return Index | 22.32% | 24.06% |
Fund Statistics
| Net Assets | $72,249,304 |
| Total Number of Holdings | 5 |
| Portfolio Turnover Rate | 0% |
| Inception Date | 3/6/2025 |
What does the Fund invest in?
The Fund enters into financial instruments such as swaps and options on the common stock of MARA Holdings, Inc (NASDAQ: MARA).
The Fund may invest in (1) U.S. Government securities, such as bills, notes and bonds issued by the U.S. Treasury; (2) money market funds; (3) short term bond ETFs and/or (4) corporate debt securities, such as commercial paper and other short-term unsecured promissory notes issued by businesses that are rated investment grade or of comparable quality as collateral for the Fund’s swap agreements
Top 10 Holdings
As of June 30, 2026
| Holding | % of Total Investments |
| United States Treasury Bill | 50.83% |
| Recv Long 2x Mara Marex | 27.46% |
| GRANITESHARES LONG MARA SWAP MAREX | % |
| Recv Long 2x Mara Nomura | 0.00% |
| Recv Long 2x Mara Trs Nx | 0.00% |
| Recv Long 2x Mara Trs Cf | 0.00% |
Sector Breakdown
| Sector | % of Total Investments |
| Government | 50.83% |
| Total Return Swap | 36.84% |
| Broker Cash | 12.33% |
Material Fund Changes
There were no material fund changes during the period
If you wish to view additional information about the Fund, including but not limited to the financial statements and holdings, please visit www.graniteshares.com
Phone: (844) 476 8747 – email: info@graniteshares.com
What were the fund’s costs for the last 12 months?
(based on hypothetical $10,000 investment)
| Expense Ratio (Actual) | 1.37% |
| Cost of a $10,000 Investment | $598.42 |
Hypothetical example: The cost shown is the amount you would pay on a $10,000 investment, assuming a return of 674.36% and an expense ratio of 1.37%.
How did the fund perform for the last 12 months?
During the period of June 30, 2025 to June 30, 2026, the Fund had a 651.05% return.
Over the same period the Benchmark had a return of 22.32%.
How did the fund perform since inception.
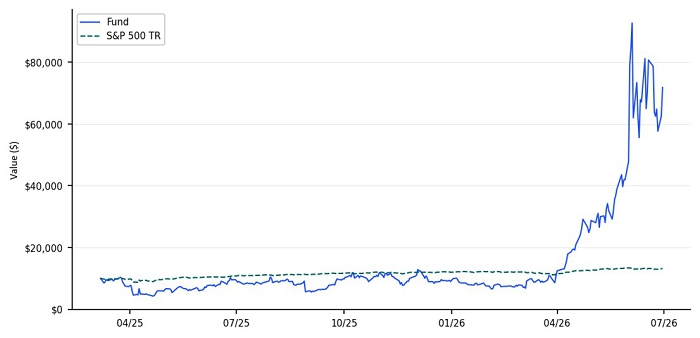
The $10,000 chart reflects a hypothetical $10,000 investment in the Fund. The chart uses total return NAV performance and assumes reinvestment of dividends and capital gains. The NAV performance includes all fund expenses.
Average Annual Total Returns
As of June 30, 2026
| 1 Year | Since
Inception (3/6/2025) | |
| GraniteShares 2x Long MRVL Daily ETF - NAV | 651.05% | 332.66% |
| S&P 500® Total Return Index | 22.32% | 24.06% |
Fund Statistics
| Net Assets | $1,033,684,500 |
| Total Number of Holdings | 7 |
| Portfolio Turnover Rate | 0% |
| Inception Date | 3/6/2025 |
What does the Fund invest in?
The Fund enters into financial instruments such as swaps and options on the common stock of Marvell Technology, Inc. (NASDAQ: MRVL).
The Fund may invest in (1) U.S. Government securities, such as bills, notes and bonds issued by the U.S. Treasury; (2) money market funds; (3) short term bond ETFs and/or (4) corporate debt securities, such as commercial paper and other short-term unsecured promissory notes issued by businesses that are rated investment grade or of comparable quality as collateral for the Fund’s swap agreements
Top 10 Holdings
As of June 30, 2026
| Holding | % of Total Investments |
| United States Treasury Bill | 38.91% |
| Recv Long Mrvl Trs Cantor | 21.88% |
| Recv Long 2x Mrvl Marex | 18.35% |
| Recv Long 2x Mrvl Hsbc1 | 6.26% |
| GRANITESHARES 2X LONG MRVL SWAP CLEAR STREET | % |
| GRANITESHARES LONG 2X MRVL SWAP NAT BANK OF CANADA | % |
| Recv Long 2x Mrvl Trs Nm1 | 0.00% |
Sector Breakdown
| Sector | % of Total Investments |
| Total Return Swap | 50.86% |
| Government | 38.91% |
| Broker Cash | 10.22% |
Material Fund Changes
There were no material fund changes during the period
If you wish to view additional information about the Fund, including but not limited to the financial statements and holdings, please visit www.graniteshares.com
Phone: (844) 476 8747 – email: info@graniteshares.com
What were the fund’s costs for the last 12 months?
(based on hypothetical $10,000 investment)
| Expense Ratio (Actual) | 1.42% |
| Cost of a $10,000 Investment | $116.33 |
Hypothetical example: The cost shown is the amount you would pay on a $10,000 investment, assuming a return of -36.46% and an expense ratio of 1.42%.
How did the fund perform for the last 12 months?
During the period of June 30, 2025 to June 30, 2026, the Fund had a -44.98% return.
Over the same period the Benchmark had a return of 22.32%.
How did the fund perform since inception.
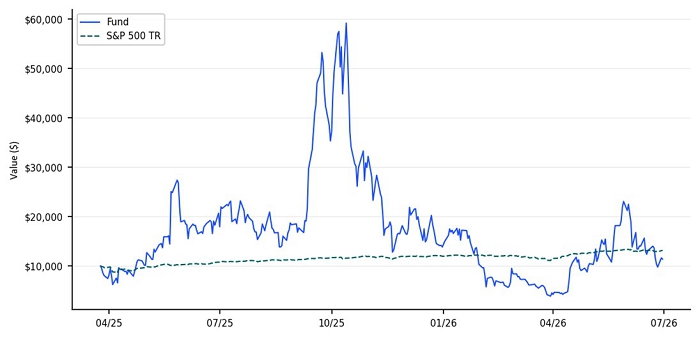
The $10,000 chart reflects a hypothetical $10,000 investment in the Fund. The chart uses total return NAV performance and assumes reinvestment of dividends and capital gains. The NAV performance includes all fund expenses.
Average Annual Total Returns
As of June 30, 2026
| 1 Year | Since
Inception (3/24/2025) | |
| GraniteShares 2x Long IONQ Daily ETF - NAV | -44.98% | 6.29% |
| S&P 500® Total Return Index | 22.32% | 24.52% |
Fund Statistics
| Net Assets | $86,983,686 |
| Total Number of Holdings | 3 |
| Portfolio Turnover Rate | 0% |
| Inception Date | 3/24/2025 |
What does the Fund invest in?
The Fund enters into financial instruments such as swaps and options on the common stock of IonQ Inc. (NYSE: IONQ).
The Fund may invest in (1) U.S. Government securities, such as bills, notes and bonds issued by the U.S. Treasury; (2) money market funds; (3) short term bond ETFs and/or (4) corporate debt securities, such as commercial paper and other short-term unsecured promissory notes issued by businesses that are rated investment grade or of comparable quality as collateral for the Fund’s swap agreements
Top 10 Holdings
As of June 30, 2026
| Holding | % of Total Investments |
| United States Treasury Bill | 58.34% |
| GRANITESHARES LONG IONQ SWAP MAREX | % |
| Recv Long Ionq 2x Trs Ba1 | 2.33% |
Sector Breakdown
| Sector | % of Total Investments |
| Government | 58.34% |
| Total Return Swap | 31.41% |
| Broker Cash | 10.25% |
Material Fund Changes
There were no material fund changes during the period
If you wish to view additional information about the Fund, including but not limited to the financial statements and holdings, please visit www.graniteshares.com
Phone: (844) 476 8747 – email: info@graniteshares.com
What were the fund’s costs for the last 12 months?
(based on hypothetical $10,000 investment)
| Expense Ratio (Actual) | 1.40% |
| Cost of a $10,000 Investment | $120.36 |
Hypothetical example: The cost shown is the amount you would pay on a $10,000 investment, assuming a return of -28.25% and an expense ratio of 1.40%.
How did the fund perform for the last 12 months?
During the period of June 30, 2025 to June 30, 2026, the Fund had a -26.66% return.
Over the same period the Benchmark had a return of 22.32%.
How did the fund perform since inception.
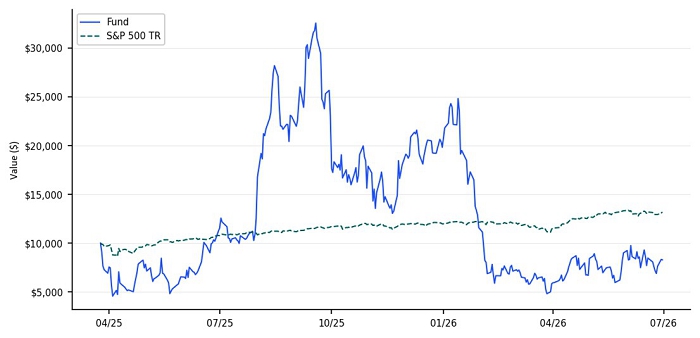
The $10,000 chart reflects a hypothetical $10,000 investment in the Fund. The chart uses total return NAV performance and assumes reinvestment of dividends and capital gains. The NAV performance includes all fund expenses.
Average Annual Total Returns
As of June 30, 2026
| 1 Year | Since
Inception (3/24/2025) | |
| GraniteShares 2x Long RDDT Daily ETF - NAV | -26.66% | -12.97% |
| S&P 500® Total Return Index | 22.32% | 24.52% |
Fund Statistics
| Net Assets | $56,788,664 |
| Total Number of Holdings | 2 |
| Portfolio Turnover Rate | 0% |
| Inception Date | 3/24/2025 |
What does the Fund invest in?
The Fund enters into financial instruments such as swaps and options on the common stock of Reddit Inc. (NYSE: RDDT).
The Fund may invest in (1) U.S. Government securities, such as bills, notes and bonds issued by the U.S. Treasury; (2) money market funds; (3) short term bond ETFs and/or (4) corporate debt securities, such as commercial paper and other short -term unsecured promissory notes issued by businesses that are rated investment grade or of comparable quality as collateral for the Fund’s swap agreements
Top 10 Holdings
As of June 30, 2026
| Holding | % of Total Investments |
| GRANITESHARES LONG RDDT SWAP MAREX | % |
| United States Treasury Bill | 38.75% |
Sector Breakdown
| Sector | % of Total Investments |
| Total Return Swap | 41.43% |
| Government | 38.75% |
| Broker Cash | 19.82% |
Material Fund Changes
There were no material fund changes during the period
If you wish to view additional information about the Fund, including but not limited to the financial statements and holdings, please visit www.graniteshares.com
Phone: (844) 476 8747 – email: info@graniteshares.com
What were the fund’s costs for the last 12 months?
(based on hypothetical $10,000 investment)
| Expense Ratio (Actual) | 1.48% |
| Cost of a $10,000 Investment | $402.55 |
Hypothetical example: The cost shown is the amount you would pay on a $10,000 investment, assuming a return of 345.35% and an expense ratio of 1.48%.
How did the fund perform for the last 12 months?
During the period of June 30, 2025 to June 30, 2026, the Fund had a 304.53% return.
Over the same period the Benchmark had a return of 22.32%.
How did the fund perform since inception.
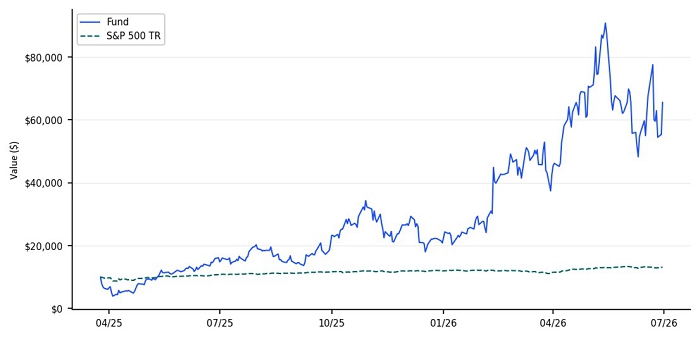
The $10,000 chart reflects a hypothetical $10,000 investment in the Fund. The chart uses total return NAV performance and assumes reinvestment of dividends and capital gains. The NAV performance includes all fund expenses.
Average Annual Total Returns
As of June 30, 2026
| 1 Year | Since
Inception (3/24/2025) | |
| GraniteShares 2x Long VRTV Daily ETF - NAV | 304.53% | 324.10% |
| S&P 500® Total Return Index | 22.32% | 24.52% |
How did the fund perform since inception.
The $10,000 chart reflects a hypothetical $10,000 investment in the Fund. The chart uses total return NAV performance and assumes reinvestment of dividends and capital gains. The NAV performance includes all fund expenses.
Fund Statistics
| Net Assets | $88,040,008 |
| Total Number of Holdings | 2 |
| Portfolio Turnover Rate | 0% |
| Inception Date | 3/24/2025 |
What does the Fund invest in?
The Fund enters into financial instruments such as swaps and options on the common stock of Vertiv Holding Co. (NYSE: VRT).
The Fund may invest in (1) U.S. Government securities, such as bills, notes and bonds issued by the U.S. Treasury; (2) money market funds; (3) short term bond ETFs and/or (4) corporate debt securities, such as commercial paper and other short -term unsecure d promissory notes issued by businesses that are rated investment grade or of comparable quality as collateral for the Fund’s swap agreements
Top 10 Holdings
As of June 30, 2026
| Holding | % of Total Investments |
| United States Treasury Bill | 52.44% |
| GRANITESHARES LONG VRT SWAP MAREX | % |
Sector Breakdown
| Sector | % of Total Investments |
| Government | 52.44% |
| Total Return Swap | 39.07% |
| Broker Cash | 8.49% |
Material Fund Changes
There were no material fund changes during the period
If you wish to view additional information about the Fund, including but not limited to the financial statements and holdings, please visit www.graniteshares.com
Phone: (844) 476 8747 – email: info@graniteshares.com
What were the fund’s costs for the last 12 months?
(based on hypothetical $10,000 investment)
| Expense Ratio (Actual) | 1.15% |
| Cost of a $10,000 Investment | $60.52 |
Hypothetical example: The cost shown is the amount you would pay on a $10,000 investment, assuming a return of -94.76% and an expense ratio of 1.15%.
How did the fund perform for the last 12 months?
During the period of June 30, 2025 to June 30, 2026, the Fund had a -95.14% return.
Over the same period the Benchmark had a return of 22.32%.
How did the fund perform since inception.
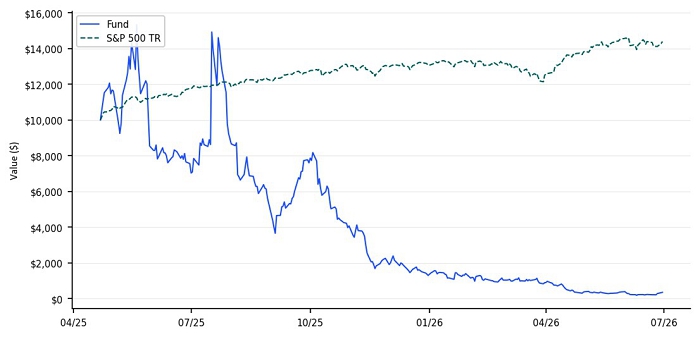
The $10,000 chart reflects a hypothetical $10,000 investment in the Fund. The chart uses total return NAV performance and assumes reinvestment of dividends and capital gains. The NAV performance includes all fund expenses.
Average Annual Total Returns
As of June 30, 2026
| 1 Year | Since
Inception (4/21/2025) | |
| GraniteShares 2x Long LCID Daily ETF - NAV | -95.14% | -93.80% |
| S&P 500® Total Return Index | 22.32% | 38.59% |
Fund Statistics
| Net Assets | $6,552,121 |
| Total Number of Holdings | 2 |
| Portfolio Turnover Rate | 0% |
| Inception Date | 4/21/2025 |
What does the Fund invest in?
The Fund enters into financial instruments such as swaps and options on the common stock of Lucid Group Inc, (NASDAQ: LCID).
The Fund may invest in (1) U.S. Government securities, such as bills, notes and bonds issued by the U.S. Treasury; (2) money market funds; (3) short term bond ETFs and/or (4) corporate debt securities, such as commercial paper and other short-term unsecured promissory notes issued by businesses that are rated investment grade or of comparable quality as collateral for the Fund’s swap agreements
Top 10 Holdings
As of June 30, 2026
| Holding | % of Total Investments |
| Recv Long Lcid Trs Marex | 49.25% |
| United States Treasury Bill | 40.89% |
Sector Breakdown
| Sector | % of Total Investments |
| Total Return Swap | 49.25% |
| Government | 40.89% |
| Broker Cash | 9.86% |
Material Fund Changes
There were no material fund changes during the period
If you wish to view additional information about the Fund, including but not limited to the financial statements and holdings, please visit www.graniteshares.com
Phone: (844) 476 8747 – email: info@graniteshares.com
What were the fund’s costs for the last 12 months?
(based on hypothetical $10,000 investment)
| Expense Ratio (Actual) | 1.15% |
| Cost of a $10,000 Investment | $113.40 |
Hypothetical example: The cost shown is the amount you would pay on a $10,000 investment, assuming a return of -2.79% and an expense ratio of 1.15%.
How did the fund perform for the last 12 months?
During the period of June 30, 2025 to June 30, 2026, the Fund had a -6.65% return.
Over the same period the Benchmark had a return of 22.32%.
How did the fund perform since inception.
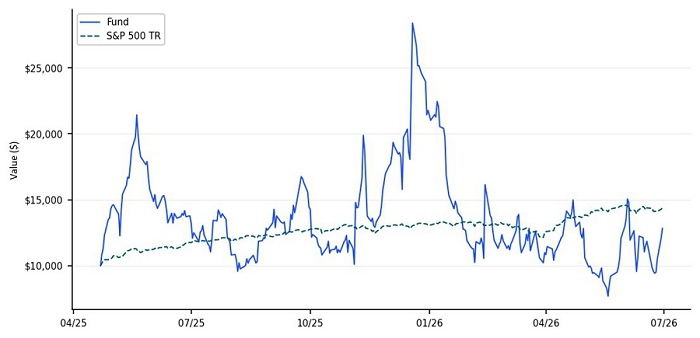
The $10,000 chart reflects a hypothetical $10,000 investment in the Fund. The chart uses total return NAV performance and assumes reinvestment of dividends and capital gains. The NAV performance includes all fund expenses.
Average Annual Total Returns
As of June 30, 2026
| 1 Year | Since
Inception (4/21/2025) | |
| GraniteShares 2x Long RIVN Daily ETF - NAV | -6.65% | 27.03% |
| S&P 500® Total Return Index | 22.32% | 38.59% |
Fund Statistics
| Net Assets | $15,293,911 |
| Total Number of Holdings | 2 |
| Portfolio Turnover Rate | 0% |
| Inception Date | 4/21/2025 |
What does the Fund invest in?
The Fund enters into financial instruments such as swaps and options on the common stock of Rivian Automotive Inc. (NASDAQ: RIVN).
The Fund may invest in (1) U.S. Government securities, such as bills, notes and bonds issued by the U.S. Treasury; (2) money market funds; (3) short term bond ETFs and/or (4) corporate debt securities, such as commercial paper and other short-term unsecured promissory notes issued by businesses that are rated investment grade or of comparable quality as collateral for the Fund’s swap agreements
Top 10 Holdings
As of June 30, 2026
| Holding | % of Total Investments |
| Recv Long Rivn Trs Marex | 56.34% |
| United States Treasury Bill | 34.20% |
Sector Breakdown
| Sector | % of Total Investments |
| Total Return Swap | 56.34% |
| Government | 34.20% |
| Broker Cash | 9.45% |
Material Fund Changes
There were no material fund changes during the period
If you wish to view additional information about the Fund, including but not limited to the financial statements and holdings, please visit www.graniteshares.com
Phone: (844) 476 8747 – email: info@graniteshares.com
What were the fund’s costs for the last 12 months?
(based on hypothetical $10,000 investment)
| Expense Ratio (Actual) | 1.50% |
| Cost of a $10,000 Investment | $76.92 |
Hypothetical example: The cost shown is the amount you would pay on a $10,000 investment, assuming a return of -97.46% and an expense ratio of 1.50%.
How did the fund perform for the last 12 months?
During the period of June 30, 2025 to June 30, 2026, the Fund had a -97.85% return.
Over the same period the Benchmark had a return of 22.32%.
How did the fund perform since inception.
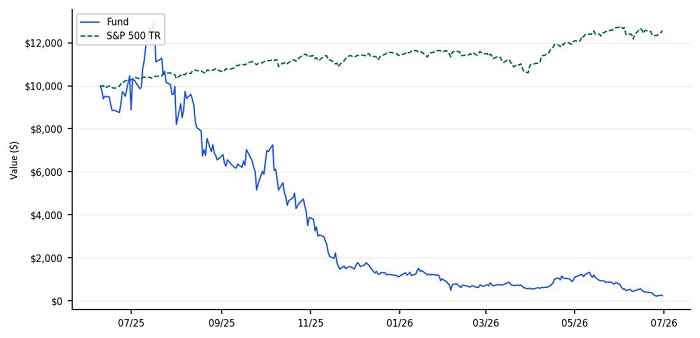
The $10,000 chart reflects a hypothetical $10,000 investment in the Fund. The chart uses total return NAV performance and assumes reinvestment of dividends and capital gains. The NAV performance includes all fund expenses.
Average Annual Total Returns
As of June 30, 2026
| 1 Year | Since
Inception (6/9/2025) | |
| GraniteShares 2x Long MSTR Daily ETF - NAV | -97.85% | -97.24% |
| S&P 500® Total Return Index | 22.32% | 24.87% |
Fund Statistics
| Net Assets | $5,167,479 |
| Total Number of Holdings | 1 |
| Portfolio Turnover Rate | 0% |
| Inception Date | 6/9/2025 |
What does the Fund invest in?
The Fund enters into financial instruments such as swaps and options on the common stock of MicroStrategy Inc (NASDAQ: MSTR).
The Fund may invest in (1) U.S. Government securities, such as bills, notes and bonds issued by the U.S. Treasury; (2) money market funds; (3) short term bond ETFs and/or (4) corporate debt securities, such as commercial paper and other short-term unsecured promissory notes issued by businesses that are rated investment grade or of comparable quality as collateral for the Fund’s swap agreements
Top 10 Holdings
As of June 30, 2026
| Holding | % of Total Investments |
| GRANITESHARES SHORT MSTR SWAP MAREX | % |
Sector Breakdown
| Sector | % of Total Investments |
| Total Return Swap | 72.49% |
| Broker Cash | 27.51% |
Material Fund Changes
There were no material fund changes during the period
If you wish to view additional information about the Fund, including but not limited to the financial statements and holdings, please visit www.graniteshares.com
Phone: (844) 476 8747 – email: info@graniteshares.com
What were the fund’s costs for the last 12 months?
(based on hypothetical $10,000 investment)
| Expense Ratio (Actual) | 1.38% |
| Cost of a $10,000 Investment | $78.30 |
How did the fund perform since inception?
During the period of July 14, 2025 to June 30, 2026, the Fund had a -82.48% return.
Over the same period the Benchmark had a return of 21.04%.
How did the fund perform since inception.
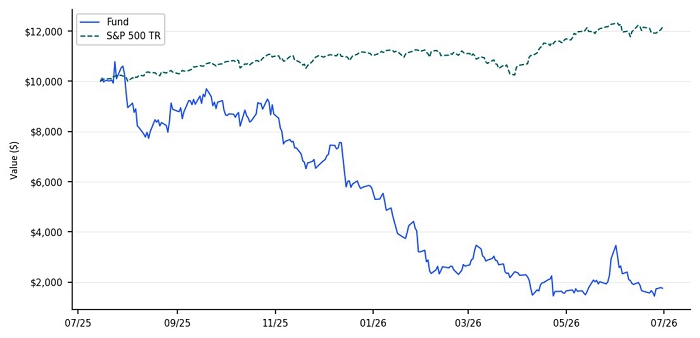
The $10,000 chart reflects a hypothetical $10,000 investment in the Fund. The chart uses total return NAV performance and assumes reinvestment of dividends and capital gains. The NAV performance includes all fund expenses.
Average Annual Total Returns
As of June 30, 2026
| Since
Inception (7/14/2025) | |
| GraniteShares 2x Long NOW Daily ETF - NAV | -82.48% |
| S&P 500® Total Return Index | 21.04% |
Fund Statistics
| Net Assets | $285,662,561 |
| Total Number of Holdings | 2 |
| Portfolio Turnover Rate | 0% |
| Inception Date | 7/14/2025 |
What does the Fund invest in?
The Fund enters into financial instruments such as swaps and options on the common stock of ServiceNow Inc (NYSE: NOW).
The Fund may invest in (1) U.S. Government securities, such as bills, notes and bonds issued by the U.S. Treasury; (2) money market funds; (3) short term bond ETFs and/or (4) corporate debt securities, such as commercial paper and other short-term unsecured promissory notes issued by businesses that are rated investment grade or of comparable quality as collateral for the Fund’s swap agreements
Top 10 Holdings
As of June 30, 2026
| Holding | % of Total Investments |
| GRANITESHARES LONG 2X NOW TRS MAREX | % |
| GRANITESHARES LONG NOW SWAP CANTOR FITZGERALD | % |
Sector Breakdown
| Sector | % of Total Investments |
| Total Return Swap | 87.65% |
| Broker Cash | 12.35% |
Material Fund Changes
There were no material fund changes during the period
If you wish to view additional information about the Fund, including but not limited to the financial statements and holdings, please visit www.graniteshares.com
Phone: (844) 476 8747 – email: info@graniteshares.com
What were the fund’s costs for the last 12 months?
(based on hypothetical $10,000 investment)
| Expense Ratio (Actual) | 1.50% |
| Cost of a $10,000 Investment | $102.67 |
Hypothetical example: The cost shown is the amount you would pay on a $10,000 investment, assuming a return of -57.56% and an expense ratio of 1.50%.
How did the fund perform since inception?
During the period of July 14, 2025 to June 30, 2026, the Fund had a -55.37% return.
Over the same period the Benchmark had a return of 21.04%.
How did the fund perform since inception.
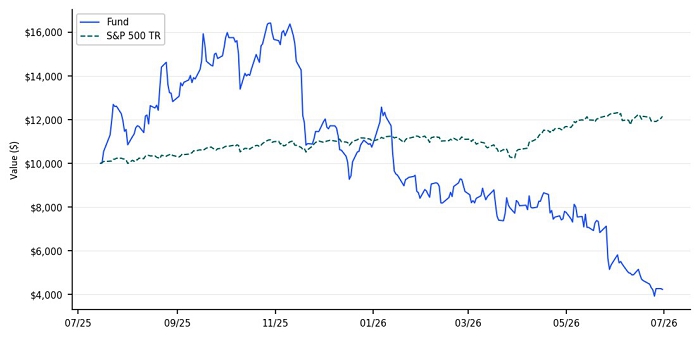
The $10,000 chart reflects a hypothetical $10,000 investment in the Fund. The chart uses total return NAV performance and assumes reinvestment of dividends and capital gains. The NAV performance includes all fund expenses.
Average Annual Total Returns
As of June 30, 2026
| Since
Inception (7/14/2025) | |
| GraniteShares 2x Long PDD Daily ETF - NAV | -55.37% |
| S&P 500® Total Return Index | 21.04% |
Fund Statistics
| Net Assets | $7,558,946 |
| Total Number of Holdings | 2 |
| Portfolio Turnover Rate | 0% |
| Inception Date | 7/14/2025 |
What does the Fund invest in?
The Fund enters into financial instruments such as swaps and options on the common stock of PDD Holdings Inc (NASDAQ: PDD).
The Fund may invest in (1) U.S. Government securities, such as bills, notes and bonds issued by the U.S. Treasury; (2) money market funds; (3) short term bond ETFs and/or (4) corporate debt securities, such as commercial paper and other short-term unsecured promissory notes issued by businesses that are rated investment grade or of comparable quality as collateral for the Fund’s swap agreements
Top 10 Holdings
As of June 30, 2026
| Holding | % of Total Investments |
| GRANITESHARES LONG PDD SWAP CANTOR FITZGERALD | % |
| United States Treasury Bill | 16.22% |
Sector Breakdown
| Sector | % of Total Investments |
| Total Return Swap | 51.15% |
| Broker Cash | 32.63% |
| Government | 16.22% |
Material Fund Changes
There were no material fund changes during the period
If you wish to view additional information about the Fund, including but not limited to the financial statements and holdings, please visit www.graniteshares.com
Phone: (844) 476 8747 – email: info@graniteshares.com
What were the fund’s costs for the last 12 months?
(based on hypothetical $10,000 investment)
| Expense Ratio (Actual) | 1.50% |
| Cost of a $10,000 Investment | $169.20 |
Hypothetical example: The cost shown is the amount you would pay on a $10,000 investment, assuming a return of 34.68% and an expense ratio of 1.50%.
How did the fund perform since inception?
During the period of July 14, 2025 to June 30, 2026, the Fund had a 39.80% return.
Over the same period the Benchmark had a return of 21.04%.
How did the fund perform since inception.
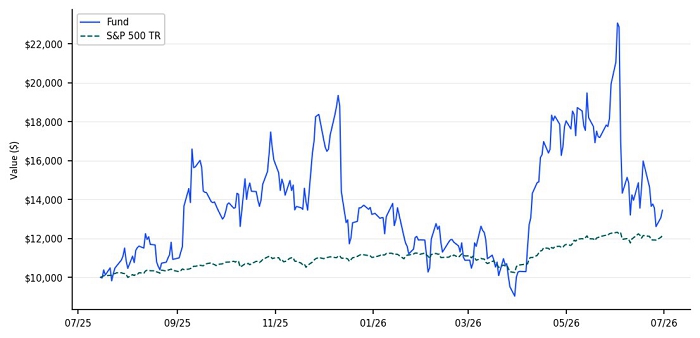
The $10,000 chart reflects a hypothetical $10,000 investment in the Fund. The chart uses total return NAV performance and assumes reinvestment of dividends and capital gains. The NAV performance includes all fund expenses.
Average Annual Total Returns
As of June 30, 2026
| Since
Inception (7/14/2025) | |
| GraniteShares 2x Long AVGO Daily ETF - NAV | 39.80% |
| S&P 500® Total Return Index | 21.04% |
Fund Statistics
| Net Assets | $35,650,050 |
| Total Number of Holdings | 1 |
| Portfolio Turnover Rate | 0% |
| Inception Date | 7/14/2025 |
What does the Fund invest in?
The Fund enters into financial instruments such as swaps and options on the common stock of Broadcom Inc (NASDAQ: AVGO).
The Fund may invest in (1) U.S. Government securities, such as bills, notes and bonds issued by the U.S. Treasury; (2) money market funds; (3) short term bond ETFs and/or (4) corporate debt securities, such as commercial paper and other short-term unsecured promissory notes issued by businesses that are rated investment grade or of comparable quality as collateral for the Fund’s swap agreements
Top 10 Holdings
As of June 30, 2026
| Holding | % of Total Investments |
| GRANITESHARES LONG AVGO SWAP CANTOR FITZGERALD | % |
Sector Breakdown
| Sector | % of Total Investments |
| Total Return Swap | 67.85% |
| Broker Cash | 32.15% |
Material Fund Changes
There were no material fund changes during the period
If you wish to view additional information about the Fund, including but not limited to the financial statements and holdings, please visit www.graniteshares.com
Phone: (844) 476 8747 – email: info@graniteshares.com
What were the fund’s costs for the last 12 months?
(based on hypothetical $10,000 investment)
| Expense Ratio (Actual) | 1.50% |
| Cost of a $10,000 Investment | $93.43 |
Hypothetical example: The cost shown is the amount you would pay on a $10,000 investment, assuming a return of -29.16% and an expense ratio of 1.50%.
How did the fund perform since inception?
During the period of October 06, 2025 to June 30, 2026, the Fund had a -31.96% return.
Over the same period the Benchmark had a return of 12.24%.
How did the fund perform since inception.
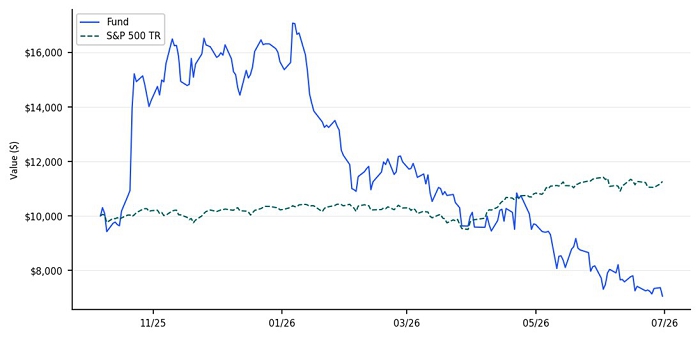
The $10,000 chart reflects a hypothetical $10,000 investment in the Fund. The chart uses total return NAV performance and assumes reinvestment of dividends and capital gains. The NAV performance includes all fund expenses.
Average Annual Total Returns
As of June 30, 2026
| Since
Inception (10/6/2025) | |
| GraniteShares 2x Long ISRG Daily ETF - NAV | -31.96% |
| S&P 500® Total Return Index | 12.24% |
Fund Statistics
| Net Assets | $7,144,327 |
| Total Number of Holdings | 1 |
| Portfolio Turnover Rate | 0% |
| Inception Date | 10/6/2025 |
What does the Fund invest in?
The Fund enters into financial instruments such as swaps and options on the common stock of Intuitive Surgical Inc (NASDAQ: ISRG).
The Fund may invest in (1) U.S. Government securities, such as bills, notes and bonds issued by the U.S. Treasury; (2) money market funds; (3) short term bond ETFs and/or (4) corporate debt securities, such as commercial paper and other short-term unsecured promissory notes issued by businesses that are rated investment grade or of comparable quality as collateral for the Fund’s swap agreements
Top 10 Holdings
As of June 30, 2026
| Holding | % of Total Investments |
| GRANITESHARES 2X LONG ISRG SWAP CLEAR STREET | % |
Sector Breakdown
| Sector | % of Total Investments |
| Total Return Swap | 64.02% |
| Broker Cash | 35.98% |
Material Fund Changes
There were no material fund changes during the period
If you wish to view additional information about the Fund, including but not limited to the financial statements and holdings, please visit www.graniteshares.com
Phone: (844) 476 8747 – email: info@graniteshares.com
What were the fund’s costs for the last 12 months?
(based on hypothetical $10,000 investment)
| Expense Ratio (Actual) | 1.37% |
| Cost of a $10,000 Investment | $179.58 |
Hypothetical example: The cost shown is the amount you would pay on a $10,000 investment, assuming a return of 158.15% and an expense ratio of 1.37%.
How did the fund perform since inception?
During the period of October 06, 2025 to June 30, 2026, the Fund had a 128.12% return.
Over the same period the Benchmark had a return of 12.24%.
How did the fund perform since inception.
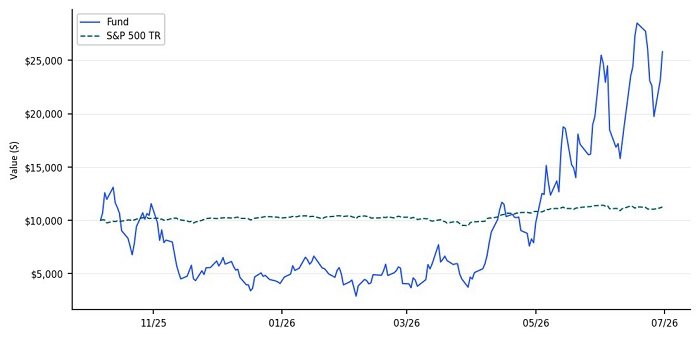
The $10,000 chart reflects a hypothetical $10,000 investment in the Fund. The chart uses total return NAV performance and assumes reinvestment of dividends and capital gains. The NAV performance includes all fund expenses.
Average Annual Total Returns
As of June 30, 2026
| Since
Inception (10/6/2025) | |
| GraniteShares 2x Long NBIS Daily ETF - NAV | 128.12% |
| S&P 500® Total Return Index | 12.24% |
Fund Statistics
| Net Assets | $195,599,438 |
| Total Number of Holdings | 2 |
| Portfolio Turnover Rate | 0% |
| Inception Date | 10/6/2025 |
What does the Fund invest in?
The Fund enters into financial instruments such as swaps and options on the common stock of Nebius Group N.V. (NASDAQ: NBIS).
The Fund may invest in (1) U.S. Government securities, such as bills, notes and bonds issued by the U.S. Treasury; (2) money market funds; (3) short term bond ETFs and/or (4) corporate debt securities, such as commercial paper and other short-term unsecured promissory notes issued by businesses that are rated investment grade or of comparable quality as collateral for the Fund’s swap agreements
Top 10 Holdings
As of June 30, 2026
| Holding | % of Total Investments |
| United States Treasury Bill | 71.55% |
| GRANITESHARES 2X LONG NBIS SWAP CLEAR STREET | % |
Sector Breakdown
| Sector | % of Total Investments |
| Government | 71.55% |
| Total Return Swap | 28.40% |
| Broker Cash | 0.05% |
Material Fund Changes
There were no material fund changes during the period
If you wish to view additional information about the Fund, including but not limited to the financial statements and holdings, please visit www.graniteshares.com
Phone: (844) 476 8747 – email: info@graniteshares.com
What were the fund’s costs for the last 12 months?
(based on hypothetical $10,000 investment)
| Expense Ratio (Actual) | 1.15% |
| Cost of a $10,000 Investment | $71.05 |
Hypothetical example: The cost shown is the amount you would pay on a $10,000 investment, assuming a return of 14.40% and an expense ratio of 1.15%.
How did the fund perform since inception?
During the period of December 01, 2025 to June 30, 2026, the Fund had a 14.88% return.
Over the same period the Benchmark had a return of 10.85%.
How did the fund perform since inception.
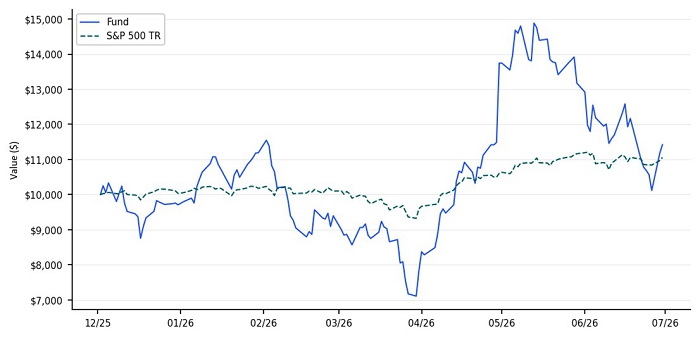
The $10,000 chart reflects a hypothetical $10,000 investment in the Fund. The chart uses total return NAV performance and assumes reinvestment of dividends and capital gains. The NAV performance includes all fund expenses.
Average Annual Total Returns
As of June 30, 2026
| Since
Inception (12/1/2025) | |
| GraniteShares 2x Long GOOGL Daily ETF - NAV | 14.88% |
| S&P 500® Total Return Index | 10.85% |
Fund Statistics
| Net Assets | $12,063,721 |
| Total Number of Holdings | 1 |
| Portfolio Turnover Rate | 0% |
| Inception Date | 12/1/2025 |
What does the Fund invest in?
The Fund enters into financial instruments such as swaps and options on the common stock of Alphabet Inc (NASDAQ: GOOGL).
The Fund may invest in (1) U.S. Government securities, such as bills, notes and bonds issued by the U.S. Treasury; (2) money market funds; (3) short term bond ETFs and/or (4) corporate debt securities, such as commercial paper and other short-term unsecured promissory notes issued by businesses that are rated investment grade or of comparable quality as collateral for the Fund’s swap agreements
Top 10 Holdings
As of June 30, 2026
| Holding | % of Total Investments |
| Recv Long 2x Googl Trs | 79.68% |
Sector Breakdown
| Sector | % of Total Investments |
| Total Return Swap | 79.68% |
| Broker Cash | 20.32% |
Material Fund Changes
There were no material fund changes during the period
If you wish to view additional information about the Fund, including but not limited to the financial statements and holdings, please visit www.graniteshares.com
Phone: (844) 476 8747 – email: info@graniteshares.com
What were the fund’s costs for the last 12 months?
(based on hypothetical $10,000 investment)
| Expense Ratio (Actual) | 1.50% |
| Cost of a $10,000 Investment | $5.68 |
Hypothetical example: The cost shown is the amount you would pay on a $10,000 investment, assuming a return of -25.87% and an expense ratio of 1.50%.
How did the fund perform since inception?
During the period of June 12, 2026 to June 30, 2026, the Fund had a 2.56% return.
Over the same period the Benchmark had a return of 0.97%.
How did the fund perform since inception.
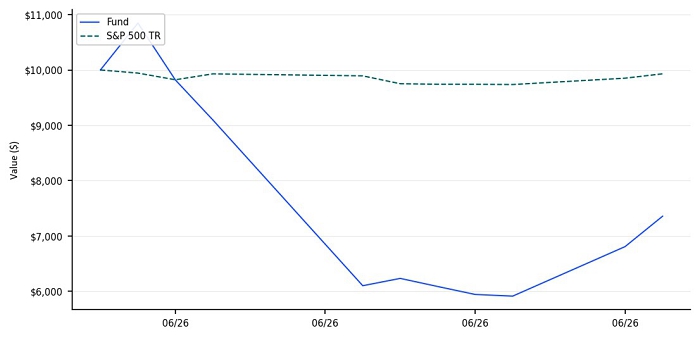
The $10,000 chart reflects a hypothetical $10,000 investment in the Fund. The chart uses total return NAV performance and assumes reinvestment of dividends and capital gains. The NAV performance includes all fund expenses.
Average Annual Total Returns
As of June 30, 2026
| Since
Inception (6/12/2026) | |
| GraniteShares 2x Long SpaceX Daily ETF - NAV | 2.56% |
| S&P 500® Total Return Index | 0.97% |
Fund Statistics
| Net Assets | $31,277,494 |
| Total Number of Holdings | 3 |
| Portfolio Turnover Rate | 0% |
| Inception Date | 6/12/2026 |
What does the Fund invest in?
The Fund enters into financial instruments such as swaps and options on the common stock of SpaceX (NASDAQ: SPCX).
The Fund may invest in (1) U.S. Government securities, such as bills, notes and bonds issued by the U.S. Treasury; (2) money market funds; (3) short term bond ETFs and/or (4) corporate debt securities, such as commercial paper and other short-term unsecured promissory notes issued by businesses that are rated investment grade or of comparable quality as collateral for the Fund’s swap agreements
Top 10 Holdings
As of June 30, 2026
| Holding | % of Total Investments |
| Recv Long Spcx Trs Bm2 | 50.61% |
| GRANITESHARES 2X LONG SPCX TRS CLEAR STREET | % |
Sector Breakdown
| Sector | % of Total Investments |
| Total Return Swap | 71.34% |
| Broker Cash | 28.66% |
Material Fund Changes
There were no material fund changes during the period
If you wish to view additional information about the Fund, including but not limited to the financial statements and holdings, please visit www.graniteshares.com
Phone: (844) 476 8747 – email: info@graniteshares.com
What were the fund’s costs for the last 12 months?
(based on hypothetical $10,000 investment)
| Expense Ratio (Actual) | 2.88% |
| Cost of a $10,000 Investment | $13.20 |
How did the fund perform since inception?
During the period of June 12, 2026 to June 30, 2026, the Fund had a -32.24% return.
Over the same period the Benchmark had a return of 0.97%.
How did the fund perform since inception.
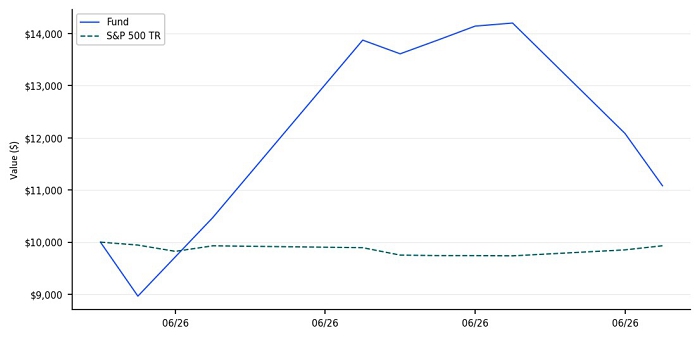
The $10,000 chart reflects a hypothetical $10,000 investment in the Fund. The chart uses total return NAV performance and assumes reinvestment of dividends and capital gains. The NAV performance includes all fund expenses.
Average Annual Total Returns
As of June 30, 2026
| Since
Inception (6/12/2026) | |
| GraniteShares 2x Short SpaceX Daily ETF - NAV | -32.24% |
| S&P 500® Total Return Index | 0.97% |
Fund Statistics
| Net Assets | $38,109,047 |
| Total Number of Holdings | 2 |
| Portfolio Turnover Rate | 0% |
| Inception Date | 6/12/2026 |
Hypothetical example: The cost shown is the amount you would pay on a $10,000 investment, assuming a return of 11.79% and an expense ratio of 2.88%.
What does the Fund invest in?
The Fund enters into financial instruments such as swaps and options on the common stock of SpaceX (NASDAQ: SPCX).
The Fund may invest in (1) U.S. Government securities, such as bills, notes and bonds issued by the U.S. Treasury; (2) money market funds; (3) short term bond ETFs and/or (4) corporate debt securities, such as commercial paper and other short-term unsecured promissory notes issued by businesses that are rated investment grade or of comparable quality as collateral for the Fund’s swap agreements
Top 10 Holdings
As of June 30, 2026
| Holding | % of Total Investments |
| GRANITESHARES 2X SHORT SPCX TRS CLEAR STREET | % |
| United States Treasury Bill | 23.99% |
Sector Breakdown
| Sector | % of Total Investments |
| Total Return Swap | 69.49% |
| Government | 23.99% |
| Broker Cash | 6.52% |
Material Fund Changes
There were no material fund changes during the period
If you wish to view additional information about the Fund, including but not limited to the financial statements and holdings, please visit www.graniteshares.com
Phone: (844) 476 8747 – email: info@graniteshares.com
What were the fund’s costs for the last 12 months?
(based on hypothetical $10,000 investment)
| Expense Ratio (Actual) | 1.08% |
| Cost of a $10,000 Investment | $106.77 |
Hypothetical example: The cost shown is the amount you would pay on a $10,000 investment, assuming a return of -2.36% and an expense ratio of 1.08%.
How did the fund perform for the last 12 months?
During the period of June 30, 2025 to June 30, 2026, the Fund had a -5.44% return.
Over the same period the Benchmark had a return of 22.32%.
How did the fund perform since inception.
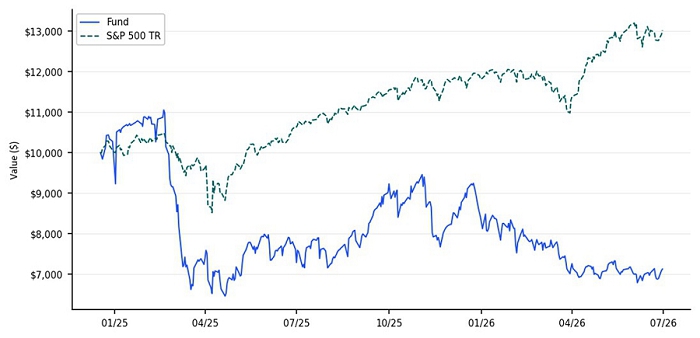
The $10,000 chart reflects a hypothetical $10,000 investment in the Fund. The chart uses total return NAV performance and assumes reinvestment of dividends and capital gains. The NAV performance includes all fund expenses.
Average Annual Total Returns
As of June 30, 2026
| 1 Year | Since
Inception (12/17/2024) | |
| GraniteShares YieldBOOST TSLA ETF - NAV | -5.44% | -20.89% |
| S&P 500® Total Return Index | 22.32% | 16.46% |
Fund Statistics
| Net Assets | $78,671,643 |
| Total Number of Holdings | 5 |
| Portfolio Turnover Rate | 0% |
| Inception Date | 12/17/2024 |
What does the Fund invest in?
The Fund sells put options contracts, either directly or through swap contracts, on the leveraged TSLA ETF and for which it will receive a premium. The put options contracts sold by the Fund may vary in regard to their strike prices from 40% out-of-the-money to 10% in-the-money and their maturity from 1-week to 1-month.
The Fund may invest in (1) U.S. Government securities, such as bills, notes and bonds issued by the U.S. Treasury; (2) money market funds; (3) short term bond ETFs and/or (4) corporate debt securities, such as commercial paper and other short-term unsecured promissory notes issued by businesses that are rated investment grade or of comparable quality as collateral for the Fund’s swap agreements
Top 10 Holdings
As of June 30, 2026
| Holding | % of Total Investments |
| United States Treasury Bill | 67.69% |
| United States Treasury Bill | 30.54% |
| Put TSLR July 21.05 07/06/2026 | 0.43% |
| Put TSLL July 10.46 07/02/2026 | 0.01% |
| Put TSLL July 10.28 07/01/2026 | 0.00% |
Sector Breakdown
| Sector | % of Total Investments |
| Government | 98.23% |
| Broker Cash | 1.32% |
| Purchased Options | 0.45% |
Material Fund Changes
There were no material fund changes during the period
If you wish to view additional information about the Fund, including but not limited to the financial statements and holdings, please visit www.graniteshares.com
Phone: (844) 476 8747 – email: info@graniteshares.com
What were the fund’s costs for the last 12 months?
(based on hypothetical $10,000 investment)
| Expense Ratio (Actual) | 1.15% |
| Cost of a $10,000 Investment | $124.84 |
Hypothetical example: The cost shown is the amount you would pay on a $10,000 investment, assuming a return of 17.10% and an expense ratio of 1.15%.
How did the fund perform for the last 12 months?
During the period of June 30, 2025 to June 30, 2026, the Fund had a 17.57% return.
Over the same period the Benchmark had a return of 22.32%.
How did the fund perform since inception.
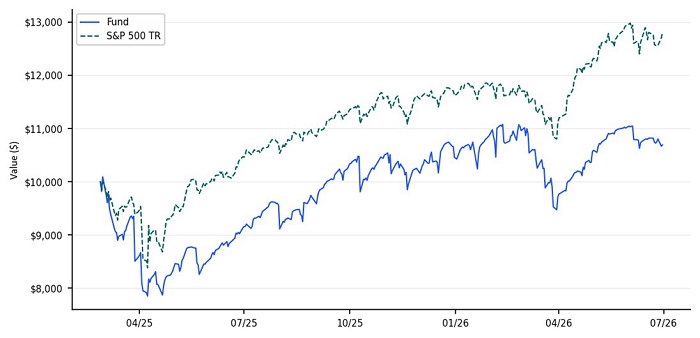
The $10,000 chart reflects a hypothetical $10,000 investment in the Fund. The chart uses total return NAV performance and assumes reinvestment of dividends and capital gains. The NAV performance includes all fund expenses.
Average Annual Total Returns
As of June 30, 2026
| 1 Year | Since
Inception (2/25/2025) | |
| GraniteShares YieldBOOST SPY ETF - NAV | 17.57% | 8.78% |
| S&P 500® Total Return Index | 22.32% | 20.23% |
Fund Statistics
| Net Assets | $12,084,088 |
| Total Number of Holdings | 4 |
| Portfolio Turnover Rate | 0% |
| Inception Date | 2/25/2025 |
What does the Fund invest in?
The Fund sells put options contracts, either directly or through swap contracts, on the Direxion Daily S&P500’ Bull 3X Shares (NYSE ARCA: SPXL) and for which it will receive a premium. The put options contracts sold by the Fund may vary in regard to their strike prices and their maturity.
The Fund may invest in (1) U.S. Government securities, such as bills, notes and bonds issued by the U.S. Treasury; (2) money market funds; (3) short term bond ETFs and/or (4) corporate debt securities, such as commercial paper and other short -term unsecured promissory notes issued by businesses that are rated investment grade or of comparable quality as collateral for the Fund’s swap agreements
Top 10 Holdings
As of June 30, 2026
| Holding | % of Total Investments |
| United States Treasury Bill | 50.40% |
| United States Treasury Bill | 28.70% |
| Put SPXL July 226.49 07/02/2026 | 0.05% |
| Put SPXL July 231.41 07/01/2026 | 0.00% |
Sector Breakdown
| Sector | % of Total Investments |
| Government | 79.10% |
| Broker Cash | 20.85% |
| Purchased Options | 0.05% |
Material Fund Changes
There were no material fund changes during the period
If you wish to view additional information about the Fund, including but not limited to the financial statements and holdings, please visit www.graniteshares.com
Phone: (844) 476 8747 – email: info@graniteshares.com
What were the fund’s costs for the last 12 months?
(based on hypothetical $10,000 investment)
| Expense Ratio (Actual) | 1.15% |
| Cost of a $10,000 Investment | $121.74 |
Hypothetical example: The cost shown is the amount you would pay on a $10,000 investment, assuming a return of 11.72% and an expense ratio of 1.15%.
How did the fund perform for the last 12 months?
During the period of June 30, 2025 to June 30, 2026, the Fund had a 11.29% return.
Over the same period the Benchmark had a return of 22.32%.
How did the fund perform since inception.
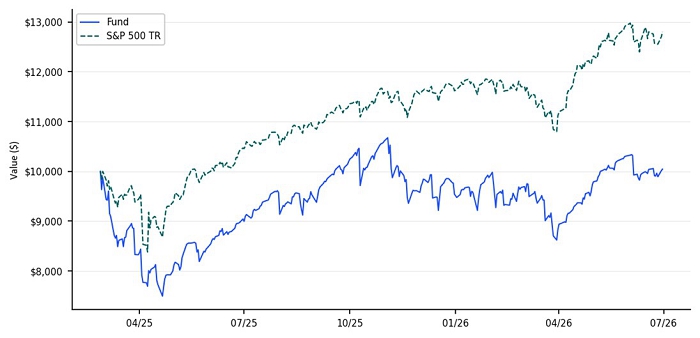
The $10,000 chart reflects a hypothetical $10,000 investment in the Fund. The chart uses total return NAV performance and assumes reinvestment of dividends and capital gains. The NAV performance includes all fund expenses.
Average Annual Total Returns
As of June 30, 2026
| 1 Year | Since
Inception (2/25/2025) | |
| GraniteShares YieldBOOST QQQ ETF - NAV | 11.29% | 0.44% |
| S&P 500® Total Return Index | 22.32% | 20.23% |
Fund Statistics
| Net Assets | $6,625,150 |
| Total Number of Holdings | 5 |
| Portfolio Turnover Rate | 0% |
| Inception Date | 2/25/2025 |
What does the Fund invest in?
The Fund sells put options contracts, either directly or through swap contracts, on the ProShares UltraPro’ QQQ (NASDAQ: TQQQ), for which it will receive a premium. The put options contracts sold by the Fund may vary in regard to their strike prices and their maturity from 1-week to 1-month.
The Fund may also invest in (1) U.S. Government securities, such as bills, notes and bonds issued by the U.S. Treasury; (2) money market funds; (3) short term bond ETFs and/or (4) corporate debt securities, such as commercial paper and other short-term unsecured promissory notes issued by businesses that are rated investment grade or of comparable quality as collateral for the Fund’s swap agreements
Top 10 Holdings
As of June 30, 2026
| Holding | % of Total Investments |
| United States Treasury Bill | 52.58% |
| United States Treasury Bill | 23.43% |
| Put TQQQ July 69.47 07/06/2026 | 0.08% |
| Put TQQQ July 64.65 07/02/2026 | 0.05% |
| Put TQQQ July 65.97 07/01/2026 | 0.02% |
Sector Breakdown
| Sector | % of Total Investments |
| Government | 76.01% |
| Broker Cash | 23.84% |
| Purchased Options | 0.15% |
Material Fund Changes
There were no material fund changes during the period
If you wish to view additional information about the Fund, including but not limited to the financial statements and holdings, please visit www.graniteshares.com
Phone: (844) 476 8747 – email: info@graniteshares.com
What were the fund’s costs for the last 12 months?
(based on hypothetical $10,000 investment)
| Expense Ratio (Actual) | 1.11% |
| Cost of a $10,000 Investment | $122.92 |
Hypothetical example: The cost shown is the amount you would pay on a $10,000 investment, assuming a return of 20.76% and an expense ratio of 1.11%.
How did the fund perform for the last 12 months?
During the period of June 30, 2025 to June 30, 2026, the Fund had a 17.61% return.
Over the same period the Benchmark had a return of 22.32%.
How did the fund perform since inception.
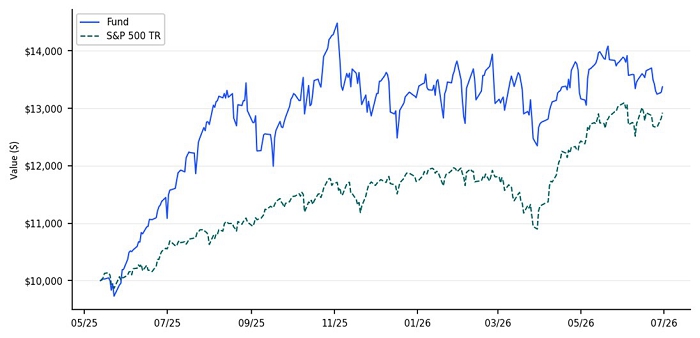
The $10,000 chart reflects a hypothetical $10,000 investment in the Fund. The chart uses total return NAV performance and assumes reinvestment of dividends and capital gains. The NAV performance includes all fund expenses.
Average Annual Total Returns
As of June 30, 2026
| 1 Year | Since
Inception (5/12/2025) | |
| GraniteShares YieldBOOST NVDA ETF - NAV | 17.61% | 32.47% |
| S&P 500® Total Return Index | 22.32% | 26.15% |
Fund Statistics
| Net Assets | $39,317,560 |
| Total Number of Holdings | 5 |
| Portfolio Turnover Rate | 0% |
| Inception Date | 5/12/2025 |
What does the Fund invest in?
The Fund sells put options contracts, either directly or through swap contracts, on the leveraged NVDA ETF and for which it will receive a premium. The put options contracts sold and bought by the Fund may vary in regard to their strike prices from and their maturity.
The Fund may also invest in (1) U.S. Government securities, such as bills, notes and bonds issued by the U.S. Treasury; (2) money market funds; (3) short term bond ETFs and/or (4) corporate debt securities, such as commercial paper and other short-term unsecured promissory notes issued by businesses that are rated investment grade or of comparable quality as collateral for the Fund’s swap agreements
Top 10 Holdings
As of June 30, 2026
| Holding | % of Total Investments |
| United States Treasury Bill | 59.16% |
| United States Treasury Bill | 18.03% |
| Put NVDL July 25.58 07/06/2026 | 0.13% |
| Put NVDL July 26.6567 07/01/2026 | 0.06% |
| Put NVDL July 24.82 07/02/2026 | 0.02% |
Sector Breakdown
| Sector | % of Total Investments |
| Government | 77.19% |
| Broker Cash | 22.61% |
| Purchased Options | 0.20% |
Material Fund Changes
There were no material fund changes during the period
If you wish to view additional information about the Fund, including but not limited to the financial statements and holdings, please visit www.graniteshares.com
Phone: (844) 476 8747 – email: info@graniteshares.com
What were the fund’s costs for the last 12 months?
(based on hypothetical $10,000 investment)
| Expense Ratio (Actual) | 1.15% |
| Cost of a $10,000 Investment | $90.44 |
Hypothetical example: The cost shown is the amount you would pay on a $10,000 investment, assuming a return of -42.71% and an expense ratio of 1.15%.
How did the fund perform for the last 12 months?
During the period of June 30, 2025 to June 30, 2026, the Fund had a -43.74% return.
Over the same period the Benchmark had a return of 22.32%.
How did the fund perform since inception.
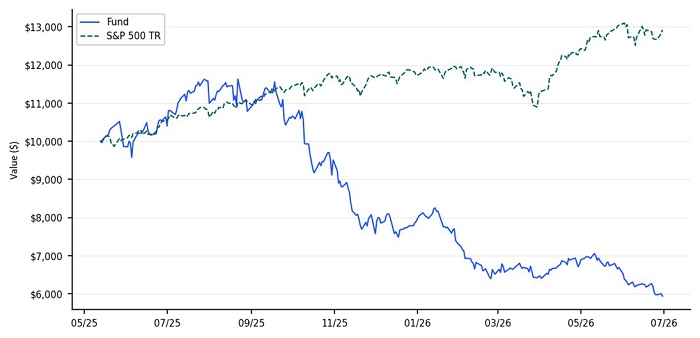
The $10,000 chart reflects a hypothetical $10,000 investment in the Fund. The chart uses total return NAV performance and assumes reinvestment of dividends and capital gains. The NAV performance includes all fund expenses.
Average Annual Total Returns
As of June 30, 2026
| 1 Year | Since
Inception (5/12/2025) | |
| GraniteShares YieldBOOST Bitcoin ETF - NAV | -43.74% | -35.43% |
| S&P 500® Total Return Index | 22.32% | 26.15% |
Fund Statistics
| Net Assets | $11,576,765 |
| Total Number of Holdings | 5 |
| Portfolio Turnover Rate | 0% |
| Inception Date | 5/12/2025 |
What does the Fund invest in?
The Fund sells put options contracts, either directly or through swap contracts, on the leveraged bitcoin ETF and for which it will receive a premium. The put options contracts sold by the Fund may vary in regard to their strike prices and their maturity.
The Fund may also invest in (1) U.S. Government securities, such as bills, notes and bonds issued by the U.S. Treasury; (2) money market funds; (3) short term bond ETFs and/or (4) corporate debt securities, such as commercial paper and other short-term unsecured promissory notes issued by businesses that are rated investment grade or of comparable quality as collateral for the Fund’s swap agreements
Top 10 Holdings
As of June 30, 2026
| Holding | % of Total Investments |
| United States Treasury Bill | 61.83% |
| United States Treasury Bill | 37.04% |
| Put BITX July 9.84 07/06/2026 | 0.70% |
| Put BITX July 9.70 07/01/2026 | 0.27% |
| Put BITX July 9.65 07/02/2026 | 0.16% |
Sector Breakdown
| Sector | % of Total Investments |
| Government | 98.87% |
| Purchased Options | 1.13% |
Material Fund Changes
There were no material fund changes during the period
If you wish to view additional information about the Fund, including but not limited to the financial statements and holdings, please visit www.graniteshares.com
Phone: (844) 476 8747 – email: info@graniteshares.com
What were the fund’s costs for the last 12 months?
(based on hypothetical $10,000 investment)
| Expense Ratio (Actual) | 1.11% |
| Cost of a $10,000 Investment | $72.25 |
How did the fund perform since inception?
During the period of July 28, 2025 to June 30, 2026, the Fund had a -59.39% return.
Over the same period the Benchmark had a return of 18.71%.
How did the fund perform since inception.
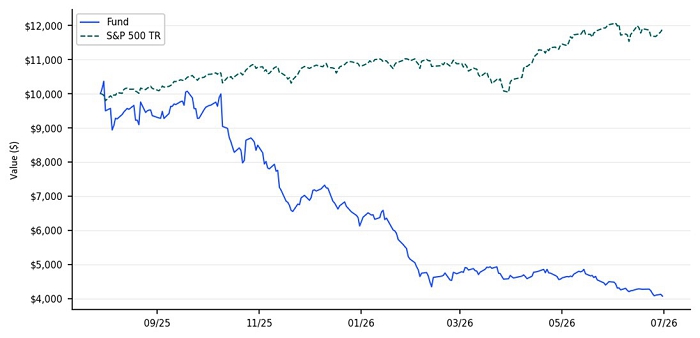
The $10,000 chart reflects a hypothetical $10,000 investment in the Fund. The chart uses total return NAV performance and assumes reinvestment of dividends and capital gains. The NAV performance includes all fund expenses.
Average Annual Total Returns
As of June 30, 2026
| Since
Inception (7/28/2025) | |
| GraniteShares YieldBOOST COIN ETF - NAV | -59.39% |
| S&P 500® Total Return Index | 18.71% |
Fund Statistics
| Net Assets | $ 21,107,617 |
| Total Number of Holdings | 5 |
| Portfolio Turnover Rate | 0% |
| Inception Date | 7/28/2025 |
What does the Fund invest in?
The Fund sells put options contracts, either directly or through swap contracts, on the leveraged COIN ETF and for which it will receive a premium. The put options contracts sold by the Fund may vary in regard to their strike prices and their maturity.
The Fund may also invest in (1) U.S. Government securities, such as bills, notes and bonds issued by the U.S. Treasury; (2) money market funds; (3) short term bond ETFs and/or (4) corporate debt securities, such as commercial paper and other short-term unsecured promissory notes issued by businesses that are rated investment grade or of comparable quality as collateral for the Fund’s swap agreements
Top 10 Holdings
As of June 30, 2026
| Holding | % of Total Investments |
| United States Treasury Bill | 98.25% |
| Put CONL July 4.09 07/01/2026 | 0.70% |
| Put CONL July 4.13 07/06/2026 | 0.53% |
| Put CONL July 4.01 07/02/2026 | 0.52% |
Sector Breakdown
| Sector | % of Total Investments |
| Government | 98.25% |
| Purchased Options | 1.75% |
Material Fund Changes
There were no material fund changes during the period
If you wish to view additional information about the Fund, including but not limited to the financial statements and holdings, please visit www.graniteshares.com
Phone: (844) 476 8747 – email: info@graniteshares.com
What were the fund’s costs for the last 12 months?
(based on hypothetical $10,000 investment)
| Expense Ratio (Actual) | 1.15% |
| Cost of a $10,000 Investment | $104.83 |
Hypothetical example: The cost shown is the amount you would pay on a $10,000 investment, assuming a return of 31.62% and an expense ratio of 1.15%.
How did the fund perform since inception?
During the period of September 15, 2025 to June 30, 2026, the Fund had a 30.99% return.
Over the same period the Benchmark had a return of 14.42%.
How did the fund perform since inception.
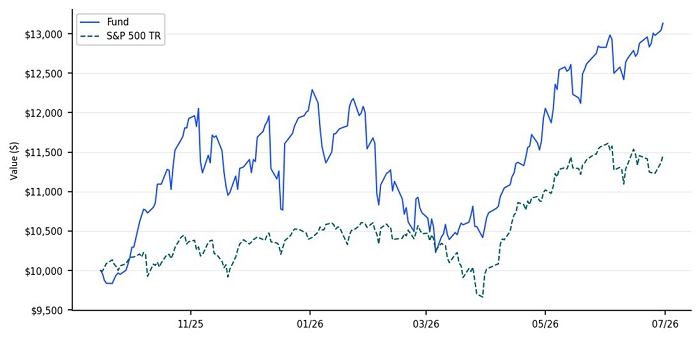
The $10,000 chart reflects a hypothetical $10,000 investment in the Fund. The chart uses total return NAV performance and assumes reinvestment of dividends and capital gains. The NAV performance includes all fund expenses.
Average Annual Total Returns
As of June 30, 2026
| Since
Inception (9/15/2025) | |
| GraniteShares YieldBOOST AMD ETF - NAV | 30.99% |
| S&P 500® Total Return Index | 14.42% |
Fund Statistics
| Net Assets | $9,184,850 |
| Total Number of Holdings | 4 |
| Portfolio Turnover Rate | 0% |
| Inception Date | 9/15/2025 |
What does the Fund invest in?
The Fund sells put options contracts, either directly or through swap contracts, on the leveraged AMD ETF and for which it will receive a premium. The put options contracts sold by the Fund may vary in regard to their strike prices and their maturity.
The Fund may also invest in (1) U.S. Government securities, such as bills, notes and bonds issued by the U.S. Treasury; (2) money market funds; (3) short term bond ETFs and/or (4) corporate debt securities, such as commercial paper and other short-term unsecured promissory notes issued by businesses that are rated investment grade or of comparable quality as collateral for the Fund’s swap agreements
Top 10 Holdings
As of June 30, 2026
| Holding | % of Total Investments |
| United States Treasury Bill | 62.52% |
| Put AMDL July 64.62 07/06/2026 | 0.16% |
| Put AMDL July 60.06 07/02/2026 | 0.11% |
| Put AMDL July 60.07 07/01/2026 | 0.01% |
Sector Breakdown
| Sector | % of Total Investments |
| Government | 62.52% |
| Broker Cash | 37.20% |
| Purchased Options | 0.28% |
Material Fund Changes
There were no material fund changes during the period
If you wish to view additional information about the Fund, including but not limited to the financial statements and holdings, please visit www.graniteshares.com
Phone: (844) 476 8747 – email: info@graniteshares.com
What were the fund’s costs for the last 12 months?
(based on hypothetical $10,000 investment)
| Expense Ratio (Actual) | 1.15% |
| Cost of a $10,000 Investment | $85.51 |
How did the fund perform since inception?
During the period of September 15, 2025 to June 30, 2026, the Fund had a -10.89% return.
Over the same period the Benchmark had a return of 14.42%.
How did the fund perform since inception.
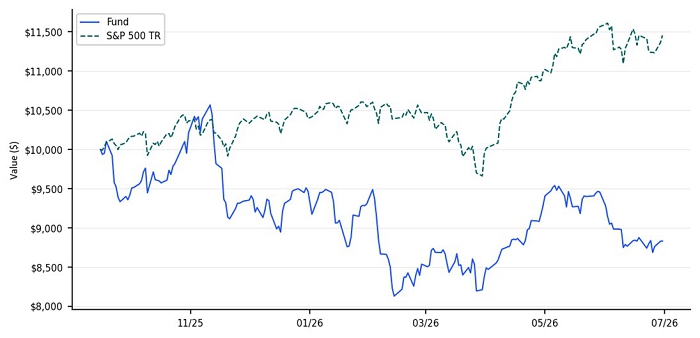
The $10,000 chart reflects a hypothetical $10,000 investment in the Fund. The chart uses total return NAV performance and assumes reinvestment of dividends and capital gains. The NAV performance includes all fund expenses.
Average Annual Total Returns
As of June 30, 2026
| Since
Inception (9/15/2025) | |
| GraniteShares YieldBOOST AMZN ETF - NAV | -10.89% |
| S&P 500® Total Return Index | 14.42% |
Fund Statistics
| Net Assets | $3,202,989 |
| Total Number of Holdings | 4 |
| Portfolio Turnover Rate | 0% |
| Inception Date | 9/15/2025 |
What does the Fund invest in?
The Fund sells put options contracts, either directly or through swap contracts, on the leveraged AMZN ETF and for which it will receive a premium. The put options contracts sold by the Fund may vary in regard to their strike prices and their maturity.
The Fund may also invest in (1) U.S. Government securities, such as bills, notes and bonds issued by the U.S. Treasury; (2) money market funds; (3) short term bond ETFs and/or (4) corporate debt securities, such as commercial paper and other short-term unsecured promissory notes issued by businesses that are rated investment grade or of comparable quality as collateral for the Fund’s swap agreements
Top 10 Holdings
As of June 30, 2026
| Holding | % of Total Investments |
| United States Treasury Bill | 93.55% |
| Put AMZZ July 26.84 07/01/2026 | 0.05% |
| Put AMZZ July 26.33 07/02/2026 | 0.03% |
Sector Breakdown
| Sector | % of Total Investments |
| Government | 93.55% |
| Broker Cash | 6.36% |
| Purchased Options | 0.09% |
Material Fund Changes
There were no material fund changes during the period
If you wish to view additional information about the Fund, including but not limited to the financial statements and holdings, please visit www.graniteshares.com
Phone: (844) 476 8747 – email: info@graniteshares.com
What were the fund’s costs for the last 12 months?
(based on hypothetical $10,000 investment)
| Expense Ratio (Actual) | 1.15% |
| Cost of a $10,000 Investment | $57.33 |
Hypothetical example: The cost shown is the amount you would pay on a $10,000 investment, assuming a return of -70.16% and an expense ratio of 1.15%.
How did the fund perform since inception?
During the period of September 22, 2025 to June 30, 2026, the Fund had a -70.66% return.
Over the same period the Benchmark had a return of 13.06%.
How did the fund perform since inception.
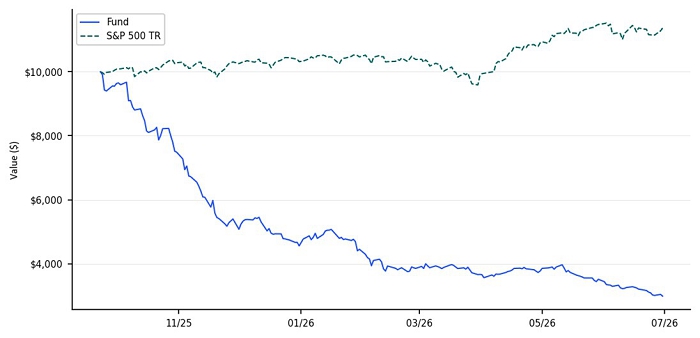
The $10,000 chart reflects a hypothetical $10,000 investment in the Fund. The chart uses total return NAV performance and assumes reinvestment of dividends and capital gains. The NAV performance includes all fund expenses.
Average Annual Total Returns
As of June 30, 2026
| Since
Inception (9/22/2025) | |
| GraniteShares YieldBOOST MSTR ETF - NAV | -70.66% |
| S&P 500® Total Return Index | 13.06% |
Fund Statistics
| Net Assets | $1,395,414 |
| Total Number of Holdings | 4 |
| Portfolio Turnover Rate | 0% |
| Inception Date | 9/22/2025 |
What does the Fund invest in?
The Fund sells put options contracts, either directly or through swap contracts, on the leveraged MSTR ETF and for which it will receive a premium. The put options contracts sold by the Fund may vary in regard to their strike prices and their maturity.
The Fund may also invest in (1) U.S. Government securities, such as bills, notes and bonds issued by the U.S. Treasury; (2) money market funds; (3) short term bond ETFs and/or (4) corporate debt securities, such as commercial paper and other short-term unsecured promissory notes issued by businesses that are rated investment grade or of comparable quality as collateral for the Fund’s swap agreements
Top 10 Holdings
As of June 30, 2026
| Holding | % of Total Investments |
| United States Treasury Bill | 92.41% |
| Put MSTU July 1.77 07/01/2026 | 6.57% |
| Put MSTU July 1.32 07/02/2026 | 1.02% |
Sector Breakdown
| Sector | % of Total Investments |
| Government | 92.41% |
| Purchased Options | 7.59% |
Material Fund Changes
There were no material fund changes during the period
If you wish to view additional information about the Fund, including but not limited to the financial statements and holdings, please visit www.graniteshares.com
Phone: (844) 476 8747 – email: info@graniteshares.com
What were the fund’s costs for the last 12 months?
(based on hypothetical $10,000 investment)
| Expense Ratio (Actual) | 1.15% |
| Cost of a $10,000 Investment | $74.37 |
How did the fund perform since inception?
During the period of September 22, 2025 to June 30, 2026, the Fund had a -30.35% return.
Over the same period the Benchmark had a return of 13.06%.
How did the fund perform since inception.
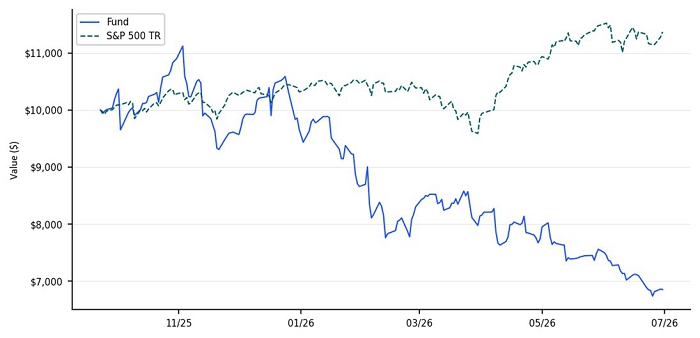
The $10,000 chart reflects a hypothetical $10,000 investment in the Fund. The chart uses total return NAV performance and assumes reinvestment of dividends and capital gains. The NAV performance includes all fund expenses.
Average Annual Total Returns
As of June 30, 2026
| Since
Inception (9/22/2025) | |
| GraniteShares YieldBOOST PLTR ETF - NAV | -30.35% |
| S&P 500® Total Return Index | 13.06% |
Fund Statistics
| Net Assets | $3,099,078 |
| Total Number of Holdings | 4 |
| Portfolio Turnover Rate | 0% |
| Inception Date | 9/22/2025 |
Hypothetical example: The cost shown is the amount you would pay on a $10,000 investment, assuming a return of -31.40% and an expense ratio of 1.15%.
What does the Fund invest in?
The Fund sells put options contracts, either directly or through swap contracts, on the leveraged PLTR ETF and for which it will receive a premium. The put options contracts sold by the Fund may vary in regard to their strike prices and their maturity.
The Fund may also invest in (1) U.S. Government securities, such as bills, notes and bonds issued by the U.S. Treasury; (2) money market funds; (3) short term bond ETFs and/or (4) corporate debt securities, such as commercial paper and other short-term unsecured promissory notes issued by businesses that are rated investment grade or of comparable quality as collateral for the Fund’s swap agreements
Top 10 Holdings
As of June 30, 2026
| Holding | % of Total Investments |
| United States Treasury Bill | 99.98% |
| Put PTIR July 7.93 07/02/2026 | 0.02% |
| Put PTIR July 8.06 07/01/2026 | 0.00% |
Sector Breakdown
| Sector | % of Total Investments |
| Government | 99.98% |
| Purchased Options | 0.02% |
Material Fund Changes
There were no material fund changes during the period
If you wish to view additional information about the Fund, including but not limited to the financial statements and holdings, please visit www.graniteshares.com
Phone: (844) 476 8747 – email: info@graniteshares.com
What were the fund’s costs for the last 12 months?
(based on hypothetical $10,000 investment)
| Expense Ratio (Actual) | 1.15% |
| Cost of a $10,000 Investment | $73.47 |
Hypothetical example: The cost shown is the amount you would pay on a $10,000 investment, assuming a return of -29.33% and an expense ratio of 1.15%.
How did the fund perform since inception?
During the period of September 29, 2025 to June 30, 2026, the Fund had a -27.63% return.
Over the same period the Benchmark had a return of 13.61%.
How did the fund perform since inception.
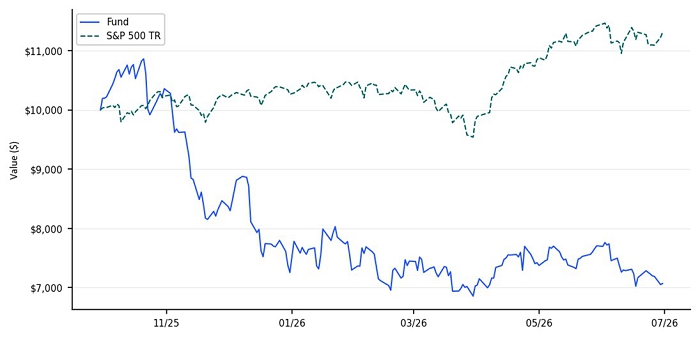
The $10,000 chart reflects a hypothetical $10,000 investment in the Fund. The chart uses total return NAV performance and assumes reinvestment of dividends and capital gains. The NAV performance includes all fund expenses.
Average Annual Total Returns
As of June 30, 2026
| Since
Inception (9/29/2025) | |
| GraniteShares YieldBOOST SMCI ETF - NAV | -27.63% |
| S&P 500® Total Return Index | 13.61% |
Fund Statistics
| Net Assets | $8,693,921 |
| Total Number of Holdings | 5 |
| Portfolio Turnover Rate | 0% |
| Inception Date | 9/29/2025 |
What does the Fund invest in?
The Fund sells put options contracts, either directly or through swap contracts, on the leveraged SMCI ETF and for which it will receive a premium. The put options contracts sold by the Fund may vary in regard to their strike prices and their maturity.
The Fund may also invest in (1) U.S. Government securities, such as bills, notes and bonds issued by the U.S. Treasury; (2) money market funds; (3) short term bond ETFs and/or (4) corporate debt securities, such as commercial paper and other short-term unsecured promissory notes issued by businesses that are rated investment grade or of comparable quality as collateral for the Fund’s swap agreements
Top 10 Holdings
As of June 30, 2026
| Holding | % of Total Investments |
| United States Treasury Bill | 83.83% |
| Put SMCX July 10.00 07/01/2026 | 9.27% |
| Put SMCX July 8.87 07/02/2026 | 2.17% |
| Put SMCX July 7.43 07/06/2026 | 0.59% |
Sector Breakdown
| Sector | % of Total Investments |
| Government | 83.83% |
| Purchased Options | 12.00% |
| Broker Cash | 4.17% |
Material Fund Changes
There were no material fund changes during the period
If you wish to view additional information about the Fund, including but not limited to the financial statements and holdings, please visit www.graniteshares.com
Phone: (844) 476 8747 – email: info@graniteshares.com
What were the fund’s costs for the last 12 months?
(based on hypothetical $10,000 investment)
| Expense Ratio (Actual) | 1.15% |
| Cost of a $10,000 Investment | $66.20 |
Hypothetical example: The cost shown is the amount you would pay on a $10,000 investment, assuming a return of -46.20% and an expense ratio of 1.15%.
How did the fund perform since inception?
During the period of September 29, 2025 to June 30, 2026, the Fund had a -44.47% return.
Over the same period the Benchmark had a return of 13.61%.
How did the fund perform since inception.
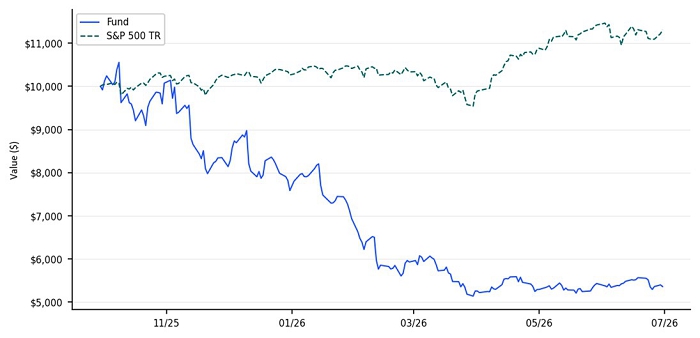
The $10,000 chart reflects a hypothetical $10,000 investment in the Fund. The chart uses total return NAV performance and assumes reinvestment of dividends and capital gains. The NAV performance includes all fund expenses.
Average Annual Total Returns
As of June 30, 2026
| Since
Inception (9/29/2025) | |
| GraniteShares YieldBOOST HOOD ETF - NAV | -44.47% |
| S&P 500® Total Return Index | 13.61% |
Fund Statistics
| Net Assets | $6,999,762 |
| Total Number of Holdings | 5 |
| Portfolio Turnover Rate | 0% |
| Inception Date | 9/29/2025 |
What does the Fund invest in?
The Fund sells put options contracts, either directly or through swap contracts, on the leveraged HOOD ETF and for which it will receive a premium. The put options contracts sold by the Fund may vary in regard to their strike prices and their maturity.
The Fund may also invest in (1) U.S. Government securities, such as bills, notes and bonds issued by the U.S. Treasury; (2) money market funds; (3) short term bond ETFs and/or (4) corporate debt securities, such as commercial paper and other short-term unsecured promissory notes issued by businesses that are rated investment grade or of comparable quality as collateral for the Fund’s swap agreements
Top 10 Holdings
As of June 30, 2026
| Holding | % of Total Investments |
| United States Treasury Bill | 96.07% |
| Put ROBN July 28.01 07/06/2026 | 0.34% |
| Put ROBN July 26.39 07/02/2026 | 0.14% |
| Put ROBN July 25.78 07/01/2026 | 0.12% |
Sector Breakdown
| Sector | % of Total Investments |
| Government | 96.07% |
| Broker Cash | 3.33% |
| Purchased Options | 0.60% |
Material Fund Changes
There were no material fund changes during the period
If you wish to view additional information about the Fund, including but not limited to the financial statements and holdings, please visit www.graniteshares.com
Phone: (844) 476 8747 – email: info@graniteshares.com
What were the fund’s costs for the last 12 months?
(based on hypothetical $10,000 investment)
| Expense Ratio (Actual) | 1.14% |
| Cost of a $10,000 Investment | $65.62 |
Hypothetical example: The cost shown is the amount you would pay on a $10,000 investment, assuming a return of -34.04% and an expense ratio of 1.14%.
How did the fund perform since inception?
During the period of October 20, 2025 to June 30, 2026, the Fund had a -34.16% return.
Over the same period the Benchmark had a return of 12.29%.
How did the fund perform since inception.
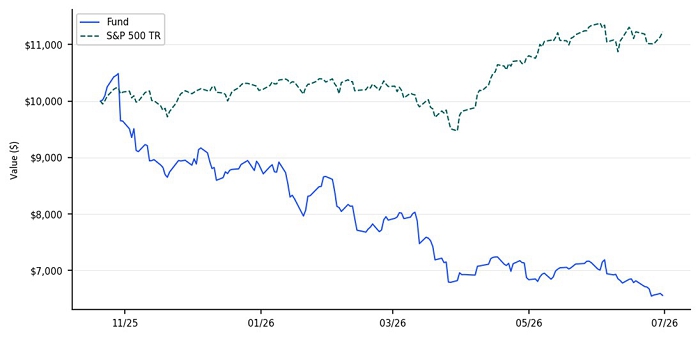
The $10,000 chart reflects a hypothetical $10,000 investment in the Fund. The chart uses total return NAV performance and assumes reinvestment of dividends and capital gains. The NAV performance includes all fund expenses.
Average Annual Total Returns
As of June 30, 2026
| Since
Inception (10/20/2025) | |
| GraniteShares YieldBOOST META ETF - NAV | -34.16% |
| S&P 500® Total Return Index | 12.29% |
Fund Statistics
| Net Assets | $355,679 |
| Total Number of Holdings | 4 |
| Portfolio Turnover Rate | 0% |
| Inception Date | 10/20/2025 |
What does the Fund invest in?
The Fund sells put options contracts, either directly or through swap contracts, on the leveraged META ETF and for which it will receive a premium. The put options contracts sold by the Fund may vary in regard to their strike prices and their maturity.
The Fund may also invest in (1) U.S. Government securities, such as bills, notes and bonds issued by the U.S. Treasury; (2) money market funds; (3) short term bond ETFs and/or (4) corporate debt securities, such as commercial paper and other short-term unsecured promissory notes issued by businesses that are rated investment grade or of comparable quality as collateral for the Fund’s swap agreements
Top 10 Holdings
As of June 30, 2026
| Holding | % of Total Investments |
| United States Treasury Bill | 99.81% |
| Put FBL July 18.81 07/06/2026 | 0.19% |
| Put FBL July 17.96 07/02/2026 | 0.00% |
Sector Breakdown
| Sector | % of Total Investments |
| Government | 99.81% |
| Purchased Options | 0.19% |
Material Fund Changes
There were no material fund changes during the period
If you wish to view additional information about the Fund, including but not limited to the financial statements and holdings, please visit www.graniteshares.com
Phone: (844) 476 8747 – email: info@graniteshares.com
What were the fund’s costs for the last 12 months?
(based on hypothetical $10,000 investment)
| Expense Ratio (Actual) | 1.15% |
| Cost of a $10,000 Investment | $67.51 |
Hypothetical example: The cost shown is the amount you would pay on a $10,000 investment, assuming a return of -29.87% and an expense ratio of 1.15%.
How did the fund perform since inception?
During the period of October 20, 2025 to June 30, 2026, the Fund had a -30.87% return.
Over the same period the Benchmark had a return of 12.29%.
How did the fund perform since inception.
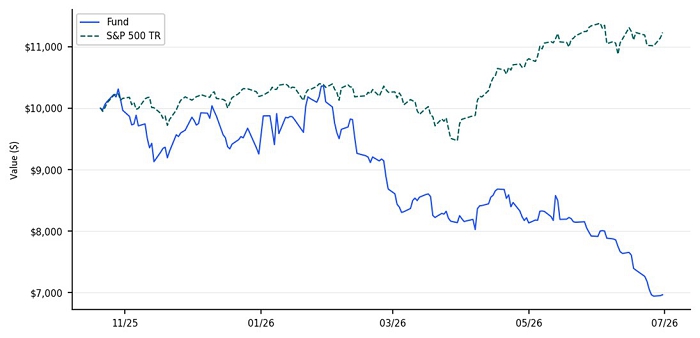
The $10,000 chart reflects a hypothetical $10,000 investment in the Fund. The chart uses total return NAV performance and assumes reinvestment of dividends and capital gains. The NAV performance includes all fund expenses.
Average Annual Total Returns
As of June 30, 2026
| Since
Inception (10/20/2025) | |
| GraniteShares YieldBOOST BABA ETF - NAV | -30.87% |
| S&P 500® Total Return Index | 12.29% |
Fund Statistics
| Net Assets | $670,589 |
| Total Number of Holdings | 4 |
| Portfolio Turnover Rate | 0% |
| Inception Date | 10/20/2025 |
What does the Fund invest in?
The Fund sells put options contracts, either directly or through swap contracts, on the leveraged BABA ETF and for which it will receive a premium. The put options contracts sold by the Fund may vary in regard to their strike prices and their maturity.
The Fund may also invest in (1) U.S. Government securities, such as bills, notes and bonds issued by the U.S. Treasury; (2) money market funds; (3) short term bond ETFs and/or (4) corporate debt securities, such as commercial paper and other short-term unsecured promissory notes issued by businesses that are rated investment grade or of comparable quality as collateral for the Fund’s swap agreements
Top 10 Holdings
As of June 30, 2026
| Holding | % of Total Investments |
| United States Treasury Bill | 99.63% |
| Put BABX July 13.51 07/01/2026 | 0.34% |
| Put BABX July 12.17 07/02/2026 | 0.03% |
Sector Breakdown
| Sector | % of Total Investments |
| Government | 99.63% |
| Purchased Options | 0.37% |
Material Fund Changes
There were no material fund changes during the period
If you wish to view additional information about the Fund, including but not limited to the financial statements and holdings, please visit www.graniteshares.com
Phone: (844) 476 8747 – email: info@graniteshares.com
What were the fund’s costs for the last 12 months?
(based on hypothetical $10,000 investment)
| Expense Ratio (Actual) | 1.15% |
| Cost of a $10,000 Investment | $60.81 |
Hypothetical example: The cost shown is the amount you would pay on a $10,000 investment, assuming a return of -38.02% and an expense ratio of 1.15%.
How did the fund perform since inception?
During the period of November 03, 2025 to June 30, 2026, the Fund had a -40.09% return.
Over the same period the Benchmark had a return of 10.35%.
How did the fund perform since inception.
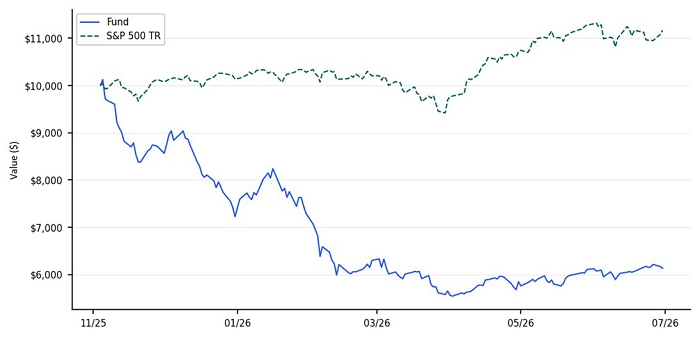
The $10,000 chart reflects a hypothetical $10,000 investment in the Fund. The chart uses total return NAV performance and assumes reinvestment of dividends and capital gains. The NAV performance includes all fund expenses.
Average Annual Total Returns
As of June 30, 2026
| Since
Inception (11/3/2025) | |
| GraniteShares YieldBOOST MARA ETF - NAV | -40.09% |
| S&P 500® Total Return Index | 10.35% |
Fund Statistics
| Net Assets | $2,873,858 |
| Total Number of Holdings | 4 |
| Portfolio Turnover Rate | 0% |
| Inception Date | 11/3/2025 |
What does the Fund invest in?
The Fund sells put options contracts, either directly or through swap contracts, on the leveraged MARA ETF and for which it will receive a premium. The put options contracts sold by the Fund may vary in regard to their strike prices and their maturity.
The Fund may also invest in (1) U.S. Government securities, such as bills, notes and bonds issued by the U.S. Treasury; (2) money market funds; (3) short term bond ETFs and/or (4) corporate debt securities, such as commercial paper and other short-term unsecured promissory notes issued by businesses that are rated investment grade or of comparable quality as collateral for the Fund’s swap agreements
Top 10 Holdings
As of June 30, 2026
| Holding | % of Total Investments |
| United States Treasury Bill | 75.58% |
| Put MRAL July 65.77 07/06/2026 | 1.44% |
| Put MRAL July 69.75 07/02/2026 | 0.51% |
| Put MRAL July 64.63 07/01/2026 | 0.21% |
Sector Breakdown
| Sector | % of Total Investments |
| Government | 75.58% |
| Broker Cash | 22.26% |
| Purchased Options | 2.16% |
Material Fund Changes
There were no material fund changes during the period
If you wish to view additional information about the Fund, including but not limited to the financial statements and holdings, please visit www.graniteshares.com
Phone: (844) 476 8747 – email: info@graniteshares.com
What were the fund’s costs for the last 12 months?
(based on hypothetical $10,000 investment)
| Expense Ratio (Actual) | 1.15% |
| Cost of a $10,000 Investment | $66.28 |
Hypothetical example: The cost shown is the amount you would pay on a $10,000 investment, assuming a return of -23.53% and an expense ratio of 1.15%.
How did the fund perform since inception?
During the period of November 03, 2025 to June 30, 2026, the Fund had a -25.64% return.
Over the same period the Benchmark had a return of 10.35%.
How did the fund perform since inception.
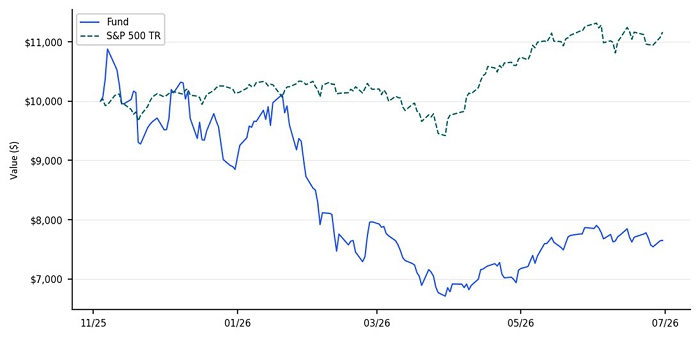
The $10,000 chart reflects a hypothetical $10,000 investment in the Fund. The chart uses total return NAV performance and assumes reinvestment of dividends and capital gains. The NAV performance includes all fund expenses.
Average Annual Total Returns
As of June 30, 2026
| Since
Inception (11/3/2025) | |
| GraniteShares YieldBOOST IONQ ETF - NAV | -25.64% |
| S&P 500® Total Return Index | 10.35% |
Fund Statistics
| Net Assets | $7,003,691 |
| Total Number of Holdings | 4 |
| Portfolio Turnover Rate | 0% |
| Inception Date | 11/3/2025 |
What does the Fund invest in?
The Fund sells put options contracts, either directly or through swap contracts, on the leveraged IONQ ETF and for which it will receive a premium. The put options contracts sold by the Fund may vary in regard to their strike prices and their maturity.
The Fund may also invest in (1) U.S. Government securities, such as bills, notes and bonds issued by the U.S. Treasury; (2) money market funds; (3) short term bond ETFs and/or (4) corporate debt securities, such as commercial paper and other short-term unsecured promissory notes issued by businesses that are rated investment grade or of comparable quality as collateral for the Fund’s swap agreements
Top 10 Holdings
As of June 30, 2026
| Holding | % of Total Investments |
| United States Treasury Bill | 86.04% |
| Put IONL July 24.90 07/06/2026 | 0.79% |
| Put IONL July 25.04 07/01/2026 | 0.61% |
| Put IONL July 20.93 07/02/2026 | 0.10% |
Sector Breakdown
| Sector | % of Total Investments |
| Government | 86.04% |
| Broker Cash | 12.46% |
| Purchased Options | 1.50% |
Material Fund Changes
There were no material fund changes during the period
If you wish to view additional information about the Fund, including but not limited to the financial statements and holdings, please visit www.graniteshares.com
Phone: (844) 476 8747 – email: info@graniteshares.com
What were the fund’s costs for the last 12 months?
(based on hypothetical $10,000 investment)
| Expense Ratio (Actual) | 1.15% |
| Cost of a $10,000 Investment | $69.18 |
How did the fund perform since inception?
During the period of November 17, 2025 to June 30, 2026, the Fund had a -3.67% return.
Over the same period the Benchmark had a return of 15.73%.
How did the fund perform since inception.
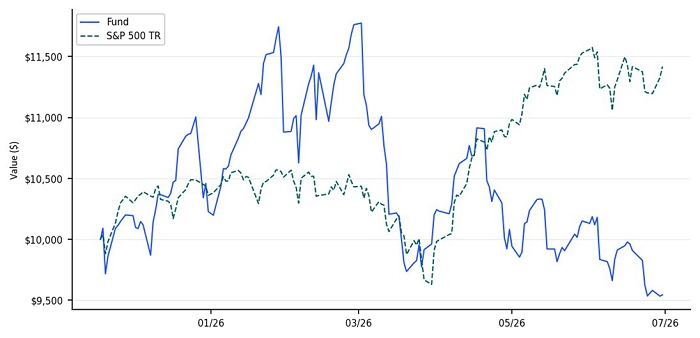
The $10,000 chart reflects a hypothetical $10,000 investment in the Fund. The chart uses total return NAV performance and assumes reinvestment of dividends and capital gains. The NAV performance includes all fund expenses.
Average Annual Total Returns
As of June 30, 2026
| Since
Inception (11/17/2025) | |
| GraniteShares YieldBOOST Gold Miners ETF - NAV | -3.67% |
| S&P 500® Total Return Index | 15.73% |
Fund Statistics
| Net Assets | $7,373,889 |
| Total Number of Holdings | 5 |
| Portfolio Turnover Rate | 0% |
| Inception Date | 11/17/2025 |
What does the Fund invest in?
The Fund sells put options contracts, either directly or through swap contracts, on the leveraged Arca Gold Miners Index ETFs and for which it will receive a premium. The put options contracts sold by the Fund may vary in regard to their strike prices and their maturity.
The Fund may also invest in (1) U.S. Government securities, such as bills, notes and bonds issued by the U.S. Treasury; (2) money market funds; (3) short term bond ETFs and/or (4) corporate debt securities, such as commercial paper and other short-term unsecured promissory notes issued by businesses that are rated investment grade or of comparable quality as collateral for the Fund’s swap agreements
Top 10 Holdings
As of June 30, 2026
| Holding | % of Total Investments |
| United States Treasury Bill | 99.46% |
| Put NUGT July 106.21 07/06/2026 | 0.27% |
| Put NUGT July 110.03 07/02/2026 | 0.24% |
| Put NUGT July 103.22 07/01/2026 | 0.03% |
Sector Breakdown
| Sector | % of Total Investments |
| Government | 99.46% |
| Purchased Options | 0.54% |
Material Fund Changes
There were no material fund changes during the period
If you wish to view additional information about the Fund, including but not limited to the financial statements and holdings, please visit www.graniteshares.com
Phone: (844) 476 8747 – email: info@graniteshares.com
What were the fund’s costs for the last 12 months?
(based on hypothetical $10,000 investment)
| Expense Ratio (Actual) | 1.11% |
| Cost of a $10,000 Investment | $82.56 |
Hypothetical example: The cost shown is the amount you would pay on a $10,000 investment, assuming a return of 41.26% and an expense ratio of 1.11%.
How did the fund perform since inception?
During the period of November 17, 2025 to June 30, 2026, the Fund had a 38.61% return.
Over the same period the Benchmark had a return of 13.25%.
How did the fund perform since inception.
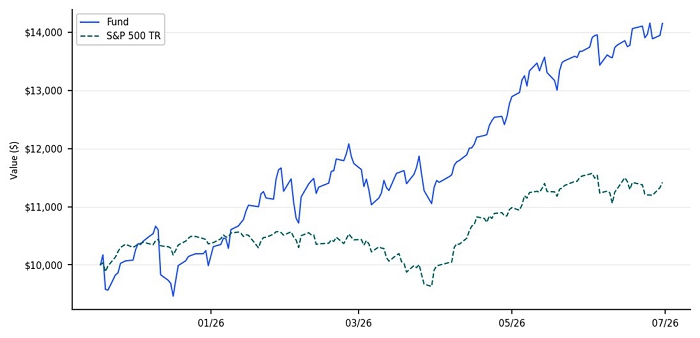
The $10,000 chart reflects a hypothetical $10,000 investment in the Fund. The chart uses total return NAV performance and assumes reinvestment of dividends and capital gains. The NAV performance includes all fund expenses.
Average Annual Total Returns
As of June 30, 2026
| Since
Inception (11/17/2025) | |
| GraniteShares YieldBOOST Semiconductor ETF - NAV | 38.61% |
| S&P 500® Total Return Index | 13.25% |
Fund Statistics
| Net Assets | $94,268,332 |
| Total Number of Holdings | 5 |
| Portfolio Turnover Rate | 0% |
| Inception Date | 11/17/2025 |
What does the Fund invest in?
The Fund sells put options contracts, either directly or through swap contracts, on the 3x leveraged ICESEMI ETFs and for which it will receive a premium. The put options contracts sold by the Fund may vary in regard to their strike prices and their maturity.
The Fund may also invest in (1) U.S. Government securities, such as bills, notes and bonds issued by the U.S. Treasury; (2) money market funds; (3) short term bond ETFs and/or (4) corporate debt securities, such as commercial paper and other short-term unsecured promissory notes issued by businesses that are rated investment grade or of comparable quality as collateral for the Fund’s swap agreements
Top 10 Holdings
As of June 30, 2026
| Holding | % of Total Investments |
| United States Treasury Bill | 55.32% |
| Put SOXL July 212.87 07/06/2026 | 1.41% |
| Put SOXL July 206.61 07/01/2026 | 0.11% |
| Put SOXL July 194.04 07/02/2026 | 0.10% |
Sector Breakdown
| Sector | % of Total Investments |
| Government | 55.32% |
| Broker Cash | 43.06% |
| Purchased Options | 1.62% |
Material Fund Changes
There were no material fund changes during the period
If you wish to view additional information about the Fund, including but not limited to the financial statements and holdings, please visit www.graniteshares.com
Phone: (844) 476 8747 – email: info@graniteshares.com
What were the fund’s costs for the last 12 months?
(based on hypothetical $10,000 investment)
| Expense Ratio (Actual) | 1.15% |
| Cost of a $10,000 Investment | $56.99 |
Hypothetical example: The cost shown is the amount you would pay on a $10,000 investment, assuming a return of -33.36% and an expense ratio of 1.15%.
How did the fund perform since inception?
During the period of November 24, 2025 to June 30, 2026, the Fund had a -35.98% return.
Over the same period the Benchmark had a return of 12.66%.
How did the fund perform since inception.
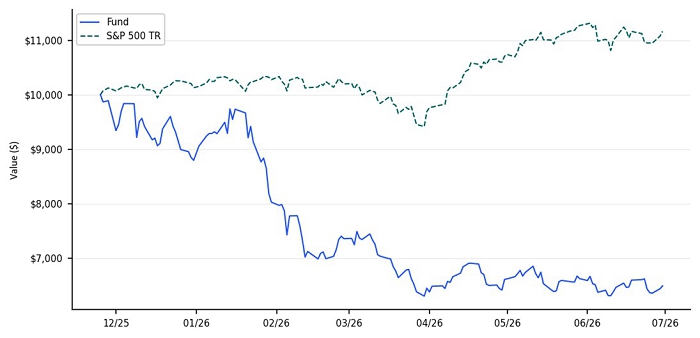
The $10,000 chart reflects a hypothetical $10,000 investment in the Fund. The chart uses total return NAV performance and assumes reinvestment of dividends and capital gains. The NAV performance includes all fund expenses.
Average Annual Total Returns
As of June 30, 2026
| Since
Inception (11/24/2025) | |
| GraniteShares YieldBOOST RGTI ETF - NAV | -35.98% |
| S&P 500® Total Return Index | 12.66% |
Fund Statistics
| Net Assets | $2,920,448 |
| Total Number of Holdings | 6 |
| Portfolio Turnover Rate | 0% |
| Inception Date | 11/24/2025 |
What does the Fund invest in?
The Fund sells put options contracts, either directly or through swap contracts, on the leveraged RGTI ETF and for which it will receive a premium. The put options contracts sold by the Fund may vary in regard to their strike prices and their maturity.
The Fund may also invest in (1) U.S. Government securities, such as bills, notes and bonds issued by the U.S. Treasury; (2) money market funds; (3) short term bond ETFs and/or (4) corporate debt securities, such as commercial paper and other short-term unsecured promissory notes issued by businesses that are rated investment grade or of comparable quality as collateral for the Fund’s swap agreements
Top 10 Holdings
As of June 30, 2026
| Holding | % of Total Investments |
| United States Treasury Bill | 95.26% |
| Put RGTX July 16.65 07/06/2026 | 1.41% |
| Put RGTX July 17.25 07/01/2026 | 0.97% |
| Put RGTX July 15.00 07/02/2026 | 0.44% |
| Put RGTX July 15.18 07/01/2026 | 0.03% |
Sector Breakdown
| Sector | % of Total Investments |
| Government | 95.26% |
| Purchased Options | 2.85% |
| Broker Cash | 1.89% |
Material Fund Changes
There were no material fund changes during the period
If you wish to view additional information about the Fund, including but not limited to the financial statements and holdings, please visit www.graniteshares.com
Phone: (844) 476 8747 – email: info@graniteshares.com
What were the fund’s costs for the last 12 months?
(based on hypothetical $10,000 investment)
| Expense Ratio (Actual) | 1.15% |
| Cost of a $10,000 Investment | $56.99 |
Hypothetical example: The cost shown is the amount you would pay on a $10,000 investment, assuming a return of -33.30% and an expense ratio of 1.15%.
How did the fund perform since inception?
During the period of November 24, 2025 to June 30, 2026, the Fund had a -34.33% return.
Over the same period the Benchmark had a return of 12.66%.
How did the fund perform since inception.
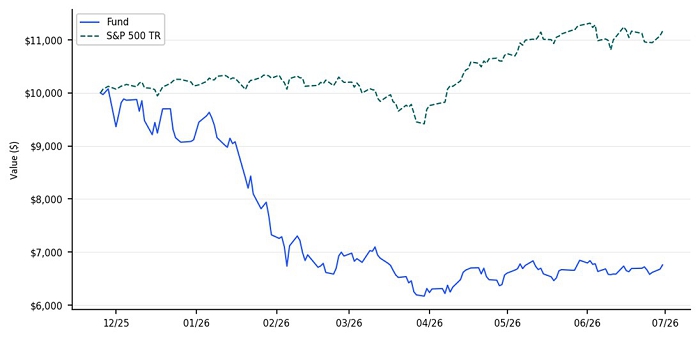
The $10,000 chart reflects a hypothetical $10,000 investment in the Fund. The chart uses total return NAV performance and assumes reinvestment of dividends and capital gains. The NAV performance includes all fund expenses.
Average Annual Total Returns
As of June 30, 2026
| Since
Inception (11/24/2025) | |
| GraniteShares YieldBOOST QBTS ETF - NAV | -34.33% |
| S&P 500® Total Return Index | 12.66% |
Fund Statistics
| Net Assets | $2,775,309 |
| Total Number of Holdings | 5 |
| Portfolio Turnover Rate | 0% |
| Inception Date | 11/24/2025 |
What does the Fund invest in?
The Fund sells put options contracts, either directly or through swap contracts, on the leveraged QBTS ETF and for which it will receive a premium. The put options contracts sold by the Fund may vary in regard to their strike prices and their maturity.
The Fund may also invest in (1) U.S. Government securities, such as bills, notes and bonds issued by the U.S. Treasury; (2) money market funds; (3) short term bond ETFs and/or (4) corporate debt securities, such as commercial paper and other short-term unsecured promissory notes issued by businesses that are rated investment grade or of comparable quality as collateral for the Fund’s swap agreements
Top 10 Holdings
As of June 30, 2026
| Holding | % of Total Investments |
| United States Treasury Bill | 87.01% |
| Put QBTX July 13.30 07/06/2026 | 2.96% |
| Put QBTX July 12.25 07/02/2026 | 0.32% |
| Put QBTX July 12.06 07/01/2026 | 0.07% |
Sector Breakdown
| Sector | % of Total Investments |
| Government | 87.01% |
| Broker Cash | 9.63% |
| Purchased Options | 3.36% |
Material Fund Changes
There were no material fund changes during the period
If you wish to view additional information about the Fund, including but not limited to the financial statements and holdings, please visit www.graniteshares.com
Phone: (844) 476 8747 – email: info@graniteshares.com
What were the fund’s costs for the last 12 months?
(based on hypothetical $10,000 investment)
| Expense Ratio (Actual) | 1.15% |
| Cost of a $10,000 Investment | $64.51 |
Hypothetical example: The cost shown is the amount you would pay on a $10,000 investment, assuming a return of -6.11% and an expense ratio of 1.15%.
How did the fund perform since inception?
During the period of January 15, 2025 to June 30, 2026, the Fund had a -6.11% return.
Over the same period the Benchmark had a return of 10.85%.
How did the fund perform since inception.
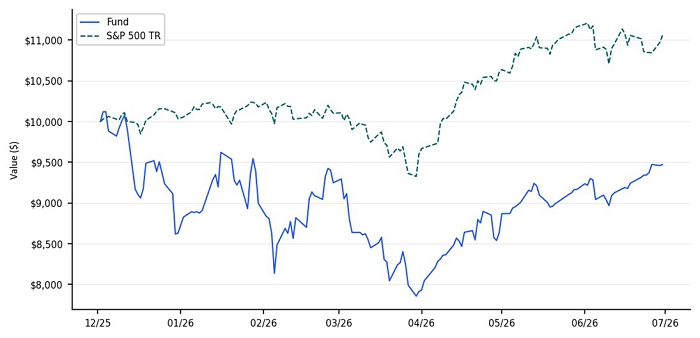
The $10,000 chart reflects a hypothetical $10,000 investment in the Fund. The chart uses total return NAV performance and assumes reinvestment of dividends and capital gains. The NAV performance includes all fund expenses.
Average Annual Total Returns
As of June 30, 2026
| Since
Inception (01/15/2025) | |
| GraniteShares YieldBOOST RIOT ETF - NAV | -6.11% |
| S&P 500® Total Return Index | 10.85% |
Fund Statistics
| Net Assets | $3,651,717 |
| Total Number of Holdings | 4 |
| Portfolio Turnover Rate | 0% |
| Inception Date | 1/15/2025 |
What does the Fund invest in?
The Fund sells put options contracts, either directly or through swap contracts, on the leveraged RIOT ETF and for which it will receive a premium. The put options contracts sold by the Fund may vary in regard to their strike prices and their maturity.
The Fund may also invest in (1) U.S. Government securities, such as bills, notes and bonds issued by the U.S. Treasury; (2) money market funds; (3) short term bond ETFs and/or (4) corporate debt securities, such as commercial paper and other short-term unsecured promissory notes issued by businesses that are rated investment grade or of comparable quality as collateral for the Fund’s swap agreements
Top 10 Holdings
As of June 30, 2026
| Holding | % of Total Investments |
| United States Treasury Bill | 75.28% |
| Put RIOX July 57.49 07/02/2026 | 1.31% |
| Put RIOX July 57.49 07/02/2026 | 0.76% |
| Put RIOX July 54.00 07/01/2026 | 0.7% |
Sector Breakdown
| Sector | % of Total Investments |
| Government | 75.28% |
| Broker Cash | 21.95% |
| Purchased Options | 2,77% |
Material Fund Changes
There were no material fund changes during the period
If you wish to view additional information about the Fund, including but not limited to the financial statements and holdings, please visit www.graniteshares.com
Phone: (844) 476 8747 – email: info@graniteshares.com
What were the fund’s costs for the last 12 months?
(based on hypothetical $10,000 investment)
| Expense Ratio (Actual) | 1.15% |
| Cost of a $10,000 Investment | $50.33 |
Hypothetical example: The cost shown is the amount you would pay on a $10,000 investment, assuming a return of -47.64% and an expense ratio of 1.15%.
How did the fund perform since inception?
During the period of December 01, 2025 to June 30, 2026, the Fund had a -48.59% return.
Over the same period the Benchmark had a return of 10.85%.
How did the fund perform since inception.
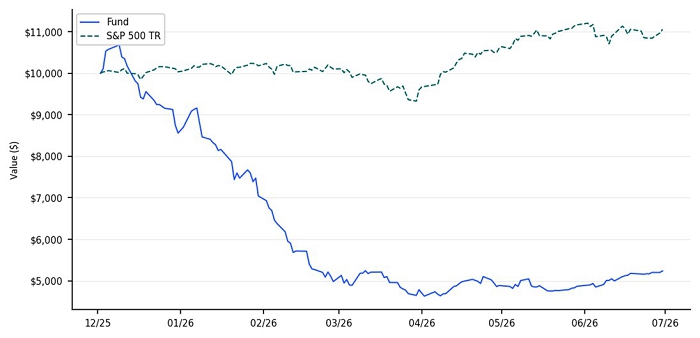
The $10,000 chart reflects a hypothetical $10,000 investment in the Fund. The chart uses total return NAV performance and assumes reinvestment of dividends and capital gains. The NAV performance includes all fund expenses.
Average Annual Total Returns
As of June 30, 2026
| Since
Inception (12/1/2025) | |
| GraniteShares YieldBOOST HIMS ETF - NAV | -48.59% |
| S&P 500® Total Return Index | 10.85% |
Fund Statistics
| Net Assets | $775,361 |
| Total Number of Holdings | 5 |
| Portfolio Turnover Rate | 0% |
| Inception Date | 12/1/2025 |
What does the Fund invest in?
The Fund sells put options contracts, either directly or through swap contracts, on the leveraged HIMS ETF and for which it will receive a premium. The put options contracts sold by the Fund may vary in regard to their strike prices and their maturity.
The Fund may also invest in (1) U.S. Government securities, such as bills, notes and bonds issued by the U.S. Treasury; (2) money market funds; (3) short term bond ETFs and/or (4) corporate debt securities, such as commercial paper and other short-term unsecured promissory notes issued by businesses that are rated investment grade or of comparable quality as collateral for the Fund’s swap agreements
Top 10 Holdings
As of June 30, 2026
| Holding | % of Total Investments |
| United States Treasury Bill | 85.39% |
| Put HIMZ July 41.17 07/06/2026 | 0.70% |
| Put HIMZ July 42.52 07/02/2026 | 0.30% |
| Put HIMZ July 39.76 07/01/2026 | 0.04% |
Sector Breakdown
| Sector | % of Total Investments |
| Government | 85.39% |
| Broker Cash | 13.57% |
| Purchased Options | 1.04% |
Material Fund Changes
There were no material fund changes during the period
If you wish to view additional information about the Fund, including but not limited to the financial statements and holdings, please visit www.graniteshares.com
Phone: (844) 476 8747 – email: info@graniteshares.com
What were the fund’s costs for the last 12 months?
(based on hypothetical $10,000 investment)
| Expense Ratio (Actual) | 1.15% |
| Cost of a $10,000 Investment | $23.91 |
Hypothetical example: The cost shown is the amount you would pay on a $10,000 investment, assuming a return of -4.51% and an expense ratio of 1.15%.
How did the fund perform since inception?
During the period of April 13, 2026 to June 30, 2026, the Fund had a -3.34% return.
Over the same period the Benchmark had a return of 9.18%.
How did the fund perform since inception.
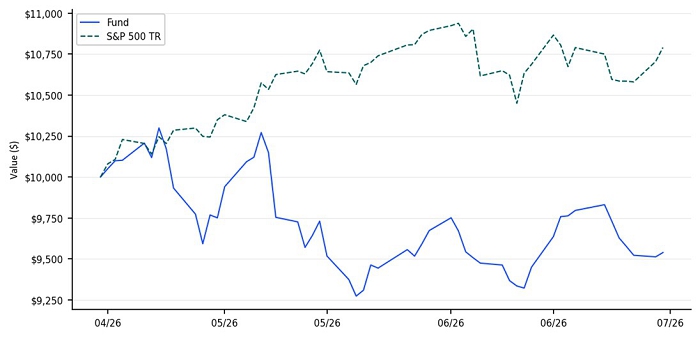
The $10,000 chart reflects a hypothetical $10,000 investment in the Fund. The chart uses total return NAV performance and assumes reinvestment of dividends and capital gains. The NAV performance includes all fund expenses.
Average Annual Total Returns
As of June 30, 2026
| Since
Inception (4/13/2026) | |
| GraniteShares YieldBOOST CRWV ETF - NAV | -3.34% |
| S&P 500® Total Return Index | 9.18% |
Fund Statistics
| Net Assets | $602,173 |
| Total Number of Holdings | 2 |
| Portfolio Turnover Rate | 0% |
| Inception Date | 4/13/2026 |
What does the Fund invest in?
The Fund sells put options contracts, either directly or through swap contracts, on the leveraged CRWV ETF and for which it will receive a premium. The put options contracts sold by the Fund may vary in regard to their strike prices and their maturity.
The Fund may also invest in (1) U.S. Government securities, such as bills, notes and bonds issued by the U.S. Treasury; (2) money market funds; (3) short term bond ETFs and/or (4) corporate debt securities, such as commercial paper and other short-term unsecured promissory notes issued by businesses that are rated investment grade or of comparable quality as collateral for the Fund’s swap agreements
Top 10 Holdings
As of June 30, 2026
| Holding | % of Total Investments |
| United States Treasury Bill | 93.08% |
| Put CWVX July 21.92 07/06/2026 | 3.76% |
Sector Breakdown
| Sector | % of Total Investments |
| Government | 93.08% |
| Purchased Options | 3.76% |
| Broker Cash | 3.16% |
Material Fund Changes
There were no material fund changes during the period
If you wish to view additional information about the Fund, including but not limited to the financial statements and holdings, please visit www.graniteshares.com
Phone: (844) 476 8747 – email: info@graniteshares.com
What were the fund’s costs for the last 12 months?
(based on hypothetical $10,000 investment)
| Expense Ratio (Actual) | 1.15% |
| Cost of a $10,000 Investment | $26.23 |
Hypothetical example: The cost shown is the amount you would pay on a $10,000 investment, assuming a return of 14.73% and an expense ratio of 1.15%.
How did the fund perform since inception?
During the period of April 13, 2026 to June 30, 2026, the Fund had a 17.32% return.
Over the same period the Benchmark had a return of 9.18%.
How did the fund perform since inception.
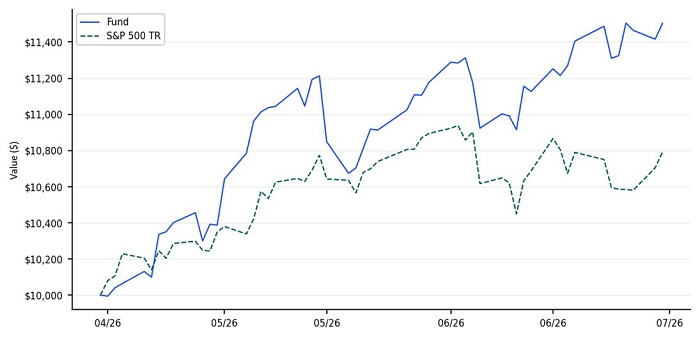
The $10,000 chart reflects a hypothetical $10,000 investment in the Fund. The chart uses total return NAV performance and assumes reinvestment of dividends and capital gains. The NAV performance includes all fund expenses.
Average Annual Total Returns
As of June 30, 2026
| Since
Inception (4/13/2026) | |
| GraniteShares YieldBOOST MU ETF - NAV | 17.32% |
| S&P 500® Total Return Index | 9.18% |
Fund Statistics
| Net Assets | $17,594,585 |
| Total Number of Holdings | 7 |
| Portfolio Turnover Rate | 0% |
| Inception Date | 4/13/2026 |
What does the Fund invest in?
The Fund sells put options contracts, either directly or through swap contracts, on the leveraged MU ETF and for which it will receive a premium. The put options contracts sold by the Fund may vary in regard to their strike prices and their maturity.
The Fund may also invest in (1) U.S. Government securities, such as bills, notes and bonds issued by the U.S. Treasury; (2) money market funds; (3) short term bond ETFs and/or (4) corporate debt securities, such as commercial paper and other short-term unsecured promissory notes issued by businesses that are rated investment grade or of comparable quality as collateral for the Fund’s swap agreements
Top 10 Holdings
As of June 30, 2026
| Holding | % of Total Investments |
| United States Treasury Bill | 82.18% |
| Put MULL July 32.71 07/06/2026 | 3.35% |
| Put MULL July 37.1012 07/01/2026 | 0.60% |
| Put MULL July 31.73 07/02/2026 | 0.53% |
| Put MULL July 33.14 07/06/2026 | 0.52% |
| Put MULL July 28.0844 07/01/2026 | 0.02% |
Sector Breakdown
| Sector | % of Total Investments |
| Government | 82.18% |
| Broker Cash | 12.80% |
| Purchased Options | 5.02% |
Material Fund Changes
There were no material fund changes during the period
If you wish to view additional information about the Fund, including but not limited to the financial statements and holdings, please visit www.graniteshares.com
Phone: (844) 476 8747 – email: info@graniteshares.com
What were the fund’s costs for the last 12 months?
(based on hypothetical $10,000 investment)
| Expense Ratio (Actual) | 1.15% |
| Cost of a $10,000 Investment | $26.43 |
Hypothetical example: The cost shown is the amount you would pay on a $10,000 investment, assuming a return of 16.10% and an expense ratio of 1.15%.
How did the fund perform since inception?
During the period of April 13, 2026 to June 30, 2026, the Fund had a 17.03% return.
Over the same period the Benchmark had a return of 9.18%.
How did the fund perform since inception.
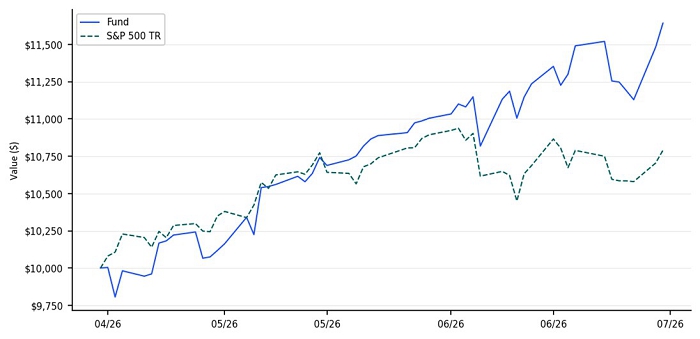
The $10,000 chart reflects a hypothetical $10,000 investment in the Fund. The chart uses total return NAV performance and assumes reinvestment of dividends and capital gains. The NAV performance includes all fund expenses.
Average Annual Total Returns
As of June 30, 2026
| Since
Inception (4/13/2026) | |
| GraniteShares YieldBOOST TSM ETF - NAV | 17.03% |
| S&P 500® Total Return Index | 9.18% |
Fund Statistics
| Net Assets | $1,000,367 |
| Total Number of Holdings | 2 |
| Portfolio Turnover Rate | 0% |
| Inception Date | 4/13/2026 |
What does the Fund invest in?
The Fund sells put options contracts, either directly or through swap contracts, on the leveraged TSM ETF and for which it will receive a premium. The put options contracts sold by the Fund may vary in regard to their strike prices and their maturity.
The Fund may also invest in (1) U.S. Government securities, such as bills, notes and bonds issued by the U.S. Treasury; (2) money market funds; (3) short term bond ETFs and/or (4) corporate debt securities, such as commercial paper and other short-term unsecured promissory notes issued by businesses that are rated investment grade or of comparable quality as collateral for the Fund’s swap agreements
Top 10 Holdings
As of June 30, 2026
| Holding | % of Total Investments |
| United States Treasury Bill | 71.06% |
| Put TSMU July 75.48 07/06/2026 | 1.13% |
Sector Breakdown
| Sector | % of Total Investments |
| Government | 71.06% |
| Broker Cash | 27.81% |
| Purchased Options | 1.13% |
Material Fund Changes
There were no material fund changes during the period
If you wish to view additional information about the Fund, including but not limited to the financial statements and holdings, please visit www.graniteshares.com
Phone: (844) 476 8747 – email: info@graniteshares.com
What were the fund’s costs for the last 12 months?
(based on hypothetical $10,000 investment)
| Expense Ratio (Actual) | 1.15% |
| Cost of a $10,000 Investment | $19.32 |
Hypothetical example: The cost shown is the amount you would pay on a $10,000 investment, assuming a return of -7.52% and an expense ratio of 1.15%.
How did the fund perform since inception?
During the period of April 27, 2026 to June 30, 2026, the Fund had a -7.69% return.
Over the same period the Benchmark had a return of 4.78%.
How did the fund perform since inception.
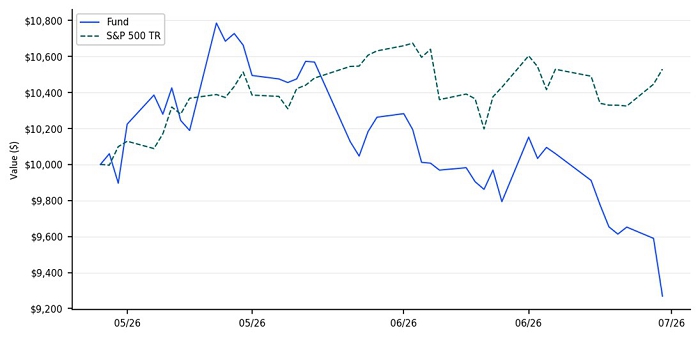
The $10,000 chart reflects a hypothetical $10,000 investment in the Fund. The chart uses total return NAV performance and assumes reinvestment of dividends and capital gains. The NAV performance includes all fund expenses.
Average Annual Total Returns
As of June 30, 2026
| Since
Inception (4/27/2026) | |
| GraniteShares YieldBOOST CRCL ETF - NAV | -7.69% |
| S&P 500® Total Return Index | 4.78% |
Fund Statistics
| Net Assets | $977,559 |
| Total Number of Holdings | 2 |
| Portfolio Turnover Rate | 0% |
| Inception Date | 4/27/2026 |
What does the Fund invest in?
The Fund sells put options contracts, either directly or through swap contracts, on the leveraged CRCL ETF and for which it will receive a premium. The put options contracts sold by the Fund may vary in regard to their strike prices and their maturity.
The Fund may also invest in (1) U.S. Government securities, such as bills, notes and bonds issued by the U.S. Treasury; (2) money market funds; (3) short term bond ETFs and/or (4) corporate debt securities, such as commercial paper and other short-term unsecured promissory notes issued by businesses that are rated investment grade or of comparable quality as collateral for the Fund’s swap agreements
Top 10 Holdings
As of June 30, 2026
| Holding | % of Total Investments |
| United States Treasury Bill | 58.70% |
| Put CRCA July 17.72 07/06/2026 | 41.30% |
Sector Breakdown
| Sector | % of Total Investments |
| Government | 58.70% |
| Purchased Options | 41.30% |
Material Fund Changes
There were no material fund changes during the period
If you wish to view additional information about the Fund, including but not limited to the financial statements and holdings, please visit www.graniteshares.com
Phone: (844) 476 8747 – email: info@graniteshares.com
What were the fund’s costs for the last 12 months?
(based on hypothetical $10,000 investment)
| Expense Ratio (Actual) | 1.15% |
| Cost of a $10,000 Investment | $18.79 |
Hypothetical example: The cost shown is the amount you would pay on a $10,000 investment, assuming a return of -12.72% and an expense ratio of 1.15%.
How did the fund perform since inception?
During the period of April 27, 2026 to June 30, 2026, the Fund had a -12.72% return.
Over the same period the Benchmark had a return of 4.78%.
How did the fund perform since inception.
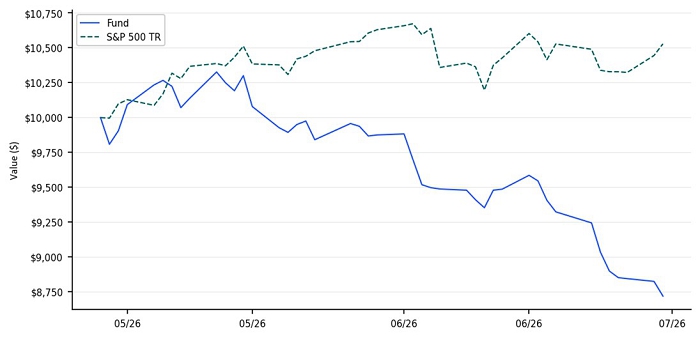
The $10,000 chart reflects a hypothetical $10,000 investment in the Fund. The chart uses total return NAV performance and assumes reinvestment of dividends and capital gains. The NAV performance includes all fund expenses.
Average Annual Total Returns
As of June 30, 2026
| Since
Inception (4/27/2026) | |
| GraniteShares YieldBOOST Ether ETF - NAV | -12.72% |
| S&P 500® Total Return Index | 4.78% |
Fund Statistics
| Net Assets | $593,234 |
| Total Number of Holdings | 2 |
| Portfolio Turnover Rate | 0% |
| Inception Date | 4/27/2026 |
What does the Fund invest in?
The Fund sells put options contracts, either directly or through swap contracts, on the leveraged Ether ETF and for which it will receive a premium. The put options contracts sold by the Fund may vary in regard to their strike prices and their maturity.
The Fund may also invest in (1) U.S. Government securities, such as bills, notes and bonds issued by the U.S. Treasury; (2) money market funds; (3) short term bond ETFs and/or (4) corporate debt securities, such as commercial paper and other short-term unsecured promissory notes issued by businesses that are rated investment grade or of comparable quality as collateral for the Fund’s swap agreements
Top 10 Holdings
As of June 30, 2026
| Holding | % of Total Investments |
| United States Treasury Bill | 94.37% |
| Put ETHU July 10.87 07/06/2026 | 5.63% |
Sector Breakdown
| Sector | % of Total Investments |
| Government | 94.37% |
| Purchased Options | 5.63% |
Material Fund Changes
There were no material fund changes during the period
If you wish to view additional information about the Fund, including but not limited to the financial statements and holdings, please visit www.graniteshares.com
Phone: (844) 476 8747 – email: infor@graniteshares.com
What were the fund’s costs for the last 12 months?
(based on hypothetical $10,000 investment)
| Expense Ratio (Actual) | 1.18% |
| Cost of a $10,000 Investment | $18.50 |
Hypothetical example: The cost shown is the amount you would pay on a $10,000 investment, assuming a return of 1.29% and an expense ratio of 1.18%.
How did the fund perform since inception?
During the period of May 04, 2026 to June 30, 2026, the Fund had a 1.35% return.
Over the same period the Benchmark had a return of 4.37%.
How did the fund perform since inception.
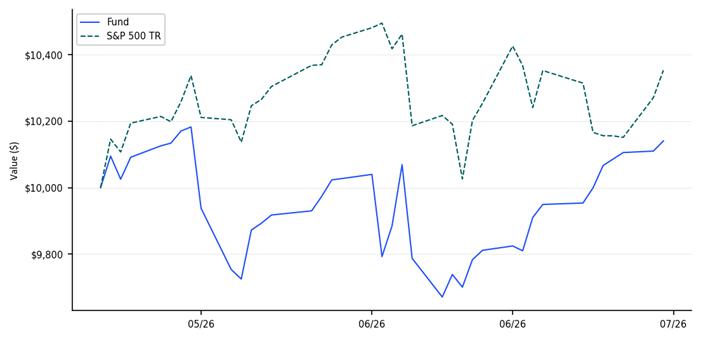
The $10,000 chart reflects a hypothetical $10,000 investment in the Fund. The chart uses total return NAV performance and assumes reinvestment of dividends and capital gains. The NAV performance includes all fund expenses.
Average Annual Total Returns
As of June 30, 2026
| Since
Inception (5/4/2026) | |
| GraniteShares YieldBOOST Biotech ETF - NAV | 1.35% |
| GraniteShares YieldBOOST Biotech ETF - Market | 1.53% |
| S&P 500® Total Return Index | 4.37% |
Fund Statistics
| Net Assets | $693,232 |
| Total Number of Holdings | — |
| Portfolio Turnover Rate | 0% |
| Inception Date | 5/4/2026 |
What does the Fund invest in?
The Fund sells put options contracts, either directly or through swap contracts, on the S&P Biotechnology Select Industry Index and for which it will receive a premium. The put options contracts sold by the Fund may vary in regard to their strike prices and their maturity.
The Fund may also invest in (1) U.S. Government securities, such as bills, notes and bonds issued by the U.S. Treasury; (2) money market funds; (3) short term bond ETFs and/or (4) corporate debt securities, such as commercial paper and other short-term unsecured promissory notes issued by businesses that are rated investment grade or of comparable quality as collateral for the Fund’s swap agreements
Top 10 Holdings
As of June 30, 2026
| Holding | % of Total Investments |
| United States Treasury Bill | 88.86% |
| Put LABU July 262.51 07/06/2026 | 2.42% |
Sector Breakdown
| Sector | % of Total Investments |
| Government | 88.86% |
| Broker Cash | 8.72% |
| Purchased Options | 2.42% |
Material Fund Changes
There were no material fund changes during the period
If you wish to view additional information about the Fund, including but not limited to the financial statements and holdings, please visit www.graniteshares.com
Phone: (844) 476 8747 – email: infor@graniteshares.com
What were the fund’s costs for the last 12 months?
(based on hypothetical $10,000 investment)
| Expense Ratio (Actual) | 1.14% |
| Cost of a $10,000 Investment | $18.22 |
Hypothetical example: The cost shown is the amount you would pay on a $10,000 investment, assuming a return of 4.96% and an expense ratio of 1.14%.
How did the fund perform since inception?
During the period of May 04, 2026 to June 30, 2026, the Fund had a 4.94% return.
Over the same period the Benchmark had a return of 4.37%.
How did the fund perform since inception.
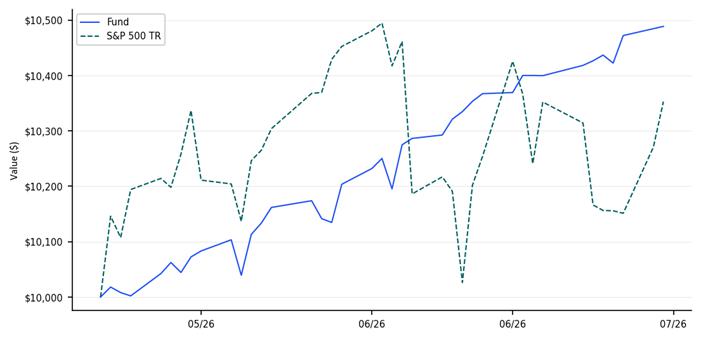
The $10,000 chart reflects a hypothetical $10,000 investment in the Fund. The chart uses total return NAV performance and assumes reinvestment of dividends and capital gains. The NAV performance includes all fund expenses.
Average Annual Total Returns
As of June 30, 2026
| Since
Inception 5/4/2026 | |
| GraniteShares YieldBOOST Financials ETF - NAV | 4.94% |
| GraniteShares YieldBOOST Financials ETF - Market | 5.19% |
| S&P 500® Total Return Index | 4.37% |
Fund Statistics
| Net Assets | $757,001 |
| Total Number of Holdings | — |
| Portfolio Turnover Rate | 0% |
| Inception Date | 5/4/2026 |
What does the Fund invest in?
The Fund sells put options contracts, either directly or through swap contracts, on the Financial Sector Select Sector Index and for which it will receive a premium. The put options contracts sold by the Fund may vary in regard to their strike prices and their maturity.
The Fund may also invest in (1) U.S. Government securities, such as bills, notes and bonds issued by the U.S. Treasury; (2) money market funds; (3) short term bond ETFs and/or (4) corporate debt securities, such as commercial paper and other short-term unsecured promissory notes issued by businesses that are rated investment grade or of comparable quality as collateral for the Fund’s swap agreements
Top 10 Holdings
As of June 30, 2026
| Holding | % of Net Assets |
| United States Treasury Bill | % |
| Put FAS July 133.31 07/06/2026 | % |
Sector Breakdown
| Sector | % of Net Assets |
| Government | % |
| Broker Cash | % |
| Purchased Options | % |
Material Fund Changes
There were no material fund changes during the period
If you wish to view additional information about the Fund, including but not limited to the financial statements and holdings, please visit www.graniteshares.com
Phone: (844) 476 8747 – email: infor@graniteshares.com
What were the fund’s costs for the last 12 months?
(based on hypothetical $10,000 investment)
| Expense Ratio (Actual) | 1.22% |
| Cost of a $10,000 Investment | $18.79 |
Hypothetical example: The cost shown is the amount you would pay on a $10,000 investment, assuming a return of -1.95% and an expense ratio of 1.22%.
How did the fund perform since inception?
During the period of May 04, 2026 to June 30, 2026, the Fund had a -1.33% return.
Over the same period the Benchmark had a return of 4.37%.
How did the fund perform since inception.
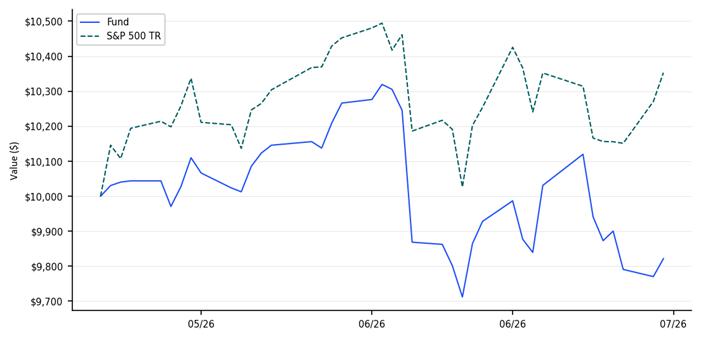
The $10,000 chart reflects a hypothetical $10,000 investment in the Fund. The chart uses total return NAV performance and assumes reinvestment of dividends and capital gains. The NAV performance includes all fund expenses.
Average Annual Total Returns
As of June 30, 2026
| Since
Inception (5/4/2026) | |
| GraniteShares YieldBOOST Technology ETF - NAV | -1.33% |
| GraniteShares YieldBOOST Technology ETF - Market | -1.11% |
| S&P 500® Total Return Index | 4.37% |
Fund Statistics
| Net Assets | $685,111 |
| Total Number of Holdings | — |
| Portfolio Turnover Rate | 0% |
| Inception Date | 5/4/2026 |
What does the Fund invest in?
The Fund sells put options contracts, either directly or through swap contracts, on the Technology Sector Select Sector Index and for which it will receive a premium. The put options contracts sold by the Fund may vary in regard to their strike prices and their maturity.
The Fund may also invest in (1) U.S. Government securities, such as bills, notes and bonds issued by the U.S. Treasury; (2) money market funds; (3) short term bond ETFs and/or (4) corporate debt securities, such as commercial paper and other short-term unsecured promissory notes issued by businesses that are rated investment grade or of comparable quality as collateral for the Fund’s swap agreements
Top 10 Holdings
As of June 30, 2026
| Holding | % of Net Assets |
| United States Treasury Bill | % |
| Put TECL July 192.43 07/06/2026 | % |
Sector Breakdown
| Sector | % of Net Assets |
| Government | % |
| Purchased Options | % |
Material Fund Changes
There were no material fund changes during the period
If you wish to view additional information about the Fund, including but not limited to the financial statements and holdings, please visit www.graniteshares.com
Phone: (844) 476 8747 – email: infor@graniteshares.com
What were the fund’s costs for the last 12 months?
(based on hypothetical $10,000 investment)
| Expense Ratio (Actual) | 1.16% |
| Cost of a $10,000 Investment | $17.87 |
Hypothetical example: The cost shown is the amount you would pay on a $10,000 investment, assuming a return of -1.54% and an expense ratio of 1.16%.
How did the fund perform since inception?
During the period of May 04, 2026 to June 30, 2026, the Fund had a -1.39% return.
Over the same period the Benchmark had a return of 4.37%.
How did the fund perform since inception.
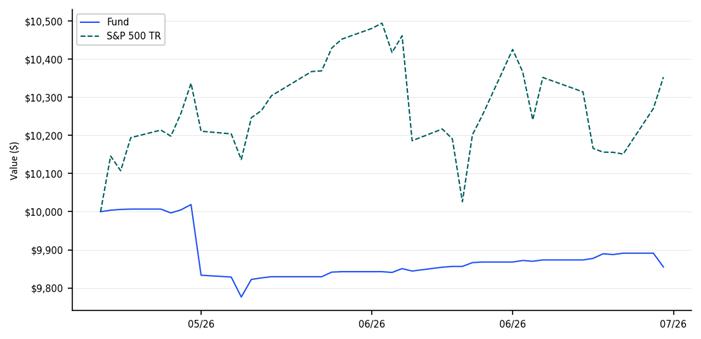
The $10,000 chart reflects a hypothetical $10,000 investment in the Fund. The chart uses total return NAV performance and assumes reinvestment of dividends and capital gains. The NAV performance includes all fund expenses.
Average Annual Total Returns
As of June 30, 2026
| Since
Inception 5/4/2026 | |
| GraniteShares YieldBOOST 20Y+ Treasuries ETF - NAV | -1.39% |
| GraniteShares YieldBOOST 20Y+ Treasuries ETF - Market | -1.19% |
| S&P 500® Total Return Index | 4.37% |
Fund Statistics
| Net Assets | $732,301 |
| Total Number of Holdings | — |
| Portfolio Turnover Rate | 0% |
| Inception Date | 5/4/2026 |
What does the Fund invest in?
The Fund sells put options contracts, either directly or through swap contracts, on the ICE U.S. Treasury 20+ Year Bond Index and for which it will receive a premium. The put options contracts sold by the Fund may vary in regard to their strike prices and their maturity.
The Fund may also invest in (1) U.S. Government securities, such as bills, notes and bonds issued by the U.S. Treasury; (2) money market funds; (3) short term bond ETFs and/or (4) corporate debt securities, such as commercial paper and other short-term unsecured promissory notes issued by businesses that are rated investment grade or of comparable quality as collateral for the Fund’s swap agreements
Top 10 Holdings
As of June 30, 2026
| Holding | % of Net Assets |
| United States Treasury Bill | % |
| Put TMF July 33.08 07/06/2026 | % |
Sector Breakdown
| Sector | % of Net Assets |
| Government | % |
| Broker Cash | % |
| Purchased Options | % |
Material Fund Changes
There were no material fund changes during the period
If you wish to view additional information about the Fund, including but not limited to the financial statements and holdings, please visit www.graniteshares.com
Phone: (844) 476 8747 – email: info@graniteshares.com
What were the fund’s costs for the last 12 months?
(based on hypothetical $10,000 investment)
| Expense Ratio (Actual) | 0.50% |
| Cost of a $10,000 Investment | $23.98 |
Hypothetical example: The cost shown is the amount you would pay on a $10,000 investment, assuming a return of -21.76% and an expense ratio of 0.50%.
How did the fund perform since inception?
During the period of December 15, 2025 to June 30, 2026, the Fund had a -21.22% return.
Over the same period the Benchmark had a return of 10.72%.
How did the fund perform since inception.
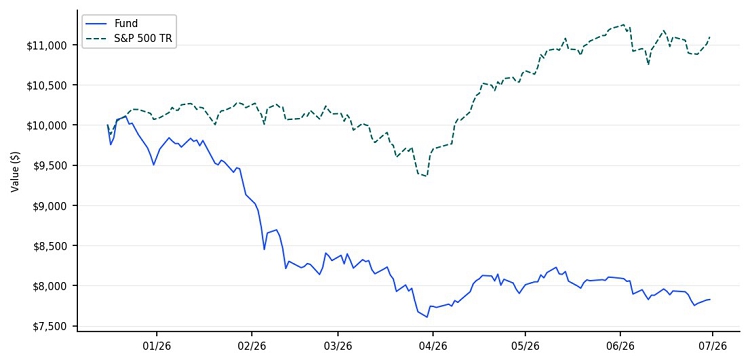
The $10,000 chart reflects a hypothetical $10,000 investment in the Fund. The chart uses total return NAV performance and assumes reinvestment of dividends and capital gains. The NAV performance includes all fund expenses.
Average Annual Total Returns
As of June 30, 2026
| Since
Inception (12/15/2025) | |
| GraniteShares YieldBOOST Single Stock Universe ETF - NAV | -21.22% |
| S&P 500® Total Return Index | 10.72% |
Fund Statistics
| Net Assets | $1,792,419 |
| Total Number of Holdings | 21 |
| Portfolio Turnover Rate | 43% |
| Inception Date | 12/15/2025 |
What does the Fund invest in?
The fund invests in hight-yielding YieldBoost ETFs within the GraniteShares ecosystem
Top 10 Holdings
As of June 30, 2026
| Holding | % of Total Investments |
| GraniteShares YieldBOOST QBTS ETF | % |
| GraniteShares YieldBOOST RGTI ETF | % |
| GraniteShares YieldBOOST TSM ETF | % |
| GraniteShares YieldBOOST RIOT ETF | % |
| GraniteShares YieldBOOST MU ETF | % |
| GraniteShares YieldBOOST MARA ETF | % |
| GraniteShares YieldBOOST COIN ETF | % |
| GraniteShares YieldBOOST MSTR ETF | % |
| GraniteShares YieldBOOST IONQ ETF | % |
| GraniteShares YieldBOOST CRCL ETF | % |
Sector Breakdown
| Sector | % of Total Investments |
| Exchange Traded Funds | 100.00% |
Material Fund Changes
There were no material fund changes during the period
If you wish to view additional information about the Fund, including but not limited to the financial statements and holdings, please visit www.graniteshares.com
Phone: (844) 476 8747 – email: info@graniteshares.com
What were the fund’s costs for the last 12 months?
(based on hypothetical $10,000 investment)
| Expense Ratio (Actual) | 0.50% |
| Cost of a $10,000 Investment | $23.53 |
Hypothetical example: The cost shown is the amount you would pay on a $10,000 investment, assuming a return of -25.21% and an expense ratio of 0.50%.
How did the fund perform since inception?
During the period of December 15, 2025 to June 30, 2026, the Fund had a -24.32% return.
Over the same period the Benchmark had a return of 10.72%.
How did the fund perform since inception.
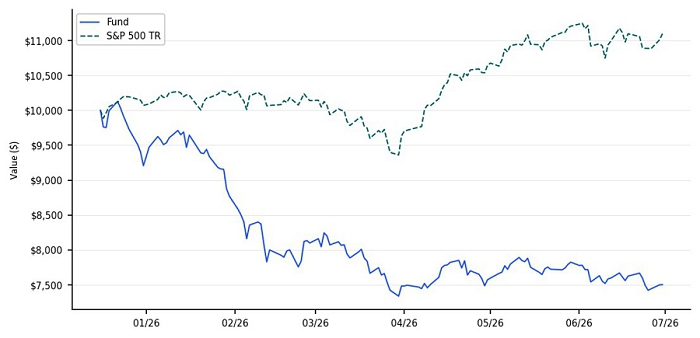
The $10,000 chart reflects a hypothetical $10,000 investment in the Fund. The chart uses total return NAV performance and assumes reinvestment of dividends and capital gains. The NAV performance includes all fund expenses.
Average Annual Total Returns
As of June 30, 2026
| Since
Inception (12/15/2025) | |
| GraniteShares YieldBOOST TopYielders ETF - NAV | -24.32% |
| S&P 500® Total Return Index | 10.72% |
Fund Statistics
| Net Assets | $2,516,167 |
| Total Number of Holdings | 8 |
| Portfolio Turnover Rate | 98% |
| Inception Date | 12/15/2025 |
What does the Fund invest in?
The fund invsets in YieldBoost ETFs selected on factors including implied volatility, upcoming issuer events, and option-market characteristics of the underlying stocks
Top 10 Holdings
As of June 30, 2026
| Holding | % of Total Investments |
| GraniteShares YieldBOOST QBTS ETF | % |
| GraniteShares YieldBOOST RGTI ETF | % |
| GraniteShares YieldBOOST RIOT ETF | % |
| GraniteShares YieldBOOST MU ETF | % |
| GraniteShares YieldBOOST COIN ETF | % |
| GraniteShares YieldBOOST IONQ ETF | % |
| GraniteShares YieldBOOST HOOD ETF | % |
| GraniteShares YieldBOOST SMCI ETF | % |
Sector Breakdown
| Sector | % of Total Investments |
| Exchange Traded Funds | 100.00% |
Material Fund Changes
There were no material fund changes during the period
If you wish to view additional information about the Fund, including but not limited to the financial statements and holdings, please visit www.graniteshares.com
Phone: (844) 476 8747 – email: info@graniteshares.com
What were the fund’s costs for the last 12 months?
(based on hypothetical $10,000 investment)
| Expense Ratio (Actual) | 1.15% |
| Cost of a $10,000 Investment | $48.15 |
Hypothetical example: The cost shown is the amount you would pay on a $10,000 investment, assuming a return of 7.21% and an expense ratio of 1.15%.
How did the fund perform since inception?
During the period of February 02, 2026 to June 30, 2026, the Fund had a 6.30% return.
Over the same period the Benchmark had a return of 8.05%.
How did the fund perform since inception.
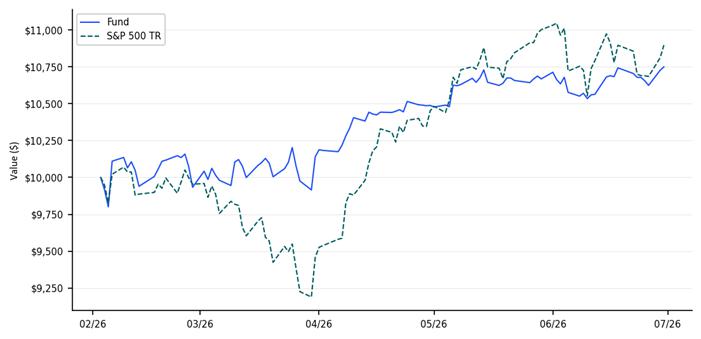
The $10,000 chart reflects a hypothetical $10,000 investment in the Fund. The chart uses total return NAV performance and assumes reinvestment of dividends and capital gains. The NAV performance includes all fund expenses.
Average Annual Total Returns
As of June 30, 2026
| Since
Inception (2/2/2026) | |
| GraniteShares Autocallable NVDA ETF - NAV | 6.30% |
| S&P 500® Total Return Index | 8.05% |
Fund Statistics
| Net Assets | $2,513,459 |
| Total Number of Holdings | 5 |
| Portfolio Turnover Rate | 0% |
| Inception Date | 2/2/2026 |
Top 10 Holdings
As of June 30, 2026
| Holding | % of Total Investments |
| Autocallable NVDA TRS 70% Knock-In | 15.45% |
| Autocallable NVDA TRS 65% Knock-In | 15.42% |
| Autocallable NVDA TRS 60% Knock-In | 15.40% |
| Autocallable NVDA TRS 55% Knock-In | 15.39% |
| Autocallable NVDA TRS 50% Knock-In | 15.38% |
Sector Breakdown
| Sector | % of Total Investments |
| Total Return Swap | 77.04% |
| Broker Cash | 22.96% |
Material Fund Changes
There were no material fund changes during the period
If you wish to view additional information about the Fund, including but not limited to the financial statements and holdings, please visit www.graniteshares.com
Phone: (844) 476 8747 – email: info@graniteshares.com
What were the fund’s costs for the last 12 months?
(based on hypothetical $10,000 investment)
| Expense Ratio (Actual) | 1.15% |
| Cost of a $10,000 Investment | $48.05 |
Hypothetical example: The cost shown is the amount you would pay on a $10,000 investment, assuming a return of 6.77% and an expense ratio of 1.15%.
How did the fund perform since inception?
During the period of February 02, 2026 to June 30, 2026, the Fund had a 6.60% return.
Over the same period the Benchmark had a return of 8.05%.
How did the fund perform since inception.
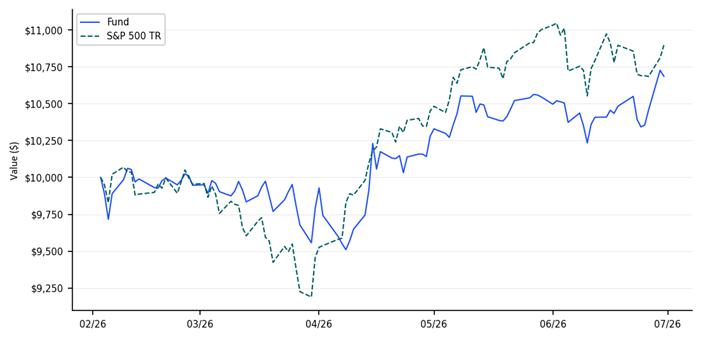
The $10,000 chart reflects a hypothetical $10,000 investment in the Fund. The chart uses total return NAV performance and assumes reinvestment of dividends and capital gains. The NAV performance includes all fund expenses.
Average Annual Total Returns
As of June 30, 2026
| Since
Inception (2/2/2026) | |
| GraniteShares Autocallable TSLA ETF - NAV | 6.60% |
| S&P 500® Total Return Index | 8.05% |
Fund Statistics
| Net Assets | $2,248,565 |
| Total Number of Holdings | 5 |
| Portfolio Turnover Rate | 0% |
| Inception Date | 2/2/2026 |
Top 10 Holdings
As of June 30, 2026
| Holding | % of Total Investments |
| Recv Tsla Auto Trs Nm5 | 15.50% |
| Recv Tsla Auto Trs Nm4 | 15.47% |
| Recv Tsla Auto Trs Nm3 | 15.45% |
| Recv Tsla Auto Trs Nm2 | 15.44% |
| Recv Tsla Auto Trs Nm1 | 15.42% |
Sector Breakdown
| Sector | % of Total Investments |
| Total Return Swap | 77.28% |
| Broker Cash | 22.72% |
Material Fund Changes
There were no material fund changes during the period
If you wish to view additional information about the Fund, including but not limited to the financial statements and holdings, please visit www.graniteshares.com
Phone: (844) 476 8747 – email: info@graniteshares.com
What were the fund’s costs for the last 12 months?
(based on hypothetical $10,000 investment)
| Expense Ratio (Actual) | 1.15% |
| Cost of a $10,000 Investment | $14.49 |
Hypothetical example: The cost shown is the amount you would pay on a $10,000 investment, assuming a return of -15.55% and an expense ratio of 1.15%.
How did the fund perform since inception?
During the period of May 11, 2026, to June 30, 2026, the Fund had a -15.55% return.
Over the same period the Benchmark had a return of 1.36%.
How did the fund perform since inception.
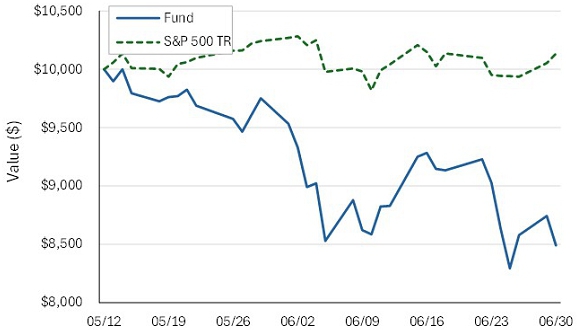
The $10,000 chart reflects a hypothetical $10,000 investment in the Fund. The chart uses total return NAV performance and assumes reinvestment of dividends and capital gains. The NAV performance includes all fund expenses.
Average Annual Total Returns
As of June 30, 2026
| Since
Inception (5/11/2026) | |
| GraniteShares Autocallable COIN ETF – NAV | -15.55% |
| S&P 500® Total Return Index | 1.36% |
Fund Statistics
| Net Assets | $ 816,719 |
| Total Number of Holdings | 6 |
| Portfolio Turnover Rate | 0% |
| Inception Date | 5/11/2026 |
Top 10 Holdings
As of June 30, 2026
| Holding | % of Total Investments |
| Government | 40.35% |
| Autocallable COIN TRS | 32.97% |
Sector Breakdown
| Sector | % of Total Investments |
| Government | 40.35% |
| Total Return Swap | 32.97% |
| Broker Cash | 26.68% |
Material Fund Changes
There were no material fund changes during the period
If you wish to view additional information about the Fund, including but not limited to the financial statements and holdings, please visit www.graniteshares.com
Phone: (844) 476 8747 – email: info@graniteshares.com
What were the fund’s costs for the last 12 months?
(based on hypothetical $10,000 investment)
| Expense Ratio (Actual) | 1.15% |
| Cost of a $10,000 Investment | $13.88 |
Hypothetical example: The cost shown is the amount you would pay on a $10,000 investment, assuming a return of 5.99% and an expense ratio of 1.15%.
How did the fund perform since inception?
During the period of May 18, 2026 to June 30, 2026, the Fund had a 5.58% return.
Over the same period the Benchmark had a return of 1.46%.
How did the fund perform since inception.
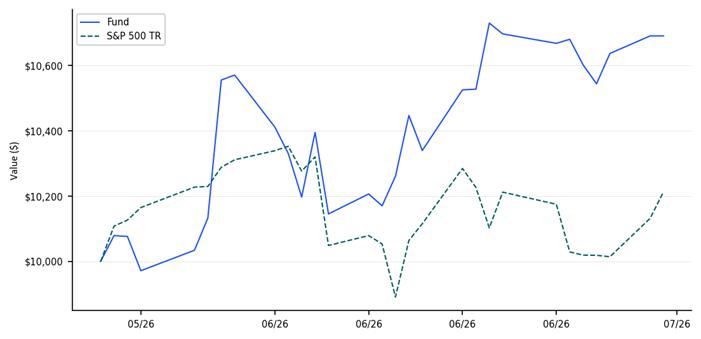
The $10,000 chart reflects a hypothetical $10,000 investment in the Fund. The chart uses total return NAV performance and assumes reinvestment of dividends and capital gains. The NAV performance includes all fund expenses.
Average Annual Total Returns
As of June 30, 2026
| Since
Inception (5/18/2026) | |
| GraniteShares Autocallable HOOD ETF - NAV | 5.58% |
| S&P 500® Total Return Index | 1.46% |
Fund Statistics
| Net Assets | $1,031,469 |
| Total Number of Holdings | 5 |
| Portfolio Turnover Rate | 0% |
| Inception Date | 5/18/2026 |
Top 10 Holdings
As of June 30, 2026
| Holding | % of Total Investments |
| Autocallable HOOD TRS 70% Knock-In | 16.30% |
| Autocallable HOOD TRS 65% Knock-In | 16.28% |
| Autocallable HOOD TRS 60% Knock-In | 16.21% |
| Autocallable HOOD TRS 55% Knock-In | 16.18% |
| Autocallable HOOD TRS 50% Knock-In | 16.12% |
Sector Breakdown
| Sector | % of Total Investments |
| Total Return Swap | 81.09% |
| Broker Cash | 18.91% |
Material Fund Changes
There were no material fund changes during the period
If you wish to view additional information about the Fund, including but not limited to the financial statements and holdings, please visit www.graniteshares.com
Phone: (844) 476 8747 – email: info@graniteshares.com
What were the fund’s costs for the last 12 months?
(based on hypothetical $10,000 investment)
| Expense Ratio (Actual) | 1.15% |
| Cost of a $10,000 Investment | $13.20 |
Hypothetical example: The cost shown is the amount you would pay on a $10,000 investment, assuming a return of -4.14% and an expense ratio of 1.15%.
How did the fund perform since inception?
During the period of May 18, 2026 to June 30, 2026, the Fund had a -3.80% return.
Over the same period the Benchmark had a return of 1.46%.
How did the fund perform since inception.
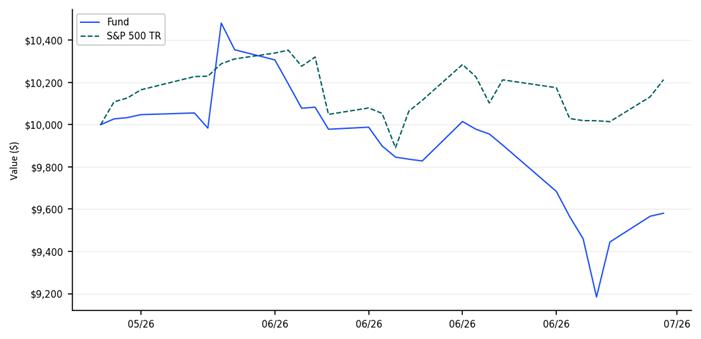
The $10,000 chart reflects a hypothetical $10,000 investment in the Fund. The chart uses total return NAV performance and assumes reinvestment of dividends and capital gains. The NAV performance includes all fund expenses.
Average Annual Total Returns
As of June 30, 2026
| Since
Inception (5/18/2026) | |
| GraniteShares Autocallable PLTR ETF - NAV | -3.80% |
| S&P 500® Total Return Index | 1.46% |
Fund Statistics
| Net Assets | $2,128,865 |
| Total Number of Holdings | 5 |
| Portfolio Turnover Rate | 0% |
| Inception Date | 5/18/2026 |
Top 10 Holdings
As of June 30, 2026
| Holding | % of Total Investments |
| Autocallable PLTR TRS 50% Knock-In | 15.28% |
| Autocallable PLTR TRS 55% Knock-In | 15.18% |
| Autocallable PLTR TRS 60% Knock-In | 15.02% |
| Autocallable PLTR TRS 65% Knock-In | 14.92% |
| Autocallable PLTR TRS 70% Knock-In | 14.78% |
Sector Breakdown
| Sector | % of Total Investments |
| Total Return Swap | 75.18% |
| Broker Cash | 24.82% |
Material Fund Changes
There were no material fund changes during the period
If you wish to view additional information about the Fund, including but not limited to the financial statements and holdings, please visit www.graniteshares.com
Phone: (844) 476 8747 – email: info@graniteshares.com
What were the fund’s costs for the last 12 months?
(based on hypothetical $10,000 investment)
| Expense Ratio (Actual) | 1.15% |
| Cost of a $10,000 Investment | $10.94 |
Hypothetical example: The cost shown is the amount you would pay on a $10,000 investment, assuming a return of -0.53% and an expense ratio of 1.15%.
How did the fund perform since inception?
During the period of May 26, 2026 to June 30, 2026, the Fund had a -0.09% return.
Over the same period the Benchmark had a return of -0.14%.
How did the fund perform since inception.
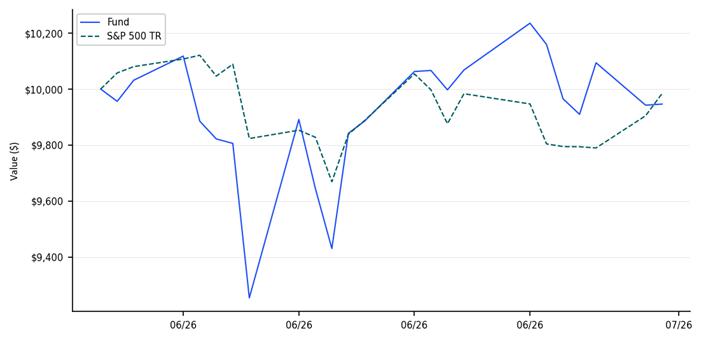
The $10,000 chart reflects a hypothetical $10,000 investment in the Fund. The chart uses total return NAV performance and assumes reinvestment of dividends and capital gains. The NAV performance includes all fund expenses.
Average Annual Total Returns
As of June 30, 2026
| Since
Inception (5/26/2026) | |
| GraniteShares Autocallable MARA ETF - NAV | -0.09% |
| S&P 500® Total Return Index | -0.14% |
Fund Statistics
| Net Assets | $964,326 |
| Total Number of Holdings | 5 |
| Portfolio Turnover Rate | 0% |
| Inception Date | 5/26/2026 |
Top 10 Holdings
As of June 30, 2026
| Holding | % of Total Investments |
| Autocallable MARA TRS | 67.60% |
Sector Breakdown
| Sector | % of Total Investments |
| Total Return Swap | 67.60% |
| Broker Cash | 32.40% |
Material Fund Changes
There were no material fund changes during the period
If you wish to view additional information about the Fund, including but not limited to the financial statements and holdings, please visit www.graniteshares.com
Phone: (844) 476 8747 – email: info@graniteshares.com
What were the fund’s costs for the last 12 months?
(based on hypothetical $10,000 investment)
| Expense Ratio (Actual) | 1.15% |
| Cost of a $10,000 Investment | $10.32 |
Hypothetical example: The cost shown is the amount you would pay on a $10,000 investment, assuming a return of -11.81% and an expense ratio of 1.15%.
How did the fund perform since inception?
During the period of May 26, 2026 to June 30, 2026, the Fund had a -10.81% return.
Over the same period the Benchmark had a return of -0.14%.
How did the fund perform since inception.
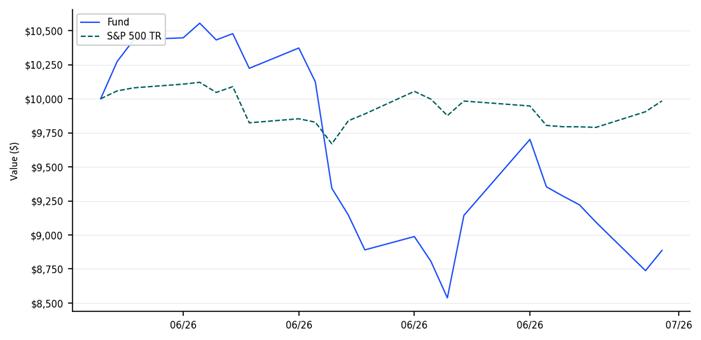
The $10,000 chart reflects a hypothetical $10,000 investment in the Fund. The chart uses total return NAV performance and assumes reinvestment of dividends and capital gains. The NAV performance includes all fund expenses.
Average Annual Total Returns
As of June 30, 2026
| Since
Inception (5/26/2026) | |
| GraniteShares Autocallable SMCI ETF - NAV | -10.81% |
| S&P 500® Total Return Index | -0.14% |
Fund Statistics
| Net Assets | $864,965 |
| Total Number of Holdings | 5 |
| Portfolio Turnover Rate | 0% |
| Inception Date | 5/26/2026 |
Top 10 Holdings
As of June 30, 2026
| Holding | % of Total Investments |
| Autocallable SMCI TRS | 54.79% |
Sector Breakdown
| Sector | % of Total Investments |
| Total Return Swap | 54.79% |
| Broker Cash | 45.21% |
Material Fund Changes
There were no material fund changes during the period
If you wish to view additional information about the Fund, including but not limited to the financial statements and holdings, please visit www.graniteshares.com
Phone: (844) 476 8747 – email: infor@graniteshares.com
What were the fund’s costs for the last 12 months?
(based on hypothetical $10,000 investment)
| Expense Ratio (Actual) | 1.81% |
| Cost of a $10,000 Investment | $18.75 |
Hypothetical example: The cost shown is the amount you would pay on a $10,000 investment, assuming a return of -47.47% and an expense ratio of 1.81%.
How did the fund perform since inception?
During the period of May 11, 2026 to June 30, 2026, the Fund had a -48.06% return.
Over the same period the Benchmark had a return of 1.36%.
How did the fund perform since inception.
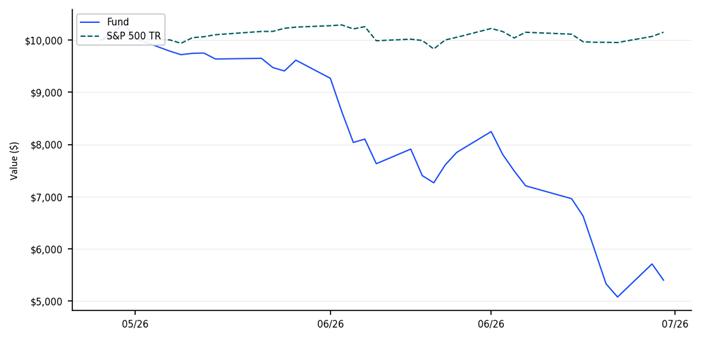
The $10,000 chart reflects a hypothetical $10,000 investment in the Fund. The chart uses total return NAV performance and assumes reinvestment of dividends and capital gains. The NAV performance includes all fund expenses.
Average Annual Total Returns
As of June 30, 2026
| Since
Inception (5/11/2026) | |
| GraniteShares Autocallable MSTR ETF - NAV | -48.06% |
| GraniteShares Autocallable MSTR ETF - Market | -47.77% |
| S&P 500® Total Return Index | 1.36% |
Fund Statistics
| Net Assets | $374,955 |
| Total Number of Holdings | — |
| Portfolio Turnover Rate | 0% |
| Inception Date | 5/11/2026 |
Top 10 Holdings
As of June 30, 2026
| Holding | % of Total Investments |
| United States Treasury Bill | 64.81% |
| Autocallable MSTR TRS | 12.14% |
Sector Breakdown
| Sector | % of Total Investments |
| Government | 64.81% |
| Broker Cash | 23.05% |
| Total Return Swap | 12.14% |
Material Fund Changes
There were no material fund changes during the period