Shareholder Report
Jun. 30, 2026
USD ($)
shares
What were the Fund's costs for the last year?
(based on a hypothetical $10,000 investment)
(Expenses for the full reporting period would be higher.)
(Expenses for the full reporting period would be higher.)
| Class | Costs of a $10,000 Investment | Costs Paid as a Percentage of a $10,000 Investment |
|---|---|---|
| Class A Withholding | $96 | 0.95% |
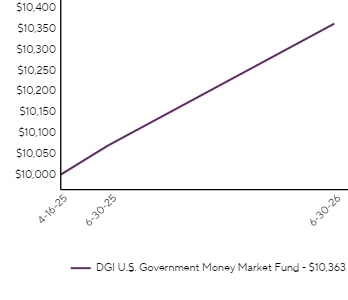
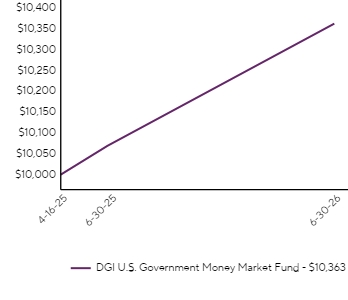
Average Annual Total Returns
| One Year | Since Inception (04/16/2025) | |
|---|---|---|
| DGI U.S. Government Money Market Fund - Class A Withholding | 2.92% | 3.00% |
Fund Statistics
| Net Assets ($) | $16,146,935 |
|---|---|
| Number of Portfolio Holdings | |
| Total Advisory Fees Paid ($) | $0 |
What did the Fund invest in?
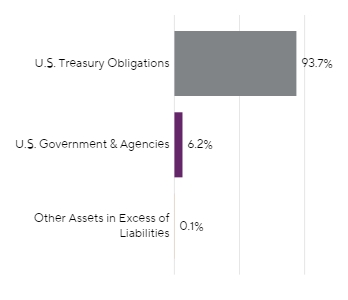
Sector Weighting (% of net assets)
Top Ten Holdings
(% of net assets)
| Holding Name | % of Net Assets |
|---|---|
| United States Treasury Bill | |
| United States Treasury Bill | |
| United States Treasury Bill | |
| Federal Home Loan Bank |
Top Ten Holdings
(% of net assets)
| Holding Name | % of Net Assets |
|---|---|
| United States Treasury Bill | |
| United States Treasury Bill | |
| United States Treasury Bill | |
| Federal Home Loan Bank |
Material Fund Changes
No material changes occurred during the year ended June 30, 2026.
What were the Fund's costs for the last year?
(based on a hypothetical $10,000 investment)
(Expenses for the full reporting period would be higher.)
(Expenses for the full reporting period would be higher.)
| Class | Costs of a $10,000 Investment | Costs Paid as a Percentage of a $10,000 Investment |
|---|---|---|
| Class A Non-Withholding | $96 | 0.95% |
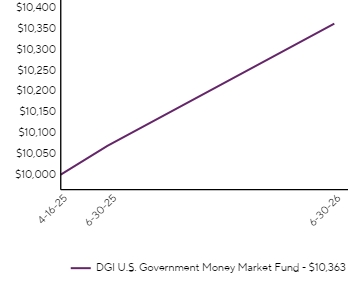
Average Annual Total Returns
| One Year | Since Inception (04/16/2025) | |
|---|---|---|
| DGI U.S. Government Money Market Fund - Class A Non-Withholding | 2.92% | 3.00% |
Fund Statistics
| Net Assets ($) | $16,146,935 |
|---|---|
| Number of Portfolio Holdings | |
| Total Advisory Fees Paid ($) | $0 |
What did the Fund invest in?
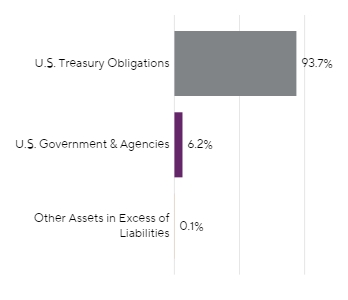
Sector Weighting (% of net assets)
Top Ten Holdings
(% of net assets)
| Holding Name | % of Net Assets |
|---|---|
| United States Treasury Bill | |
| United States Treasury Bill | |
| United States Treasury Bill | |
| Federal Home Loan Bank |
Top Ten Holdings
(% of net assets)
| Holding Name | % of Net Assets |
|---|---|
| United States Treasury Bill | |
| United States Treasury Bill | |
| United States Treasury Bill | |
| Federal Home Loan Bank |
Material Fund Changes
No material changes occurred during the year ended June 30, 2026.
What were the Fund's costs for the last year?
(based on a hypothetical $10,000 investment)
(Expenses for the full reporting period would be higher.)
(Expenses for the full reporting period would be higher.)
| Class | Costs of a $10,000 Investment | Costs Paid as a Percentage of a $10,000 Investment |
|---|---|---|
| Class I Withholding | $96 | 0.95% |
Average Annual Total Returns
| One Year | Since Inception (04/16/2025) | |
|---|---|---|
| DGI U.S. Government Money Market Fund - Class I Withholding | 2.92% | 3.00% |
Fund Statistics
| Net Assets ($) | $16,146,935 |
|---|---|
| Number of Portfolio Holdings | |
| Total Advisory Fees Paid ($) | $0 |
What did the Fund invest in?
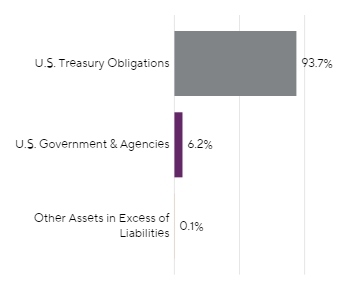
Sector Weighting (% of net assets)
Top Ten Holdings
(% of net assets)
| Holding Name | % of Net Assets |
|---|---|
| United States Treasury Bill | |
| United States Treasury Bill | |
| United States Treasury Bill | |
| Federal Home Loan Bank |
Top Ten Holdings
(% of net assets)
| Holding Name | % of Net Assets |
|---|---|
| United States Treasury Bill | |
| United States Treasury Bill | |
| United States Treasury Bill | |
| Federal Home Loan Bank |
Material Fund Changes
No material changes occurred during the year ended June 30, 2026.
What were the Fund's costs for the last year?
(based on a hypothetical $10,000 investment)
(Expenses for the full reporting period would be higher.)
(Expenses for the full reporting period would be higher.)
| Class | Costs of a $10,000 Investment | Costs Paid as a Percentage of a $10,000 Investment |
|---|---|---|
| Class I Non-Withholding | $96 | 0.95% |
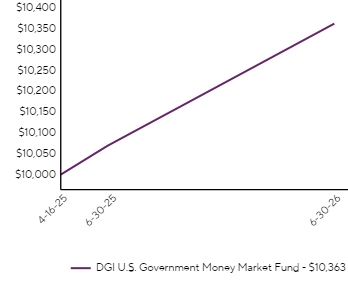
Average Annual Total Returns
| One Year | Since Inception (04/16/2025) | |
|---|---|---|
| DGI U.S. Government Money Market Fund - Class I Non-Withholding | 2.92% | 3.00% |
Fund Statistics
| Net Assets ($) | $16,146,935 |
|---|---|
| Number of Portfolio Holdings | |
| Total Advisory Fees Paid ($) | $0 |
What did the Fund invest in?
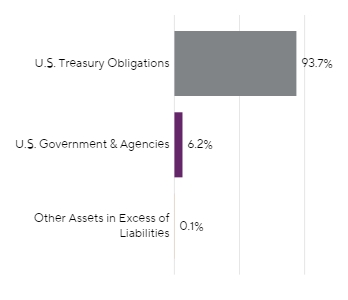
Sector Weighting (% of net assets)
Top Ten Holdings
(% of net assets)
| Holding Name | % of Net Assets |
|---|---|
| United States Treasury Bill | |
| United States Treasury Bill | |
| United States Treasury Bill | |
| Federal Home Loan Bank |
Top Ten Holdings
(% of net assets)
| Holding Name | % of Net Assets |
|---|---|
| United States Treasury Bill | |
| United States Treasury Bill | |
| United States Treasury Bill | |
| Federal Home Loan Bank |
Material Fund Changes
No material changes occurred during the year ended June 30, 2026.