Pay vs Performance Disclosure - USD ($)
May 31, 2026
May 31, 2025
May 31, 2024
May 31, 2023
May 31, 2022
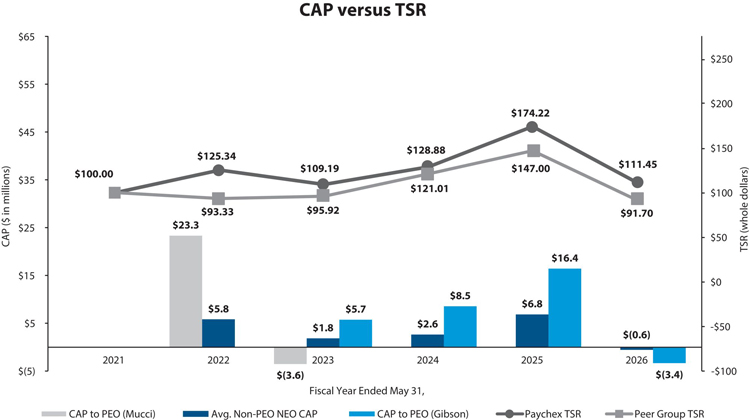
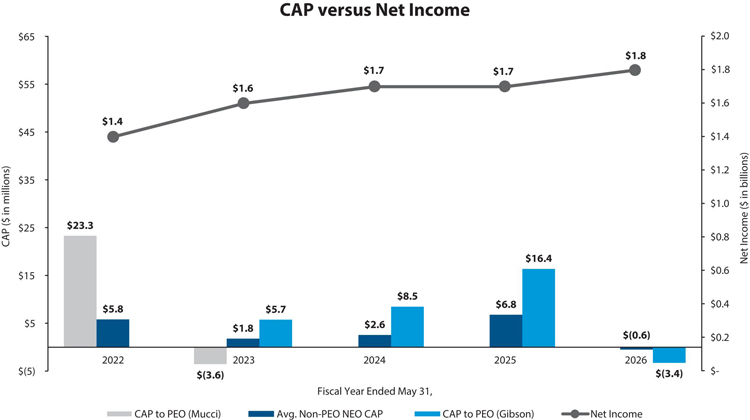
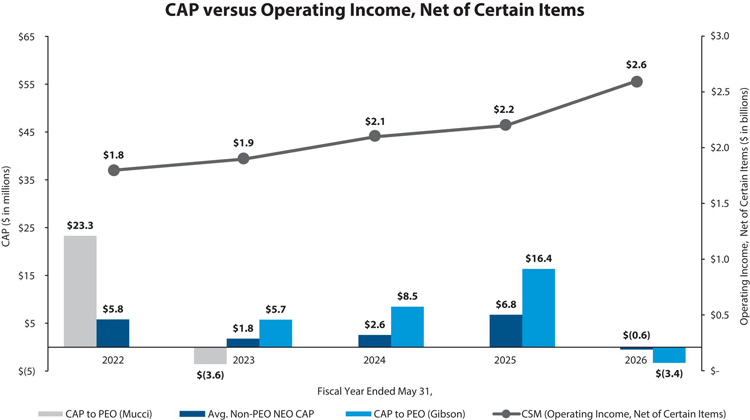
Pay Versus Performance
In accordance with rules adopted by the SEC, we provide the following disclosure regarding executive compensation for our principal executive officers (“PEO”) and
Non-PEO
NEOs and Company performance for the fiscal years listed below. Fiscal Year (a) |
|
Average Summary Compensation Table Total for Non-PEO NEOs (2) (d) |
Average Compensation Actually Paid to Non-PEO NEOs (2)(3) (e) |
Value of Initial Fixed $100 Investment Based On: |
Net Income (in millions) (h) |
Operating Income, Net of Certain Items (5) (in millions) (i) | |||||||||||||||||||||||||||||||||||||||||||||||||
Summary Compensation Table Total for PEO |
Compensation Actually Paid to PEO |
Total Shareholder Return (f) |
Peer Group Total Shareholder Return (4) (g) | ||||||||||||||||||||||||||||||||||||||||||||||||||||
Gibson (1) (b) |
Mucci (1) (b) |
Gibson (1)(3) (c) |
Mucci (1)(3) (c) | ||||||||||||||||||||||||||||||||||||||||||||||||||||
2026 |
$ |
10,274,543 |
$ |
— |
$ |
(3,354,147 |
) |
$ |
— |
$ |
2,857,061 |
$ |
(631,232 |
) |
$ |
111.45 |
$ |
91.70 |
$ |
1,760 |
$ |
2,604 |
|||||||||||||||||||||||||||||||||
2025 |
$ |
8,807,411 |
$ |
— |
$ |
16,426,552 |
$ |
— |
$ |
2,893,402 |
$ |
6,848,997 |
$ |
174.22 |
$ |
147.00 |
$ |
1,657 |
$ |
2,189 |
|||||||||||||||||||||||||||||||||||
2024 |
$ |
7,534,855 |
$ |
— |
$ |
8,462,562 |
$ |
— |
$ |
2,498,637 |
$ |
2,602,402 |
$ |
128.88 |
$ |
121.01 |
$ |
1,690 |
$ |
2,054 |
|||||||||||||||||||||||||||||||||||
2023 |
$ |
6,680,180 |
$ |
14,442,172 |
$ |
5,660,044 |
$ |
(3,614,572 |
) |
$ |
2,691,157 |
$ |
1,782,985 |
$ |
109.19 |
$ |
95.92 |
$ |
1,557 |
$ |
1,933 |
||||||||||||||||||||||||||||||||||
2022 |
$ |
— |
$ |
11,025,026 |
$ |
— |
$ |
23,305,787 |
$ |
3,257,026 |
$ |
5,846,642 |
$ |
125.34 |
$ |
93.33 |
$ |
1,393 |
$ |
1,782 |
|||||||||||||||||||||||||||||||||||
| (1) | John B. Gibson has served as PEO since fiscal 2023 following October 13, 2022. Martin Mucci served as PEO during fiscal 2023 through October 13, 2022, and in fiscal 2022. The amounts deducted and added in calculating Compensation Actually Paid (“CAP”) for Mr. Gibson for fiscal 2026 are as follows: |
| |
2026 | ||||
Summary Compensation Table Total |
$ |
10,274,543 |
|||
Deduction of stock awards and option awards reported in the Summary Compensation Table |
(8,453,498 | ) | |||
Fiscal year-end value of equity awards granted during the fiscal year that remained unvested as of the last day of the fiscal year |
4,184,473 | ||||
Change in fair value from the last day of the prior fiscal year to the last day of the fiscal year of unvested equity awards that were granted in a prior year |
(8,073,194 | ) | |||
Change in fair value from the last day of the prior fiscal year to the vesting date during the fiscal year of awards granted in a prior year that vested during the most recent fiscal year |
(1,461,295 | ) | |||
Value of dividends or other earnings paid on equity awards not otherwise included |
174,824 | ||||
Compensation Actually Paid |
$ |
(3,354,147 |
) | ||
| (2) | The individuals comprising the Non-PEO NEOs for each year are as follows: |
2022 |
2023 |
2024 |
2025 |
2026 | ||||
Efrain Rivera |
Efrain Rivera | Robert L. Schrader | Robert L. Schrader | Robert L. Schrader | ||||
John B. Gibson |
Mark A. Bottini | Efrain Rivera | Adam Ante | Adam Ante | ||||
Mark A. Bottini |
Michael E. Gioja | Mark A. Bottini | Mark A. Bottini | Ryan Bergstrom | ||||
Michael E. Gioja |
Stephanie L. Schaeffer | Michael E. Gioja | Michael E. Gioja | Chad Parodi | ||||
| |
|
Elizabeth Roaldsen | |
| ||||
The amounts deducted and added in calculating the average CAP for these NEOs for fiscal 2026 are as follows:
| |
2026 | ||||
Summary Compensation Table Total |
$ |
2,857,061 |
|||
Deduction of stock awards and option awards reported in the Summary Compensation Table |
(2,013,906 | ) | |||
Fiscal year-end value of equity awards granted during the fiscal year that remained unvested as of the last day of the fiscal year |
996,878 | ||||
Change in fair value from the last day of the prior fiscal year to the last day of the fiscal year of unvested equity awards that were granted in a prior year |
(1,817,669 | ) | |||
Change in fair value from the last day of the prior fiscal year to the vesting date during the fiscal year of awards granted in a prior year that vested during the most recent fiscal year |
(761,136 | ) | |||
Value of dividends or other earnings paid on equity awards not otherwise included |
107,540 | ||||
Compensation Actually Paid |
$ |
(631,232 |
) | ||
| (3) | The amounts shown for CAP have been calculated in accordance with Item 402(v) of Regulation S-K and do not reflect the actual compensation realized or received by our NEOs. |
| (4) | The Peer Group TSR set forth in this table utilizes the Company’s peer group used for executive compensation market comparative purposes which was also utilized in the stock performance graph required by Item 201(e) of Regulation S-K included in our Form 10-K. |
| (5) | Operating income, net of certain items is a non-GAAP measure. Refer to “Paychex, Inc. Non-GAAP Financial Measures” in Appendix A of this proxy statement for a discussion of this non-GAAP measure and a reconciliation to the most comparable GAAP measure of operating income. |
| (2) | The individuals comprising the Non-PEO NEOs for each year are as follows: |
2022 |
2023 |
2024 |
2025 |
2026 | ||||
Efrain Rivera |
Efrain Rivera | Robert L. Schrader | Robert L. Schrader | Robert L. Schrader | ||||
John B. Gibson |
Mark A. Bottini | Efrain Rivera | Adam Ante | Adam Ante | ||||
Mark A. Bottini |
Michael E. Gioja | Mark A. Bottini | Mark A. Bottini | Ryan Bergstrom | ||||
Michael E. Gioja |
Stephanie L. Schaeffer | Michael E. Gioja | Michael E. Gioja | Chad Parodi | ||||
| |
|
Elizabeth Roaldsen | |
| ||||
| (4) | The Peer Group TSR set forth in this table utilizes the Company’s peer group used for executive compensation market comparative purposes which was also utilized in the stock performance graph required by Item 201(e) of Regulation S-K included in our Form 10-K. |
| (1) | John B. Gibson has served as PEO since fiscal 2023 following October 13, 2022. Martin Mucci served as PEO during fiscal 2023 through October 13, 2022, and in fiscal 2022. The amounts deducted and added in calculating Compensation Actually Paid (“CAP”) for Mr. Gibson for fiscal 2026 are as follows: |
| |
2026 | ||||
Summary Compensation Table Total |
$ |
10,274,543 |
|||
Deduction of stock awards and option awards reported in the Summary Compensation Table |
(8,453,498 | ) | |||
Fiscal year-end value of equity awards granted during the fiscal year that remained unvested as of the last day of the fiscal year |
4,184,473 | ||||
Change in fair value from the last day of the prior fiscal year to the last day of the fiscal year of unvested equity awards that were granted in a prior year |
(8,073,194 | ) | |||
Change in fair value from the last day of the prior fiscal year to the vesting date during the fiscal year of awards granted in a prior year that vested during the most recent fiscal year |
(1,461,295 | ) | |||
Value of dividends or other earnings paid on equity awards not otherwise included |
174,824 | ||||
Compensation Actually Paid |
$ |
(3,354,147 |
) | ||
The amounts deducted and added in calculating the average CAP for these NEOs for fiscal 2026 are as follows:
| |
2026 | ||||
Summary Compensation Table Total |
$ |
2,857,061 |
|||
Deduction of stock awards and option awards reported in the Summary Compensation Table |
(2,013,906 | ) | |||
Fiscal year-end value of equity awards granted during the fiscal year that remained unvested as of the last day of the fiscal year |
996,878 | ||||
Change in fair value from the last day of the prior fiscal year to the last day of the fiscal year of unvested equity awards that were granted in a prior year |
(1,817,669 | ) | |||
Change in fair value from the last day of the prior fiscal year to the vesting date during the fiscal year of awards granted in a prior year that vested during the most recent fiscal year |
(761,136 | ) | |||
Value of dividends or other earnings paid on equity awards not otherwise included |
107,540 | ||||
Compensation Actually Paid |
$ |
(631,232 |
) | ||
Tabular List
The following list presents the financial performance measures that the Company considers to have been the most important in linking CAP to our PEOs and
Non-PEO
NEOs for fiscal 2026 to Company performance. The measures listed below are not ranked. | • | Annualized new business revenue (1) |
| • | Operating income, net of certain items (2) |
| • | Relative total shareholder return (3) |
| • | Service revenue |
non-GAAP
measure. Refer to “Paychex, Inc. Non-GAAP
Financial Measures” in Appendix A of this proxy statement for a discussion of this non-GAAP
measure and a reconciliation to the most comparable GAAP measure of operating income.