Shareholder Report
Jun. 30, 2026
USD ($)
Holding
Fund Expenses
(Based on a hypothetical $10,000 investment)
| Fund (Class) | Costs of a $10,000 investment | Costs paid as a percentage of a $10,000 investment |
| Abraham Fortress Fund (Class K/FORKX) |
$74 | 0.65% |
Management's Discussion of Fund Performance
SUMMARY OF RESULTS
For the twelve-month period ending 06/30/2026, the Abraham Fortress Fund had positive performance of 26.96% in FORKX, outpacing the 17.55% return of our 70/30[1] benchmark. Fund assets ended the fiscal year at approximately $101.0 million, compared to approximately $75.3 million at the start of the period.
The fiscal year was defined by a broad recovery and sustained rally across global risk assets. Global equity markets climbed through the second half of 2025 and accelerated in early 2026, with the MSCI ACWI returning approximately 23% for the twelve-month period. The Fund participated in the rally while maintaining its diversified posture. The most notable portfolio adjustments during the year concerned our Gold position, which is included in the Diversifying Strategies. The Fund maintained approximately 15% notional Gold exposure through the metal's powerful rally in the first half of the fiscal year, then reduced exposure to approximately 5% in late January 2026 – within days of gold's peak – and fully exited the position by fiscal year-end as the unusual investor preference for gold over US treasuries subsided. Equity exposure ended the fiscal year at approximately 54%, comfortably within our 40-60% target range.
The Fund allocated approximately 62% of its long Equity position to US individual stocks and the remaining 38% to Europe, Australasia, and the Far East (EAFE) futures contracts to give us exposure to non-US equities. Both sleeves contributed strongly. Fixed Income consisted of US Treasury Notes with maturities ranging from 2033 to 2035 and an average duration of approximately 8 years. Diversifying Strategies included eight external funds that generally invest in global futures markets. We continue to access these funds through a total return swap agreement with Deutsche Bank, and the Fund's swap position is collateralized with US Treasury Bills. Unlike the prior fiscal year, the Fund held no Gold exposure at fiscal year-end.
TOP PERFORMANCE CONTRIBUTORS
Contributor #1 – The Fund's long Equity position was the largest contributor for the fiscal year, benefiting from the sustained global equity rally. The S&P 500 rose approximately 21% during this period. The MSCI EAFE index rose approximately 20%.
Contributor #2 – The Fund's Gold position was once again a strong contributor, driven this year as much by risk management as by the metal's price. Gold futures rallied over 60% from the start of the fiscal year to their late-January peak on 01/29/2026, and the Fund maintained meaningful exposure through the rally, holding 14.89% of assets in Gold futures as of 01/27/2026. The portfolio managers then reduced exposure on that date to 5%. Gold futures peaked at $5,354.80 per ounce on 1/29/26. The metal subsequently declined approximately 13% to $4,652.60 by 02/02/2026, so the reduction preserved the majority of the gains the position had generated. The Fund fully exited Gold by fiscal year-end. The Fund currently has no exposure to Gold futures, within the normal range of 0% to 15%.
Contributor #3 – Diversifying Strategies rebounded from the prior fiscal year's losses. The trend following and global macro strategies in our external funds found their footing as markets established sustained directionality. The sleeve contributed approximately +8.83% in the first half of calendar 2026 alone.
TOP PERFORMANCE DETRACTORS
Detractor - The Fund has lower stock exposure compared to our 70/30 benchmark. In a fiscal year when MSCI ACWI returned approximately 23%, our moderate equity allocation naturally reduced the degree to which we captured the rally, and our approximately 8-year duration Treasury exposure and diversifying allocations trailed stocks. This positioning is by design: with our lower equity exposure, we aim to moderate volatility and better manage risk in order to create a smoother return stream. Notably, the Fund still outperformed the 70/30 benchmark by more than 9 percentage points this fiscal year.
Today, the Fund's portfolio includes approximately:
- 54% Stock exposure, which is invested directly into US stocks (approximately 33% of Fund assets) or through EAFE stock index futures (approximately 21% notional) collateralized with T-bills
- 20% Fixed Income exposure, invested in US Treasury Notes maturing between 2033 and 2035, with an approximate 8-year duration
- 21% Diversifying Strategies invested in T-bills to collateralize our positions in either futures or the Deutsche Bank swap that gives us access to the external funds. The notional exposure in the Diversifying Strategies typically ranges between 50-70%. The Fund currently holds no Gold futures position, within the normal allocation range of 0% to 15%.
As a reminder, the Fund's portfolio includes some leverage, which is why the portfolio's total notional exposure is more than 100%. The portfolio's notional exposure is accessed through derivatives instruments, such as futures and swaps. The futures and swaps are collateralized with T-bills. Since T-bills are used to collateralize these other positions, our quarterly holdings report shows the majority of our cash invested in T-bills. It is important to note that the futures, swaps, and T-bills all work together to give the Fund exposure in various stock markets and diversifying strategies.
[1] 70/30 Stock/Bond Portfolio uses 70% MSCI ACWI Index and 30% Bloomberg US Aggregate Bond Index, and its statistics reflect no deductions for fees, expenses, or taxes.
| FORKX Volatility Comparisons – reflects Class K Shares fees | ||||
| Volatility (Standard Deviation) | Fund | 70/30 Portfolio | MSCI ACWI Index | U.S. Aggregate Bond Index |
| 1-Year (07/01/25 - 06/30/2026) | 9.93% | 8.30% | 11.32% | 3.73% |
| Since Inception (07/26/2018 - 06/30/2026) | 8.79% | 12.15% | 16.11% | 5.50% |
Fund Performance
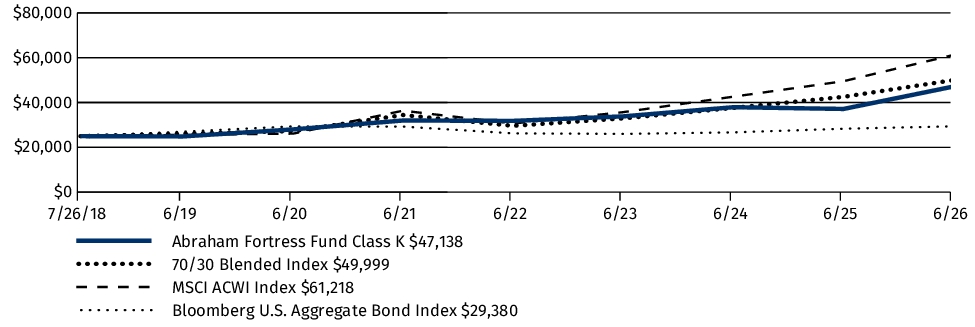
The following graph and chart compare the initial and subsequent account values at the end of each of the most recently completed 10 fiscal years of the Fund, or for the life of the Fund, if shorter. It assumes a $25,000 initial investment at the beginning of the first fiscal year in an appropriate, broad-based securities market index for the same period.
GROWTH OF $25,000
| AVERAGE ANNUAL TOTAL RETURN | 1 Year | 5 Years | Since Inception1 |
| Abraham Fortress Fund (Class K/FORKX) | 26.96% | 8.07% | 8.33% |
| 70/30 Blended Index | 17.55% | 7.75% | 9.14% |
| MSCI ACWI Index | 23.67% | 10.98% | 11.96% |
| Bloomberg U.S. Aggregate Bond Index | 3.79% | 0.08% | 2.06% |
|
1
|
Class K shares commenced operations on July 26, 2018 and the performance figures include the performance of the Predecessor Fund prior to October 13, 2021.
|
The graph and table do not reflect the deduction of taxes that a shareholder would pay on Fund distributions or redemption of Fund shares.
Visit https://www.abrahamtrading.com/fortress-fund/performance for the most recent performance information.
Key Fund Statistics
The following table outlines key fund statistics that you should pay attention to.
| Fund net assets | $100,949,715 |
| Total number of portfolio holdings | 245 |
| Total advisory fees paid (net) | $163,918 |
| Portfolio turnover rate as of the end of the reporting period | 28% |
Graphical Representation of Holdings
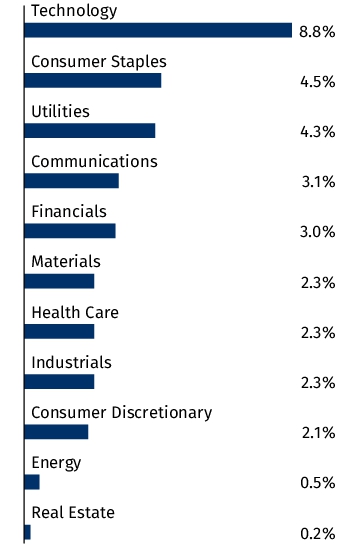
The tables below show the investment makeup of the Fund, representing percentage of the total net assets of the Fund. The Sector Allocation chart represents Common Stocks of the Fund.
Asset Allocation
| U.S. Treasury Bills | 47.5% |
| Common Stocks | 33.4% |
| U.S. Treasury Notes | 20.2% |
| Rights | 0.0% |
| Short-Term Investments | 0.0% |
| Liabilities in Excess of Other Assets | (1.1)% |
Sector Allocation
Material Fund Changes
The Fund did not have any material changes that occurred since the beginning of the reporting period.
Changes in and Disagreements with Accountants
There were no changes in or disagreements with the Fund's accountants during the reporting period.
Fund Expenses
(Based on a hypothetical $10,000 investment)
| Fund (Class) | Costs of a $10,000 investment | Costs paid as a percentage of a $10,000 investment |
| Abraham Fortress Fund (Class I/FORTX) |
$82 | 0.72% |
Management's Discussion of Fund Performance
SUMMARY OF RESULTS
For the twelve-month period ending 06/30/2026, the Abraham Fortress Fund had positive performance of 26.80% in FORTX, outpacing the 17.55% return of our 70/30 [1] benchmark. Fund assets ended the fiscal year at approximately $101.0 million, compared to approximately $75.3 million at the start of the period.
The fiscal year was defined by a broad recovery and sustained rally across global risk assets. Global equity markets climbed through the second half of 2025 and accelerated in early 2026, with the MSCI ACWI returning approximately 23% for the twelve-month period. The Fund participated in the rally while maintaining its diversified posture. The most notable portfolio adjustments during the year concerned our Gold position, which is included in the Diversifying Strategies. The Fund maintained approximately 15% notional Gold exposure through the metal's powerful rally in the first half of the fiscal year, then reduced exposure to approximately 5% in late January 2026 – within days of gold's peak – and fully exited the position by fiscal year-end as the unusual investor preference for gold over US treasuries subsided. Equity exposure ended the fiscal year at approximately 54%, comfortably within our 40-60% target range.
The Fund allocated approximately 62% of its long Equity position to US individual stocks and the remaining 38% to Europe, Australasia, and the Far East (EAFE) futures contracts to give us exposure to non-US equities. Both sleeves contributed strongly. Fixed Income consisted of US Treasury Notes with maturities ranging from 2033 to 2035 and an average duration of approximately 8 years. Diversifying Strategies included eight external funds that generally invest in global futures markets. We continue to access these funds through a total return swap agreement with Deutsche Bank, and the Fund's swap position is collateralized with US Treasury Bills. Unlike the prior fiscal year, the Fund held no Gold exposure at fiscal year-end.
TOP PERFORMANCE CONTRIBUTORS
Contributor #1 – The Fund's long Equity position was the largest contributor for the fiscal year, benefiting from the sustained global equity rally. The S&P 500 rose approximately 21% during this period. The MSCI EAFE index rose approximately 20%.
Contributor #2 – The Fund's Gold position was once again a strong contributor, driven this year as much by risk management as by the metal's price. Gold futures rallied over 60% from the start of the fiscal year to their late-January peak on 01/29/2026, and the Fund maintained meaningful exposure through the rally, holding 14.89% of assets in Gold futures as of 01/27/2026. The portfolio managers then reduced exposure on that date to 5%. Gold futures peaked at $5,354.80 per ounce on 1/29/26. The metal subsequently declined approximately 13% to $4,652.60 by 02/02/2026, so the reduction preserved the majority of the gains the position had generated. The Fund fully exited Gold by fiscal year-end. The Fund currently has no exposure to Gold futures, within the normal range of 0% to 15%.
Contributor #3 – Diversifying Strategies rebounded from the prior fiscal year's losses. The trend following and global macro strategies in our external funds found their footing as markets established sustained directionality. The sleeve contributed approximately +8.83% in the first half of calendar 2026 alone.
TOP PERFORMANCE DETRACTORS
Detractor - The Fund has lower stock exposure compared to our 70/30 benchmark. In a fiscal year when MSCI ACWI returned approximately 23%, our moderate equity allocation naturally reduced the degree to which we captured the rally, and our approximately 8-year duration Treasury exposure and diversifying allocations trailed stocks. This positioning is by design: with our lower equity exposure, we aim to moderate volatility and better manage risk in order to create a smoother return stream. Notably, the Fund still outperformed the 70/30 benchmark by more than 9 percentage points this fiscal year.
Today, the Fund's portfolio includes approximately:
- 54% Stock exposure, which is invested directly into US stocks (approximately 33% of Fund assets) or through EAFE stock index futures (approximately 21% notional) collateralized with T-bills
- 20% Fixed Income exposure, invested in US Treasury Notes maturing between 2033 and 2035, with an approximate 8-year duration
- 21% Diversifying Strategies invested in T-bills to collateralize our positions in either futures or the Deutsche Bank swap that gives us access to the external funds. The notional exposure in the Diversifying Strategies typically ranges between 50-70%. The Fund currently holds no Gold futures position, within the normal allocation range of 0% to 15%.
As a reminder, the Fund's portfolio includes some leverage, which is why the portfolio's total notional exposure is more than 100%. The portfolio's notional exposure is accessed through derivatives instruments, such as futures and swaps. The futures and swaps are collateralized with T-bills. Since T-bills are used to collateralize these other positions, our quarterly holdings report shows the majority of our cash invested in T-bills. It is important to note that the futures, swaps, and T-bills all work together to give the Fund exposure in various stock markets and diversifying strategies.
[1] 70/30 Stock/Bond Portfolio uses 70% MSCI ACWI Index and 30% Bloomberg US Aggregate Bond Index, and its statistics reflect no deductions for fees, expenses, or taxes
| FORTX Volatility Comparisons – reflects Class I Shares fees | ||||
| Volatility (Standard Deviation) | Fund | 70/30 Portfolio | MSCI ACWI Index | U.S. Aggregate Bond Index |
| 1-Year (07/01/25 - 06/30/2026) | 9.94% | 8.30% | 11.32% | 3.73% |
| Since Inception (07/26/2018 - 06/30/2026) | 8.76% | 12.15% | 16.11% | 5.50% |
Fund Performance
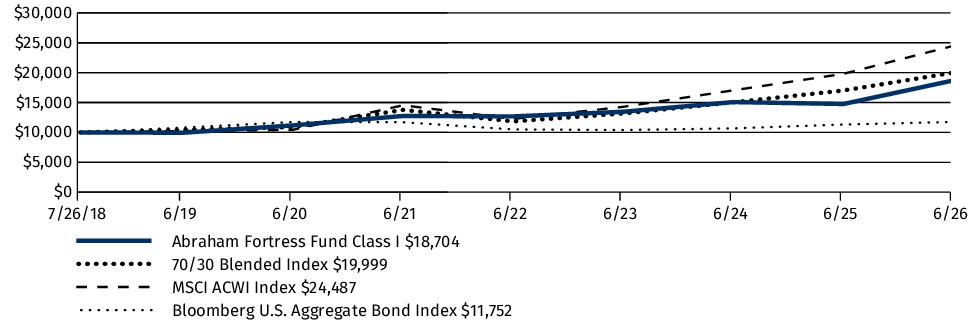
The following graph and chart compare the initial and subsequent account values at the end of each of the most recently completed 10 fiscal years of the Fund, or for the life of the Fund, if shorter. It assumes a $10,000 initial investment at the beginning of the first fiscal year in an appropriate, broad-based securities market index for the same period.
GROWTH OF $10,000
| AVERAGE ANNUAL TOTAL RETURN | 1 Year | 5 Years1 | Since Inception1 |
| Abraham Fortress Fund (Class I/FORTX) | 26.80% | 7.96% | 8.22% |
| 70/30 Blended Index | 17.55% | 7.75% | 9.14% |
| MSCI ACWI Index | 23.67% | 10.98% | 11.96% |
| Bloomberg U.S. Aggregate Bond Index | 3.79% | 0.08% | 2.06% |
|
1
|
Class I shares commenced operations on July 26, 2018 and the performance figures include the performance of the Predecessor Fund prior to October 13, 2021.
|
The graph and table do not reflect the deduction of taxes that a shareholder would pay on Fund distributions or redemption of Fund shares.
Visit https://www.abrahamtrading.com/fortress-fund/performance for the most recent performance information.
Key Fund Statistics
The following table outlines key fund statistics that you should pay attention to.
| Fund net assets | $100,949,715 |
| Total number of portfolio holdings | 245 |
| Total advisory fees paid (net) | $163,918 |
| Portfolio turnover rate as of the end of the reporting period | 28% |
Graphical Representation of Holdings
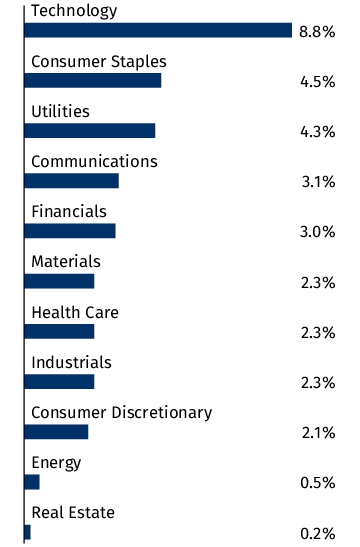
The tables below show the investment makeup of the Fund, representing percentage of the total net assets of the Fund. The Sector Allocation chart represents Common Stocks of the Fund.
Asset Allocation
| U.S. Treasury Bills | 47.5% |
| Common Stocks | 33.4% |
| U.S. Treasury Notes | 20.2% |
| Rights | 0.0% |
| Short-Term Investments | 0.0% |
| Liabilities in Excess of Other Assets | (1.1)% |
Sector Allocation
Material Fund Changes
The Fund did not have any material changes that occurred since the beginning of the reporting period.
Changes in and Disagreements with Accountants
There were no changes in or disagreements with the Fund's accountants during the reporting period.