Pay vs Performance Disclosure - USD ($)
Jun. 30, 2026
Jun. 30, 2025
Jun. 30, 2024
Jun. 30, 2023
Jun. 30, 2022
Fiscal Year | Summary Compensation Table Total for PEO(1) ($) | Compensation Actually Paid to PEO(2) ($) | Average Summary Compensation Table Total for Non-PEO NEOs(3)(4) ($) | Average Compensation Actually Paid to Non-PEO NEOs(2)(4) ($) | Value of Initial Fixed $100 Investment Based on: | Net Income ($M) | Revenue(6) ($M) | |||||||||||||||||||
Total Shareholder Return ($) | Peer Group Total Shareholder Return(5) ($) | |||||||||||||||||||||||||
| 2026 | 18,674,436 | 34,412,304 | 3,436,937 | 6,076,411 | 181.59 | 140.63 | 535.8 | 9,567.8 | ||||||||||||||||||
2025 | 16,745,127 | 20,775,755 | 3,603,836 | 3,868,019 | 186.85 | 165.40 | 499.8 | 8,627.8 | ||||||||||||||||||
2024 | 15,056,676 | 23,809,039 | 3,287,462 | 5,257,933 | 168.60 | 112.31 | 419.9 | 7,659.8 | ||||||||||||||||||
2023 | 10,524,801 | 15,532,126 | 2,674,283 | 4,222,816 | 133.60 | 93.28 | 384.7 | 6,702.5 | ||||||||||||||||||
2022 | 8,363,317 | 10,873,550 | 3,771,845 | 4,233,452 | 110.45 | 90.43 | 366.8 | 6,202.9 | ||||||||||||||||||
Fiscal Year | Summary Compensation Table Total for PEO ($) | Annual Stock Award ($) | Change in Pension Value ($) | Pension Service Cost ($) | Equity Value ($) | Compensation Actually Paid ($) | ||||||||||||||
PEO | ||||||||||||||||||||
| 2026 | 18,674,436 | (13,000,063) | (146,223) | — | 28,884,154 | 34,412,304 | ||||||||||||||
2025 | 16,745,127 | (12,000,385) | (175,432) | — | 16,206,446 | 20,775,755 | ||||||||||||||
2024 | 15,056,676 | (10,500,017) | (2,260) | — | 19,254,641 | 23,809,039 | ||||||||||||||
2023 | 10,524,801 | (6,700,105) | (640,202) | 440,406 | 11,907,226 | 15,532,126 | ||||||||||||||
2022 | 8,363,317 | (5,500,180) | (380,561) | 1,093,724 | 7,297,250 | 10,873,550 | ||||||||||||||
Average of Non-PEO NEOs | ||||||||||||||||||||
| 2026 | 3,436,937 | (2,075,382) | — | — | 4,714,857 | 6,076,411 | ||||||||||||||
2025 | 3,603,836 | (1,053,206) | — | — | 1,317,389 | 3,868,019 | ||||||||||||||
2024 | 3,287,462 | (1,625,137) | — | — | 3,595,608 | 5,257,933 | ||||||||||||||
2023 | 2,674,283 | (1,210,119) | — | — | 2,758,652 | 4,222,816 | ||||||||||||||
| 2022 | 3,771,845 | (2,525,230) | — | — | 2,986,838 | 4,233,452 | ||||||||||||||
The amounts deducted or added in calculating the Equity Values are included in the table below. In 2026, 2025, 2024, 2023 and 2022, the fair value of the grants awarded in the respective years increased at the end of the year due to the growth in stock price, which is a key driver of CAP year-over-year.
Fair Value of Current Year Equity Awards at Fiscal Year End ($) | Change in Fair Value as of Fiscal Year End for Unvested Awards ($) | Fair Value of Awards at Vesting Granted During Year ($) | Change in Value of Awards as of Vesting of Prior Year Awards ($) | Value of Forfeited Awards ($) | Value of Dividends ($) | Total Equity Value Included in CAP ($) | |||||||||||||||||
PEO | |||||||||||||||||||||||
| 2026 | 11,690,366 | 7,182,032 | — | 10,011,756 | — | — | 28,884,154 | ||||||||||||||||
2025 | 11,313,998 | 2,094,905 | — | 2,797,543 | — | — | 16,206,446 | ||||||||||||||||
| 2024 | 14,386,558 | 5,063,956 | — | -195,873 | — | — | 19,254,641 | ||||||||||||||||
2023 | 8,747,659 | 3,533,633 | — | (374,066) | — | — | 11,907,226 | ||||||||||||||||
2022 | 5,845,808 | 1,159,531 | — | 291,912 | — | — | 7,297,250 | ||||||||||||||||
Average of Non-PEO NEOs | |||||||||||||||||||||||
| 2026 | 1,956,926 | 859,083 | — | 1,898,847 | — | — | 4,714,857 | ||||||||||||||||
2025 | 992,966 | 372,066 | — | 559,872 | (607,516) | — | 1,317,389 | ||||||||||||||||
| 2024 | 2,226,675 | 1,362,941 | — | 5,992 | — | — | 3,595,608 | ||||||||||||||||
2023 | 1,884,675 | 857,722 | — | (99,774) | — | — | 2,758,652 | ||||||||||||||||
2022 | 2,598,364 | 344,102 | — | 44,372 | — | — | 2,986,838 | ||||||||||||||||
Fiscal Year | Summary Compensation Table Total for PEO ($) | Annual Stock Award ($) | Change in Pension Value ($) | Pension Service Cost ($) | Equity Value ($) | Compensation Actually Paid ($) | ||||||||||||||
PEO | ||||||||||||||||||||
| 2026 | 18,674,436 | (13,000,063) | (146,223) | — | 28,884,154 | 34,412,304 | ||||||||||||||
2025 | 16,745,127 | (12,000,385) | (175,432) | — | 16,206,446 | 20,775,755 | ||||||||||||||
2024 | 15,056,676 | (10,500,017) | (2,260) | — | 19,254,641 | 23,809,039 | ||||||||||||||
2023 | 10,524,801 | (6,700,105) | (640,202) | 440,406 | 11,907,226 | 15,532,126 | ||||||||||||||
2022 | 8,363,317 | (5,500,180) | (380,561) | 1,093,724 | 7,297,250 | 10,873,550 | ||||||||||||||
Average of Non-PEO NEOs | ||||||||||||||||||||
| 2026 | 3,436,937 | (2,075,382) | — | — | 4,714,857 | 6,076,411 | ||||||||||||||
2025 | 3,603,836 | (1,053,206) | — | — | 1,317,389 | 3,868,019 | ||||||||||||||
2024 | 3,287,462 | (1,625,137) | — | — | 3,595,608 | 5,257,933 | ||||||||||||||
2023 | 2,674,283 | (1,210,119) | — | — | 2,758,652 | 4,222,816 | ||||||||||||||
| 2022 | 3,771,845 | (2,525,230) | — | — | 2,986,838 | 4,233,452 | ||||||||||||||
The amounts deducted or added in calculating the Equity Values are included in the table below. In 2026, 2025, 2024, 2023 and 2022, the fair value of the grants awarded in the respective years increased at the end of the year due to the growth in stock price, which is a key driver of CAP year-over-year.
Fair Value of Current Year Equity Awards at Fiscal Year End ($) | Change in Fair Value as of Fiscal Year End for Unvested Awards ($) | Fair Value of Awards at Vesting Granted During Year ($) | Change in Value of Awards as of Vesting of Prior Year Awards ($) | Value of Forfeited Awards ($) | Value of Dividends ($) | Total Equity Value Included in CAP ($) | |||||||||||||||||
PEO | |||||||||||||||||||||||
| 2026 | 11,690,366 | 7,182,032 | — | 10,011,756 | — | — | 28,884,154 | ||||||||||||||||
2025 | 11,313,998 | 2,094,905 | — | 2,797,543 | — | — | 16,206,446 | ||||||||||||||||
| 2024 | 14,386,558 | 5,063,956 | — | -195,873 | — | — | 19,254,641 | ||||||||||||||||
2023 | 8,747,659 | 3,533,633 | — | (374,066) | — | — | 11,907,226 | ||||||||||||||||
2022 | 5,845,808 | 1,159,531 | — | 291,912 | — | — | 7,297,250 | ||||||||||||||||
Average of Non-PEO NEOs | |||||||||||||||||||||||
| 2026 | 1,956,926 | 859,083 | — | 1,898,847 | — | — | 4,714,857 | ||||||||||||||||
2025 | 992,966 | 372,066 | — | 559,872 | (607,516) | — | 1,317,389 | ||||||||||||||||
| 2024 | 2,226,675 | 1,362,941 | — | 5,992 | — | — | 3,595,608 | ||||||||||||||||
2023 | 1,884,675 | 857,722 | — | (99,774) | — | — | 2,758,652 | ||||||||||||||||
2022 | 2,598,364 | 344,102 | — | 44,372 | — | — | 2,986,838 | ||||||||||||||||
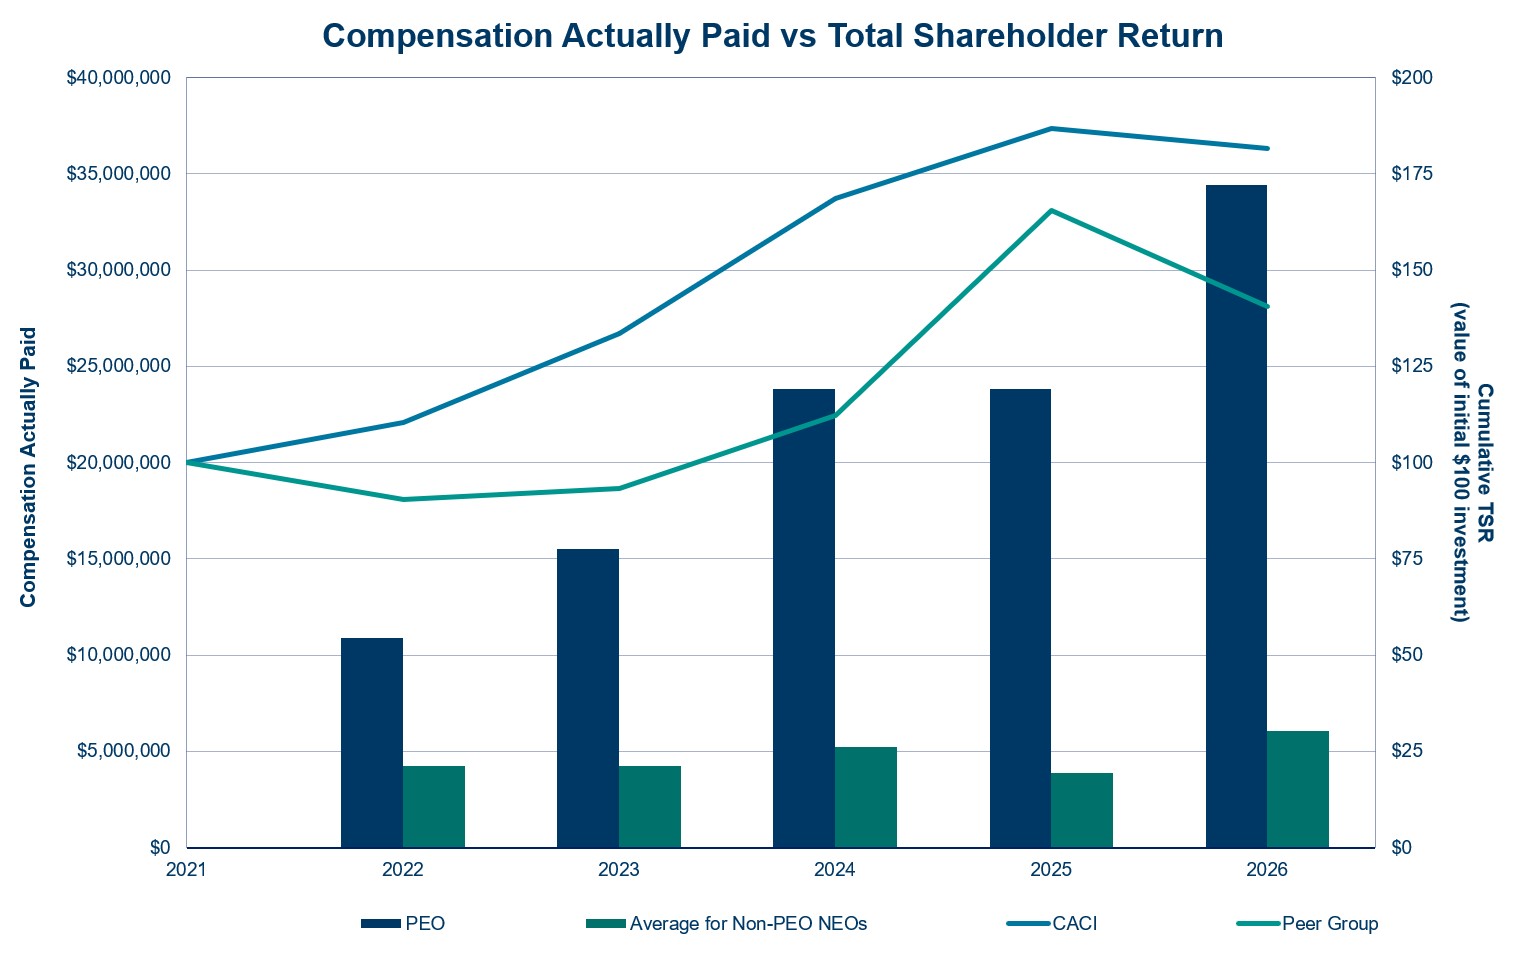
The following chart illustrates the relationship between TSR and CAP to our PEO and the average CAP to our other NEOs over the five-year period from 2022 through 2026:
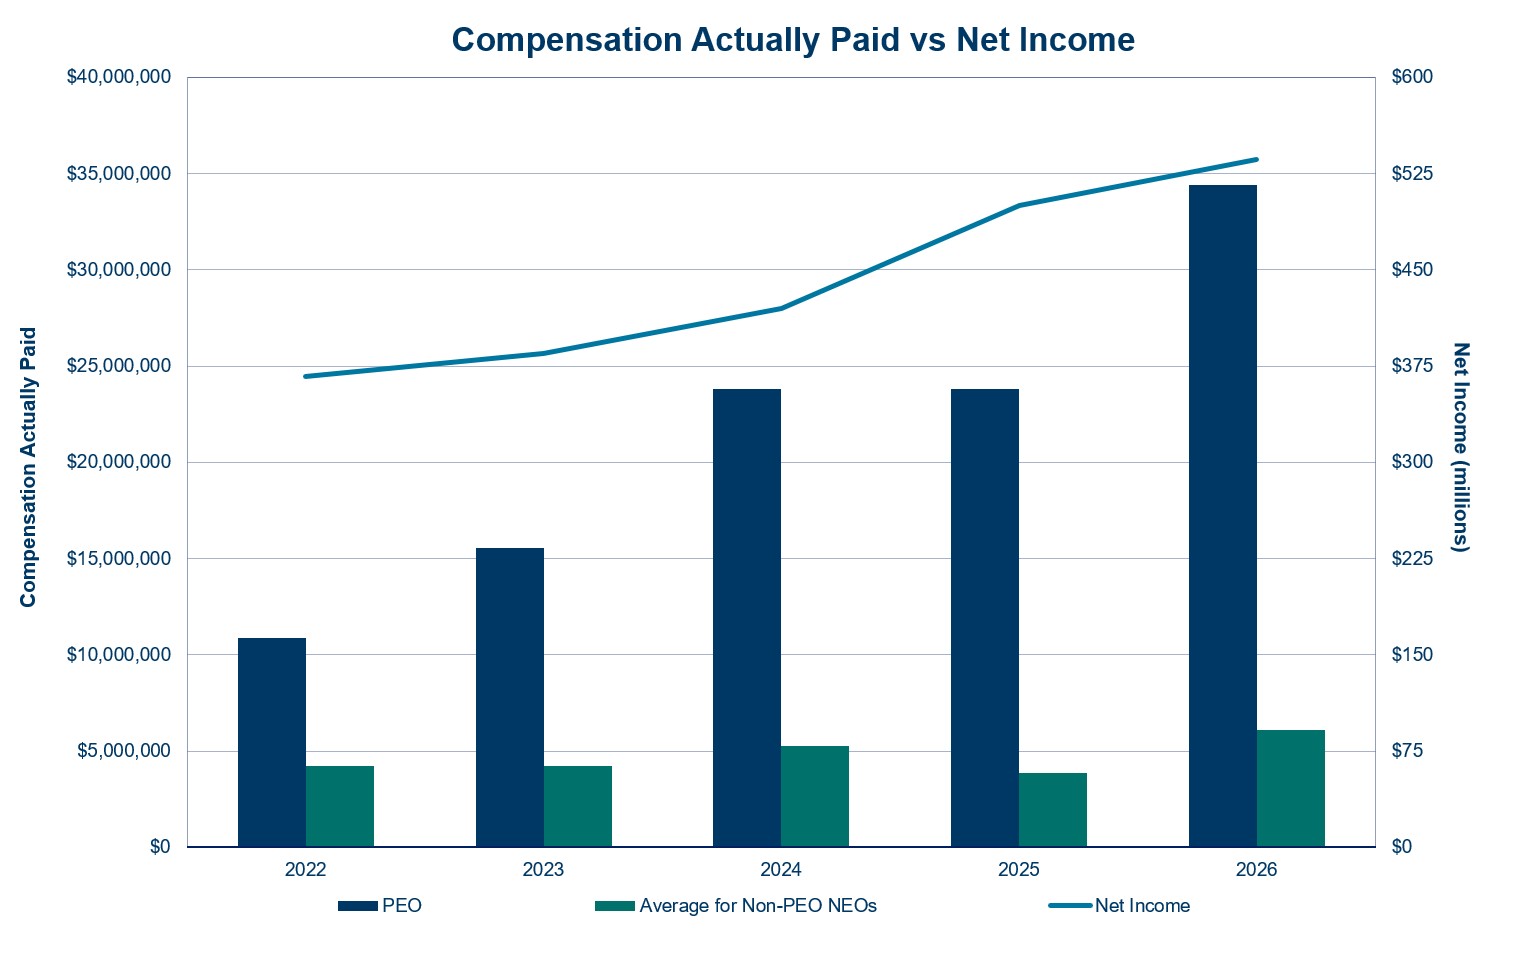
The following chart illustrates the relationship between CACI Net Income and CAP to our PEO and the average CAP to our other NEOs over the five-year period from 2022 through 2026:
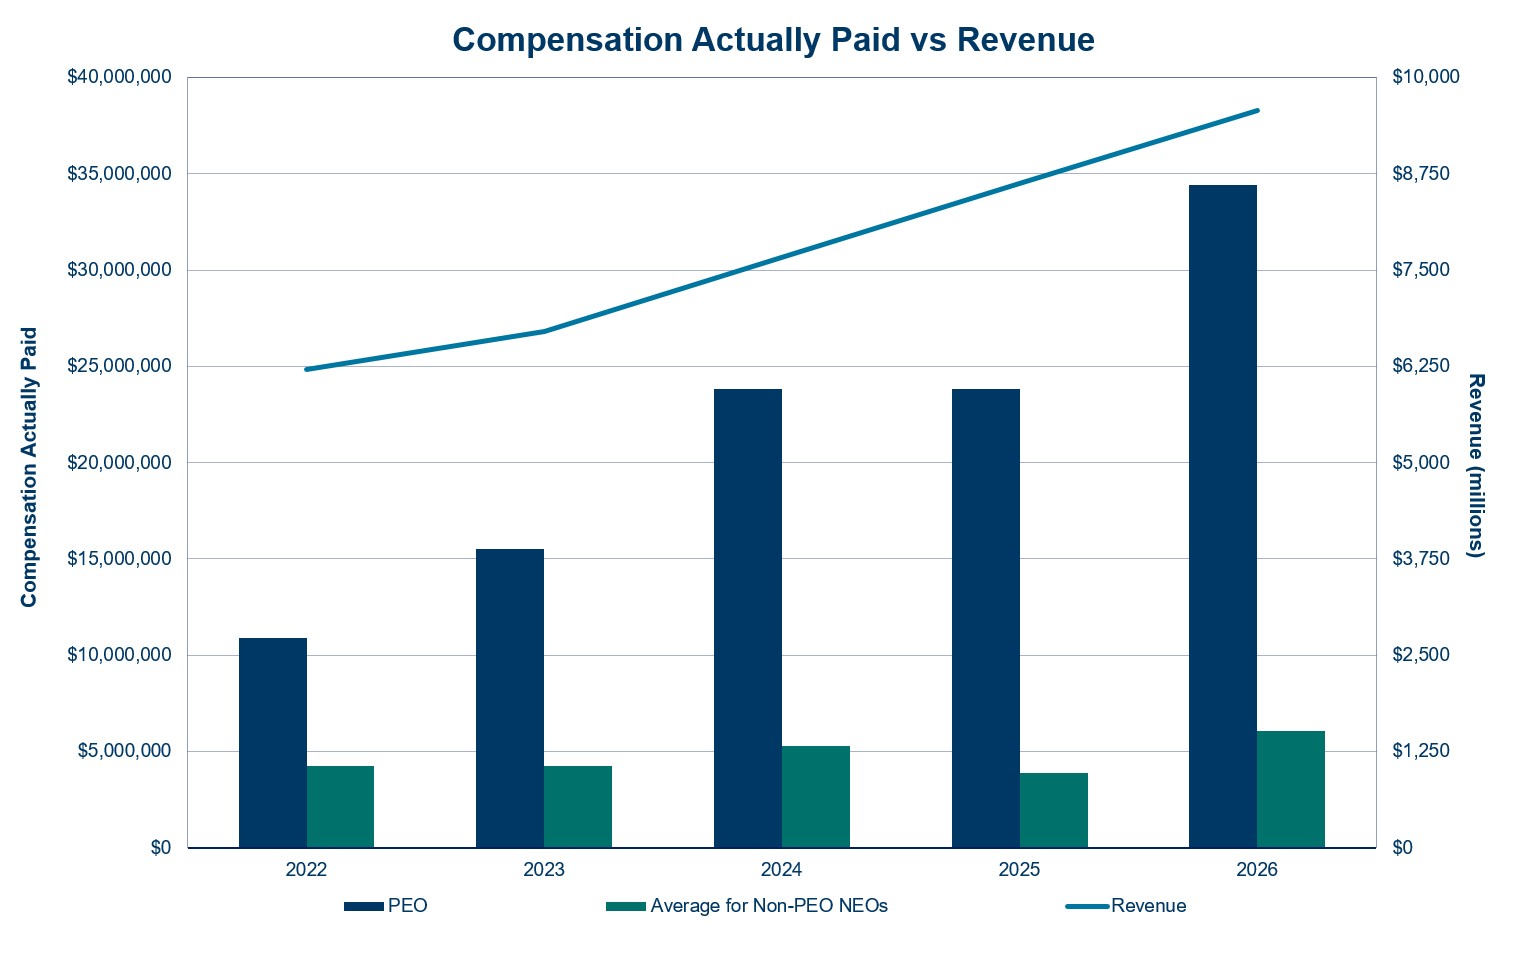
The following chart illustrates the relationship between CACI Revenue and CAP to our PEO and the average CAP to our other NEOs over the five-year period from 2022 through 2026:
The following chart illustrates the relationship between TSR and CAP to our PEO and the average CAP to our other NEOs over the five-year period from 2022 through 2026:
The table below provides the five most important measures used by the Company to link CAP to our PEO and Non-PEO NEOs in 2026. The measures in this table are not ranked:
CACI Revenue | U.S. Operations Revenue | U.S. Operations Collections | ||||||
CACI EBITDA | U.S. Operations Margin % and Dollars | 3-Year Cumulative Free Cash Flow1 | ||||||
•minus the Annual Stock Award
•minus the Change in Pension Value
•plus the Pension Service Cost
•plus Equity Value, which is calculated as:
a.the fair value of outstanding and unvested equity awards at the end of each fiscal year
b.plus/(less) the change in fair value as of fiscal year-end for unvested awards
c.plus the fair value as of vesting for awards granted and vested during the year
d.plus/(less) the annual change in value as of vesting for prior year's awards
e.less prior year-end fair value for any equity awards forfeited during the year
e 2025 average compensation figures for the Non-PEO NEOs have been recalculated to correct an administrative error in our prior year's proxy statement, which inadvertently excluded the compensation of Mr. Probert, a former NEO, from the average. This correction increased the previously reported 2025 Average Summary Compensation Table Total and the Average Compensation Actually Paid by $1,381,188. The 2025 adjustments in the CAP reconciliation table below have also been updated to reflect his inclusion.SEC rules require us to designate a “company-selected measure” that in our assessment represents the most important financial performance measure (that is not total shareholder return or net income) used by the Company to link the CAP of our NEOs, for the most recently completed fiscal year, to our performance. We selected Revenue as this measure for 2026 and 2025 as reflected in column (i) in the first table above. This performance measure may not have been the most important financial performance measure for years 2024, 2023 and 2022 and we may determine a different financial performance measure to be the most important financial performance measure in future years.