| Pay Versus Performance |
PvP Table
As required by the SEC rules, we are providing the following information about the relationship between Compensation Actually Paid (“CAP”) to our CEO, Mr. Dunbar, and other NEOs and certain financial performance metrics of Standex using the methodology that has been prescribed by the SEC.
| Value of Initial Fixed $100 | ||||||||||||||||||||||||||||||||
| Average | Investment Based on: | |||||||||||||||||||||||||||||||
| Summary | Summary | Average | Peer Group | Company | ||||||||||||||||||||||||||||
| Compensation | Compensation | Compensation | Compensation | Total | Total | Selected | ||||||||||||||||||||||||||
| Table Total for | Actually Paid | Table Total for | Actually Paid | Shareholder | Shareholder | Net | Measure | |||||||||||||||||||||||||
| PEO | to PEO | Other NEOs | to Other NEOs | Return | Return | Income | EBITDA | |||||||||||||||||||||||||
|
Year |
($) 1 |
($) 2 |
($) 3 |
($) 2 |
($) |
($) 4 |
($) |
($) 5 |
||||||||||||||||||||||||
|
2026 |
6,407,973 | 15,959,512 | 1,202,598 | 2,384,325 | 392.40 | 212.40 | 104,632,000 | 194,330,000 | ||||||||||||||||||||||||
|
2025 |
5,117,281 | 3,844,893 | 1,133,741 | 981,784 | 284.95 | 239.92 | 57,684,000 | 170,599,000 | ||||||||||||||||||||||||
|
2024 |
4,993,485 | 6,950,831 | 1,316,864 | 1,514,386 | 291.38 | 213.04 | 73,074,000 | 140,548,000 | ||||||||||||||||||||||||
|
2023 |
5,098,597 | 13,895,157 | 1,106,031 | 1,453,920 | 253.88 | 182.76 | 138,992,000 | 139,500,000 | ||||||||||||||||||||||||
|
2022 |
5,135,735 | 5,047,799 | 1,205,257 | 1,157,888 | 150.63 | 141.55 | 61,393,000 | 129,057,000 | ||||||||||||||||||||||||
|
1 |
Our PEO for all years in the table was our CEO, David Dunbar. |
|
2 |
The adjustments, each of which is prescribed by SEC rules, to calculate the CAP are described in the table below. |
|
3 |
Our Other NEOs for FY 2026 were: Ademir Sarcevic, Alan Glass, Max Arets, Vineet Kshirsagar and Annemarie Bell. |
|
| Our Other NEOs for FY 2025 were: Ademir Sarcevic, Alan Glass, Annemarie Bell and Max Arets. | ||
| Our Other NEOs for FY 2024 were: Ademir Sarcevic, Alan Glass, Annemarie Bell and Max Arets. | ||
| Our Other NEOs for FY 2023 were: Ademir Sarcevic, Alan Glass, Annemarie Bell, Sean Valashinas, Paul Burns and Flavio Maschera. | ||
| Our Other NEOs for FY 2022 were: Ademir Sarcevic, Alan Glass, Paul Burns and Flavio Maschera. |
|
4 |
The peer group is the S&P SmallCap 600 Industrial Sector Index, which is the same peer group used in our Annual Report on Form 10-K. |
|
5 |
The Company selected measure, adjusted EBITDA, stands for earnings before income tax, depreciation and amortization, and is a non-GAAP financial measure that is determined by the sum of (i) income from operations before income taxes, (ii) interest expense and (iii) depreciation and amortization. Adjusted EBITDA adjusts for restructuring charges, litigation charges, purchase accounting and acquisition related costs. |
Adjustments to Calculate CAP to PEO and Average CAP to Other NEOs
The table below describes the adjustments, each of which is required by SEC rules, to calculate CAP amounts from the SCT Total of our PEO and our Other NEOs. The SCT Total and CAP amounts do not reflect the actual amount of compensation earned or paid to our executives during the applicable years, but rather, are amounts determined in accordance with Item 402(v).
| 2026 | 2025 | 2024 | 2023 | 2022 | ||||||||||||||||||||||||||||||||||||
| Other | Other | Other | Other | Other | ||||||||||||||||||||||||||||||||||||
|
Adjustment |
PEO |
NEOs |
PEO |
NEOs |
PEO |
NEOs |
PEO |
NEOs |
PEO |
NEOs |
||||||||||||||||||||||||||||||
|
SCT Total |
6,407,973 | 1,202,598 | 5,117,281 | 1,133,741 | 4,993,485 | 1,316,864 | 5,098,597 | 1,106,031 | 5,135,735 | 1,205,257 | ||||||||||||||||||||||||||||||
|
Adjustment for defined benefit plans |
- | - | - | - | - | - | - | - | - | - | ||||||||||||||||||||||||||||||
|
Adjustment for stock awards |
||||||||||||||||||||||||||||||||||||||||
|
(Deduct): Aggregate value for stock awards included in SCT |
(4,135,819 | ) | (509,728 | ) | (3,553,548 | ) | (515,505 | ) | (3,318,267 | ) | (811,489 | ) | (3,405,266 | ) | (392,536 | ) | (3,435,322 | ) | (542,780 | ) | ||||||||||||||||||||
|
Add: Fair value at FYE of awards granted during the FY that were outstanding at FYE |
6,624,303 | 830,804 | 3,194,723 | 450,158 | 3,083,931 | 804,973 | 5,005,533 | 428,779 | 3,168,159 | 480,938 | ||||||||||||||||||||||||||||||
|
Add (Deduct): Change in fair value from prior FYE to current FYE of awards granted in prior years that were outstanding at FYE |
5,622,975 | 620,757 | (1,513,617 | ) | (160,642 | ) | 357,363 | 57,302 | 7,282,679 | 608,518 | 599,759 | 116,769 | ||||||||||||||||||||||||||||
|
Add: Fair value on vesting date of awards granted in the FY that vested during the FY |
- | - | - | - | 465,400 | - | - | - | - | - | ||||||||||||||||||||||||||||||
|
Add (Deduct): Change in fair value from prior FYE to vesting date of awards granted in prior years that vested during the FY |
1,385,386 | 234,271 | 548,243 | 64,762 | 1,340,748 | 140,723 | (115,452 | ) | (8,733 | ) | (455,113 | ) | (110,118 | ) | ||||||||||||||||||||||||||
|
(Deduct): Fair value at prior FYE of awards granted in prior years that failed to meet the applicable vesting conditions during the FY |
- | - | - | - | - | - | - | (291,719 | ) | - | - | |||||||||||||||||||||||||||||
|
Add: Dividends or other earnings paid on awards in the FY |
54,693 | 5,623 | 51,809 | 9,270 | 28,170 | 6,015 | 29,066 | 3,580 | 34,581 | 7,822 | ||||||||||||||||||||||||||||||
|
CAP Amounts (as calculated) |
15,959,512 | 2,384,325 | 3,844,893 | 981,784 | 6,950,831 | 1,514,386 | 13,895,157 | 1,453,920 | 5,047,799 | 1,157,888 | ||||||||||||||||||||||||||||||
|
1 |
For (i) PSUs granted in the current FY with future vesting, and (ii) PSUs granted in prior FYs with future vesting, the number of PSUs used in the valuation is the number of PSUs granted at their probable outcome. For PSUs granted in prior FYs that vested in the current FY, the number of PSUs used in the valuation is the number of PSUs that vested. | |
| For RSUs granted pursuant to a deferral under the MSPP, the CAP adjustment includes such RSUs in the year in which they are granted in accordance with ASC 718, rather than the year in which they are reported in the SCT. The fair value for such RSUs uses the Black-Scholes valuation model to determine the value of the discount on the shares at the various points in time required in the adjustments. The fair value of the discount is then added to the cash value of the executive’s annual incentive deferral underlying the specific MSPP deferral. E.g., for the annual incentive opportunity for FY 2022, the value of the annual incentive received in cash is reported in the Non-Equity Incentive Compensation column of the SCT for FY 2022 and the corresponding grant date fair value of any RSUs received pursuant to a deferral election under the MSPP for such annual incentive is reported in the SCT for FY 2022. The adjustment for CAP removes the grant date fair value of such RSUs reported in the SCT for FY 2022, but then includes the FYE fair value of such RSUs in FY 2023 because such RSUs were granted in FY 2023 and remained outstanding as of the FYE. The FYE fair value is determined by adding the value of the annual incentive opportunity deferred into the receipt of discounted RSUs and the value of the discount as of the FYE. |
| 72 2026 PROXY STATEMENT |
Adjustments to Calculate CAP to PEO and Average CAP to Other NEOs
The table below describes the adjustments, each of which is required by SEC rules, to calculate CAP amounts from the SCT Total of our PEO and our Other NEOs. The SCT Total and CAP amounts do not reflect the actual amount of compensation earned or paid to our executives during the applicable years, but rather, are amounts determined in accordance with Item 402(v).
| 2026 | 2025 | 2024 | 2023 | 2022 | ||||||||||||||||||||||||||||||||||||
| Other | Other | Other | Other | Other | ||||||||||||||||||||||||||||||||||||
|
Adjustment |
PEO |
NEOs |
PEO |
NEOs |
PEO |
NEOs |
PEO |
NEOs |
PEO |
NEOs |
||||||||||||||||||||||||||||||
|
SCT Total |
6,407,973 | 1,202,598 | 5,117,281 | 1,133,741 | 4,993,485 | 1,316,864 | 5,098,597 | 1,106,031 | 5,135,735 | 1,205,257 | ||||||||||||||||||||||||||||||
|
Adjustment for defined benefit plans |
- | - | - | - | - | - | - | - | - | - | ||||||||||||||||||||||||||||||
|
Adjustment for stock awards |
||||||||||||||||||||||||||||||||||||||||
|
(Deduct): Aggregate value for stock awards included in SCT |
(4,135,819 | ) | (509,728 | ) | (3,553,548 | ) | (515,505 | ) | (3,318,267 | ) | (811,489 | ) | (3,405,266 | ) | (392,536 | ) | (3,435,322 | ) | (542,780 | ) | ||||||||||||||||||||
|
Add: Fair value at FYE of awards granted during the FY that were outstanding at FYE |
6,624,303 | 830,804 | 3,194,723 | 450,158 | 3,083,931 | 804,973 | 5,005,533 | 428,779 | 3,168,159 | 480,938 | ||||||||||||||||||||||||||||||
|
Add (Deduct): Change in fair value from prior FYE to current FYE of awards granted in prior years that were outstanding at FYE |
5,622,975 | 620,757 | (1,513,617 | ) | (160,642 | ) | 357,363 | 57,302 | 7,282,679 | 608,518 | 599,759 | 116,769 | ||||||||||||||||||||||||||||
|
Add: Fair value on vesting date of awards granted in the FY that vested during the FY |
- | - | - | - | 465,400 | - | - | - | - | - | ||||||||||||||||||||||||||||||
|
Add (Deduct): Change in fair value from prior FYE to vesting date of awards granted in prior years that vested during the FY |
1,385,386 | 234,271 | 548,243 | 64,762 | 1,340,748 | 140,723 | (115,452 | ) | (8,733 | ) | (455,113 | ) | (110,118 | ) | ||||||||||||||||||||||||||
|
(Deduct): Fair value at prior FYE of awards granted in prior years that failed to meet the applicable vesting conditions during the FY |
- | - | - | - | - | - | - | (291,719 | ) | - | - | |||||||||||||||||||||||||||||
|
Add: Dividends or other earnings paid on awards in the FY |
54,693 | 5,623 | 51,809 | 9,270 | 28,170 | 6,015 | 29,066 | 3,580 | 34,581 | 7,822 | ||||||||||||||||||||||||||||||
|
CAP Amounts (as calculated) |
15,959,512 | 2,384,325 | 3,844,893 | 981,784 | 6,950,831 | 1,514,386 | 13,895,157 | 1,453,920 | 5,047,799 | 1,157,888 | ||||||||||||||||||||||||||||||
|
1 |
For (i) PSUs granted in the current FY with future vesting, and (ii) PSUs granted in prior FYs with future vesting, the number of PSUs used in the valuation is the number of PSUs granted at their probable outcome. For PSUs granted in prior FYs that vested in the current FY, the number of PSUs used in the valuation is the number of PSUs that vested. | |
| For RSUs granted pursuant to a deferral under the MSPP, the CAP adjustment includes such RSUs in the year in which they are granted in accordance with ASC 718, rather than the year in which they are reported in the SCT. The fair value for such RSUs uses the Black-Scholes valuation model to determine the value of the discount on the shares at the various points in time required in the adjustments. The fair value of the discount is then added to the cash value of the executive’s annual incentive deferral underlying the specific MSPP deferral. E.g., for the annual incentive opportunity for FY 2022, the value of the annual incentive received in cash is reported in the Non-Equity Incentive Compensation column of the SCT for FY 2022 and the corresponding grant date fair value of any RSUs received pursuant to a deferral election under the MSPP for such annual incentive is reported in the SCT for FY 2022. The adjustment for CAP removes the grant date fair value of such RSUs reported in the SCT for FY 2022, but then includes the FYE fair value of such RSUs in FY 2023 because such RSUs were granted in FY 2023 and remained outstanding as of the FYE. The FYE fair value is determined by adding the value of the annual incentive opportunity deferred into the receipt of discounted RSUs and the value of the discount as of the FYE. |
| 72 2026 PROXY STATEMENT |
Relationship Between Compensation Actually Paid and Performance
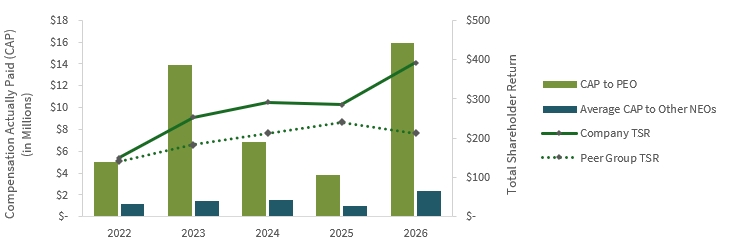
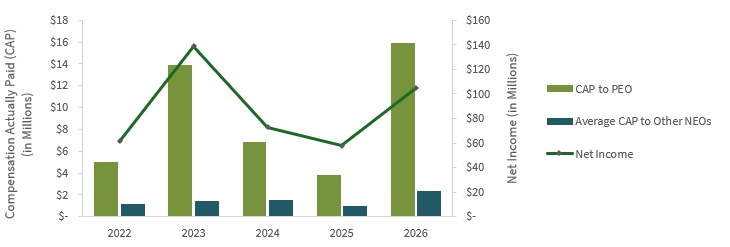
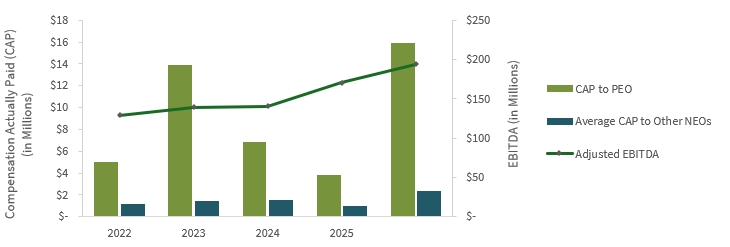
The graphs below show the relationship between “compensation actually paid” to our PEO and Other NEOs to (i) TSR of both the Company and the S&P SmallCap 600 Industrial Sector Index, with the value of the initial fixed $100 investment measured as of June 30, 2021; (ii) the Company’s net income; and (iii) the Company’s adjusted EBITDA (non-GAAP).
CAP vs. Company TSR and Peer Group TSR
CAP vs. Net Income
CAP vs. Company-Selected Measure (Adjusted EBITDA)
| 2026 PROXY STATEMENT 73 |
Financial Performance Measures
The following table lists the financial performance measures that, in the Company’s assessment, represent the most important measures used to link CAP for our NEOs to Company performance for FY 2026.
| Net Sales |
| Adjusted Operating Income |
| Adjusted EPS |
| Adjusted EBITDA |
| ROIC |
| 2026 PROXY STATEMENT 71 |