Shareholder Report
Jun. 30, 2026
USD ($)
$ / shares
WHAT WERE THE FUND COSTS FOR THE LAST SIX MONTHS? (based on a hypothetical $10,000 investment)
|
Fund Name
|
Costs of a $10,000 investment
|
Costs paid as a percentage of a $10,000 investment*,**
|
|
REX Autocallable Income ETF
|
$24
|
0.65%
|
WHAT FACTORS INFLUENCED PERFORMANCE
|
•
|
The Fund seeks to generate high monthly income while providing reduced downside risk, primarily by gaining exposure to a daily laddered portfolio of synthetic autocallable positions referencing the Bloomberg US Large Cap VolMax Autocallable Index.
|
|
•
|
Performance was primarily driven by the coupon income generated from the autocallable positions and by the price movement of the underlying reference index relative to the coupon and downside barriers.
|
|
•
|
The Fund’s results were influenced by equity market direction and volatility levels, which affect the frequency of autocall events, coupon payments, and the value of the synthetic positions.
|
|
•
|
Income earned on the Fund’s U.S. Treasury collateral also contributed to results.
|
|
Top Contributors
|
|
|
↑
|
• Coupon income generated from the Fund’s synthetic autocallable positions during the period. • Autocall events and positive movement of the underlying reference index relative to coupon barriers. • Interest earned on collateral and cash equivalents.
|
|
Top Detractors
|
|
|
↓
|
• Equity market declines during portions of the period.
|
MANAGED DISTRIBUTIONS
The Fund has monthly managed distributions.
KEY FUND STATISTICS (as of June 30, 2026)
|
Net Assets
|
$37,209,301
|
|
Number of Holdings
|
5
|
|
Portfolio Turnover
|
0%
|
WHAT DID THE FUND INVEST IN? (as of June 30, 2026)
Security Type Breakdown
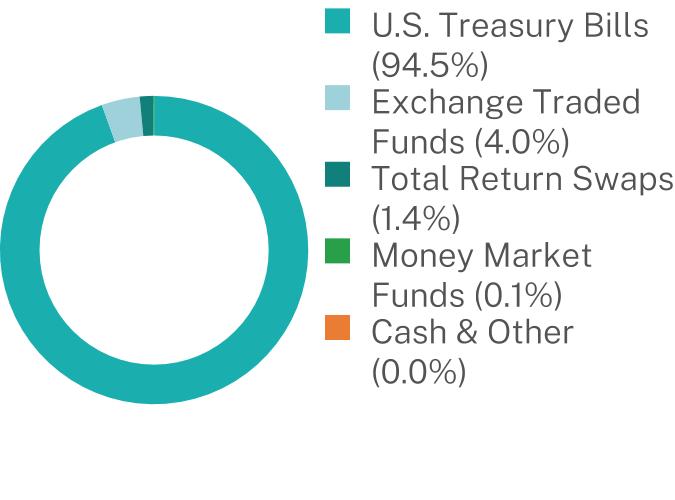
|
Top 10 Issuers
|
(%)
|
|
|
United States Treasury Bill
|
94.5
|
%
|
|
The Laddered T-Bill ETF
|
4.0
|
%
|
|
Bloomberg US Large Cap VolMax Autocallable Index
|
1.4
|
%
|
|
First American Government Obligations Fund
|
0.1
|
%
|
WHAT WERE THE FUND COSTS FOR THE LAST SIX MONTHS? (based on a hypothetical $10,000 investment)
|
Fund Name
|
Costs of a $10,000 investment
|
Costs paid as a percentage of a $10,000 investment*
|
|
REX Drone ETF
|
$33
|
0.65%
|
WHAT FACTORS INFLUENCED PERFORMANCE
|
•
|
The Fund seeks targeted exposure to companies that are engaged in drone and unmanned aerial vehicle (UAV) applications across defense and commercial end markets.
|
|
•
|
Performance was driven by the price movement of companies within the drone and unmanned systems theme, including firms involved in UAV manufacturing, components, software, and related services.
|
|
•
|
Sector performance was influenced by shifts in risk sentiment, defense and aerospace industry dynamics, and the pace of adoption of commercial drone use cases.
|
|
•
|
The Fund’s results also reflected broader equity market conditions affecting technology and industrial companies that participate in drone-related growth.
|
|
Top Contributors
|
|
|
↑
|
• Drone and UAV-related companies that appreciated during the period. • Positive developments in defense/commercial adoption and related industry demand. • Broader equity market tailwinds for relevant technology and industrial holdings.
|
|
Top Detractors
|
|
|
↓
|
• Drone and UAV-related companies that declined during the period. • Market volatility and adverse shifts in risk sentiment impacting thematic equities. • Weakness in technology/industrial sectors relevant to the drone ecosystem.
|
KEY FUND STATISTICS (as of June 30, 2026)
|
Net Assets
|
$98,360,761
|
|
Number of Holdings
|
47
|
|
Portfolio Turnover
|
39%
|
WHAT DID THE FUND INVEST IN? (as of June 30, 2026)
Sector Breakdown (% of net assets)
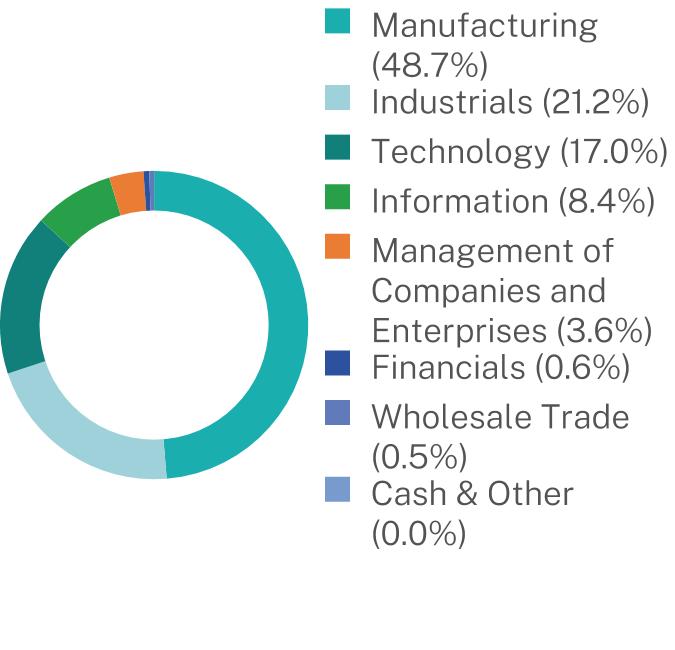
|
Top 10 Issuers
|
(%)
|
|
|
AeroVironment, Inc.
|
14.0
|
%
|
|
Ondas, Inc.
|
12.2
|
%
|
|
Next Vision Stabilized Systems Ltd.
|
11.8
|
%
|
|
DroneShield Ltd.
|
5.3
|
%
|
|
Red Cat Holdings, Inc.
|
5.2
|
%
|
|
Unusual Machines, Inc.
|
4.3
|
%
|
|
Elsight Ltd.
|
4.1
|
%
|
|
Aevex Corp.
|
3.8
|
%
|
|
EHang Holdings Ltd.
|
3.6
|
%
|
|
General Electric Co.
|
2.7
|
%
|
WHAT WERE THE FUND COSTS FOR THE LAST SIX MONTHS? (based on a hypothetical $10,000 investment)
|
Fund Name
|
Costs of a $10,000 investment
|
Costs paid as a percentage of a $10,000 investment*
|
|
REX IncomeMax Option Strategy ETF
|
$72
|
1.33%
|
WHAT FACTORS INFLUENCED PERFORMANCE
|
•
|
The Fund seeks to generate current income through an options-based strategy while maintaining exposure to the equity market.
|
|
•
|
The Fund’s results were influenced by equity market direction and volatility; higher volatility generally increased option premium levels.
|
|
Top Contributors
|
|
|
↑
|
• Income generated from call option premiums. • Equity market exposure during periods of positive performance.
|
|
Top Detractors
|
|
|
↓
|
• Equity market declines during portions of the period.
|
MANAGED DISTRIBUTIONS
The Fund has weekly managed distributions.
KEY FUND STATISTICS (as of June 30, 2026)
|
Net Assets
|
$39,078,215
|
|
Number of Holdings
|
82
|
|
Portfolio Turnover
|
2,815%
|
WHAT DID THE FUND INVEST IN? (as of June 30, 2026)
Security Type Breakdown
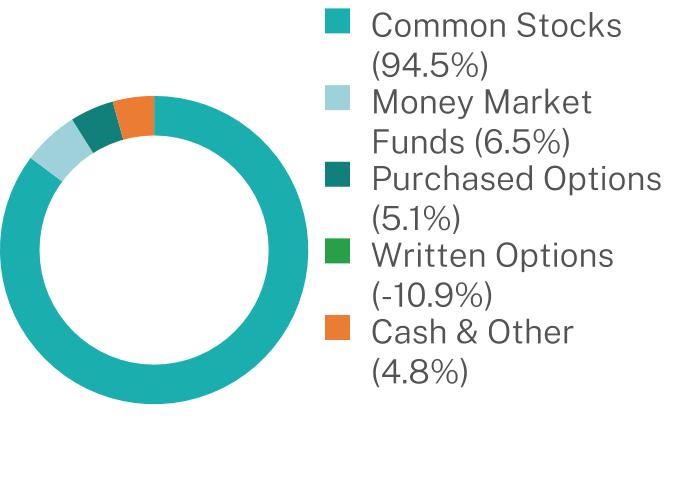
|
Top 10 Issuers
|
(%)
|
|
|
First American Government Obligations Fund
|
6.5
|
%
|
|
FuelCell Energy, Inc.
|
6.3
|
%
|
|
Sandisk Corp.
|
5.2
|
%
|
|
Corning, Inc.
|
5.1
|
%
|
|
Lam Research Corp.
|
5.0
|
%
|
|
Applied Materials, Inc.
|
4.9
|
%
|
|
Nebius Group NV
|
4.9
|
%
|
|
Space Exploration Technologies Corp.
|
4.8
|
%
|
|
Vertiv Holdings Co.
|
4.8
|
%
|
|
Intel Corp.
|
4.7
|
%
|
WHAT WERE THE FUND COSTS FOR THE LAST SIX MONTHS? (based on a hypothetical $10,000 investment)
|
Fund Name
|
Costs of a $10,000 investment
|
Costs paid as a percentage of a $10,000 investment*
|
|
Rex NVDA Growth & Income ETF
|
$123
|
2.39%
|
WHAT FACTORS INFLUENCED PERFORMANCE
|
•
|
The Fund seeks to provide current income and exposure to NVIDIA Corporation (NVDA) through a synthetic long position combined with an option income strategy.
|
|
•
|
Performance was primarily driven by the price movement of NVIDIA Corporation (NVDA) and the income generated from selling call options.
|
|
•
|
Option premium income helped support returns.
|
|
•
|
Periods of declines in NVIDIA Corporation (NVDA) adversely affected results and may not be fully offset by option premium income. The Fund’s results also reflected option roll activity during the period.
|
|
Top Contributors
|
|
|
↑
|
• Synthetic long exposure to NVIDIA Corporation (NVDA) during periods of positive performance. • Call option premium income generated through the Fund’s option income strategy. • Interest earned on collateral and cash equivalents.
|
|
Top Detractors
|
|
|
↓
|
• Declines in NVIDIA Corporation (NVDA) during portions of the period.
|
MANAGED DISTRIBUTIONS
The Fund has weekly managed distributions.
KEY FUND STATISTICS (as of June 30, 2026)
|
Net Assets
|
$103,972,213
|
Portfolio Turnover
|
0%
|
|
|
Number of Holdings
|
5
|
WHAT DID THE FUND INVEST IN? (as of June 30, 2026)
Security Type Breakdown
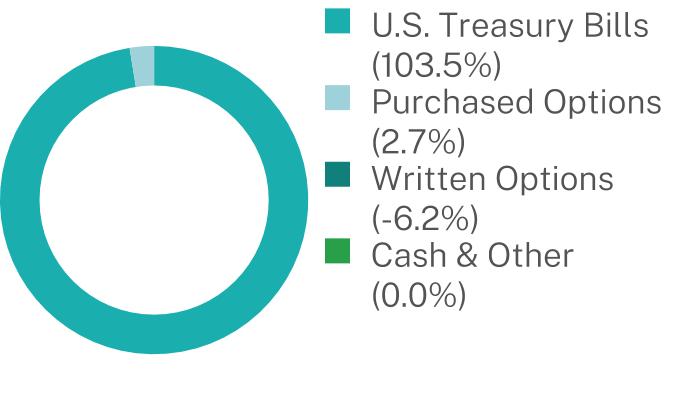
|
Top 10 Issuers
|
(%)
|
|
|
United States Treasury Bill
|
103.5
|
%
|
|
Nvidia Corp.
|
-3.5
|
%
|
WHAT WERE THE FUND COSTS FOR THE LAST SIX MONTHS? (based on a hypothetical $10,000 investment)
|
Fund Name
|
Costs of a $10,000 investment
|
Costs paid as a percentage of a $10,000 investment*
|
|
Rex TSLA Growth & Income ETF
|
$117
|
2.48%
|
WHAT FACTORS INFLUENCED PERFORMANCE
|
•
|
The Fund seeks to provide current income and exposure to Tesla, Inc. (TSLA) through a synthetic long position combined with an option income strategy.
|
|
•
|
Performance was primarily driven by the price movement of Tesla, Inc. (TSLA) and the income generated from selling call options.
|
|
•
|
Option premium income helped support returns.
|
|
•
|
Periods of declines in Tesla, Inc. (TSLA) adversely affected results and may not be fully offset by option premium income. The Fund’s results also reflected option roll activity during the period.
|
|
Top Contributors
|
|
|
↑
|
• Synthetic long exposure to Tesla, Inc. (TSLA) during periods of positive performance. • Call option premium income generated through the Fund’s option income strategy. • Interest earned on collateral and cash equivalents.
|
|
Top Detractors
|
|
|
↓
|
• Declines in Tesla, Inc. (TSLA) during portions of the period.
|
MANAGED DISTRIBUTIONS
The Fund has weekly managed distributions.
KEY FUND STATISTICS (as of June 30, 2026)
|
Net Assets
|
$41,994,674
|
Portfolio Turnover
|
0%
|
|
|
Number of Holdings
|
6
|
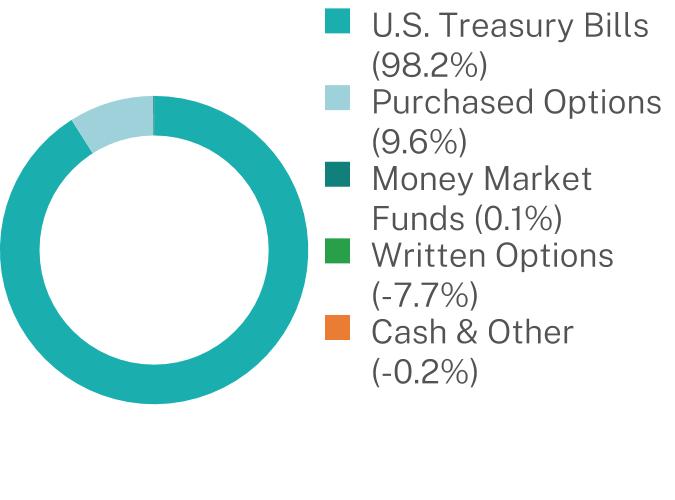
WHAT DID THE FUND INVEST IN? (as of June 30, 2026)
Security Type Breakdown
|
Top 10 Issuers
|
(%)
|
|
|
United States Treasury Bill
|
98.2
|
%
|
|
Tesla, Inc.
|
1.9
|
%
|
|
First American Government Obligations Fund
|
0.1
|
%
|
WHAT WERE THE FUND COSTS FOR THE LAST SIX MONTHS? (based on a hypothetical $10,000 investment)
|
Fund Name
|
Costs of a $10,000 investment
|
Costs paid as a percentage of a $10,000 investment*
|
|
REX WMT Growth & Income ETF
|
$50
|
1.02%
|
WHAT FACTORS INFLUENCED PERFORMANCE
|
•
|
The Fund seeks to provide current income and exposure to Walmart Inc. (WMT) through a synthetic long position combined with an option income strategy.
|
|
•
|
Performance was primarily driven by the price movement of Walmart Inc. (WMT) and the income generated from selling call options.
|
|
•
|
Option premium income helped support returns.
|
|
•
|
Periods of declines in Walmart Inc. (WMT) adversely affected results and may not be fully offset by option premium income. The Fund’s results also reflected option roll activity during the period.
|
|
Top Contributors
|
|
|
↑
|
• Synthetic long exposure to Walmart Inc. (WMT) during periods of positive performance. • Call option premium income generated through the Fund’s option income strategy. • Interest earned on collateral and cash equivalents.
|
|
Top Detractors
|
|
|
↓
|
• Declines in Walmart Inc. (WMT) during portions of the period.
|
MANAGED DISTRIBUTIONS
The Fund has weekly managed distributions.
KEY FUND STATISTICS (as of June 30, 2026)
|
Net Assets
|
$16,348,768
|
|
Number of Holdings
|
5
|
|
Portfolio Turnover
|
0%
|
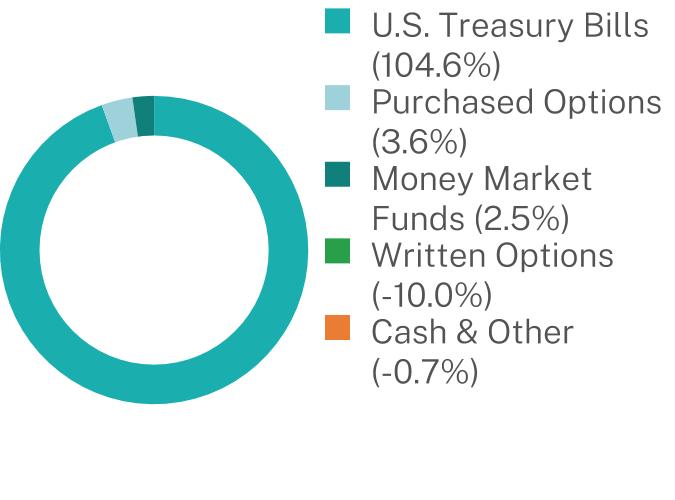
WHAT DID THE FUND INVEST IN? (as of June 30, 2026)
Security Type Breakdown
|
Top 10 Issuers
|
(%)
|
|
|
United States Treasury Bill
|
104.6
|
%
|
|
First American Government Obligations Fund
|
2.5
|
%
|
|
Walmart, Inc.
|
-6.4
|
%
|
WHAT WERE THE FUND COSTS FOR THE LAST SIX MONTHS? (based on a hypothetical $10,000 investment)
|
Fund Name
|
Costs of a $10,000 investment
|
Costs paid as a percentage of a $10,000 investment*,**
|
|
The Laddered T-Bill ETF
|
$9
|
0.20%
|
WHAT FACTORS INFLUENCED PERFORMANCE
|
•
|
The Fund seeks to provide current income consistent with the preservation of capital by investing in a laddered portfolio of short-term U.S. Treasury bills.
|
|
•
|
Performance was primarily driven by the level of short-term U.S. Treasury yields and the income earned across the laddered maturities held by the Fund.
|
|
•
|
The Fund’s results were influenced by the interest rate environment and monetary policy conditions, which affected reinvestment rates as Treasury bills matured and were rolled.
|
|
Top Contributors
|
|
|
↑
|
• Income earned from the Fund’s laddered portfolio of short-term U.S. Treasury bills. • Elevated short-term interest rate levels during the period.
|
|
Top Detractors
|
|
|
↓
|
• Rising short-term interest rates during portions of the period.
|
MANAGED DISTRIBUTIONS
The Fund has weekly managed distributions.
KEY FUND STATISTICS (as of June 30, 2026)
|
Net Assets
|
$6,500,871
|
|
Number of Holdings
|
4
|
|
Portfolio Turnover
|
0%
|
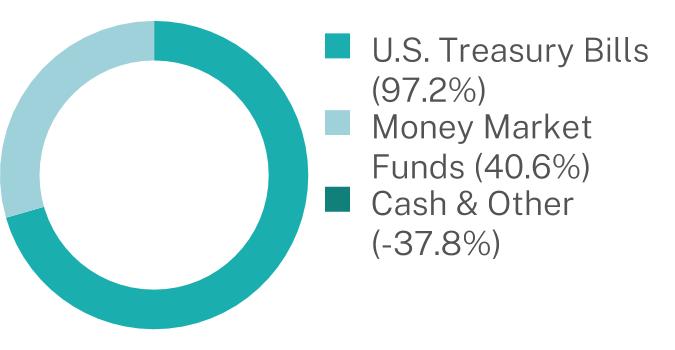
WHAT DID THE FUND INVEST IN? (as of June 30, 2026)
Security Type Breakdown
|
Top 10 Issuers
|
(%)
|
|
|
United States Treasury Bill
|
97.2
|
%
|
|
First American Government Obligations Fund
|
40.6
|
%
|
| [1] |
|
||
| [2] |
|
||
| [3] |
|
||
| [4] |
|
||
| [5] |
|
||
| [6] |
|
||
| [7] |
|
||
| [8] |
|
||
| [9] |
|