Shareholder Report
Jun. 30, 2026
USD ($)
$ / shares
This report describes changes to the Fund that occurred during the reporting period.
WHAT WERE THE FUND COSTS FOR THE PAST YEAR? (based on a hypothetical $10,000 investment)
|
Class Name
|
Costs of a $10,000 investment
|
Costs paid as a percentage of a $10,000 investment
|
|
Class A
|
$121
|
1.15%
|
HOW DID THE FUND PERFORM LAST YEAR AND WHAT AFFECTED ITS PERFORMANCE?
For the 12-month period ended June 30, 2026, the Fund underperformed its benchmark, the S&P 1500® Index, primarily due to stock selection.
PERFORMANCE HIGHLIGHTS
Positive contributions to performance came from the Financials and Consumer Discretionary sectors. Within Financials, the Fund’s investments in banking and market-related businesses did well. The continued drop in short-term interest rates and very strong capital markets activity drove the continued improvement in bank fundamentals. Within Consumer Discretionary, a recovery in travel demand as well as the shift to an asset-light financial model drove strong performance in our investment in the hotel industry.
The Fund’s investments in the Information Technology and Consumer Staples sectors were the primary detractors from performance. The Fund’s investments in Semiconductors were not as robust as the performance for the broader industry. In addition, the Fund’s Software investments lagged due to concerns increasing Artificial Intelligence adoption will disrupt their businesses. As for the Consumer Staples sector, lower pricing driven by increased competition negatively impacted our investment in the Ready-to-Drink Protein Shake business.
|
Top Contributors
|
|
|
↑
|
Financials, Consumer Discretionary
|
|
Top Detractors
|
|
|
↓
|
Information Technology, Consumer Staples
|
POSITIONING
In terms of size allocation, the Fund is overweight large-cap and small-cap companies and underweight mid-cap stocks relative to the benchmark. In terms of style, the Fund is overweight value stocks, underweight core and essentially market weight growth. This is a change from last year, when the Fund’s style allocation was underweight both growth and core.
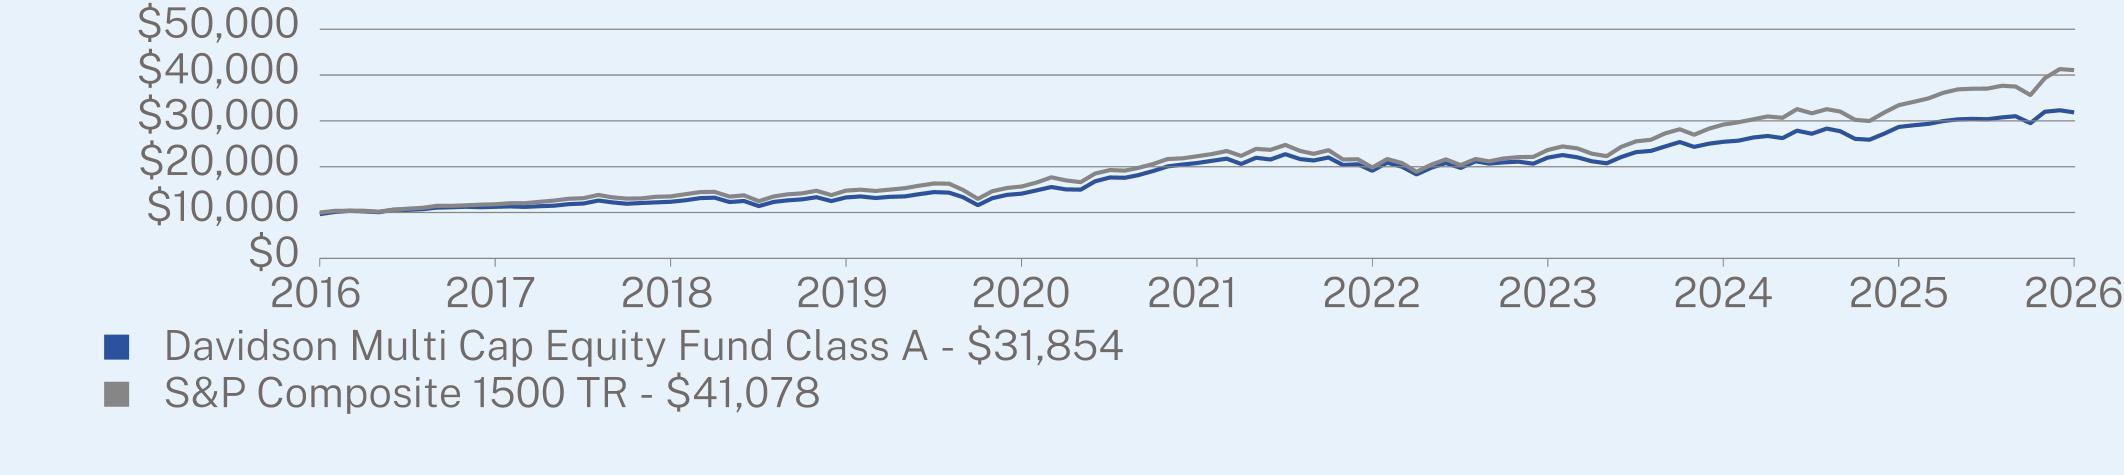
ANNUAL AVERAGE TOTAL RETURN (%)
|
|
1 Year
|
5 Year
|
10 Year
|
|
Class A (without sales charge)
|
11.07
|
8.90
|
12.69
|
|
Class A (with sales charge)
|
7.19
|
8.12
|
12.28
|
|
S&P Composite 1500 TR
|
22.87
|
13.01
|
15.18
|
Visit https://www.davidsonmutualfunds.com for more recent performance information.
KEY FUND STATISTICS (as of June 30, 2026)
|
Net Assets
|
$130,611,163
|
|
Number of Holdings
|
51
|
|
Net Advisory Fee
|
$835,402
|
|
Portfolio Turnover
|
19%
|
WHAT DID THE FUND INVEST IN? (as of June 30, 2026)*
|
Top Sectors
|
(%)
|
|
|
Information Technology
|
30.4
|
%
|
|
Financials
|
11.6
|
%
|
|
Health Care
|
10.8
|
%
|
|
Consumer Discretionary
|
10.7
|
%
|
|
Communication Services
|
10.3
|
%
|
|
Industrials
|
9.4
|
%
|
|
Energy
|
3.9
|
%
|
|
Consumer Staples
|
3.7
|
%
|
|
Real Estate
|
3.4
|
%
|
|
Cash & Other
|
5.8
|
%
|
|
Top Holdings
|
(%)
|
|
|
NVIDIA Corp.
|
5.8
|
%
|
|
Alphabet, Inc. - Class C
|
5.6
|
%
|
|
Amazon.com, Inc.
|
5.0
|
%
|
|
Apple, Inc.
|
4.5
|
%
|
|
Microsoft Corp.
|
4.2
|
%
|
|
Taiwan Semiconductor Manufacturing Co. Ltd.
|
3.9
|
%
|
|
Broadcom, Inc.
|
3.6
|
%
|
|
Citigroup, Inc.
|
3.2
|
%
|
|
Visa, Inc. - Class A
|
2.7
|
%
|
|
Hyatt Hotels Corp. - Class A
|
2.4
|
%
|
This report describes changes to the Fund that occurred during the reporting period.
WHAT WERE THE FUND COSTS FOR THE PAST YEAR? (based on a hypothetical $10,000 investment)
|
Class Name
|
Costs of a $10,000 investment
|
Costs paid as a percentage of a $10,000 investment
|
|
Class I
|
$95
|
0.90%
|
HOW DID THE FUND PERFORM LAST YEAR AND WHAT AFFECTED ITS PERFORMANCE?
For the 12-month period ended June 30, 2026, the Fund underperformed its benchmark, the S&P 1500® Index, primarily due to stock selection.
PERFORMANCE HIGHLIGHTS
Positive contributions to performance came from the Financials and Consumer Discretionary sectors. Within Financials, the Fund’s investments in banking and market-related businesses did well. The continued drop in short-term interest rates and very strong capital markets activity drove the continued improvement in bank fundamentals. Within Consumer Discretionary, a recovery in travel demand as well as the shift to an asset-light financial model drove strong performance in our investment in the hotel industry.
The Fund’s investments in the Information Technology and Consumer Staples sectors were the primary detractors from performance. The Fund’s investments in Semiconductors were not as robust as the performance for the broader industry. In addition, the Fund’s Software investments lagged due to concerns increasing Artificial Intelligence adoption will disrupt their businesses. As for the Consumer Staples sector, lower pricing driven by increased competition negatively impacted our investment in the Ready-to-Drink Protein Shake business.
|
Top Contributors
|
|
|
↑
|
Financials, Consumer Discretionary
|
|
Top Detractors
|
|
|
↓
|
Information Technology, Consumer Staples
|
POSITIONING
In terms of size allocation, the Fund is overweight large-cap and small-cap companies and underweight mid-cap stocks relative to the benchmark. In terms of style, the Fund is overweight value stocks, underweight core and essentially market weight growth. This is a change from last year, when the Fund’s style allocation was underweight both growth and core.
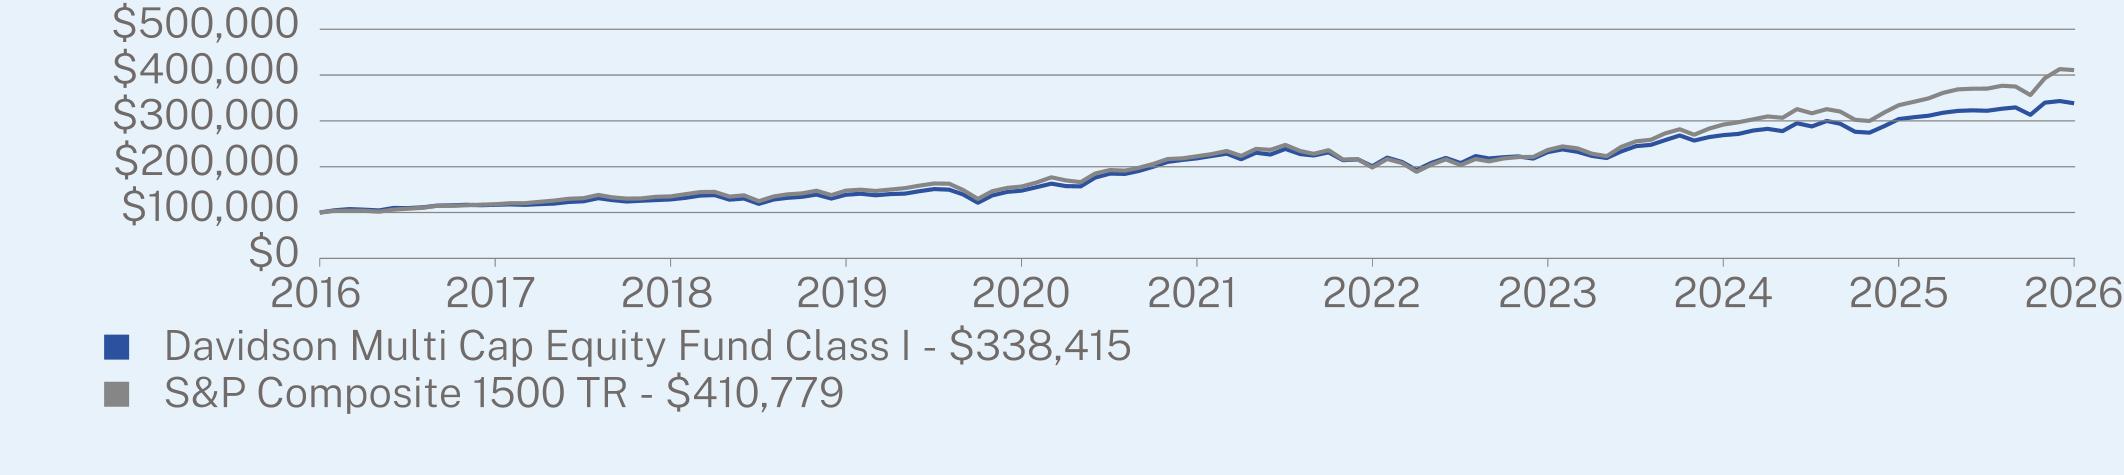
ANNUAL AVERAGE TOTAL RETURN (%)
|
|
1 Year
|
5 Year
|
10 Year
|
|
Class I
|
11.33
|
9.17
|
12.97
|
|
S&P Composite 1500 TR
|
22.87
|
13.01
|
15.18
|
Visit https://www.davidsonmutualfunds.com for more recent performance information.
KEY FUND STATISTICS (as of June 30, 2026)
|
Net Assets
|
$130,611,163
|
|
Number of Holdings
|
51
|
|
Net Advisory Fee
|
$835,402
|
|
Portfolio Turnover
|
19%
|
WHAT DID THE FUND INVEST IN? (as of June 30, 2026)*
|
Top Sectors
|
(%)
|
|
|
Information Technology
|
30.4
|
%
|
|
Financials
|
11.6
|
%
|
|
Health Care
|
10.8
|
%
|
|
Consumer Discretionary
|
10.7
|
%
|
|
Communication Services
|
10.3
|
%
|
|
Industrials
|
9.4
|
%
|
|
Energy
|
3.9
|
%
|
|
Consumer Staples
|
3.7
|
%
|
|
Real Estate
|
3.4
|
%
|
|
Cash & Other
|
5.8
|
%
|
|
Top Holdings
|
(%)
|
|
|
NVIDIA Corp.
|
5.8
|
%
|
|
Alphabet, Inc. - Class C
|
5.6
|
%
|
|
Amazon.com, Inc.
|
5.0
|
%
|
|
Apple, Inc.
|
4.5
|
%
|
|
Microsoft Corp.
|
4.2
|
%
|
|
Taiwan Semiconductor Manufacturing Co. Ltd.
|
3.9
|
%
|
|
Broadcom, Inc.
|
3.6
|
%
|
|
Citigroup, Inc.
|
3.2
|
%
|
|
Visa, Inc. - Class A
|
2.7
|
%
|
|
Hyatt Hotels Corp. - Class A
|
2.4
|
%
|
| [1] |
|
||
| [2] |
|