Shareholder Report
|
12 Months Ended |
|
Jun. 30, 2026
USD ($)
Holding
|
|---|
| Shareholder Report [Line Items] |
|
| Document Type |
N-CSR
|
| Amendment Flag |
false
|
| Registrant Name |
Northern Lights Fund Trust III
|
| Entity Central Index Key |
0001537140
|
| Entity Investment Company Type |
N-1A
|
| Document Period End Date |
Jun. 30, 2026
|
| Shareholder Report Annual or Semi-Annual |
Annual Shareholder Report
|
| C000115777 |
|
| Shareholder Report [Line Items] |
|
| Fund Name |
Swan Defined Risk Fund
|
| Class Name |
Class A
|
| Trading Symbol |
SDRAX
|
| Annual or Semi-Annual Statement [Text Block] |
This annual shareholder report contains important information about Swan Defined Risk Fund for the period of July 1, 2025 to June 30, 2026.
|
| Additional Information [Text Block] |
You can find additional information about the Fund at https://funds.swanglobalinvestments.com/fund_documents/. You can also request this information by contacting us at 1-877-896-2590.
|
| Additional Information Phone Number |
1-877-896-2590
|
| Additional Information Website |
https://funds.swanglobalinvestments.com/fund_documents/
|
| Expenses [Text Block] |
What were the Fund’s costs for the last year?(based on a hypothetical $10,000 investment) Table SummaryClass Name | Costs of a $10,000 investment | Costs paid as a percentage of a $10,000 investment |
|---|
Class A | $155 | 1.45% |
|---|
|
| Expenses Paid, Amount |
$ 155
|
| Expense Ratio, Percent |
1.45%
|
| Factors Affecting Performance [Text Block] |
How did the Fund perform during the reporting period? Overview: For the year ended June 30th, 2026 the S&P 500 posted healthy gains of 22.32%. The year was remarkably similar to the previous year ended June 30th, 2025. For most of the 12 months the S&P 500 marched upwards, setting record highs based upon strong corporate earnings and enthusiasm about A.I. However, both periods were interrupted by turmoil driven by policy disruption. In April 2025 it was the tariffs of “Liberation Day”, in February 2026 it was “Operation Epic Fury” and the Iran war. In both cases the markets sold off sharply but recovered quickly. Over this same year ended June 30th, 2026, the Fund's Class A shares had a return of 13.52%. Compared to the S&P 500’s 22.32%, this represents a capture ratio of 61%, on the higher end of expectations for a hedged equity fund during a strong bull market. Core Equity: The Fund's core equity allocation, which typically comprises approximately 90% of its holdings, is invested in ETFs that track the S&P 500 Index and S&P 500 sectors. This segment of the portfolio returned 21.27% over the past year, performing in line with expectations given the market environment. Hedge: The Fund hedges its equity exposure through the use of put options. Because put options generally move inversely to the equity market, the hedge allocation is expected to generate negative returns during periods of strong market appreciation, such as when the S&P 500 is reaching new all-time highs. Over the past 12 months, the hedge allocation returned -5.74%, a result consistent with its intended role within the portfolio. The benefits of the hedge were demonstrated during the market volatility surrounding the start of the Iran war. As part of its disciplined risk management process, the Fund re-established its hedge in December 2025 by purchasing put options with an average 7,300 strike price. When the S&P 500 declined below 6,500 in March, these options appreciated, helping offset equity losses. During the selloff, the Fund experienced a peak-to-trough decline of -5.29%, compared with the S&P 500's maximum drawdown of -8.89%.As equities subsequently recovered and advanced to new all-time highs, the value of the put options declined, as expected. With the S&P 500 closing at 7,499 on June 30, the Fund's put options remain well positioned to provide meaningful downside protection should market volatility return. Additional Trades: The Fund also engages in shorter-term premium collection strategies designed to help offset the carrying costs of its hedge positions. These strategies generally perform best during periods of relatively low market volatility. With the exception of Operation Epic Fury, the market environment was mostly favorable to these types of trades and this segment of the Fund generated positive returns of 43 basis points over the year ended June 30th, 2026. |
| Performance Past Does Not Indicate Future [Text] |
The Fund’s past performance is not a good predictor of how the Fund will perform in the future.
|
| No Deduction of Taxes [Text Block] |
The graph and table do not reflect the deduction of taxes that a shareholder would pay on fund distributions or redemption of fund shares.
|
| AssetsNet |
$ 589,720,695
|
| Holdings Count | Holding |
25
|
| Advisory Fees Paid, Amount |
$ 6,258,255
|
| InvestmentCompanyPortfolioTurnover |
9.00%
|
| Additional Fund Statistics [Text Block] |
Table SummaryNet Assets | $589,720,695 |
|---|
Number of Portfolio Holdings | 25 |
|---|
Advisory Fee | $6,258,255 |
|---|
Portfolio Turnover | 9% |
|---|
|
| Holdings [Text Block] |
Asset Weighting (% of total investments)Table SummaryValue | Value |
|---|
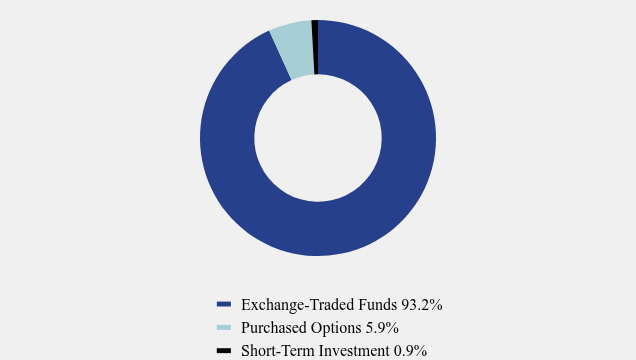
Exchange-Traded Funds | 93.2% | Purchased Options | 5.9% | Short-Term Investment | 0.9% | Asset Weighting (% of net assets)Table SummaryValue | Value |
|---|
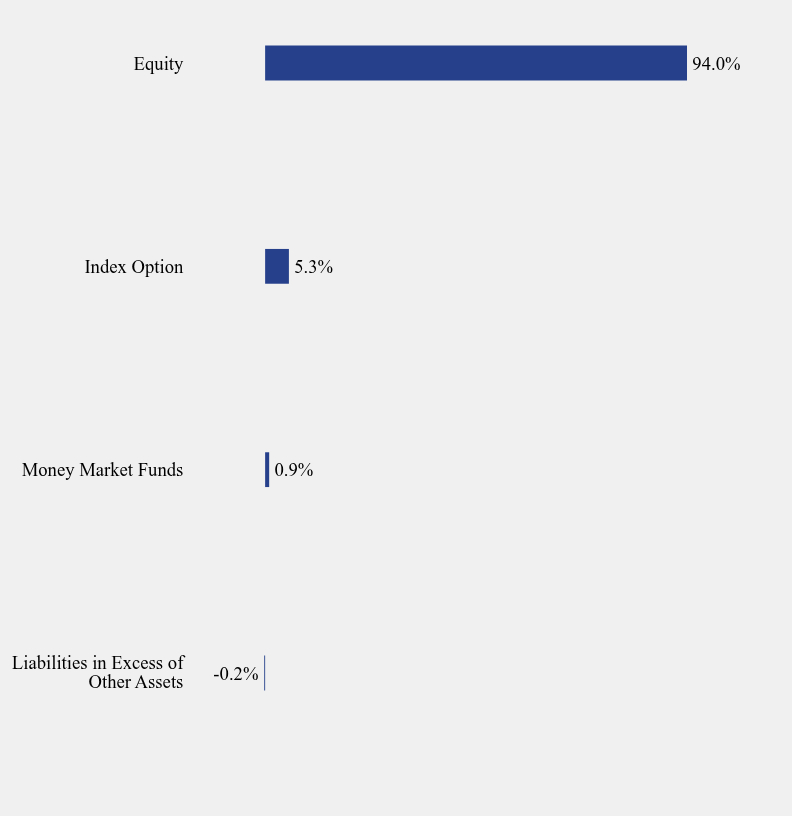
Liabilities in Excess of Other Assets | -0.2% | Money Market Funds | 0.9% | Index Option | 5.3% | Equity | 94.0% | |
| Largest Holdings [Text Block] |
Top 10 Holdings (% of net assets)Table SummaryHolding Name | % of Net Assets |
|---|
iShares Core S&P 500 ETF | 59.4% |
|---|
State Street Technology Select Sector SPDR ETF | 14.0% |
|---|
State Street Financial Select Sector SPDR ETF | 4.0% |
|---|
State Street Consumer Discretionary Select Sector SPDR ETF | 3.1% |
|---|
State Street Health Care Select Sector SPDR ETF | 3.1% |
|---|
S&P 500 Index, 12/17/27 7350.0 Put | 3.1% |
|---|
State Street Industrial Select Sector SPDR ETF | 3.0% |
|---|
State Street Communication Services Select Sector SPDR ETF | 2.7% |
|---|
S&P 500 Index, 12/17/27 7250.0 Put | 2.5% |
|---|
State Street Consumer Staples Select Sector SPDR ETF | 1.6% |
|---|
|
| Material Fund Change [Text Block] |
No material changes occurred during the year ended June 30, 2026. |
| C000115778 |
|
| Shareholder Report [Line Items] |
|
| Fund Name |
Swan Defined Risk Fund
|
| Class Name |
Class C
|
| Trading Symbol |
SDRCX
|
| Annual or Semi-Annual Statement [Text Block] |
This annual shareholder report contains important information about Swan Defined Risk Fund for the period of July 1, 2025 to June 30, 2026.
|
| Additional Information [Text Block] |
You can find additional information about the Fund at https://funds.swanglobalinvestments.com/fund_documents/. You can also request this information by contacting us at 1-877-896-2590.
|
| Additional Information Phone Number |
1-877-896-2590
|
| Additional Information Website |
https://funds.swanglobalinvestments.com/fund_documents/
|
| Expenses [Text Block] |
What were the Fund’s costs for the last year?(based on a hypothetical $10,000 investment) Table SummaryClass Name | Costs of a $10,000 investment | Costs paid as a percentage of a $10,000 investment |
|---|
Class C | $234 | 2.20% |
|---|
|
| Expenses Paid, Amount |
$ 234
|
| Expense Ratio, Percent |
2.20%
|
| Factors Affecting Performance [Text Block] |
How did the Fund perform during the reporting period? Overview: For the year ended June 30th, 2026 the S&P 500 posted healthy gains of 22.32%. The year was remarkably similar to the previous year ended June 30th, 2025. For most of the 12 months the S&P 500 marched upwards, setting record highs based upon strong corporate earnings and enthusiasm about A.I. However, both periods were interrupted by turmoil driven by policy disruption. In April 2025 it was the tariffs of “Liberation Day”, in February 2026 it was “Operation Epic Fury” and the Iran war. In both cases the markets sold off sharply but recovered quickly. Over this same year ended June 30th, 2026, the Fund's Class C shares had a return of 12.64%. Compared to the S&P 500’s 22.32%, this represents a capture ratio of 57%, in line with expectations for a hedged equity fund during a strong bull market. Core Equity: The Fund's core equity allocation, which typically comprises approximately 90% of its holdings, is invested in ETFs that track the S&P 500 Index and S&P 500 sectors. This segment of the portfolio returned 21.27% over the past year, performing in line with expectations given the market environment. Hedge: The Fund hedges its equity exposure through the use of put options. Because put options generally move inversely to the equity market, the hedge allocation is expected to generate negative returns during periods of strong market appreciation, such as when the S&P 500 is reaching new all-time highs. Over the past 12 months, the hedge allocation returned -5.74%, a result consistent with its intended role within the portfolio. The benefits of the hedge were demonstrated during the market volatility surrounding the start of the Iran war. As part of its disciplined risk management process, the Fund re-established its hedge in December 2025 by purchasing put options with an average 7,300 strike price. When the S&P 500 declined below 6,500 in March, these options appreciated, helping offset equity losses. During the selloff, the Fund experienced a peak-to-trough decline of -5.29%, compared with the S&P 500's maximum drawdown of -8.89%. As equities subsequently recovered and advanced to new all-time highs, the value of the put options declined, as expected. With the S&P 500 closing at 7,499 on June 30, the Fund's put options remain well positioned to provide meaningful downside protection should market volatility return. Additional Trades: The Fund also engages in shorter-term premium collection strategies designed to help offset the carrying costs of its hedge positions. These strategies generally perform best during periods of relatively low market volatility. With the exception of Operation Epic Fury, the market environment was mostly favorable to these types of trades and this segment of the Fund generated positive returns of 43 basis points over the year ended June 30th, 2026. |
| Performance Past Does Not Indicate Future [Text] |
The Fund’s past performance is not a good predictor of how the Fund will perform in the future.
|
| No Deduction of Taxes [Text Block] |
The graph and table do not reflect the deduction of taxes that a shareholder would pay on fund distributions or redemption of fund shares.
|
| AssetsNet |
$ 589,720,695
|
| Holdings Count | Holding |
25
|
| Advisory Fees Paid, Amount |
$ 6,258,255
|
| InvestmentCompanyPortfolioTurnover |
9.00%
|
| Additional Fund Statistics [Text Block] |
Table SummaryNet Assets | $589,720,695 |
|---|
Number of Portfolio Holdings | 25 |
|---|
Advisory Fee | $6,258,255 |
|---|
Portfolio Turnover | 9% |
|---|
|
| Holdings [Text Block] |
Asset Weighting (% of total investments)Table SummaryValue | Value |
|---|
Exchange-Traded Funds | 93.2% | Purchased Options | 5.9% | Short-Term Investment | 0.9% | Asset Weighting (% of net assets)Table SummaryValue | Value |
|---|
Liabilities in Excess of Other Assets | -0.2% | Money Market Funds | 0.9% | Index Option | 5.3% | Equity | 94.0% | |
| Largest Holdings [Text Block] |
Top 10 Holdings (% of net assets)Table SummaryHolding Name | % of Net Assets |
|---|
iShares Core S&P 500 ETF | 59.4% |
|---|
State Street Technology Select Sector SPDR ETF | 14.0% |
|---|
State Street Financial Select Sector SPDR ETF | 4.0% |
|---|
State Street Consumer Discretionary Select Sector SPDR ETF | 3.1% |
|---|
State Street Health Care Select Sector SPDR ETF | 3.1% |
|---|
S&P 500 Index, 12/17/27 7350.0 Put | 3.1% |
|---|
State Street Industrial Select Sector SPDR ETF | 3.0% |
|---|
State Street Communication Services Select Sector SPDR ETF | 2.7% |
|---|
S&P 500 Index, 12/17/27 7250.0 Put | 2.5% |
|---|
State Street Consumer Staples Select Sector SPDR ETF | 1.6% |
|---|
|
| Material Fund Change [Text Block] |
No material changes occurred during the year ended June 30, 2026. |
| C000115779 |
|
| Shareholder Report [Line Items] |
|
| Fund Name |
Swan Defined Risk Fund
|
| Class Name |
Class I
|
| Trading Symbol |
SDRIX
|
| Annual or Semi-Annual Statement [Text Block] |
This annual shareholder report contains important information about Swan Defined Risk Fund for the period of July 1, 2025 to June 30, 2026.
|
| Additional Information [Text Block] |
You can find additional information about the Fund at https://funds.swanglobalinvestments.com/fund_documents/. You can also request this information by contacting us at 1-877-896-2590.
|
| Additional Information Phone Number |
1-877-896-2590
|
| Additional Information Website |
https://funds.swanglobalinvestments.com/fund_documents/
|
| Expenses [Text Block] |
What were the Fund’s costs for the last year?(based on a hypothetical $10,000 investment) Table SummaryClass Name | Costs of a $10,000 investment | Costs paid as a percentage of a $10,000 investment |
|---|
Class I | $128 | 1.20% |
|---|
|
| Expenses Paid, Amount |
$ 128
|
| Expense Ratio, Percent |
1.20%
|
| Factors Affecting Performance [Text Block] |
How did the Fund perform during the reporting period? Overview: For the year ended June 30th, 2026 the S&P 500 posted healthy gains of 22.32%. The year was remarkably similar to the previous year ended June 30th, 2025. For most of the 12 months the S&P 500 marched upwards, setting record highs based upon strong corporate earnings and enthusiasm about A.I. However, both periods were interrupted by turmoil driven by policy disruption. In April 2025 it was the tariffs of “Liberation Day”, in February 2026 it was “Operation Epic Fury” and the Iran war. In both cases the markets sold off sharply but recovered quickly. Over this same year ended June 30th, 2026, the Fund's Class I shares had a return of 13.79%. Compared to the S&P 500’s 22.32%, this represents a capture ratio of 62%, on the higher end of expectations for a hedged equity fund during a strong bull market. Core Equity: The Fund's core equity allocation, which typically comprises approximately 90% of its holdings, is invested in ETFs that track the S&P 500 Index and S&P 500 sectors. This segment of the portfolio returned 21.27% over the past year, performing in line with expectations given the market environment. Hedge: The Fund hedges its equity exposure through the use of put options. Because put options generally move inversely to the equity market, the hedge allocation is expected to generate negative returns during periods of strong market appreciation, such as when the S&P 500 is reaching new all-time highs. Over the past 12 months, the hedge allocation returned -5.74%, a result consistent with its intended role within the portfolio. The benefits of the hedge were demonstrated during the market volatility surrounding the start of the Iran war. As part of its disciplined risk management process, the Fund re-established its hedge in December 2025 by purchasing put options with an average 7,300 strike price. When the S&P 500 declined below 6,500 in March, these options appreciated, helping offset equity losses. During the selloff, the Fund experienced a peak-to-trough decline of -5.29%, compared with the S&P 500's maximum drawdown of -8.89%. As equities subsequently recovered and advanced to new all-time highs, the value of the put options declined, as expected. With the S&P 500 closing at 7,499 on June 30, the Fund's put options remain well positioned to provide meaningful downside protection should market volatility return. Additional Trades: The Fund also engages in shorter-term premium collection strategies designed to help offset the carrying costs of its hedge positions. These strategies generally perform best during periods of relatively low market volatility. With the exception of Operation Epic Fury, the market environment was mostly favorable to these types of trades and this segment of the Fund generated positive returns of 43 basis points over the year ended June 30th, 2026. |
| Performance Past Does Not Indicate Future [Text] |
The Fund’s past performance is not a good predictor of how the Fund will perform in the future.
|
| No Deduction of Taxes [Text Block] |
The graph and table do not reflect the deduction of taxes that a shareholder would pay on fund distributions or redemption of fund shares.
|
| AssetsNet |
$ 589,720,695
|
| Holdings Count | Holding |
25
|
| Advisory Fees Paid, Amount |
$ 6,258,255
|
| InvestmentCompanyPortfolioTurnover |
9.00%
|
| Additional Fund Statistics [Text Block] |
Table SummaryNet Assets | $589,720,695 |
|---|
Number of Portfolio Holdings | 25 |
|---|
Advisory Fee | $6,258,255 |
|---|
Portfolio Turnover | 9% |
|---|
|
| Holdings [Text Block] |
Asset Weighting (% of total investments)Table SummaryValue | Value |
|---|
Exchange-Traded Funds | 93.2% | Purchased Options | 5.9% | Short-Term Investment | 0.9% | Asset Weighting (% of net assets)Table SummaryValue | Value |
|---|
Liabilities in Excess of Other Assets | -0.2% | Money Market Funds | 0.9% | Index Option | 5.3% | Equity | 94.0% | |
| Largest Holdings [Text Block] |
Top 10 Holdings (% of net assets)Table SummaryHolding Name | % of Net Assets |
|---|
iShares Core S&P 500 ETF | 59.4% |
|---|
State Street Technology Select Sector SPDR ETF | 14.0% |
|---|
State Street Financial Select Sector SPDR ETF | 4.0% |
|---|
State Street Consumer Discretionary Select Sector SPDR ETF | 3.1% |
|---|
State Street Health Care Select Sector SPDR ETF | 3.1% |
|---|
S&P 500 Index, 12/17/27 7350.0 Put | 3.1% |
|---|
State Street Industrial Select Sector SPDR ETF | 3.0% |
|---|
State Street Communication Services Select Sector SPDR ETF | 2.7% |
|---|
S&P 500 Index, 12/17/27 7250.0 Put | 2.5% |
|---|
State Street Consumer Staples Select Sector SPDR ETF | 1.6% |
|---|
|
| Material Fund Change [Text Block] |
No material changes occurred during the year ended June 30, 2026. |
| C000205842 |
|
| Shareholder Report [Line Items] |
|
| Fund Name |
Swan Defined Risk Growth Fund
|
| Class Name |
Class A
|
| Trading Symbol |
SDAAX
|
| Annual or Semi-Annual Statement [Text Block] |
This annual shareholder report contains important information about Swan Defined Risk Growth Fund for the period of July 1, 2025 to June 30, 2026.
|
| Additional Information [Text Block] |
You can find additional information about the Fund at https://funds.swanglobalinvestments.com/fund_documents/. You can also request this information by contacting us at 1-877-896-2590.
|
| Additional Information Phone Number |
1-877-896-2590
|
| Additional Information Website |
https://funds.swanglobalinvestments.com/fund_documents/
|
| Expenses [Text Block] |
What were the Fund’s costs for the last year?(based on a hypothetical $10,000 investment) Table SummaryClass Name | Costs of a $10,000 investment | Costs paid as a percentage of a $10,000 investment |
|---|
Class A | $178 | 1.65% |
|---|
|
| Expenses Paid, Amount |
$ 178
|
| Expense Ratio, Percent |
1.65%
|
| Factors Affecting Performance [Text Block] |
How did the Fund perform during the reporting period? Overview: The Fund typically purchases put options that are “out of the money” rather than “in the money.” While this approach provides less immediate downside risk mitigation - requiring the market to decline further before the put options begin to offset losses - it also allows the Fund to capture more upside during rising markets. As markets experienced significant swings over the past year, this tradeoff played out largely as expected, with the Fund participating more fully in market advances while providing downside mitigation after more meaningful declines. For the year ended June 30th, 2026, the Fund's Class A shares had a return of 15.61%. Compared to the S&P 500’s return of 22.32%, this equates to a capture ratio of 70%. This is on the higher end of expectations for the Fund. Core Equity: The S&P 500-based ETFs and the call spread trades representing the core equity exposure tracked the market down and up over the last year, posting a 23.40% return. Call spreads are a trade that can augment upside capture if the markets rally. With a strong bull market as a tailwind, the call spread trades pushed the core equity performance above and beyond the 22.32% return of the S&P 500. Hedge: The Fund completed its annual re-hedge process and entered 2026 with put option hedges that were out of the money, carrying an average strike price of 6,980. During the market selloff in March, driven by the Iran war, the S&P 500 declined below 6,500, causing the Fund's put options to move slightly “in the money” and appreciate in value. However, as markets subsequently recovered and advanced, the value of the put options declined. Over the one-year ended June 30, 2026, the Fund's hedge allocation returned -5.16%, reflecting the cost of maintaining downside protection during a period in which the market ultimately rebounded to new highs. Additional Trades: The third component of the Fund consists of shorter-term option strategies designed to generate premium income and help offset the carrying costs of the Fund's hedge positions. These strategies generally perform best in relatively stable market environments. However, the sharp increase in volatility during March 2026, including the market's rapid decline followed by an equally swift recovery, created a particularly challenging backdrop. The Fund eked out a small gain of 10 basis points over the year ended June 30, 2026. |
| Performance Past Does Not Indicate Future [Text] |
The Fund’s past performance is not a good predictor of how the Fund will perform in the future.
|
| Performance Inception Date |
Dec. 27, 2018
|
| No Deduction of Taxes [Text Block] |
The graph and table do not reflect the deduction of taxes that a shareholder would pay on fund distributions or redemption of fund shares.
|
| AssetsNet |
$ 59,189,865
|
| Holdings Count | Holding |
21
|
| Advisory Fees Paid, Amount |
$ 513,532
|
| InvestmentCompanyPortfolioTurnover |
14.00%
|
| Additional Fund Statistics [Text Block] |
- Net Assets$59,189,865
- Number of Portfolio Holdings21
- Advisory Fee (net of waivers)$513,532
- Portfolio Turnover14%
|
| Holdings [Text Block] |
Asset Weighting (% of total investments)Table SummaryValue | Value |
|---|
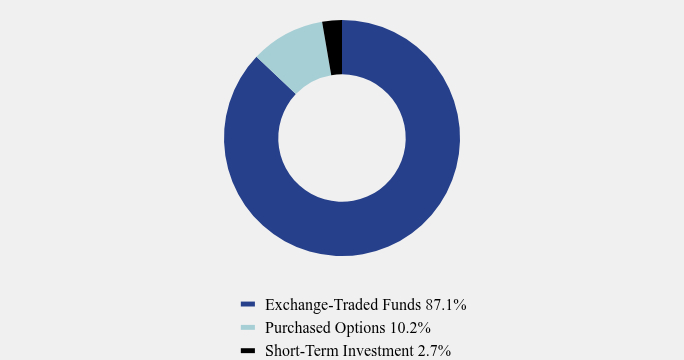
Exchange-Traded Funds | 87.1% | Purchased Options | 10.2% | Short-Term Investment | 2.7% | Asset Weighting (% of net assets)Table SummaryValue | Value |
|---|
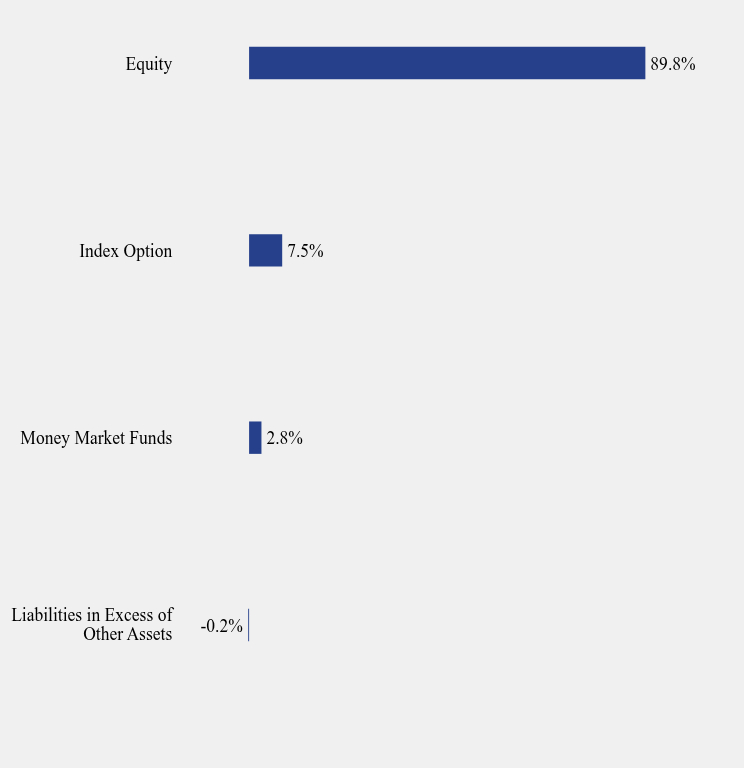
Liabilities in Excess of Other Assets | -0.2% | Money Market Funds | 2.8% | Index Option | 7.5% | Equity | 89.8% | |
| Largest Holdings [Text Block] |
Top 10 Holdings (% of net assets)Table SummaryHolding Name | % of Net Assets |
|---|
iShares Core S&P 500 ETF | 89.8% |
|---|
S&P 500 Index, 12/17/27 7500.0 Call | 5.8% |
|---|
S&P 500 Index, 12/17/27 7050.0 Put | 2.3% |
|---|
First American Government Obligations Fund | 1.8% |
|---|
S&P 500 Index, 12/17/27 6900.0 Put | 1.8% |
|---|
Goldman Sachs Financial Square - Treasury Instruments Fund | 1.0% |
|---|
S&P 500 Index, 08/14/26 7100.0 Put | 0.1% |
|---|
S&P 500 Index, 12/17/27 6400.0 Put | 0.1% |
|---|
S&P 500 Index, 08/07/26 7100.0 Put | 0.1% |
|---|
Cboe Volatility Index, 07/22/26 17.5 Put | 0.1% |
|---|
|
| Material Fund Change [Text Block] |
No material changes occurred during the year ended June 30, 2026. |
| C000205843 |
|
| Shareholder Report [Line Items] |
|
| Fund Name |
Swan Defined Risk Growth Fund
|
| Class Name |
Class C
|
| Trading Symbol |
SDACX
|
| Annual or Semi-Annual Statement [Text Block] |
This annual shareholder report contains important information about Swan Defined Risk Growth Fund for the period of July 1, 2025 to June 30, 2026.
|
| Additional Information [Text Block] |
You can find additional information about the Fund at https://funds.swanglobalinvestments.com/fund_documents/. You can also request this information by contacting us at 1-877-896-2590.
|
| Additional Information Phone Number |
1-877-896-2590
|
| Additional Information Website |
https://funds.swanglobalinvestments.com/fund_documents/
|
| Expenses [Text Block] |
What were the Fund’s costs for the last year?(based on a hypothetical $10,000 investment) Table SummaryClass Name | Costs of a $10,000 investment | Costs paid as a percentage of a $10,000 investment |
|---|
Class C | $258 | 2.40% |
|---|
|
| Expenses Paid, Amount |
$ 258
|
| Expense Ratio, Percent |
2.40%
|
| Factors Affecting Performance [Text Block] |
How did the Fund perform during the reporting period? Overview: The Fund typically purchases put options that are “out of the money” rather than “in the money.” While this approach provides less immediate downside risk mitigation - requiring the market to decline further before the put options begin to offset losses - it also allows the Fund to capture more upside during rising markets. As markets experienced significant swings over the past year, this tradeoff played out largely as expected, with the Fund participating more fully in market advances while providing downside mitigation after more meaningful declines. For the year ended June 30th, 2026, the Fund's Class C shares had a return of 14.76%. Compared to the S&P 500’s return of 22.32%, this equates to a capture ratio of 66%. This is in-line with expectations for the Fund. Core Equity: The S&P 500-based ETFs and the call spread trades representing the core equity exposure tracked the market down and up over the last year, posting a 23.40% return. Call spreads are a trade that can augment upside capture if the markets rally. With a strong bull market as a tailwind, the call spread trades pushed the core equity performance above and beyond the 22.32% return of the S&P 500. Hedge: The Fund completed its annual re-hedge process and entered 2026 with put option hedges that were out of the money, carrying an average strike price of 6,980. During the market selloff in March, driven by the Iran war, the S&P 500 declined below 6,500, causing the Fund's put options to move slightly “in the money” and appreciate in value. However, as markets subsequently recovered and advanced, the value of the put options declined. Over the one-year ended June 30, 2026, the Fund's hedge allocation returned -5.16%, reflecting the cost of maintaining downside protection during a period in which the market ultimately rebounded to new highs. Additional Trades: The third component of the Fund consists of shorter-term option strategies designed to generate premium income and help offset the carrying costs of the Fund's hedge positions. These strategies generally perform best in relatively stable market environments. However, the sharp increase in volatility during March 2026, including the market's rapid decline followed by an equally swift recovery, created a particularly challenging backdrop. The Fund eked out a small gain of 10 basis points over the year ended June 30, 2026. |
| Performance Past Does Not Indicate Future [Text] |
The Fund’s past performance is not a good predictor of how the Fund will perform in the future.
|
| Performance Inception Date |
Dec. 27, 2018
|
| No Deduction of Taxes [Text Block] |
The graph and table do not reflect the deduction of taxes that a shareholder would pay on fund distributions or redemption of fund shares.
|
| AssetsNet |
$ 59,189,865
|
| Holdings Count | Holding |
21
|
| Advisory Fees Paid, Amount |
$ 513,532
|
| InvestmentCompanyPortfolioTurnover |
14.00%
|
| Additional Fund Statistics [Text Block] |
- Net Assets$59,189,865
- Number of Portfolio Holdings21
- Advisory Fee (net of waivers)$513,532
- Portfolio Turnover14%
|
| Holdings [Text Block] |
Asset Weighting (% of total investments)Table SummaryValue | Value |
|---|
Exchange-Traded Funds | 87.1% | Purchased Options | 10.2% | Short-Term Investment | 2.7% | Asset Weighting (% of net assets)Table SummaryValue | Value |
|---|
Liabilities in Excess of Other Assets | -0.2% | Money Market Funds | 2.8% | Index Option | 7.5% | Equity | 89.8% | |
| Largest Holdings [Text Block] |
Top 10 Holdings (% of net assets)Table SummaryHolding Name | % of Net Assets |
|---|
iShares Core S&P 500 ETF | 89.8% |
|---|
S&P 500 Index, 12/17/27 7500.0 Call | 5.8% |
|---|
S&P 500 Index, 12/17/27 7050.0 Put | 2.3% |
|---|
First American Government Obligations Fund | 1.8% |
|---|
S&P 500 Index, 12/17/27 6900.0 Put | 1.8% |
|---|
Goldman Sachs Financial Square - Treasury Instruments Fund | 1.0% |
|---|
S&P 500 Index, 08/14/26 7100.0 Put | 0.1% |
|---|
S&P 500 Index, 12/17/27 6400.0 Put | 0.1% |
|---|
S&P 500 Index, 08/07/26 7100.0 Put | 0.1% |
|---|
Cboe Volatility Index, 07/22/26 17.5 Put | 0.1% |
|---|
|
| Material Fund Change [Text Block] |
No material changes occurred during the year ended June 30, 2026. |
| C000205844 |
|
| Shareholder Report [Line Items] |
|
| Fund Name |
Swan Defined Risk Growth Fund
|
| Class Name |
Class I
|
| Trading Symbol |
SDAIX
|
| Annual or Semi-Annual Statement [Text Block] |
This annual shareholder report contains important information about Swan Defined Risk Growth Fund for the period of July 1, 2025 to June 30, 2026.
|
| Additional Information [Text Block] |
You can find additional information about the Fund at https://funds.swanglobalinvestments.com/fund_documents/. You can also request this information by contacting us at 1-877-896-2590.
|
| Additional Information Phone Number |
1-877-896-2590
|
| Additional Information Website |
https://funds.swanglobalinvestments.com/fund_documents/
|
| Expenses [Text Block] |
What were the Fund’s costs for the last year?(based on a hypothetical $10,000 investment) Table SummaryClass Name | Costs of a $10,000 investment | Costs paid as a percentage of a $10,000 investment |
|---|
Class I | $151 | 1.40% |
|---|
|
| Expenses Paid, Amount |
$ 151
|
| Expense Ratio, Percent |
1.40%
|
| Factors Affecting Performance [Text Block] |
How did the Fund perform during the reporting period? Overview: The Fund typically purchases put options that are “out of the money” rather than “in the money.” While this approach provides less immediate downside risk mitigation - requiring the market to decline further before the put options begin to offset losses - it also allows the Fund to capture more upside during rising markets. As markets experienced significant swings over the past year, this tradeoff played out largely as expected, with the Fund participating more fully in market advances while providing downside mitigation after more meaningful declines. For the year ended June 30th, 2026, the Fund's Class I shares had a return of 15.99%. Compared to the S&P 500’s return of 22.32%, this equates to a capture ratio of 72%. This is on the higher end of expectations for the Fund. Core Equity: The S&P 500-based ETFs and the call spread trades representing the core equity exposure tracked the market down and up over the last year, posting a 23.40% return. Call spreads are a trade that can augment upside capture if the markets rally. With a strong bull market as a tailwind, the call spread trades pushed the core equity performance above and beyond the 22.32% return of the S&P 500. Hedge: The Fund completed its annual re-hedge process and entered 2026 with put option hedges that were out of the money, carrying an average strike price of 6,980. During the market selloff in March, driven by the Iran war, the S&P 500 declined below 6,500, causing the Fund's put options to move slightly “in the money” and appreciate in value. However, as markets subsequently recovered and advanced, the value of the put options declined. Over the one-year ended June 30, 2026, the Fund's hedge allocation returned -5.16%, reflecting the cost of maintaining downside protection during a period in which the market ultimately rebounded to new highs. Additional Trades: The third component of the Fund consists of shorter-term option strategies designed to generate premium income and help offset the carrying costs of the Fund's hedge positions. These strategies generally perform best in relatively stable market environments. However, the sharp increase in volatility during March 2026, including the market's rapid decline followed by an equally swift recovery, created a particularly challenging backdrop. The Fund eked out a small gain of 10 basis points over the year ended June 30, 2026. |
| Performance Past Does Not Indicate Future [Text] |
The Fund’s past performance is not a good predictor of how the Fund will perform in the future.
|
| Performance Inception Date |
Dec. 27, 2018
|
| No Deduction of Taxes [Text Block] |
The graph and table do not reflect the deduction of taxes that a shareholder would pay on fund distributions or redemption of fund shares.
|
| AssetsNet |
$ 59,189,865
|
| Holdings Count | Holding |
21
|
| Advisory Fees Paid, Amount |
$ 513,532
|
| InvestmentCompanyPortfolioTurnover |
14.00%
|
| Additional Fund Statistics [Text Block] |
- Net Assets$59,189,865
- Number of Portfolio Holdings21
- Advisory Fee (net of waivers)$513,532
- Portfolio Turnover14%
|
| Holdings [Text Block] |
Asset Weighting (% of total investments)Table SummaryValue | Value |
|---|
Exchange-Traded Funds | 87.1% | Purchased Options | 10.2% | Short-Term Investment | 2.7% | Asset Weighting (% of net assets)Table SummaryValue | Value |
|---|
Liabilities in Excess of Other Assets | -0.2% | Money Market Funds | 2.8% | Index Option | 7.5% | Equity | 89.8% | |
| Largest Holdings [Text Block] |
Top 10 Holdings (% of net assets)Table SummaryHolding Name | % of Net Assets |
|---|
iShares Core S&P 500 ETF | 89.8% |
|---|
S&P 500 Index, 12/17/27 7500.0 Call | 5.8% |
|---|
S&P 500 Index, 12/17/27 7050.0 Put | 2.3% |
|---|
First American Government Obligations Fund | 1.8% |
|---|
S&P 500 Index, 12/17/27 6900.0 Put | 1.8% |
|---|
Goldman Sachs Financial Square - Treasury Instruments Fund | 1.0% |
|---|
S&P 500 Index, 08/14/26 7100.0 Put | 0.1% |
|---|
S&P 500 Index, 12/17/27 6400.0 Put | 0.1% |
|---|
S&P 500 Index, 08/07/26 7100.0 Put | 0.1% |
|---|
Cboe Volatility Index, 07/22/26 17.5 Put | 0.1% |
|---|
|
| Material Fund Change [Text Block] |
No material changes occurred during the year ended June 30, 2026. |