| Class name | Costs of a $10,000 investment | Costs paid as a percentage of a $10,000 investment (annualized) |
|---|---|---|
| Class A | $63 | 1.20% |
The share class had a 11.49% total return in the six months ended June 30, 2026, compared with the FTSE Global Core Infrastructure 50/50 Net Tax Index, which returned 10.66%, and the MSCI World Index - net, which returned 9.69%.
Security selection in midstream energy contributed to relative performance compared with the FTSE Global Core Infrastructure 50/50 Net Tax Index. Contributors included a large overweight in The Williams Companies, a U.S.-based natural gas pipeline operator, which rose materially on expansion projects and improved operational efficiencies to better monetize growing natural gas demand. Stock selection in electric utilities also contributed, led by an overweight investment in Entergy Corporation. The company secured an expanded agreement with Meta for a Louisiana data center campus, increasing investment in power generation and grid infrastructure, while insulating other customers from the related costs. Stock selection in marine ports further contributed, driven by an overweight investment in International Container Terminal Services. The stock outperformed as earnings have consistently exceeded analysts' expectations, while the company continues to pursue accretive mergers and acquisitions.
Stock selection in the gas distribution sector detracted from relative performance, with an overweight investment in China-based ENN Energy Holdings declining after a planned takeover failed to materialize and lower-than-expected earnings and macroeconomic headwinds added pressure. An allocation to environmental services also detracted, with Cleanaway Waste Management delivering disappointing guidance. Security selection in the communications sector detracted, largely due to a lack of exposure to satellite operator Viasat. The company recently benefited from rising satellite enthusiasm following SpaceX's initial public offering, as well as the potential spinoff of its defense business.
Top contributors |
Top detractors |
|---|---|
Midstream |
Gas Distribution |
Electric |
Environmental Services |
Marine Ports |
Communications |
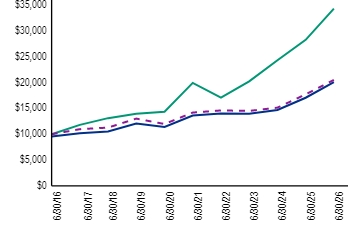
(as of June 30, 2026)
| 1 Year | 5 Years | 10 Years | |
|---|---|---|---|
| With sales charge1 | 12.35% | 7.10% | 7.23% |
| Without sales charge | 17.65% | 8.09% | 7.73% |
| MSCI World Index - net | 21.34% | 11.47% | 13.14% |
| FTSE Global Core Infrastructure 50/50 Net Tax Index |
15.78% | 7.65% | 7.47% |
| Net assets | $1,125,342,558 |
|---|---|
| Number of portfolio holdings (excluding derivatives) | |
| Portfolio turnover rate2 | 39% |
| Top ten holdings3,4 | (%) |
|---|---|
| NextEra Energy, Inc. | |
| Williams Cos., Inc. | |
| TC Energy Corp. | |
| Entergy Corp. | |
| Union Pacific Corp. | |
| CSX Corp. | |
| American Electric Power Co., Inc. | |
| National Grid PLC | |
| Norfolk Southern Corp. | |
| Targa Resources Corp. |
| Sector diversification3,5 | (%) |
|---|---|
| Electric | |
| Midstream | |
| Railways | |
| Airports | |
| Gas Distribution | |
| Marine Ports | |
| Communications | |
| Toll Roads | |
| Environmental Services | |
| Other (includes short-term investments) |
| Country diversification3,5 | (%) |
|---|---|
| United States | |
| Canada | |
| Australia | |
| Japan | |
| Spain | |
| India | |
| United Kingdom | |
| Brazil | |
| Philippines | |
| Other (includes short-term investments) |
| Top ten holdings3,4 | (%) |
|---|---|
| NextEra Energy, Inc. | |
| Williams Cos., Inc. | |
| TC Energy Corp. | |
| Entergy Corp. | |
| Union Pacific Corp. | |
| CSX Corp. | |
| American Electric Power Co., Inc. | |
| National Grid PLC | |
| Norfolk Southern Corp. | |
| Targa Resources Corp. |
This is a summary of certain material changes to the Fund since January 1, 2026. For more complete information, you may review the Fund's current prospectus, which is available upon request by calling 1-800-330-7348.
How has the Fund changed?
Changes to Fund's principal investment strategy
On December 9, 2025, the Fund's Board approved a change to the Fund's principal investment strategy regarding the Fund's minimum investment in non-U.S. securities, effective May 1, 2026, as follows:
Under normal market conditions, the Fund invests at least the lesser of (i) 40% of its total assets or (ii) the percentage of non-U.S. companies in the index designated by the Fund as its current benchmark, the FTSE Global Core Infrastructure 50/50 Net Tax Index, minus 10%, in companies organized or located outside the U.S. or doing a substantial amount of business outside of the U.S.
Prior to May 1, 2026, under normal market conditions, the Fund invests at least 40%, unless market conditions are not deemed favorable by the investment advisor, in which case the Fund would invest at least 30%, of its total assets in companies organized or located outside the U.S. or doing a substantial amount of business outside of the U.S.
Under normal market conditions, the Fund invests at least the lesser of (i) 40% of its total assets or (ii) the percentage of non-U.S. companies in the index designated by the Fund as its current benchmark, the FTSE Global Core Infrastructure 50/50 Net Tax Index, minus 10%, in companies organized or located outside the U.S. or doing a substantial amount of business outside of the U.S.
Prior to May 1, 2026, under normal market conditions, the Fund invests at least 40%, unless market conditions are not deemed favorable by the investment advisor, in which case the Fund would invest at least 30%, of its total assets in companies organized or located outside the U.S. or doing a substantial amount of business outside of the U.S.
| Class name | Costs of a $10,000 investment | Costs paid as a percentage of a $10,000 investment (annualized) |
|---|---|---|
| Class C | $97 | 1.85% |
The share class had a 11.15% total return in the six months ended June 30, 2026, compared with the FTSE Global Core Infrastructure 50/50 Net Tax Index, which returned 10.66%, and the MSCI World Index - net, which returned 9.69%.
Security selection in midstream energy contributed to relative performance compared with the FTSE Global Core Infrastructure 50/50 Net Tax Index. Contributors included a large overweight in The Williams Companies, a U.S.-based natural gas pipeline operator, which rose materially on expansion projects and improved operational efficiencies to better monetize growing natural gas demand. Stock selection in electric utilities also contributed, led by an overweight investment in Entergy Corporation. The company secured an expanded agreement with Meta for a Louisiana data center campus, increasing investment in power generation and grid infrastructure, while insulating other customers from the related costs. Stock selection in marine ports further contributed, driven by an overweight investment in International Container Terminal Services. The stock outperformed as earnings have consistently exceeded analysts' expectations, while the company continues to pursue accretive mergers and acquisitions.
Stock selection in the gas distribution sector detracted from relative performance, with an overweight investment in China-based ENN Energy Holdings declining after a planned takeover failed to materialize and lower-than-expected earnings and macroeconomic headwinds added pressure. An allocation to environmental services also detracted, with Cleanaway Waste Management delivering disappointing guidance. Security selection in the communications sector detracted, largely due to a lack of exposure to satellite operator Viasat. The company recently benefited from rising satellite enthusiasm following SpaceX's initial public offering, as well as the potential spinoff of its defense business.
Top contributors |
Top detractors |
|---|---|
Midstream |
Gas Distribution |
Electric |
Environmental Services |
Marine Ports |
Communications |
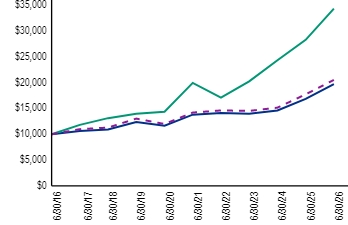
(as of June 30, 2026)
| 1 Year | 5 Years | 10 Years | |
|---|---|---|---|
| With sales charge | 15.89%1 | 7.39% | 7.03% |
| Without sales charge | 16.89% | 7.39% | 7.03% |
| MSCI World Index - net | 21.34% | 11.47% | 13.14% |
| FTSE Global Core Infrastructure 50/50 Net Tax Index |
15.78% | 7.65% | 7.47% |
| Net assets | $1,125,342,558 |
|---|---|
| Number of portfolio holdings (excluding derivatives) | |
| Portfolio turnover rate2 | 39% |
| Top ten holdings3,4 | (%) |
|---|---|
| NextEra Energy, Inc. | |
| Williams Cos., Inc. | |
| TC Energy Corp. | |
| Entergy Corp. | |
| Union Pacific Corp. | |
| CSX Corp. | |
| American Electric Power Co., Inc. | |
| National Grid PLC | |
| Norfolk Southern Corp. | |
| Targa Resources Corp. |
| Sector diversification3,5 | (%) |
|---|---|
| Electric | |
| Midstream | |
| Railways | |
| Airports | |
| Gas Distribution | |
| Marine Ports | |
| Communications | |
| Toll Roads | |
| Environmental Services | |
| Other (includes short-term investments) |
| Country diversification3,5 | (%) |
|---|---|
| United States | |
| Canada | |
| Australia | |
| Japan | |
| Spain | |
| India | |
| United Kingdom | |
| Brazil | |
| Philippines | |
| Other (includes short-term investments) |
| Top ten holdings3,4 | (%) |
|---|---|
| NextEra Energy, Inc. | |
| Williams Cos., Inc. | |
| TC Energy Corp. | |
| Entergy Corp. | |
| Union Pacific Corp. | |
| CSX Corp. | |
| American Electric Power Co., Inc. | |
| National Grid PLC | |
| Norfolk Southern Corp. | |
| Targa Resources Corp. |
This is a summary of certain material changes to the Fund since January 1, 2026. For more complete information, you may review the Fund's current prospectus, which is available upon request by calling 1-800-330-7348.
How has the Fund changed?
Changes to Fund's principal investment strategy
On December 9, 2025, the Fund's Board approved a change to the Fund's principal investment strategy regarding the Fund's minimum investment in non-U.S. securities, effective May 1, 2026, as follows:
Under normal market conditions, the Fund invests at least the lesser of (i) 40% of its total assets or (ii) the percentage of non-U.S. companies in the index designated by the Fund as its current benchmark, the FTSE Global Core Infrastructure 50/50 Net Tax Index, minus 10%, in companies organized or located outside the U.S. or doing a substantial amount of business outside of the U.S.
Prior to May 1, 2026, under normal market conditions, the Fund invests at least 40%, unless market conditions are not deemed favorable by the investment advisor, in which case the Fund would invest at least 30%, of its total assets in companies organized or located outside the U.S. or doing a substantial amount of business outside of the U.S.
Under normal market conditions, the Fund invests at least the lesser of (i) 40% of its total assets or (ii) the percentage of non-U.S. companies in the index designated by the Fund as its current benchmark, the FTSE Global Core Infrastructure 50/50 Net Tax Index, minus 10%, in companies organized or located outside the U.S. or doing a substantial amount of business outside of the U.S.
Prior to May 1, 2026, under normal market conditions, the Fund invests at least 40%, unless market conditions are not deemed favorable by the investment advisor, in which case the Fund would invest at least 30%, of its total assets in companies organized or located outside the U.S. or doing a substantial amount of business outside of the U.S.
| Class name | Costs of a $10,000 investment | Costs paid as a percentage of a $10,000 investment (annualized) |
|---|---|---|
| Class I | $45 | 0.85% |
The share class had a 11.67% total return in the six months ended June 30, 2026, compared with the FTSE Global Core Infrastructure 50/50 Net Tax Index, which returned 10.66%, and the MSCI World Index - net, which returned 9.69%.
Security selection in midstream energy contributed to relative performance compared with the FTSE Global Core Infrastructure 50/50 Net Tax Index. Contributors included a large overweight in The Williams Companies, a U.S.-based natural gas pipeline operator, which rose materially on expansion projects and improved operational efficiencies to better monetize growing natural gas demand. Stock selection in electric utilities also contributed, led by an overweight investment in Entergy Corporation. The company secured an expanded agreement with Meta for a Louisiana data center campus, increasing investment in power generation and grid infrastructure, while insulating other customers from the related costs. Stock selection in marine ports further contributed, driven by an overweight investment in International Container Terminal Services. The stock outperformed as earnings have consistently exceeded analysts' expectations, while the company continues to pursue accretive mergers and acquisitions.
Stock selection in the gas distribution sector detracted from relative performance, with an overweight investment in China-based ENN Energy Holdings declining after a planned takeover failed to materialize and lower-than-expected earnings and macroeconomic headwinds added pressure. An allocation to environmental services also detracted, with Cleanaway Waste Management delivering disappointing guidance. Security selection in the communications sector detracted, largely due to a lack of exposure to satellite operator Viasat. The company recently benefited from rising satellite enthusiasm following SpaceX's initial public offering, as well as the potential spinoff of its defense business.
Top contributors |
Top detractors |
|---|---|
Midstream |
Gas Distribution |
Electric |
Environmental Services |
Marine Ports |
Communications |
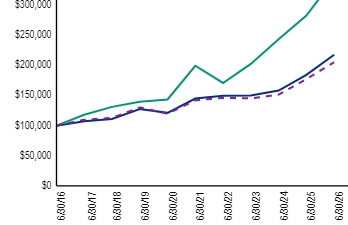
(as of June 30, 2026)
| 1 Year | 5 Years | 10 Years | |
|---|---|---|---|
| Class I1 | 18.02% | 8.46% | 8.10% |
| MSCI World Index - net | 21.34% | 11.47% | 13.14% |
| FTSE Global Core Infrastructure 50/50 Net Tax Index |
15.78% | 7.65% | 7.47% |
| Net assets | $1,125,342,558 |
|---|---|
| Number of portfolio holdings (excluding derivatives) | |
| Portfolio turnover rate2 | 39% |
| Top ten holdings3,4 | (%) |
|---|---|
| NextEra Energy, Inc. | |
| Williams Cos., Inc. | |
| TC Energy Corp. | |
| Entergy Corp. | |
| Union Pacific Corp. | |
| CSX Corp. | |
| American Electric Power Co., Inc. | |
| National Grid PLC | |
| Norfolk Southern Corp. | |
| Targa Resources Corp. |
| Sector diversification3,5 | (%) |
|---|---|
| Electric | |
| Midstream | |
| Railways | |
| Airports | |
| Gas Distribution | |
| Marine Ports | |
| Communications | |
| Toll Roads | |
| Environmental Services | |
| Other (includes short-term investments) |
| Country diversification3,5 | (%) |
|---|---|
| United States | |
| Canada | |
| Australia | |
| Japan | |
| Spain | |
| India | |
| United Kingdom | |
| Brazil | |
| Philippines | |
| Other (includes short-term investments) |
| Top ten holdings3,4 | (%) |
|---|---|
| NextEra Energy, Inc. | |
| Williams Cos., Inc. | |
| TC Energy Corp. | |
| Entergy Corp. | |
| Union Pacific Corp. | |
| CSX Corp. | |
| American Electric Power Co., Inc. | |
| National Grid PLC | |
| Norfolk Southern Corp. | |
| Targa Resources Corp. |
This is a summary of certain material changes to the Fund since January 1, 2026. For more complete information, you may review the Fund's current prospectus, which is available upon request by calling 1-800-330-7348.
How has the Fund changed?
Changes to Fund's principal investment strategy
On December 9, 2025, the Fund's Board approved a change to the Fund's principal investment strategy regarding the Fund's minimum investment in non-U.S. securities, effective May 1, 2026, as follows:
Under normal market conditions, the Fund invests at least the lesser of (i) 40% of its total assets or (ii) the percentage of non-U.S. companies in the index designated by the Fund as its current benchmark, the FTSE Global Core Infrastructure 50/50 Net Tax Index, minus 10%, in companies organized or located outside the U.S. or doing a substantial amount of business outside of the U.S.
Prior to May 1, 2026, under normal market conditions, the Fund invests at least 40%, unless market conditions are not deemed favorable by the investment advisor, in which case the Fund would invest at least 30%, of its total assets in companies organized or located outside the U.S. or doing a substantial amount of business outside of the U.S.
Under normal market conditions, the Fund invests at least the lesser of (i) 40% of its total assets or (ii) the percentage of non-U.S. companies in the index designated by the Fund as its current benchmark, the FTSE Global Core Infrastructure 50/50 Net Tax Index, minus 10%, in companies organized or located outside the U.S. or doing a substantial amount of business outside of the U.S.
Prior to May 1, 2026, under normal market conditions, the Fund invests at least 40%, unless market conditions are not deemed favorable by the investment advisor, in which case the Fund would invest at least 30%, of its total assets in companies organized or located outside the U.S. or doing a substantial amount of business outside of the U.S.
| Class name | Costs of a $10,000 investment | Costs paid as a percentage of a $10,000 investment (annualized) |
|---|---|---|
| Class R | $71 | 1.35% |
The share class had a 11.36% total return in the six months ended June 30, 2026, compared with the FTSE Global Core Infrastructure 50/50 Net Tax Index, which returned 10.66%, and the MSCI World Index - net, which returned 9.69%.
Security selection in midstream energy contributed to relative performance compared with the FTSE Global Core Infrastructure 50/50 Net Tax Index. Contributors included a large overweight in The Williams Companies, a U.S.-based natural gas pipeline operator, which rose materially on expansion projects and improved operational efficiencies to better monetize growing natural gas demand. Stock selection in electric utilities also contributed, led by an overweight investment in Entergy Corporation. The company secured an expanded agreement with Meta for a Louisiana data center campus, increasing investment in power generation and grid infrastructure, while insulating other customers from the related costs. Stock selection in marine ports further contributed, driven by an overweight investment in International Container Terminal Services. The stock outperformed as earnings have consistently exceeded analysts' expectations, while the company continues to pursue accretive mergers and acquisitions.
Stock selection in the gas distribution sector detracted from relative performance, with an overweight investment in China-based ENN Energy Holdings declining after a planned takeover failed to materialize and lower-than-expected earnings and macroeconomic headwinds added pressure. An allocation to environmental services also detracted, with Cleanaway Waste Management delivering disappointing guidance. Security selection in the communications sector detracted, largely due to a lack of exposure to satellite operator Viasat. The company recently benefited from rising satellite enthusiasm following SpaceX's initial public offering, as well as the potential spinoff of its defense business.
Top contributors |
Top detractors |
|---|---|
Midstream |
Gas Distribution |
Electric |
Environmental Services |
Marine Ports |
Communications |
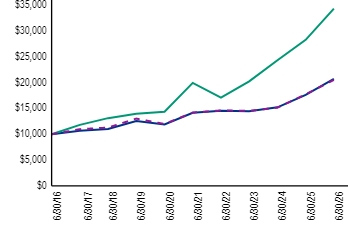
(as of June 30, 2026)
| 1 Year | 5 Years | 10 Years | |
|---|---|---|---|
| Class R1 | 17.45% | 7.92% | 7.56% |
| MSCI World Index - net | 21.34% | 11.47% | 13.14% |
| FTSE Global Core Infrastructure 50/50 Net Tax Index |
15.78% | 7.65% | 7.47% |
| Net assets | $1,125,342,558 |
|---|---|
| Number of portfolio holdings (excluding derivatives) | |
| Portfolio turnover rate2 | 39% |
| Top ten holdings3,4 | (%) |
|---|---|
| NextEra Energy, Inc. | |
| Williams Cos., Inc. | |
| TC Energy Corp. | |
| Entergy Corp. | |
| Union Pacific Corp. | |
| CSX Corp. | |
| American Electric Power Co., Inc. | |
| National Grid PLC | |
| Norfolk Southern Corp. | |
| Targa Resources Corp. |
| Sector diversification3,5 | (%) |
|---|---|
| Electric | |
| Midstream | |
| Railways | |
| Airports | |
| Gas Distribution | |
| Marine Ports | |
| Communications | |
| Toll Roads | |
| Environmental Services | |
| Other (includes short-term investments) |
| Country diversification3,5 | (%) |
|---|---|
| United States | |
| Canada | |
| Australia | |
| Japan | |
| Spain | |
| India | |
| United Kingdom | |
| Brazil | |
| Philippines | |
| Other (includes short-term investments) |
| Top ten holdings3,4 | (%) |
|---|---|
| NextEra Energy, Inc. | |
| Williams Cos., Inc. | |
| TC Energy Corp. | |
| Entergy Corp. | |
| Union Pacific Corp. | |
| CSX Corp. | |
| American Electric Power Co., Inc. | |
| National Grid PLC | |
| Norfolk Southern Corp. | |
| Targa Resources Corp. |
This is a summary of certain material changes to the Fund since January 1, 2026. For more complete information, you may review the Fund's current prospectus, which is available upon request by calling 1-800-330-7348.
How has the Fund changed?
Changes to Fund's principal investment strategy
On December 9, 2025, the Fund's Board approved a change to the Fund's principal investment strategy regarding the Fund's minimum investment in non-U.S. securities, effective May 1, 2026, as follows:
Under normal market conditions, the Fund invests at least the lesser of (i) 40% of its total assets or (ii) the percentage of non-U.S. companies in the index designated by the Fund as its current benchmark, the FTSE Global Core Infrastructure 50/50 Net Tax Index, minus 10%, in companies organized or located outside the U.S. or doing a substantial amount of business outside of the U.S.
Prior to May 1, 2026, under normal market conditions, the Fund invests at least 40%, unless market conditions are not deemed favorable by the investment advisor, in which case the Fund would invest at least 30%, of its total assets in companies organized or located outside the U.S. or doing a substantial amount of business outside of the U.S.
Under normal market conditions, the Fund invests at least the lesser of (i) 40% of its total assets or (ii) the percentage of non-U.S. companies in the index designated by the Fund as its current benchmark, the FTSE Global Core Infrastructure 50/50 Net Tax Index, minus 10%, in companies organized or located outside the U.S. or doing a substantial amount of business outside of the U.S.
Prior to May 1, 2026, under normal market conditions, the Fund invests at least 40%, unless market conditions are not deemed favorable by the investment advisor, in which case the Fund would invest at least 30%, of its total assets in companies organized or located outside the U.S. or doing a substantial amount of business outside of the U.S.
| Class name | Costs of a $10,000 investment | Costs paid as a percentage of a $10,000 investment (annualized) |
|---|---|---|
| Class Z | $45 | 0.85% |
The share class had a 11.67% total return in the six months ended June 30, 2026, compared with the FTSE Global Core Infrastructure 50/50 Net Tax Index, which returned 10.66%, and the MSCI World Index - net, which returned 9.69%.
Security selection in midstream energy contributed to relative performance compared with the FTSE Global Core Infrastructure 50/50 Net Tax Index. Contributors included a large overweight in The Williams Companies, a U.S.-based natural gas pipeline operator, which rose materially on expansion projects and improved operational efficiencies to better monetize growing natural gas demand. Stock selection in electric utilities also contributed, led by an overweight investment in Entergy Corporation. The company secured an expanded agreement with Meta for a Louisiana data center campus, increasing investment in power generation and grid infrastructure, while insulating other customers from the related costs. Stock selection in marine ports further contributed, driven by an overweight investment in International Container Terminal Services. The stock outperformed as earnings have consistently exceeded analysts' expectations, while the company continues to pursue accretive mergers and acquisitions.
Stock selection in the gas distribution sector detracted from relative performance, with an overweight investment in China-based ENN Energy Holdings declining after a planned takeover failed to materialize and lower-than-expected earnings and macroeconomic headwinds added pressure. An allocation to environmental services also detracted, with Cleanaway Waste Management delivering disappointing guidance. Security selection in the communications sector detracted, largely due to a lack of exposure to satellite operator Viasat. The company recently benefited from rising satellite enthusiasm following SpaceX's initial public offering, as well as the potential spinoff of its defense business.
Top contributors |
Top detractors |
|---|---|
Midstream |
Gas Distribution |
Electric |
Environmental Services |
Marine Ports |
Communications |
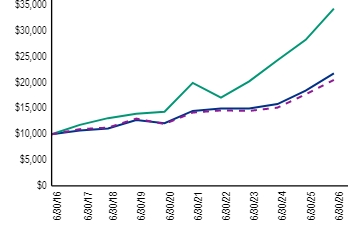
(as of June 30, 2026)
| 1 Year | 5 Years | 10 Years | |
|---|---|---|---|
| Class Z1 | 18.02% | 8.46% | 8.11% |
| MSCI World Index - net | 21.34% | 11.47% | 13.14% |
| FTSE Global Core Infrastructure 50/50 Net Tax Index |
15.78% | 7.65% | 7.47% |
| Net assets | $1,125,342,558 |
|---|---|
| Number of portfolio holdings (excluding derivatives) | |
| Portfolio turnover rate2 | 39% |
| Top ten holdings3,4 | (%) |
|---|---|
| NextEra Energy, Inc. | |
| Williams Cos., Inc. | |
| TC Energy Corp. | |
| Entergy Corp. | |
| Union Pacific Corp. | |
| CSX Corp. | |
| American Electric Power Co., Inc. | |
| National Grid PLC | |
| Norfolk Southern Corp. | |
| Targa Resources Corp. |
| Sector diversification3,5 | (%) |
|---|---|
| Electric | |
| Midstream | |
| Railways | |
| Airports | |
| Gas Distribution | |
| Marine Ports | |
| Communications | |
| Toll Roads | |
| Environmental Services | |
| Other (includes short-term investments) |
| Country diversification3,5 | (%) |
|---|---|
| United States | |
| Canada | |
| Australia | |
| Japan | |
| Spain | |
| India | |
| United Kingdom | |
| Brazil | |
| Philippines | |
| Other (includes short-term investments) |
| Top ten holdings3,4 | (%) |
|---|---|
| NextEra Energy, Inc. | |
| Williams Cos., Inc. | |
| TC Energy Corp. | |
| Entergy Corp. | |
| Union Pacific Corp. | |
| CSX Corp. | |
| American Electric Power Co., Inc. | |
| National Grid PLC | |
| Norfolk Southern Corp. | |
| Targa Resources Corp. |
This is a summary of certain material changes to the Fund since January 1, 2026. For more complete information, you may review the Fund's current prospectus, which is available upon request by calling 1-800-330-7348.
How has the Fund changed?
Changes to Fund's principal investment strategy
On December 9, 2025, the Fund's Board approved a change to the Fund's principal investment strategy regarding the Fund's minimum investment in non-U.S. securities, effective May 1, 2026, as follows:
Under normal market conditions, the Fund invests at least the lesser of (i) 40% of its total assets or (ii) the percentage of non-U.S. companies in the index designated by the Fund as its current benchmark, the FTSE Global Core Infrastructure 50/50 Net Tax Index, minus 10%, in companies organized or located outside the U.S. or doing a substantial amount of business outside of the U.S.
Prior to May 1, 2026, under normal market conditions, the Fund invests at least 40%, unless market conditions are not deemed favorable by the investment advisor, in which case the Fund would invest at least 30%, of its total assets in companies organized or located outside the U.S. or doing a substantial amount of business outside of the U.S.
Under normal market conditions, the Fund invests at least the lesser of (i) 40% of its total assets or (ii) the percentage of non-U.S. companies in the index designated by the Fund as its current benchmark, the FTSE Global Core Infrastructure 50/50 Net Tax Index, minus 10%, in companies organized or located outside the U.S. or doing a substantial amount of business outside of the U.S.
Prior to May 1, 2026, under normal market conditions, the Fund invests at least 40%, unless market conditions are not deemed favorable by the investment advisor, in which case the Fund would invest at least 30%, of its total assets in companies organized or located outside the U.S. or doing a substantial amount of business outside of the U.S.