Shareholder Report
Jun. 30, 2026
USD ($)
$ / shares
WHAT WERE THE FUND COSTS FOR THE LAST SIX MONTHS? (based on a hypothetical $10,000 investment)
|
Class Name
|
Costs of a $10,000 investment
|
Costs paid as a percentage of a $10,000 investment*
|
|
Class A
|
$65
|
1.25%
|
HOW DID THE FUND PERFORM AND WHAT AFFECTED ITS PERFORMANCE?
For the six-month period ended June 30, 2026, the Fund generated a positive absolute return of 10.59% but underperformed its benchmark, the FTSE Global Core Infrastructure 50/50 Index, which returned 11.11% over the same period.
WHAT FACTORS INFLUENCED PERFORMANCE
Sector contributors to relative performance during the period included:
|
•
|
Ports: An overweight position in an outperforming independent terminal operator contributed to relative performance. The company reported positive Earnings Before Interest, Taxes, Depreciation and Amortization (EBITDA), with management noting that performance was supported by recently added terminals and stable performance among existing assets.
|
|
•
|
Toll Roads: A combination of underweight exposure to the underperforming sector, along with positive security selection contributed to relative performance. The timing of select overweight positions contributed positively.
|
|
•
|
Data Centers: A non-index position contributed positively as data centers rebounded during the period.
|
Sector detractors from relative performance during the period included:
|
•
|
Airports: Overweight exposure to select global airports was the leading detractor from relative performance. The sector lagged the broader infrastructure universe amid lower passenger traffic from the Middle East conflict. The events in Mexico during February also pressured operators in the region.
|
|
•
|
Electricity Transmission & Distribution: Security selection among U.S. and Brazilian stocks in the sector detracted from relative returns.
|
|
•
|
Rail: Overweight positions in select underperforming Brazilian and Japanese rail operators detracted from relative performance during the period.
|
POSITIONING
The potential for earnings growth in the utility sector remained underpinned by grid investment tied to artificial intelligence compute demand, electrification, and industrial reshoring. U.S. power consumption forecasts continued to move higher, with commercial demand growth outpacing residential demand for the first time on record. Within communications infrastructure, while uncertainties persist around organic tower leasing trends, new investment opportunities emerged around AI-driven mobile data growth, 6G preparation and edge computing. Lastly, despite muted near-term performance for energy midstream, long-term fundamentals continued to strengthen across the sector. The U.S. has become the world’s largest liquefied natural gas (LNG) exporter and the primary source of new global gas supply growth, with the Gulf Coast as the epicenter of that build-out, while growing data center demand was durable new source of gas offtake.
|
Top Contributors
|
|
|
↑
|
Ports
|
|
↑
|
Toll Roads
|
|
Top Detractors
|
|
|
↓
|
Global Airports
|
|
↓
|
U.S. and Brazilian Transmission & Distribution Utilities
|
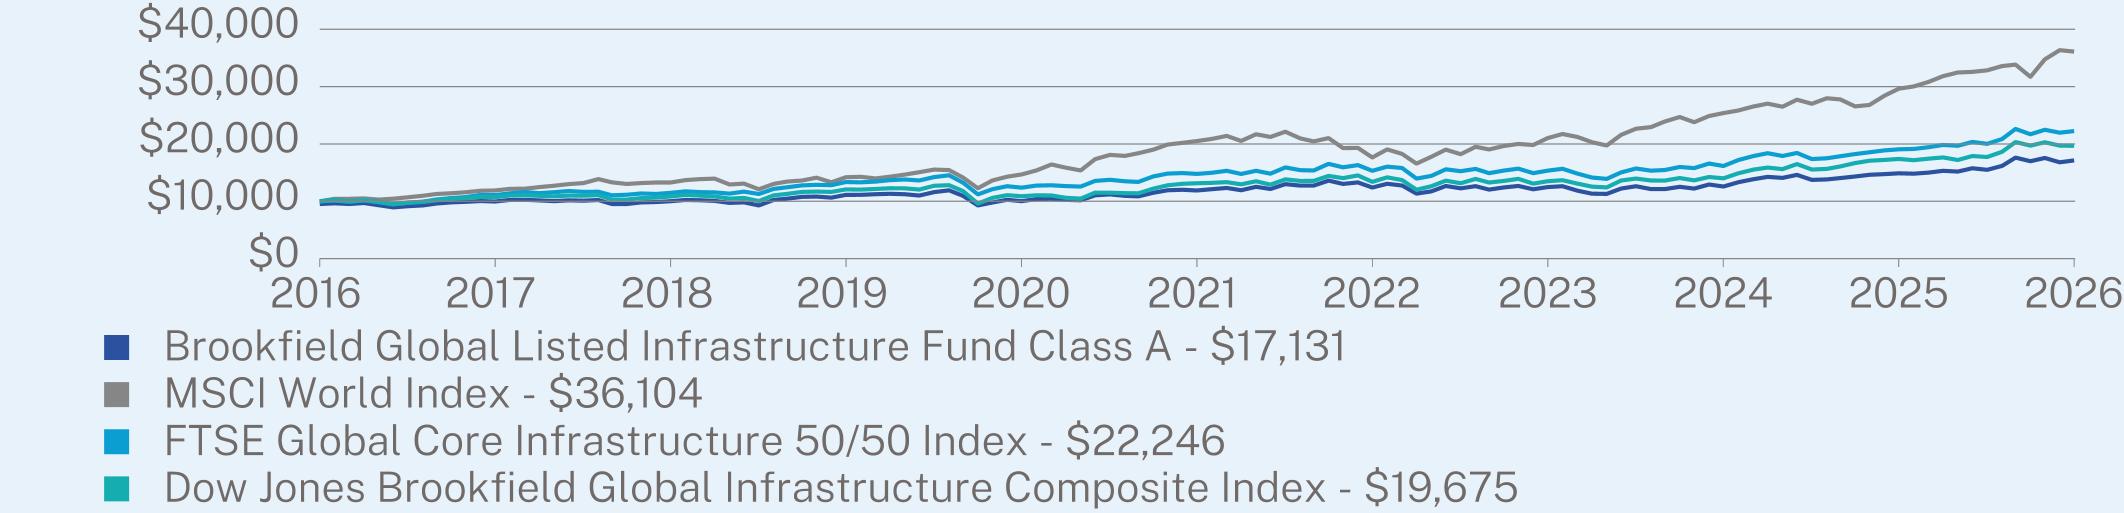
ANNUAL AVERAGE TOTAL RETURN (%)
|
|
1 Year
|
5 Year
|
10 Year
|
|
Class A (without sales charge)
|
15.14
|
7.58
|
6.04
|
|
Class A (with sales charge)
|
9.70
|
6.54
|
5.53
|
|
MSCI World Index
|
21.81
|
11.98
|
13.70
|
|
FTSE Global Core Infrastructure 50/50 Index
|
16.69
|
8.52
|
8.32
|
|
Dow Jones Brookfield Global Infrastructure Composite Index
|
13.19
|
8.39
|
7.00
|
Visit https://privatewealth.brookfield.com/fund/brookfield-global-listed-infrastructure-fund for more recent performance information.
KEY FUND STATISTICS (as of June 30, 2026)
|
Total Net Assets
|
$122,695,376
|
|
Number of Portfolio Holdings
|
35
|
|
Portfolio Turnover
|
50%
|
|
Total Advisory Fees Paid
|
$392,299
|
WHAT DID THE FUND INVEST IN? (as of June 30, 2026)
|
Top Holdings
|
(%)1
|
|
|
NextEra Energy, Inc.
|
7.1
|
%
|
|
Union Pacific Corp.
|
5.6
|
%
|
|
Williams Cos., Inc.
|
4.6
|
%
|
|
Aena SME SA
|
4.4
|
%
|
|
TC Energy Corp.
|
4.3
|
%
|
|
Grupo Aeroportuario del Pacifico SAB de CV - Class B
|
4.2
|
%
|
|
Sempra
|
3.9
|
%
|
|
National Grid PLC
|
3.8
|
%
|
|
CSX Corp.
|
3.8
|
%
|
|
International Container Terminal Services, Inc.
|
3.5
|
%
|
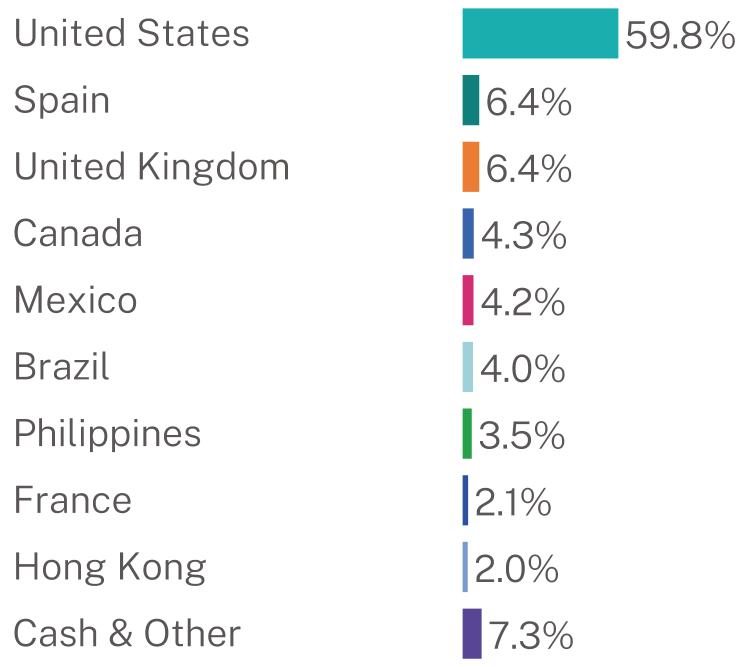
Geographic Breakdown (%)1
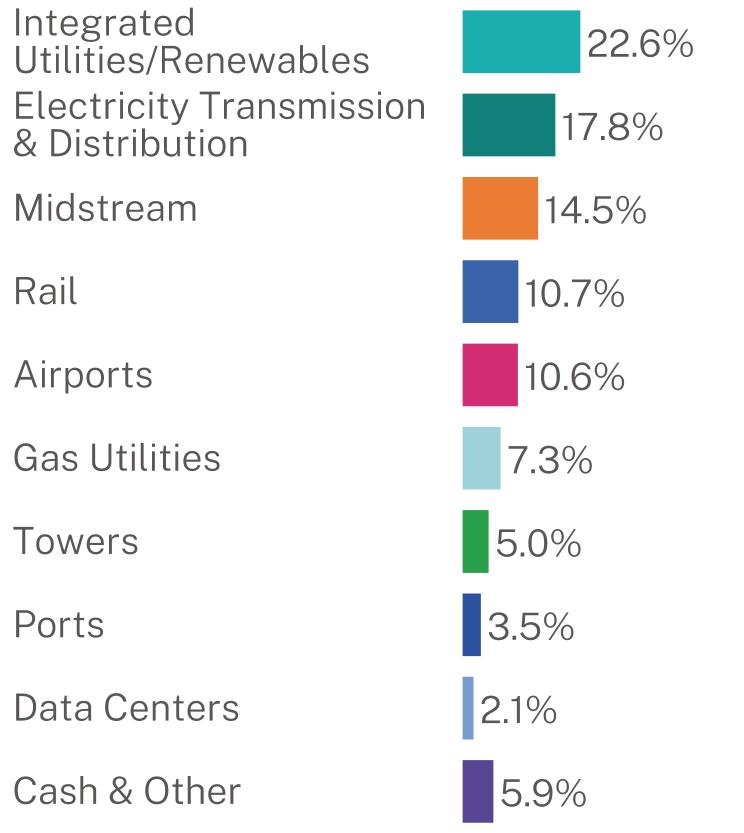
Sector Breakdown2
WHAT WERE THE FUND COSTS FOR THE LAST SIX MONTHS? (based on a hypothetical $10,000 investment)
|
Class Name
|
Costs of a $10,000 investment
|
Costs paid as a percentage of a $10,000 investment*
|
|
Class C
|
$104
|
2.00%
|
HOW DID THE FUND PERFORM AND WHAT AFFECTED ITS PERFORMANCE?
For the six-month period ended June 30, 2026, the Fund generated a positive absolute return of 10.23% but underperformed its benchmark, the FTSE Global Core Infrastructure 50/50 Index, which returned 11.11% over the same period.
WHAT FACTORS INFLUENCED PERFORMANCE
Sector contributors to relative performance during the period included:
|
•
|
Ports: An overweight position in an outperforming independent terminal operator contributed to relative performance. The company reported positive Earnings Before Interest, Taxes, Depreciation and Amortization (EBITDA), with management noting that performance was supported by recently added terminals and stable performance among existing assets.
|
|
•
|
Toll Roads: A combination of underweight exposure to the underperforming sector, along with positive security selection contributed to relative performance. The timing of select overweight positions contributed positively.
|
|
•
|
Data Centers: A non-index position contributed positively as data centers rebounded during the period.
|
Sector detractors from relative performance during the period included:
|
•
|
Airports: Overweight exposure to select global airports was the leading detractor from relative performance. The sector lagged the broader infrastructure universe amid lower passenger traffic from the Middle East conflict. The events in Mexico during February also pressured operators in the region.
|
|
•
|
Electricity Transmission & Distribution: Security selection among U.S. and Brazilian stocks in the sector detracted from relative returns.
|
|
•
|
Rail: Overweight positions in select underperforming Brazilian and Japanese rail operators detracted from relative performance during the period.
|
POSITIONING
The potential for earnings growth in the utility sector remained underpinned by grid investment tied to artificial intelligence compute demand, electrification, and industrial reshoring. U.S. power consumption forecasts continued to move higher, with commercial demand growth outpacing residential demand for the first time on record. Within communications infrastructure, while uncertainties persist around organic tower leasing trends, new investment opportunities emerged around AI-driven mobile data growth, 6G preparation and edge computing. Lastly, despite muted near-term performance for energy midstream, long-term fundamentals continued to strengthen across the sector. The U.S. has become the world’s largest liquefied natural gas (LNG) exporter and the primary source of new global gas supply growth, with the Gulf Coast as the epicenter of that build-out, while growing data center demand was durable new source of gas offtake.
|
Top Contributors
|
|
|
↑
|
Ports
|
|
↑
|
Toll Roads
|
|
Top Detractors
|
|
|
↓
|
Global Airports
|
|
↓
|
U.S. and Brazilian Transmission & Distribution Utilities
|
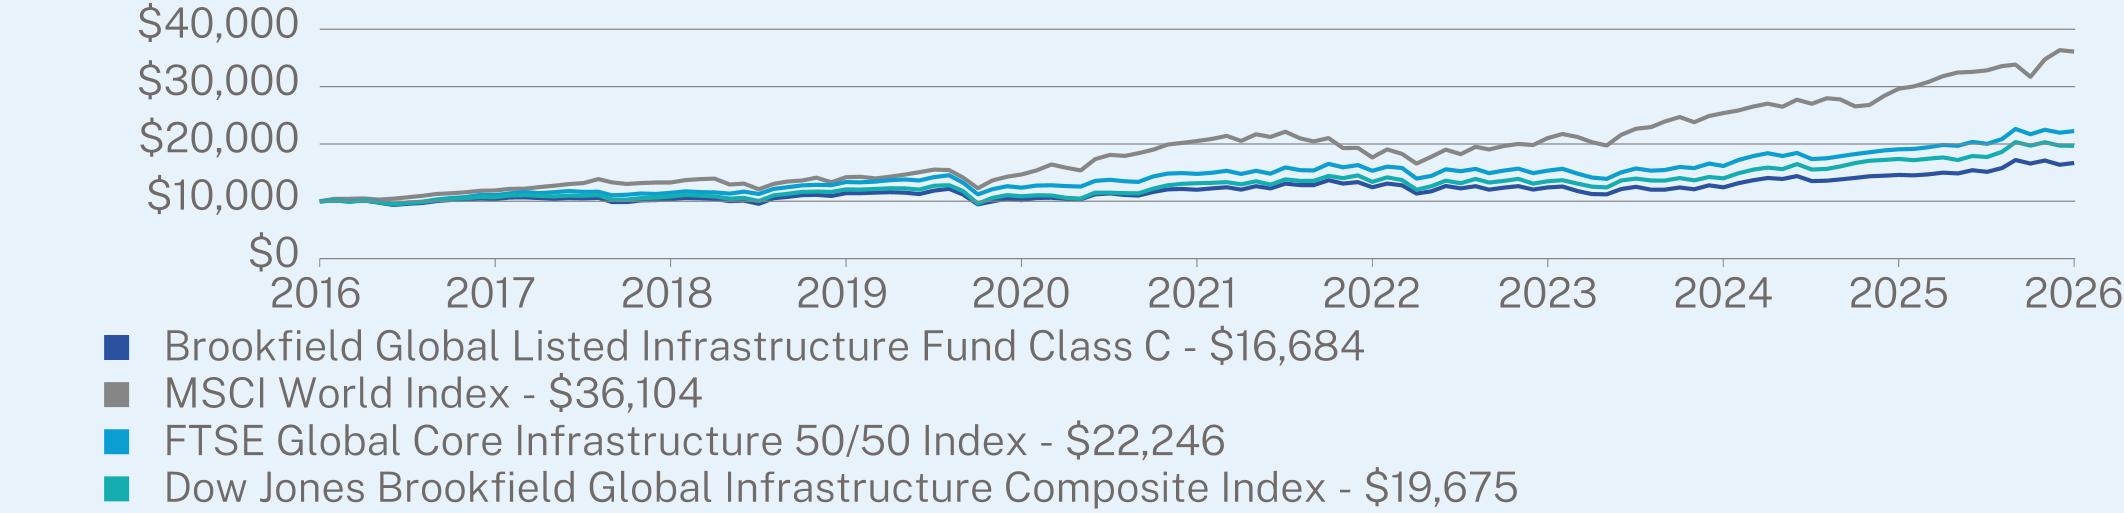
ANNUAL AVERAGE TOTAL RETURN (%)
|
|
1 Year
|
5 Year
|
10 Year
|
|
Class C (without sales charge)
|
14.30
|
6.78
|
5.25
|
|
Class C (with sales charge)
|
13.41
|
6.78
|
5.25
|
|
MSCI World Index
|
21.81
|
11.98
|
13.70
|
|
FTSE Global Core Infrastructure 50/50 Index
|
16.69
|
8.52
|
8.32
|
|
Dow Jones Brookfield Global Infrastructure Composite Index
|
13.19
|
8.39
|
7.00
|
Visit https://privatewealth.brookfield.com/fund/brookfield-global-listed-infrastructure-fund for more recent performance information.
KEY FUND STATISTICS (as of June 30, 2026)
|
Total Net Assets
|
$122,695,376
|
|
Number of Portfolio Holdings
|
35
|
|
Portfolio Turnover
|
50%
|
|
Total Advisory Fees Paid
|
$392,299
|
WHAT DID THE FUND INVEST IN? (as of June 30, 2026)
|
Top Holdings
|
(%)1
|
|
|
NextEra Energy, Inc.
|
7.1
|
%
|
|
Union Pacific Corp.
|
5.6
|
%
|
|
Williams Cos., Inc.
|
4.6
|
%
|
|
Aena SME SA
|
4.4
|
%
|
|
TC Energy Corp.
|
4.3
|
%
|
|
Grupo Aeroportuario del Pacifico SAB de CV - Class B
|
4.2
|
%
|
|
Sempra
|
3.9
|
%
|
|
National Grid PLC
|
3.8
|
%
|
|
CSX Corp.
|
3.8
|
%
|
|
International Container Terminal Services, Inc.
|
3.5
|
%
|
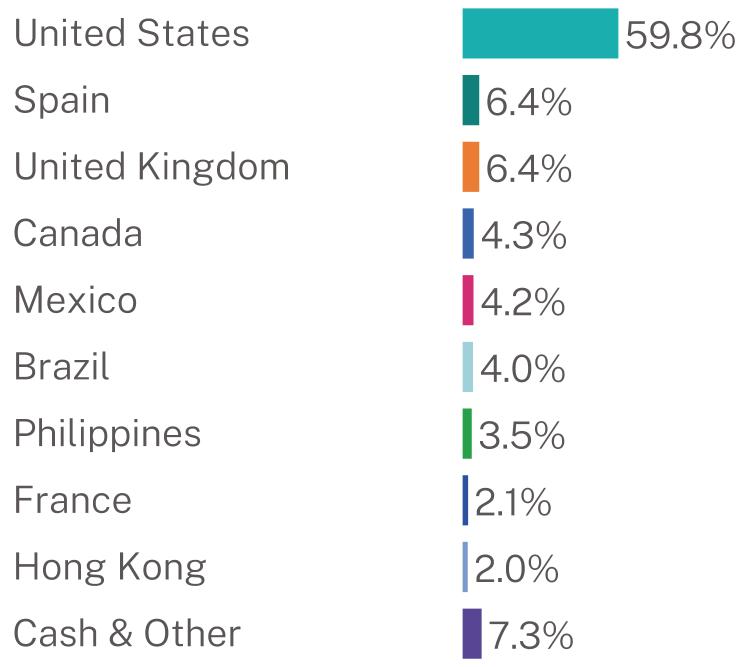
Geographic Breakdown (%)1
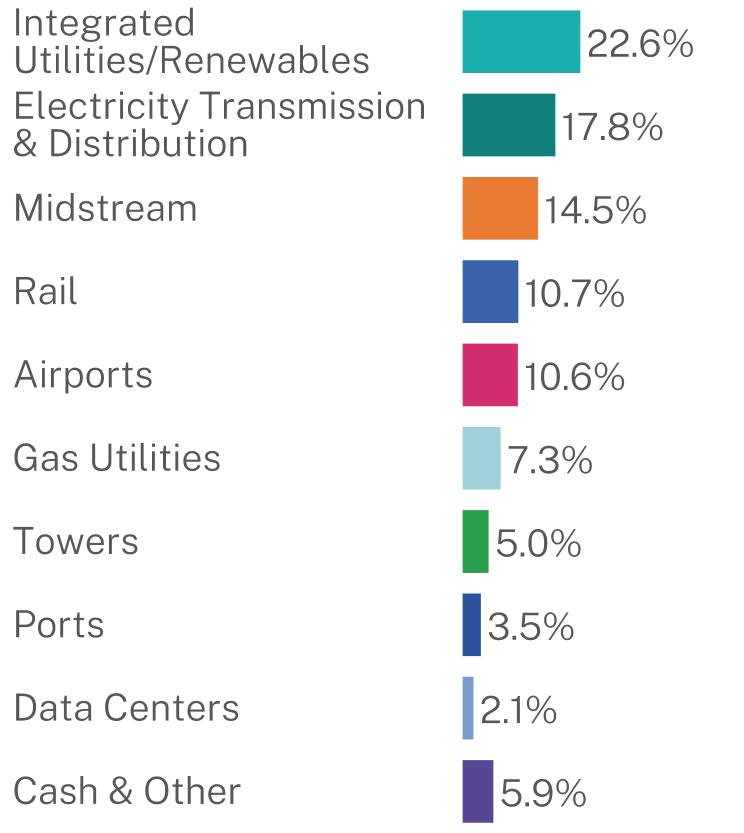
Sector Breakdown2
WHAT WERE THE FUND COSTS FOR THE LAST SIX MONTHS? (based on a hypothetical $10,000 investment)
|
Class Name
|
Costs of a $10,000 investment
|
Costs paid as a percentage of a $10,000 investment*
|
|
Class I
|
$52
|
1.00%
|
HOW DID THE FUND PERFORM AND WHAT AFFECTED ITS PERFORMANCE?
For the six-month period ended June 30, 2026, the Fund generated a positive absolute return of 10.66% but underperformed its benchmark, the FTSE Global Core Infrastructure 50/50 Index, which returned 11.11% over the same period.
WHAT FACTORS INFLUENCED PERFORMANCE
Sector contributors to relative performance during the period included:
|
•
|
Ports: An overweight position in an outperforming independent terminal operator contributed to relative performance. The company reported positive Earnings Before Interest, Taxes, Depreciation and Amortization (EBITDA), with management noting that performance was supported by recently added terminals and stable performance among existing assets.
|
|
•
|
Toll Roads: A combination of underweight exposure to the underperforming sector, along with positive security selection contributed to relative performance. The timing of select overweight positions contributed positively.
|
|
•
|
Data Centers: A non-index position contributed positively as data centers rebounded during the period.
|
Sector detractors from relative performance during the period included:
|
•
|
Airports: Overweight exposure to select global airports was the leading detractor from relative performance. The sector lagged the broader infrastructure universe amid lower passenger traffic from the Middle East conflict. The events in Mexico during February also pressured operators in the region.
|
|
•
|
Electricity Transmission & Distribution: Security selection among U.S. and Brazilian stocks in the sector detracted from relative returns.
|
|
•
|
Rail: Overweight positions in select underperforming Brazilian and Japanese rail operators detracted from relative performance during the period.
|
POSITIONING
The potential for earnings growth in the utility sector remained underpinned by grid investment tied to artificial intelligence compute demand, electrification, and industrial reshoring. U.S. power consumption forecasts continued to move higher, with commercial demand growth outpacing residential demand for the first time on record. Within communications infrastructure, while uncertainties persist around organic tower leasing trends, new investment opportunities emerged around AI-driven mobile data growth, 6G preparation and edge computing. Lastly, despite muted near-term performance for energy midstream, long-term fundamentals continued to strengthen across the sector. The U.S. has become the world’s largest liquefied natural gas (LNG) exporter and the primary source of new global gas supply growth, with the Gulf Coast as the epicenter of that build-out, while growing data center demand was durable new source of gas offtake.
|
Top Contributors
|
|
|
↑
|
Ports
|
|
↑
|
Toll Roads
|
|
Top Detractors
|
|
|
↓
|
Global Airports
|
|
↓
|
U.S. and Brazilian Transmission & Distribution Utilities
|
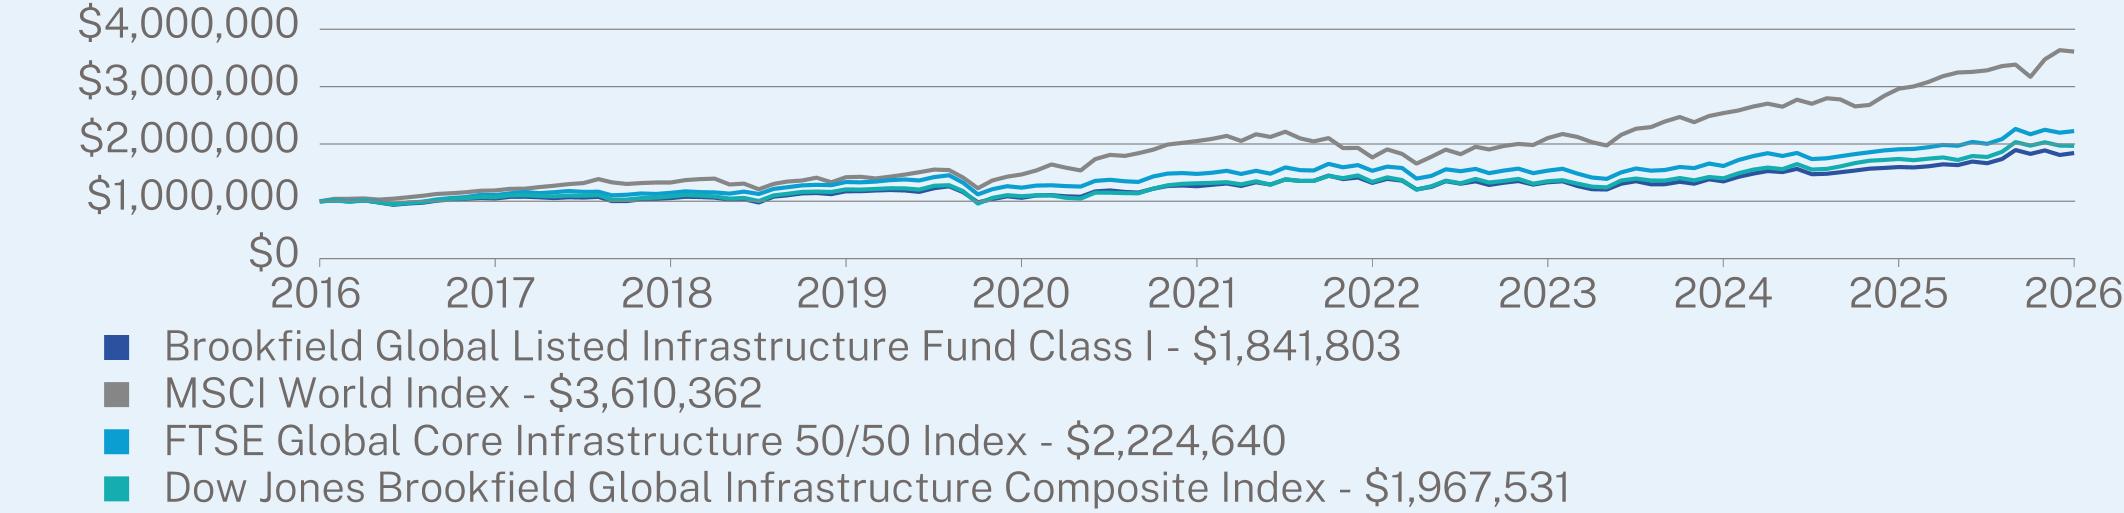
ANNUAL AVERAGE TOTAL RETURN (%)
|
|
1 Year
|
5 Year
|
10 Year
|
|
Class I
|
15.31
|
7.84
|
6.30
|
|
MSCI World Index
|
21.81
|
11.98
|
13.70
|
|
FTSE Global Core Infrastructure 50/50 Index
|
16.69
|
8.52
|
8.32
|
|
Dow Jones Brookfield Global Infrastructure Composite Index
|
13.19
|
8.39
|
7.00
|
Visit https://privatewealth.brookfield.com/fund/brookfield-global-listed-infrastructure-fund for more recent performance information.
KEY FUND STATISTICS (as of June 30, 2026)
|
Total Net Assets
|
$122,695,376
|
|
Number of Portfolio Holdings
|
35
|
|
Portfolio Turnover
|
50%
|
|
Total Advisory Fees Paid
|
$392,299
|
WHAT DID THE FUND INVEST IN? (as of June 30, 2026)
|
Top Holdings
|
(%)1
|
|
|
NextEra Energy, Inc.
|
7.1
|
%
|
|
Union Pacific Corp.
|
5.6
|
%
|
|
Williams Cos., Inc.
|
4.6
|
%
|
|
Aena SME SA
|
4.4
|
%
|
|
TC Energy Corp.
|
4.3
|
%
|
|
Grupo Aeroportuario del Pacifico SAB de CV - Class B
|
4.2
|
%
|
|
Sempra
|
3.9
|
%
|
|
National Grid PLC
|
3.8
|
%
|
|
CSX Corp.
|
3.8
|
%
|
|
International Container Terminal Services, Inc.
|
3.5
|
%
|
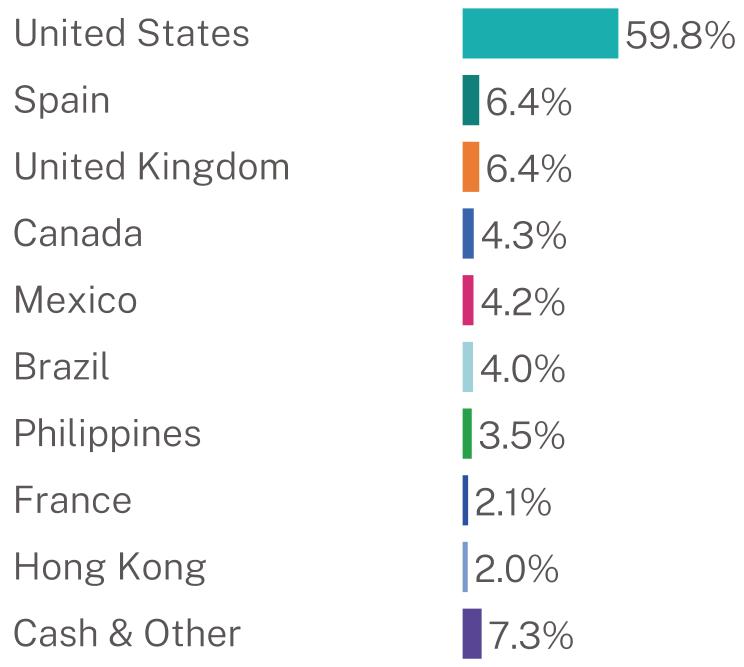
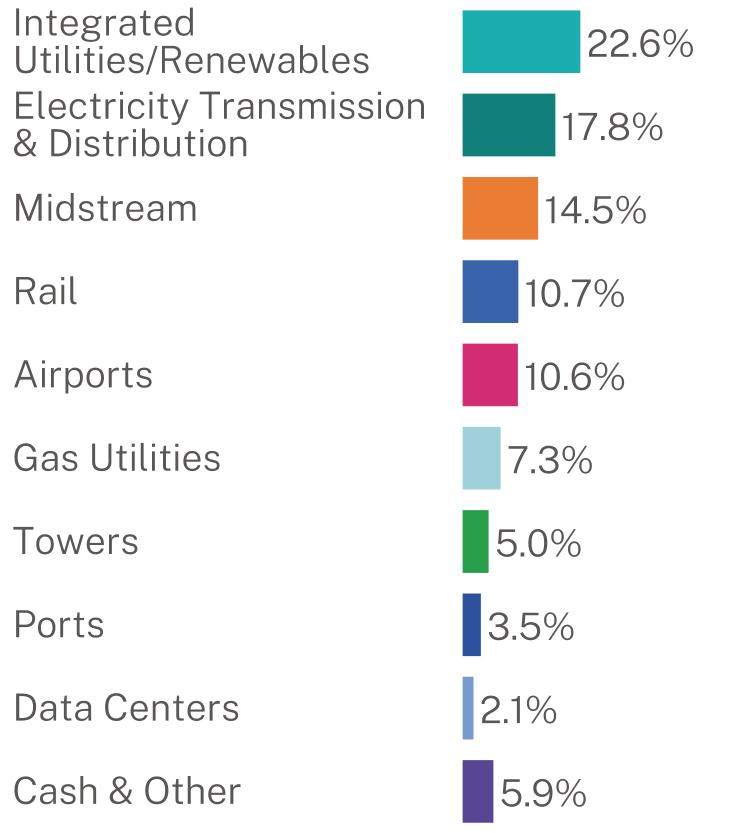
Geographic Breakdown (%)1
Sector Breakdown2
This report describes changes to the Fund that occurred during the reporting period.
WHAT WERE THE FUND COSTS FOR THE LAST SIX MONTHS? (based on a hypothetical $10,000 investment)
|
Class Name
|
Costs of a $10,000 investment
|
Costs paid as a percentage of a $10,000 investment*
|
|
Class A
|
$62
|
1.20%
|
KEY FUND STATISTICS (as of June 30, 2026)
|
Total Net Assets
|
$0
|
|
Number of Portfolio Holdings
|
0
|
|
Portfolio Turnover
|
44%
|
|
Total Advisory Fees Paid
|
$293,977
|
WHAT DID THE FUND INVEST IN? (as of June 30, 2026)
Geographic Breakdown (%)1
Sector Breakdown2
MATERIAL FUND CHANGES
This is a summary of certain changes to the Fund that occurred during the reporting period.
On March 5, 2026, the Board of Trustees approved a proposal to liquidate the Fund. The Fund liquidated on June 30, 2026.
For more complete information, you may review the Fund’s prospectus dated April 30, 2026, at https://privatewealth.brookfield.com/fund/brookfield-global-listed-real-estate-fund, or upon request at 855-244-4859.
This report describes changes to the Fund that occurred during the reporting period.
WHAT WERE THE FUND COSTS FOR THE LAST SIX MONTHS? (based on a hypothetical $10,000 investment)
|
Class Name
|
Costs of a $10,000 investment
|
Costs paid as a percentage of a $10,000 investment*
|
|
Class C
|
$101
|
1.95%
|
KEY FUND STATISTICS (as of June 30, 2026)
|
Total Net Assets
|
$0
|
|
Number of Portfolio Holdings
|
0
|
|
Portfolio Turnover
|
44%
|
|
Total Advisory Fees Paid
|
$293,977
|
WHAT DID THE FUND INVEST IN? (as of June 30, 2026)
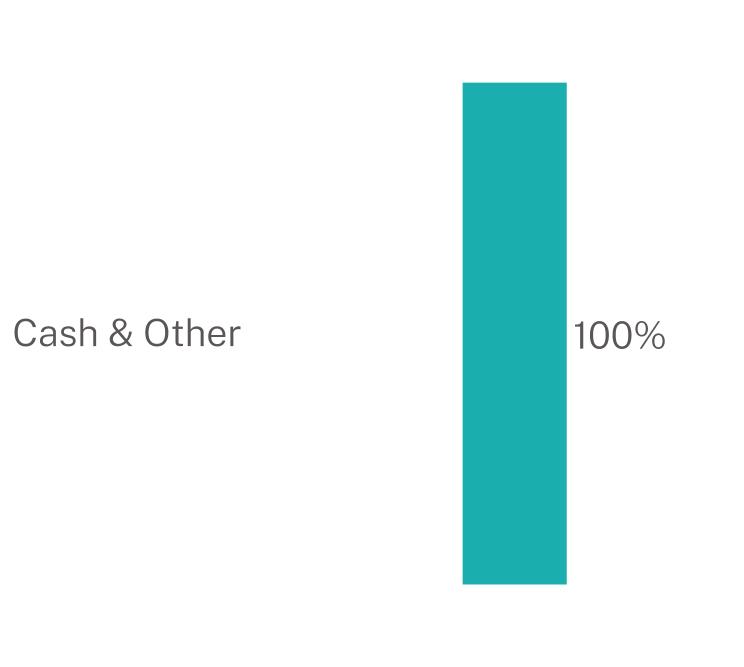
Geographic Breakdown (%)1
Sector Breakdown2
MATERIAL FUND CHANGES
This is a summary of certain changes to the Fund that occurred during the reporting period.
On March 5, 2026, the Board of Trustees approved a proposal to liquidate the Fund. The Fund liquidated on June 30, 2026.
For more complete information, you may review the Fund’s prospectus dated April 30, 2026, at https://privatewealth.brookfield.com/fund/brookfield-global-listed-real-estate-fund, or upon request at 855-244-4859.
This report describes changes to the Fund that occurred during the reporting period.
WHAT WERE THE FUND COSTS FOR THE LAST SIX MONTHS? (based on a hypothetical $10,000 investment)
|
Class Name
|
Costs of a $10,000 investment
|
Costs paid as a percentage of a $10,000 investment*
|
|
Class I
|
$49
|
0.95%
|
KEY FUND STATISTICS (as of June 30, 2026)
|
Total Net Assets
|
$0
|
|
Number of Portfolio Holdings
|
0
|
|
Portfolio Turnover
|
44%
|
|
Total Advisory Fees Paid
|
$293,977
|
WHAT DID THE FUND INVEST IN? (as of June 30, 2026)
Geographic Breakdown (%)1
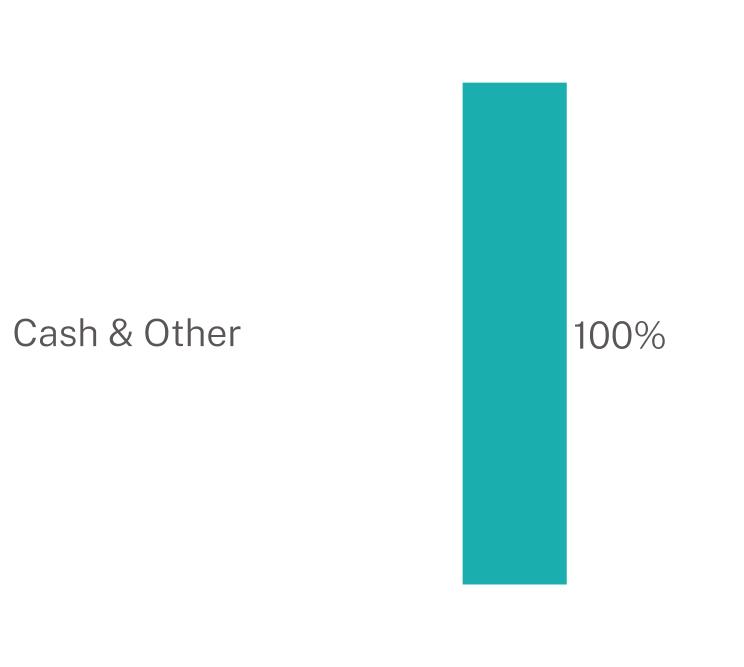
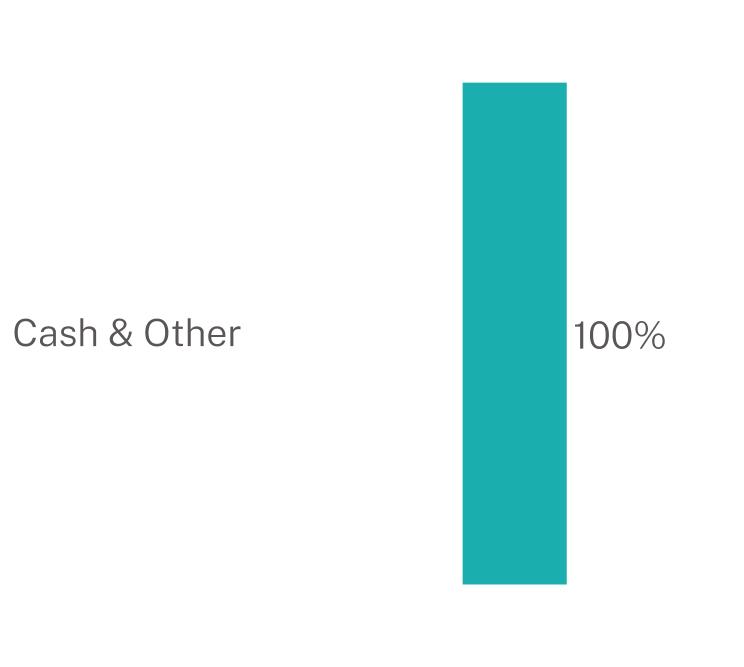
Sector Breakdown2
MATERIAL FUND CHANGES
This is a summary of certain changes to the Fund that occurred during the reporting period.
On March 5, 2026, the Board of Trustees approved a proposal to liquidate the Fund. The Fund liquidated on June 30, 2026.
For more complete information, you may review the Fund’s prospectus dated April 30, 2026, at https://privatewealth.brookfield.com/fund/brookfield-global-listed-real-estate-fund, or upon request at 855-244-4859.
This report describes changes to the Fund that occurred during the reporting period.
WHAT WERE THE FUND COSTS FOR THE LAST SIX MONTHS? (based on a hypothetical $10,000 investment)
|
Class Name
|
Costs of a $10,000 investment
|
Costs paid as a percentage of a $10,000 investment*
|
|
Class I
|
$52
|
1.00%
|
KEY FUND STATISTICS (as of June 30, 2026)
|
Total Net Assets
|
$0
|
|
Number of Portfolio Holdings
|
0
|
|
Portfolio Turnover
|
63%
|
|
Total Advisory Fees Paid
|
$0
|
WHAT DID THE FUND INVEST IN? (as of June 30, 2026)
Geographic Breakdown (%)1
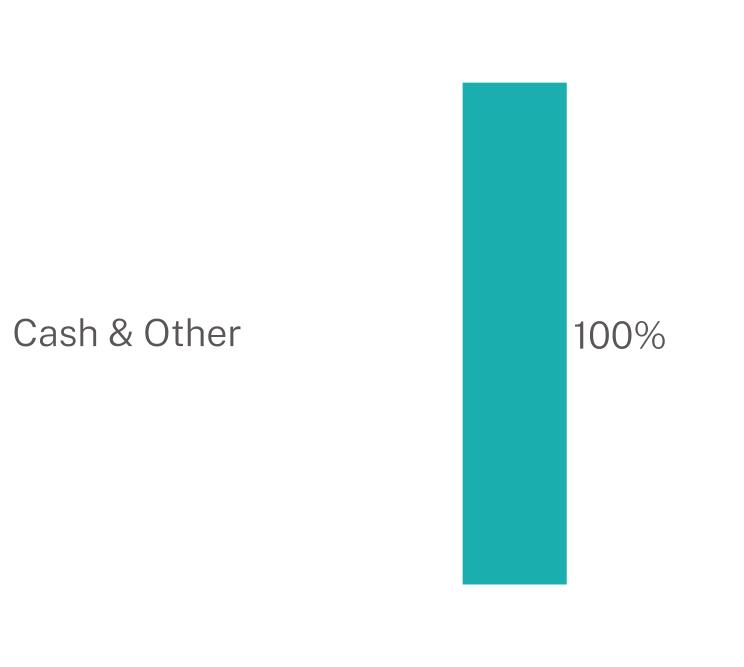
Sector Breakdown2
MATERIAL FUND CHANGES
This is a summary of certain changes to the Fund that occurred during the reporting period.
On March 5, 2026, the Board of Trustees approved a proposal to liquidate the Fund. The Fund liquidated on June 30, 2026.
For more complete information, you may review the Fund’s prospectus dated April 30, 2026, at https://privatewealth.brookfield.com/fund/brookfield-next-generation-infrastructure-fund, or upon request at 855-244-4859.
WHAT WERE THE FUND COSTS FOR THE LAST SIX MONTHS? (based on a hypothetical $10,000 investment)
|
Class Name
|
Costs of a $10,000 investment
|
Costs paid as a percentage of a $10,000 investment*
|
|
Class A
|
$64
|
1.20%
|
HOW DID THE FUND PERFORM AND WHAT AFFECTED ITS PERFORMANCE?
For the six-month period ended June 30, 2026, the Fund generated a positive absolute return of 13.72% but underperformed its benchmark, the MSCI Emerging Markets Net Total Return (USD) Index (“EM Index”), which returned 23.85%. The strength of the artificial intelligence (“AI”) investment cycle has resulted in an unprecedented concentration within the EM index, with a small group of AI beneficiaries driving the majority of benchmark returns. This, in turn, has created a challenging performance environment for diversified managers.
WHAT FACTORS INFLUENCED PERFORMANCE
By country, our underperformance during the period was mostly attributable to our overweight allocation to China and underweight exposure to Taiwan. Meanwhile, our underweight allocation to India had a positive impact on our performance. At the sector level, our underweight exposure to information technology detracted the most from our performance, followed by our overweight allocation to materials. Conversely, our selection among information technology contributed positively.
POSITIONING
Currently, our largest overweights by country are China and Chile, while Taiwan and India are our largest underweights. At the sector level, the portfolio is overweight industrials and materials, and underweight financials and information technology. We continue to emphasize businesses benefiting from favorable supply-demand dynamics, strong balance sheets, disciplined capital allocation, and improving earnings power.
PERFORMANCE
The Fund posted a strong absolute return for the reported period, but underperformed its benchmark, largely driven by our information technology underweight.
|
Top Contributors
|
|
|
↑
|
Information Technology Selection
|
|
↑
|
Health Care Selection
|
|
↑
|
India Underweight
|
|
↑
|
Financials Underweight
|
|
Top Detractors
|
|
|
↓
|
Information Technology Underweight
|
|
↓
|
Materials Overweight
|
|
↓
|
China Overweight
|
|
↓
|
Taiwan Underweight
|
|
↓
|
Korea Selection
|
|
↓
|
Industrials Selection
|
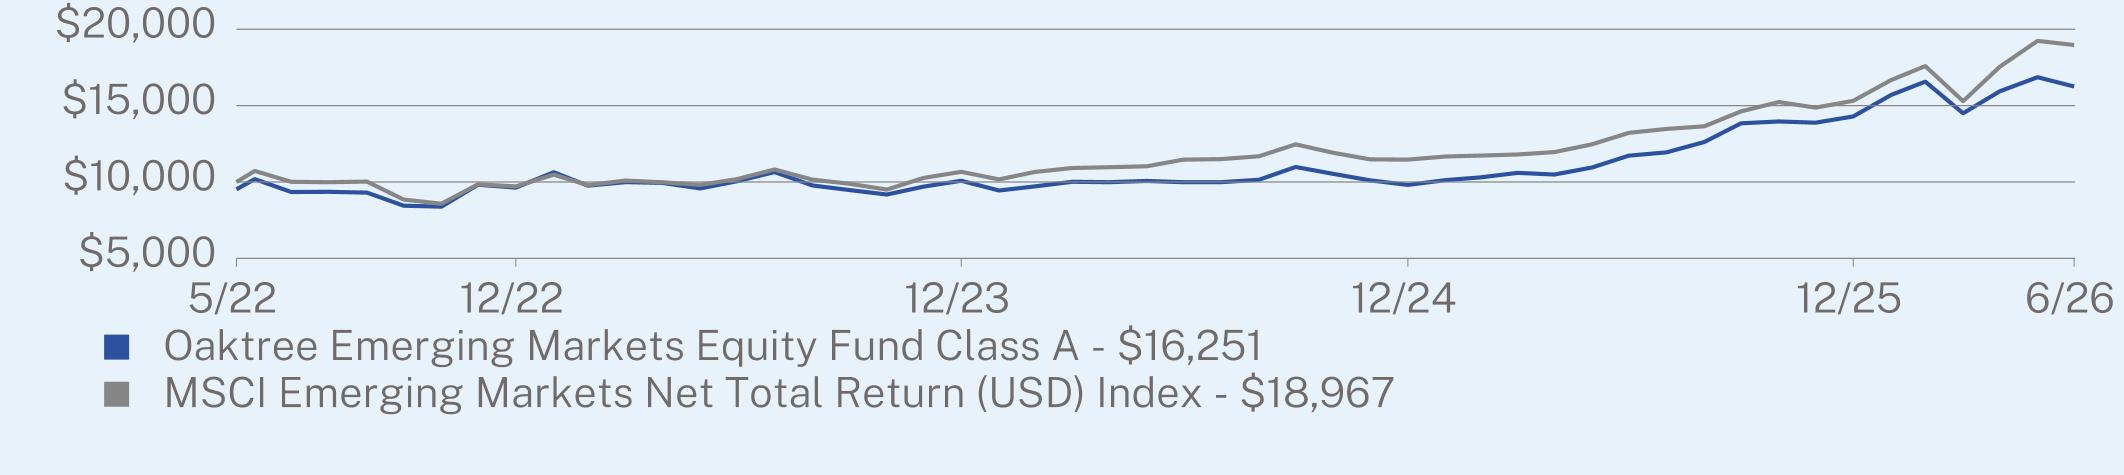
ANNUAL AVERAGE TOTAL RETURN (%)
|
|
1 Year
|
Since Inception
(05/16/2022) |
|
Class A (without sales charge)
|
38.61
|
13.85
|
|
Class A (with sales charge)
|
32.04
|
12.50
|
|
MSCI Emerging Markets Net Total Return (USD) Index
|
43.51
|
16.79
|
Visit https://privatewealth.brookfield.com/fund/oaktree-emerging-markets-equity-fund for more recent performance information.
KEY FUND STATISTICS (as of June 30, 2026)
|
Total Net Assets
|
$376,114,084
|
|
Number of Portfolio Holdings
|
63
|
|
Portfolio Turnover
|
52%
|
|
Total Advisory Fees Paid
|
$1,257,557
|
WHAT DID THE FUND INVEST IN? (as of June 30, 2026)
|
Top Holdings
|
(%)1
|
|
|
Samsung Electronics Co. Ltd.
|
10.0
|
%
|
|
Taiwan Semiconductor Manufacturing Co. Ltd.
|
8.8
|
%
|
|
SK Hynix, Inc.
|
5.7
|
%
|
|
Anglogold Ashanti PLC
|
3.6
|
%
|
|
Alibaba Group Holding Ltd.
|
3.4
|
%
|
|
Contemporary Amperex Technology Co. Ltd. - Class H
|
3.2
|
%
|
|
SK Square Co. Ltd.
|
2.7
|
%
|
|
Barrick Mining Corp.
|
2.4
|
%
|
|
WuXi AppTec Company Ltd.
|
2.2
|
%
|
|
ASE Technology Holding Co. Ltd.
|
2.1
|
%
|
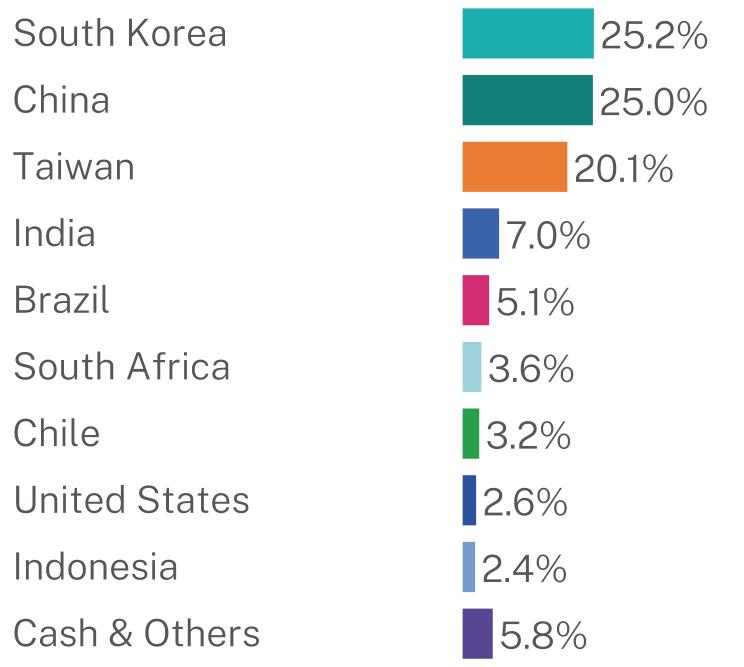
Geographic Breakdown (%)1
WHAT WERE THE FUND COSTS FOR THE LAST SIX MONTHS? (based on a hypothetical $10,000 investment)
|
Class Name
|
Costs of a $10,000 investment
|
Costs paid as a percentage of a $10,000 investment*
|
|
Class I
|
$50
|
0.95%
|
HOW DID THE FUND PERFORM AND WHAT AFFECTED ITS PERFORMANCE?
For the six-month period ended June 30, 2026, the Fund generated a positive absolute return of 13.77% but underperformed its benchmark, the MSCI Emerging Markets Net Total Return (USD) Index (“EM Index”), which returned 23.85%. The strength of the artificial intelligence (“AI”) investment cycle has resulted in an unprecedented concentration within the EM index, with a small group of AI beneficiaries driving the majority of benchmark returns. This, in turn, has created a challenging performance environment for diversified managers.
WHAT FACTORS INFLUENCED PERFORMANCE
By country, our underperformance during the period was mostly attributable to our overweight allocation to China and underweight exposure to Taiwan. Meanwhile, our underweight allocation to India had a positive impact on our performance. At the sector level, our underweight exposure to information technology detracted the most from our performance, followed by our overweight allocation to materials. Conversely, our selection among information technology contributed positively.
POSITIONING
Currently, our largest overweights by country are China and Chile, while Taiwan and India are our largest underweights. At the sector level, the portfolio is overweight industrials and materials, and underweight financials and information technology. We continue to emphasize businesses benefiting from favorable supply-demand dynamics, strong balance sheets, disciplined capital allocation, and improving earnings power.
PERFORMANCE
The Fund posted a strong absolute return for the reported period, but underperformed its benchmark, largely driven by our information technology underweight.
|
Top Contributors
|
|
|
↑
|
Information Technology Selection
|
|
↑
|
Health Care Selection
|
|
↑
|
India Underweight
|
|
↑
|
Financials Underweight
|
|
Top Detractors
|
|
|
↓
|
Information Technology Underweight
|
|
↓
|
Materials Overweight
|
|
↓
|
China Overweight
|
|
↓
|
Taiwan Underweight
|
|
↓
|
Korea Selection
|
|
↓
|
Industrials Selection
|
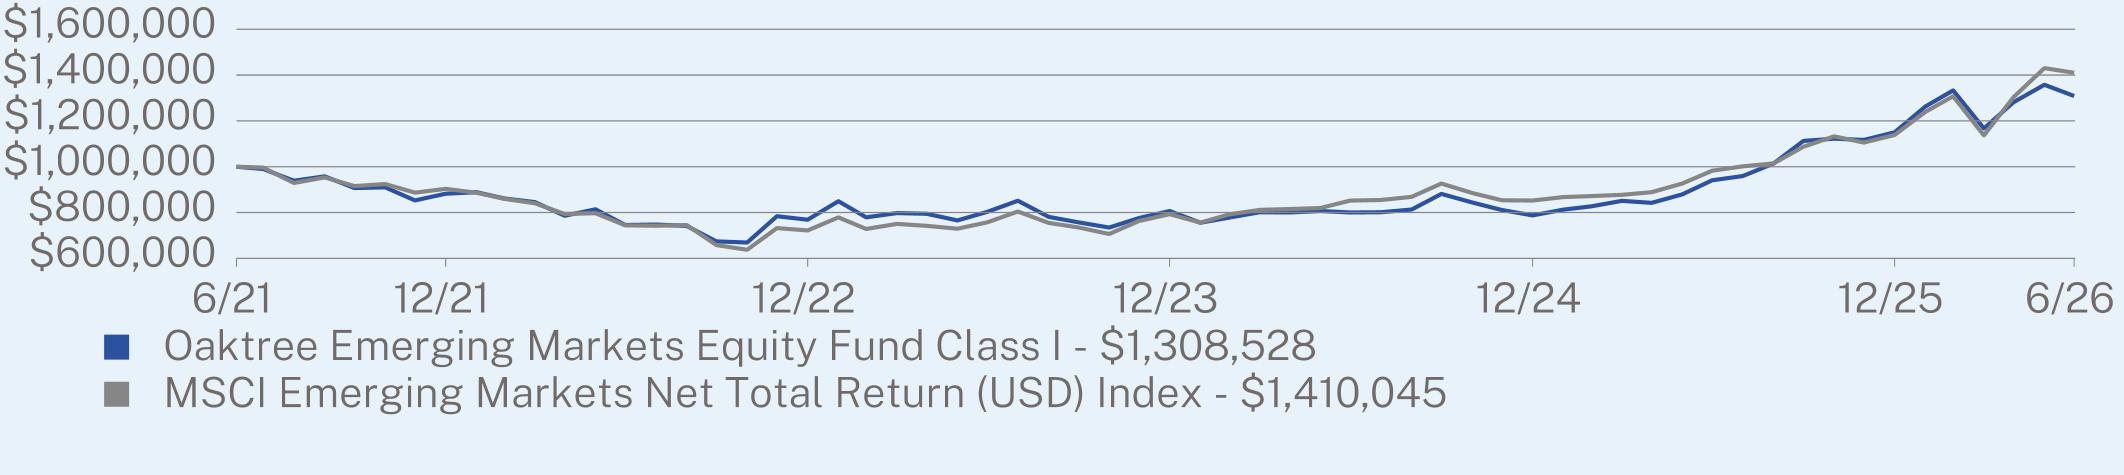
ANNUAL AVERAGE TOTAL RETURN (%)
|
|
1 Year
|
5 Year
|
Since Inception
(06/03/2021) |
|
Class I
|
39.09
|
5.74
|
5.44
|
|
MSCI Emerging Markets Net Total Return (USD) Index
|
43.51
|
7.20
|
7.01
|
Visit https://privatewealth.brookfield.com/fund/oaktree-emerging-markets-equity-fund for more recent performance information.
KEY FUND STATISTICS (as of June 30, 2026)
|
Total Net Assets
|
$376,114,084
|
|
Number of Portfolio Holdings
|
63
|
|
Portfolio Turnover
|
52%
|
|
Total Advisory Fees Paid
|
$1,257,557
|
WHAT DID THE FUND INVEST IN? (as of June 30, 2026)
|
Top Holdings
|
(%)1
|
|
|
Samsung Electronics Co. Ltd.
|
10.0
|
%
|
|
Taiwan Semiconductor Manufacturing Co. Ltd.
|
8.8
|
%
|
|
SK Hynix, Inc.
|
5.7
|
%
|
|
Anglogold Ashanti PLC
|
3.6
|
%
|
|
Alibaba Group Holding Ltd.
|
3.4
|
%
|
|
Contemporary Amperex Technology Co. Ltd. - Class H
|
3.2
|
%
|
|
SK Square Co. Ltd.
|
2.7
|
%
|
|
Barrick Mining Corp.
|
2.4
|
%
|
|
WuXi AppTec Company Ltd.
|
2.2
|
%
|
|
ASE Technology Holding Co. Ltd.
|
2.1
|
%
|
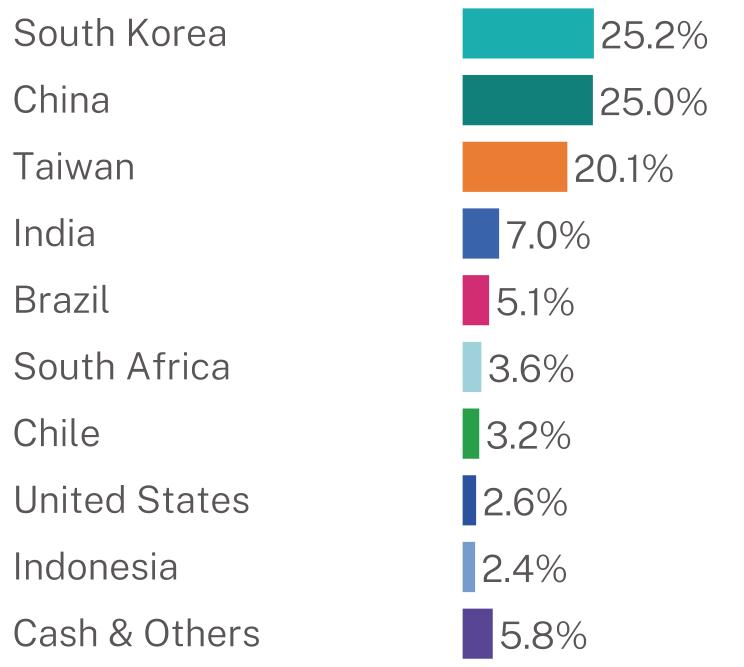
Geographic Breakdown (%)1
| [1] |
|
||
| [2] |
|
||
| [3] |
|
||
| [4] |
|
||
| [5] |
|
||
| [6] |
|
||
| [7] |
|
||
| [8] |
|
||
| [9] |
|
||
| [10] |
|
||
| [11] |
|
||
| [12] |
|
||
| [13] |
|
||
| [14] |
|
||
| [15] |
|
||
| [16] |
|
||
| [17] |
|
||
| [18] |
|
||
| [19] |
|
||
| [20] |
|
||
| [21] |
|
||
| [22] |
|
||
| [23] |
|
||
| [24] |
|
||
| [25] |
|