
Exhibit 99.2
Management’s Discussion and Analysis
This management’s discussion and analysis (“MD&A”) of operations and financial condition for the third quarter of fiscal 2026, dated September 1, 2026, should be read in conjunction with the unaudited interim consolidated financial statements for the period ended July 31, 2026, which have been prepared in accordance with International Financial Reporting Standards (“IFRS”). This MD&A should also be read in conjunction with VersaBank’s MD&A and Audited Consolidated Financial Statements for the year ended October 31, 2025, which are available on VersaBank’s website at www.versabank.com, SEDAR+ at www.sedarplus.ca and EDGAR at www.sec.gov/edgar. Except as discussed below, all other factors discussed and referred to in the MD&A for the year ended October 31, 2025, remain substantially unchanged. All currency amounts in this document are in Canadian dollars unless otherwise indicated.
|
About VersaBank |
3 |
|
Strategy |
4 |
|
Reorganization |
7 |
|
Overview of Performance |
8 |
|
Selected Financial Highlights |
15 |
|
Financial Review – Earnings |
16 |
|
Financial Review – Balance Sheet |
22 |
|
Off-Balance Sheet Arrangements |
31 |
|
Related Party Transactions |
31 |
|
Capital Management and Capital Resources |
32 |
|
Results of Operating Segments |
34 |
|
Summary of Quarterly Results |
37 |
|
Non-GAAP and Other Financial Measures |
39 |
|
Material Accounting Policies and Use of Estimates and Judgements |
41 |
|
Controls and Procedures |
42 |
|
Additional Information |
42 |
| VersaBank – Q3 2026 MD&A | 1 |
Cautionary Note Regarding Forward-Looking Statements
VersaBank’s public communications often include written or oral forward-looking statements. Statements of this type are included in this document and may also be included in other filings with Canadian securities regulators or the US Securities and Exchange Commission (the “SEC”), or in other communications. All such statements are made pursuant to the “safe harbor” provisions of, and are intended to be forward-looking statements under, the United States Private Securities Litigation Reform Act of 1995 and any applicable Canadian securities legislation. The statements in this management’s discussion and analysis that relate to future events or future performance including, without limitation, statements regarding the proposed Reorganization (see Reorganization section below) are forward-looking statements.
By their very nature, forward-looking statements involve inherent risks and uncertainties, both general and specific, many of which are beyond VersaBank’s control. There is a risk that predictions, forecasts, projections and other forward-looking statements will not be achieved. Readers are cautioned not to place undue reliance on these forward-looking statements, as a number of important factors could cause actual results to differ materially from the plans, objectives, expectations, estimates and intentions expressed in such statements. These factors include, but are not limited to: the strength of the US and Canadian economies in general and the local economies in which VersaBank operates; the effects of changes in monetary and fiscal policy, including changes in interest rate policies of the Bank of Canada and the US Federal Reserve; global commodity prices; the effects of competition in the markets in which VersaBank operates; inflation; capital market fluctuations; the timely development and introduction of new products in receptive markets and our ability to realize any benefit from the introduction of new products; the impact of changes in laws, including trade laws and tariffs, and regulations applicable to financial services; changes in tax laws; technological changes, including the use of data and artificial intelligence (“AI”) in our business, including generative AI; unexpected judicial or regulatory proceedings; unexpected changes in consumer spending and savings habits; the impact of wars or conflicts and related effects on global supply chains and markets; the impact of outbreaks of disease or illness affecting local, national or international economies; the possible effects of terrorist activities; natural disasters and disruptions to public infrastructure (including transportation, communications, power or water supply); and VersaBank’s ability to anticipate and manage the risks associated with these factors.
During the quarter ended July 31, 2026, the Bank publicly filed a Form S-4 registration statement (the “Registration Statement”) with the US SEC in connection with the Bank’s proposed plan to realign its corporate structure to a standard US bank framework (the “Reorganization”), which was subsequently declared effective by the SEC on August 4, 2026. In addition to the approval of shareholders, the completion of the Reorganization remains subject to various regulatory approvals, including approval by the Minister of Finance in Canada and the Federal Reserve Board in the United States. There can be no assurance that VersaBank will receive shareholder or regulatory approval in a timely manner, if at all.
The foregoing list of important factors is not exhaustive. When relying on forward-looking statements to make decisions, investors and others should carefully consider the foregoing factors as well as other uncertainties and potential events. The forward-looking information contained in this management’s discussion and analysis is presented to assist VersaBank shareholders and others in understanding VersaBank’s financial position and may not be appropriate for any other purposes. Except as required by applicable securities laws, VersaBank does not undertake to update any forward-looking statement contained in this management’s discussion and analysis or made from time to time by VersaBank or on its behalf.
| VersaBank – Q3 2026 MD&A | 2 |
About VersaBank
Digital Banking Products and Services
VersaBank (“VersaBank” or the “Bank”) is a North American bank (federally chartered in Canada and the United States, through its subsidiary, VersaBank USA National Association) with a difference. VersaBank was one of the world's first fully digital financial institutions. Today VersaBank employs a cloud-based, branchless, business-to-business model based on its proprietary state-of-the-art technology that enables it to profitably address underserved segments of the banking industry. The Bank’s business model is based on obtaining its deposits and providing financing digitally through other third-party financial intermediaries (referred to as “partners”) who, themselves, engage with the actual depositors and borrowers. This provides VersaBank with significant operating leverage, which drives efficiency and return on common equity, and significantly reduces the Bank’s risk.
VersaBank’s recent and expected continued growth is primarily the result of its unique Structured Receivable Program (“SRP”) (formerly referred to as the Receivable Purchase Program, or “RPP”), which invests in cash flow streams generated by credit assets originated and owned by companies that provide financing at the point of sale to consumers and small businesses for “big ticket” value purchases. In September 2024, following its acquisition of a US bank, VersaBank broadly launched its SRP, which has been highly successful in Canada for over 15 years, to the underserved multi-trillion-dollar US market.
Tokenized Deposit Services (Digital Meteor)
VersaBank has developed and owns proprietary intellectual property and technology to enable the next generation of digital assets for the banking and financial community, including the Bank’s revolutionary Real Bank Tokenized Deposits™ (“RBTD™”s) (formerly referred to as Digital Deposit Receipts, or DDRs). RBTDs were developed exclusively by VersaBank using the Bank’s own banking and cybersecurity technologies, including VersaVault®. We believe that VersaVault® is the world’s first operational digital vault designed specifically for security conscious organizations looking to secure their highly sensitive and confidential documents, data, code, blockchain-based assets and more.
VersaBank’s RBTDs are proprietary bank-issued tokenized deposits that provide superior security, stability, and regulatory compliance compared to stablecoins, as highly encrypted digital representations of actual fiat currency deposits with the Bank, combining the safety and soundness of traditional banking with the efficiency, cost savings, security, and programmability of blockchain technology. In addition, the Bank expects its RBTDs to be eligible for conventional federal deposit insurance (subject to confirmation by regulators in accordance with the policies of the Federal Deposit Insurance Corporation (“FDIC”) and Canadian Deposit Insurance Corporation (“CDIC”) and have the legal ability to pay interest, which non-bank issued stablecoins are currently not allowed to provide in the US.
| VersaBank – Q3 2026 MD&A | 3 |
VersaBank is also using its proprietary VersaVault® technology to address the need in both the United States and Canada to expand its regulated custody services to participants in the digital asset market.
Cybersecurity Products and Services
VersaBank also owns Minnesota-based DRT Cyber Inc. (“DRTC”), a North America leader in the provision of cybersecurity services to address the rapidly growing volume of cyber threats challenging financial institutions, multi-national corporations and government entities. DRTC deploys technology solutions to support the functions of cybersecurity, privacy, and risk management, with experience across numerous sectors to enable it to develop and deploy flexible solutions to partners’ exact requirements. The majority of DRTC’s revenue is generated and the majority of DRTC’s costs are incurred by DRTC’s wholly owned subsidiaries, Digital Boundary Group, Inc. and Digital Boundary Group Canada Inc. (collectively “Digital Boundary Group”).
VersaBank’s common shares trade on the Toronto Stock Exchange and Nasdaq under the symbol VBNK. The underlying drivers of VersaBank’s performance changes for the current and comparative periods are set out in the following sections of this MD&A.
Strategy
VersaBank’s goal is to consistently and sustainably deliver outsized growth in earnings per share by utilizing its proprietary technology and established financial intermediary partner networks to deliver innovative digital banking, financial and related solutions to under-served markets, while maintaining its low-risk profile. The Bank’s use of proprietary technology in its cloud-based, branchless, business-to-business model enables significant operating leverage, enabling the Bank to grow its assets and resulting revenue at a significantly faster rate than its non-interest expenses. A significant portion of VersaBank’s workforce are software engineers and technology support staff who are continuously upgrading and enhancing VersaBank’s technologies and software, as well as developing new software to support new business initiatives.
Digital Banking Products and Services
VersaBank’s largest opportunity and primary focus is growth in revenue (driven primarily by growth in net interest income) from its Digital Banking Operations significantly in excess of growth in non-interest expense. VersaBank expects the majority of revenue growth to be driven by the ramp up of its unique SRP in the underserved multi-trillion-dollar US point-of-sale financing market. The SRP has driven the majority of VersaBank’s growth in Canada over the past five years.
VersaBank's SRP is a proprietary, technology-driven-digital funding solution for finance companies that provide loans and leases to consumers and small businesses for "big ticket" value purchases (e.g. consumer home improvement/HVAC projects and a wide variety of commercial and recreational equipment). It was specifically developed to address an unmet need by point-of-sale financing companies for consistently available, readily accessible, and economically attractive capital using VersaBank's proprietary, state-of-the-art banking technology. Consistent with its branchless, business-to-business, partner-based digital banking strategy, VersaBank's SRP enables it to access the massive and growing consumer and small business financing market in an indirect, efficient and highly risk-mitigated manner.
| VersaBank – Q3 2026 MD&A | 4 |
In the third quarter of 2026, VersaBank launched its industry breakthrough Real-Time SRP, which is intended to provide the same reliable, economically attractive funding solution as the Bank's existing SRP, with the additional benefit of eliminating the need for SRP partners to warehouse multiple receivables over a period of time (typically from five to 30 or more days). This will enable the Bank's SRP partners to finance individual loans within just hours, and is intended to reduce the overall financing cost and the need for warehouse financing, as well as the interest rate risk associated with the warehousing period. It is also expected to further strengthen VersaBank's exceptional risk mitigation capabilities by enabling the Bank to better leverage its own, internal AI platform through evaluation of the partner loans underlying the SRP receivables on an individual basis.
Following its acquisition of a US bank in September 2024, VersaBank broadly launched its SRP to the underserved multi-trillion-dollar US point-of-sale financing market. The Bank has a strong and growing pipeline of prospective SRP partners that it is aggressively pursuing. The Bank surpassed its first-year target of US$290 million with total US SRP assets of US$310 million in fiscal 2025. The Bank expects to continue to expand its business with existing US partners while adding new US partners in fiscal 2026 as the program scales. The roll out of the Real-Time SRP in the US is expected to drive the capture of additional market share from securitized financing providers, expanding the Bank’s addressable market.
In Canada, VersaBank remains focused on expanding its well-established SRP portfolio by deepening relationships with existing partners, adding new partners, and capturing growth opportunities driven by broader economic recovery and continued demand for SRP financing. The roll out of the Real-Time SRP in Canada is expected to enable the Bank to win additional financing business with its existing partners while also enabling the Bank to acquire new partners with more specialized financing needs that it was previously unable to address.
VersaBank has access to sufficient low-cost deposit sources to fund its expected strong growth in credit assets. The Bank’s low-cost deposit sources, combined with the efficiency of its technology-based, business-to-business model, supports its objectives of maintaining a stable net interest margin over the short term and expanding its net interest margin over time. Management believes that VersaBank has one of the strongest liquidity risk profiles among North American banks, attributable to the quality, stability and stickiness of its deposit base. The majority of VersaBank’s US and Canadian deposits are sourced through deposit brokers, specifically the investment dealers, wealth management firms and financial advisory firms that distribute the Bank’s term deposit products. VersaBank has high visibility into the fixed maturities of these deposits, further enhancing its liquidity risk profile. In Canada, the Bank also sources deposits through Licensed Insolvency Trustee firms, which value the ability to use proprietary technology developed by VersaBank to seamlessly and efficiently interface with their respective administrative software, which results in a lower cost of funds to the Bank compared to conventional deposits. The Bank expects its Insolvency Trustee deposits to increase in the short- to medium-term as the number of insolvency filings in Canada is expected to grow.
|
VersaBank – Q3 2026 MD&A |
5 |
Cybersecurity Products and Services
VersaBank’s wholly owned, Minnesota-based subsidiary, DRTC, generates the vast majority of its revenue and incurs the vast majority of its costs through Digital Boundary Group, which addresses the high-growth market for cybersecurity and related IT privacy services arising from the growing volume of cyber threats and privacy issues challenging businesses of all sizes across all sectors (with a specialty in financial institutions) and government entities on a daily basis. DRTC has established itself as a North American leader in the markets it serves, with more than 400 clients, including large financial services companies, critical infrastructure companies and indispensable government organizations such as metropolitan police departments. DRTC is focused on growing revenue through offering new products and services to existing clients and adding new clients, capitalizing on the significant expected long-term growth in the cybersecurity and privacy market globally.
Under the US Federal Reserve’s approval of VersaBank’s 2024 acquisition of a US bank, the Bank is required to cease or divest of certain impermissible activities, including the cybersecurity services housed within DRTC and Digital Boundary Group before September 2026, which, in August 2026, was extended to August 30, 2027. Such divestment could be accomplished through a number of corporate actions, and the Bank has initiated a process to identify and evaluate strategic alternatives with the objective to maximize the value derived from the divestiture for shareholders.
Tokenized Deposit Services (Digital Meteor)
VersaBank also expects to capitalize on its leading-edge, proprietary technology to develop highly encrypted digital assets that will combine the safety and soundness of traditional banking with the efficiency, cost savings, security, and flexibility of blockchain technology. VersaBank believes that its technology provides superior security, stability, and regulatory compliance compared to conventional alternatives. Using the VersaVault® technology held by its wholly owned subsidiary, DRTC, VersaBank’s RBTD™s are tokenized deposits, which are digital representations of traditional bank deposits on a blockchain, offering enhanced efficiency, programmability, and security in financial transactions. RBTDs are designed to provide a trusted alternative for mainstream financial applications, including efficient payments, addressing the rapidly growing propensity of consumers and businesses to hold assets in e-wallets and engage in financial transactions digitally. VersaBank believes its RBTDs represent the next step in the evolution of such digital assets and a superior alternative to stablecoins. VersaBank’s RBTDs were conceived of and have been developed to comply with the evolving regulatory requirements. We are seeking confirmation from the applicable regulators that our RBTDs will be eligible for conventional federal deposit insurance and that we will have the legal ability to pay interest. By contrast, stablecoins issued in the United States under the US GENIUS Act are currently not permitted to pay interest and will not be eligible for federal deposit insurance, and in Canada, where stablecoin legislation has not yet come into force and still requires regulatory development, it is possible that similar restrictions could apply.
Management believes that licensed banks, as the trusted, regulated safekeepers of personal and business cash assets and other valuables, are naturally positioned to do the same for tokenized deposits. VersaBank has established itself as a leader in digital asset innovation. Management believes its trusted and secure solutions, along with the potential for RBTDs to be an ultra-low-cost source of deposit funding, will play a meaningful role in enabling banks and other entities to confidently engage in the rapidly developing field of digital commerce. Management is encouraged by the favorable stance of the current US administration with respect to digital assets and the role they can play in the future of banking and commerce in the United States, as well as around the world. As a digital asset with a continuously known value, VersaBank’s RBTDs are designed to provide a trusted alternative for mainstream financial applications and can be seamlessly converted to and from other digital currencies such as Bitcoin.
| VersaBank – Q3 2026 MD&A | 6 |
VersaBank is also using its proprietary VersaVault® technology to address the need in both the United States and Canada for regulated custody services for stablecoin issuers. The VersaVault® system was audited and confirmed as compliant with System Organization Controls 2 Type 1 in 2022.
The Bank expects both the issuance of its RBTDs and the provision of stablecoin custody services to be an incremental source of low-cost deposits for its credit asset businesses, predominantly its SRP business.
Although the intellectual property, software and other assets related to VersaVault® and the RBTD and stablecoin custody services technology currently reside within DRTC, they are not expected to be part of any divestiture of the cybersecurity services business within DRTC.
In addition, VersaBank remains highly committed to, and focused on, further developing and enhancing its technology advantage, a key component of its value proposition that not only provides efficient access to VersaBank’s chosen underserved lending and deposit markets, but also delivers superior financial products and better customer service to its clients.
The underlying drivers of VersaBank’s performance for the current and comparative periods are set out in the following sections of this MD&A.
Reorganization
During the current quarter, the Bank publicly filed a Form S-4 registration statement (the “Registration Statement”) with the SEC in connection with the Bank’s proposed Reorganization, which was subsequently declared effective by the SEC on August 4, 2026. Specifically, the Reorganization, among other things, will cause Versa Bancorp, a new Delaware corporation (the “Parent”) to become the holding company of VersaBank and VersaBank USA National Association.
The Bank will hold a special meeting for its shareholders ("the Meeting") to consider and vote on its proposed Reorganization. The Meeting will be held in person at 1979 Otter Place, London, Ontario, Canada, on September 16, 2026, at 10:30 a.m. ET. Shareholders of record of the Bank at the close of business on August 10, 2026, are entitled to receive notice of and to vote at the Meeting. In addition to the approval of shareholders, the completion of the Reorganization remains subject to various regulatory approvals, including approval by the Minister of Finance in Canada and the Federal Reserve Board in the United States. There can be no assurance that VersaBank will receive shareholder or regulatory approval in a timely manner, if at all.
| VersaBank – Q3 2026 MD&A | 7 |
Overview of Performance
Note Regarding VersaBank’s Third Quarter Fiscal 2026 Financial Results: VersaBank’s financial results for the third quarter of fiscal 2026 reflect non-core non-interest expenses in the amount of $3.1 million, composed of $2.5 million related to the project costs associated with the proposed Reorganization and $600,000 related to the write-off of capitalized software costs associated with the sale of the US branch assets and deposits in the quarter.
The Reorganization is intended to enhance shareholder value, mitigate risk and reduce corporate costs over the long term. The Bank expects that the anticipated benefits of the Reorganization will exceed the associated investment however, these expected benefits are subject to various assumptions and uncertainties. The Bank expects the Reorganization to be completed in fiscal 2026.
Note Regarding the Change in Name Of “Receivable Purchase Program” (“RPP”) To “Structured Receivable Program” (“SRP”): As part of its previously announced Reorganization (see note below), at the beginning of fiscal 2026, VersaBank has changed the name of its Receivable Purchase Program (“RPP”) to Structured Receivable Program (“SRP”). The underlying business model of the SRP has not changed in any way.
| VersaBank – Q3 2026 MD&A | 8 |
* See definition in the "Non-GAAP and Other Financial Measures" section below.
Recent Developments
 |
The Bank continued to realize rapid expansion of its credit asset portfolio in the US through the successful ramp up of its SRP. Following the achievement of its first-year target for SRP credit assets and the signing of an agreement with its largest US SRP partner to date at the end of Q4 2025, the Bank grew its total SRP assets to US$793 million at the end of the third quarter of fiscal 2026. |
|
The Bank entered into an agreement with a wholly owned subsidiary of ECN Capital (the "ECN Subsidiary"), under which the ECN Subsidiary will utilize the Bank's core SRP in the United States. This is the second SRP program into which ECN Capital has entered with VersaBank in the United States. The ECN Subsidiary is expected to contribute at least US$300 million in additional US SRP fundings annually. VersaBank and ECN Capital believe the program could grow well beyond US$500 million per year in funding in the future. |
| VersaBank – Q3 2026 MD&A | 9 |
|
The Bank launched its industry breakthrough Real-Time SRP, which is intended to provide the same reliable, economically attractive funding solution as the Bank's existing SRP, with the additional benefit of eliminating the need for SRP partners to warehouse multiple receivables over a period of time (typically from five to 30 or more days). This will enable the Bank's SRP partners to finance individual loans within just hours and is intended to reduce the overall financing cost and the need for warehouse financing, as well as the interest rate risk associated with the warehousing period. It also is intended to further strengthen VersaBank's exceptional risk mitigation capabilities by enabling the Bank to better leverage its own, internal AI platform through evaluation of the partner loans underlying the SRP receivables on an individual basis. The Bank expects its Real-Time SRP to enable it to obtain additional financing business with existing partners, while enabling it to acquire new partners with more specialized financing needs that it was previously unable to address. It also expects its Real-Time SRP to enable it to further capture market share from securitized financing providers. |
|
The Bank added point-of-sale financing industry veteran Moe Danis, CFA, to the Bank's SRP team to support business development in response to increased demand following the Bank's launch of its Real-Time SRP, with a particular focus on specialized large-partner opportunities in the US market. |
|
The Bank’s sale of certain assets associated with its only physical branch, located Holdingford, Minnesota, to Stearns Bank National Association was approved by the Office of the Comptroller of the Currency ("OCC") during the second quarter and the transaction closed on May 1, 2026. |
Q3 2026 vs Q3 2025
|
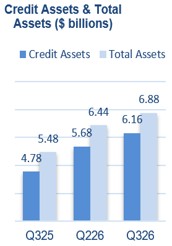
Credit assets increased 29% to a record $6.16 billion, driven primarily by strong growth in each of the US and Canadian SRP portfolios, which, combined, increased 40%; |
| |
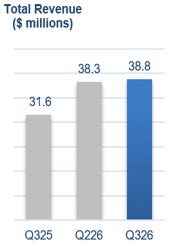
Total revenue increased 23% to a record $38.8 million, composed of record net interest income of $36.8 million and non-interest income of $2.0 million; |
| |
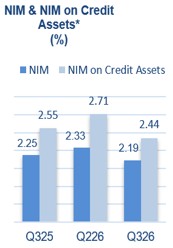
Net interest margin (“NIM”) on credit assets was 2.44%, a decrease of 11 bps. NIM was 2.19%, a decrease of 6 bps. The decrease in NIM reflected higher than typical GIC (term deposit) rates relative to Government of Canada bond yields, the replacement of retail deposits with brokered deposits resulting from the sale of the Bank's only physical branch in the US, as well as the Bank's decision to maintain greater liquidity amidst a challenging Canadian economy. The decrease in NIM also reflected lower credit asset yields in Canada due to the shift in credit asset mix resulting from the continued growth in the SRP portfolio, as well as growth in lower-risk, lower regulatory risk-weighted insured Multi-Family Residential Loans (“MROL”) credit assets from higher-yielding, higher regulatory risk-weighted uninsured MROL credit assets. The Bank’s NIM remains amongst the highest of the publicly traded Canadian Schedule I banks; |
| |
Recovery of credit loss provisions was $229,000 compared with a provision for credit losses (“PCL”) of $1.2 million, with the recovery being primarily due to the sale of branch assets and updates in the forward-looking information used by VersaBank in its credit risk models; |
| |
Recovery of credit loss provisions as a percentage of average credit assets was -0.02% compared with a PCL as a percentage of average credit assets of 0.10%, which remains among the lowest of the publicly traded Canadian Schedule I banks; |
| |
Non-interest expense, excluding non-core non-interest expenses in the amount of $3.1 million, was $22.1 million compared with $17.4 million, excluding $4.2 million in project costs associated with the Reorganization, with the increase primarily due to $0.8 million expense related to share-based long-term incentive awards, driven by the Bank's strong share price performance during the quarter, as well as $1.5 million in other transitory costs that the Bank does not expect to recur; |
| VersaBank – Q3 2026 MD&A | 10 |
| |
Non-interest expenses, including the $3.1 million non-core costs noted above, were $25.2 million compared with $21.6 million, which included $4.2 million in non-core costs; |
| |
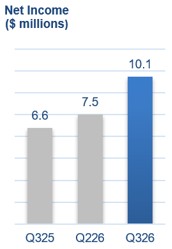
Net income (including the $3.1 million in non-core expenses noted above) was $10.1 million compared with $6.6 million (including the $4.2 million in non-core expenses noted above); |
|
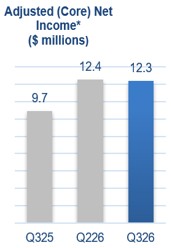
Adjusted (core) net income (excluding the $3.1 million charge noted above) was $12.3 million compared with $9.7 million (excluding the $4.2 million charge noted above) (see Non-GAAP and Other Financial Measures), with the increase primarily due to higher revenues driven by growth in the Bank’s SRP portfolio, offset partially by incremental operating costs; |
| |
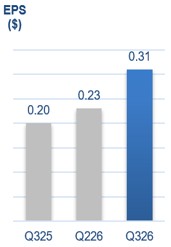
Income or earnings per common share (“EPS”) (including the $3.1 million charge noted above) was $0.31 compared with $0.20 (which includes the $4.2 million in non-core expenses noted above); |
| |
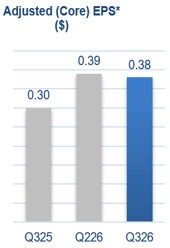
Adjusted (core) income or earnings per common share (“Adjusted (core) EPS”) (excluding the $3.1 million in non-core expenses noted above) increased to $0.38 from $0.30 (which excludes the $4.2 million in non-core expenses noted above), with the increase primarily due to higher revenues driven by the growth in the Bank’s SRP portfolio (see Non-GAAP and Other Financial Measures); |
|
Return on average common equity (including the $3.1 million in non-core expenses noted above) was 7.14% compared with 4.94% (which includes the $4.2 million in non-core expenses noted above); |
| |
Adjusted (core) return on average common equity (excluding the $3.1 million in non-core expenses noted above) was 8.72% compared with 7.24% (which excludes the $4.2 million in non-core expenses noted above) (see Non-GAAP and Other Financial Measures); |
| |
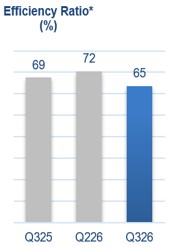
Efficiency ratio (including non-core expenses noted above) was 65% compared with 69% (which includes the $4.2 million in non-core expenses noted above) and reflects the fixed cost structure of the Bank's US operations to support the US SRP program at scale during a period when the US SRP is in its ramp-up phase. The Bank's US operations at scale are expected to be significantly more efficient than its Canadian operations; and, |
| |
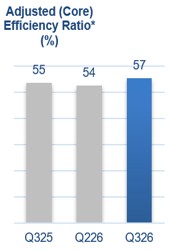
Adjusted (core) efficiency ratio (excluding the $3.1 million in non-core expenses noted above) was 57% compared with 55% (see Non-GAAP and Other Financial Measures). |
Q3 2026 vs Q2 2026
|
Credit assets increased 9% to a record $6.16 billion, driven primarily by strong growth in each of the US and Canadian SRP portfolios, which, combined, increased 11%; |
|
Total revenue increased 1% to a record $38.8 million, composed of a record net interest income of $36.8 million and non-interest income of $2.0 million; |
|
|
NIM on credit assets was 2.44%, a decrease of 27 bps. NIM was 2.19%, a decrease of 14 bps. The decrease in NIM reflected higher than typical GIC (term deposit) rates relative to Government of Canada bond yields, the replacement of retail deposits with brokered deposits resulting from the sale of the Bank's only physical branch in the US, as well as the Bank's decision to maintain greater liquidity amidst a challenging Canadian economy. The decrease in NIM also reflected lower credit asset yields in Canada due to the shift in credit asset mix resulting from the continued growth in the SRP portfolio, as well as growth in lower-risk, lower regulatory risk-weighted insured MROL credit assets from higher-yielding, higher regulatory risk-weighted uninsured MROL credit assets. The Bank’s NIM remains amongst the highest of the publicly traded Canadian Schedule I banks; |
| VersaBank – Q3 2026 MD&A | 11 |
|
Recovery of credit loss provisions was $229,000 compared with a PCL of $428,000, with the recovery being primarily due to the sale of branch assets and updates in the forward-looking information used by VersaBank in its credit risk models; |
|
Recovery of credit loss provisions as a percentage of average credit assets was -0.02% compared with a PCL as a percentage of average credit assets of 0.03%, which remains among the lowest of the publicly traded Canadian Schedule I banks; |
|
Non-interest expense, excluding non-core expenses in the amount of $3.1 million, composed of $2.5 million related to the project costs associated with the Reorganization and $600,000 related to write-off of capitalized software costs associated with the sale of branch assets and deposits in the quarter, was $22.1 million compared with $20.8 million (which excludes non-core expenses of $6.7 million, composed of $4.5 million related to the project costs associated with the Reorganization and a $2.2 million write-down of an intangible asset related to the customer deposit base of the Bank’s previously sole physical branch), with the increase primarily due to $0.8 million expense related to share-based long-term incentive awards, driven by the Bank's strong share price performance during the quarter, as well as $1.5 million in other transitory costs that the Bank does not expect to recur; |
|
Non-interest expenses, including the $3.1 million in non-core expenses noted above, were $25.2 million compared with $27.5 million (which included non-core expenses of $6.7 million noted above); |
|
Net income (including the $3.1 million in non-core expenses noted above) was $10.1 million compared with $7.5 million (which includes the $6.7 million in non-core expenses noted above), with the increase primarily due to higher revenues driven by the Bank’s expanding SRP portfolio, offset partially by higher non-interest expenses; |
|
Adjusted (core) net income (excluding the $3.1 million in non-core expenses noted above) was $12.3 million compared with $12.4 million (excluding the $6.7 million in non-core expenses noted above) (see Non-GAAP and Other Financial Measures); |
|
EPS (including the $3.1 million project non-core expenses noted above) was $0.31 compared with $0.23 (which includes the $6.7 million in non-core expenses noted above); |
|
Adjusted (core) EPS (excluding the $3.1 million in non-core expenses noted above) was $0.38 compared with $0.39 (which excludes the $6.7 million in non-core expenses noted above) (see Non-GAAP and Other Financial Measures); |
|
Return on average common equity (including the $3.1 million in non-core expenses noted above) was 7.14% compared with 5.64% (which includes the $6.7 million in non-core expenses noted above); |
|
Adjusted (core) return on average common equity (excluding the $3.1 million non-core expenses noted above) was 8.72% compared with 9.23% (which excludes the $6.7 million in non-core expenses noted above) (see Non-GAAP and Other Financial Measures); |
|
Efficiency ratio (including non-core expenses noted above) was 65% compared with 72% (which includes the $6.7 million in non-core expenses noted above); and, |
| VersaBank – Q3 2026 MD&A | 12 |
| |
Adjusted (core) efficiency ratio (excluding the $3.1 million in non-core expenses noted above) was 57% compared with 54% (which excludes the $6.7 million in non-core expenses noted above) (see Non-GAAP and Other Financial Measures). |
Q3 YTD 2026 vs Q3 YTD 2025
|
Credit assets increased 29% to a record $6.16 billion, driven primarily by strong growth in each of the US and Canadian SRP portfolios, which, combined, increased 40%; |
|
Total revenue increased 27% to a record $113.6 million, composed of a record net interest income of $106.3 million and non-interest income of $7.3 million; |
|
NIM on credit assets was 2.53%, an increase of 3 bps. NIM was 2.24%, an increase of 7 bps. The increase in NIM was primarily due to lower cost of funds resulting from lower interest rates on renewals of maturing deposits throughout fiscal 2025 and the normalization of the yield curve from the atypically inverted yield curve that existed in the early part of fiscal 2025, offset partially by lower yield stemming from the continued growth in the SRP portfolio, which is composed of lower regulatory risk-weighted, lower yielding assets compared with higher yielding, higher regulatory risk-weighted MROL. The Bank’s NIM remains amongst the highest of the publicly traded Canadian Schedule I banks; |
|
PCL was $899,000 compared with $3.1 million, with the decrease being primarily due to the sale of branch assets and updates in the forward-looking information used by VersaBank in its credit risk models; |
|
PCL as a percentage of average credit assets was 0.02% compared with 0.09%, which remains among the lowest of the publicly traded Canadian Schedule I banks; |
|
Non-interest expense, excluding $11.3 million of non-core expenses composed of $8.5 million in costs associated with the Reorganization, a $2.2 million intangible asset write-off and a $600,000 write-off of capitalized software costs resulting from the sale of the Bank’s sole physical branch in the quarter, was $61.9 million compared with $50.6 million (which excludes $4.2 million in non-core expenses associated with the Reorganization), with the increase primarily due to expense related to share-based long-term incentive awards, driven by the Bank's strong share price performance during the quarter, as well as other transitory costs that the Bank does not expect to recur; |
|
Non-interest expenses, including the $11.3 million in non-core expenses noted above, were $73.2 million compared with $54.9 million, which includes $4.2 million in non-core expenses noted above; |
|
Net income (including the $11.3 million in non-core expenses noted above) increased to $28.7 million compared with $23.3 million; |
| VersaBank – Q3 2026 MD&A | 13 |
|
Adjusted (core) net income (excluding the $11.3 million in non-core expenses noted above) increased to $36.8 million from $26.3 million (which excludes $4.2 million in non-core expenses noted above) (see Non-GAAP and Other Financial Measures), primarily due to higher revenues driven by growth in the Bank’s SRP portfolio, offset partially by higher non-interest expenses; |
|
EPS (including the $11.3 million in non-core expenses noted above) increased to $0.89 from $0.74 (which includes $4.2 million in non-core expenses noted above); |
|
Adjusted (core) EPS (excluding the $11.3 million in non-core expenses noted above) increased to $1.15 from $0.84 (which excludes $4.2 million in non-core expenses noted above), with the increase primarily due to higher revenues driven by the Bank’s expanding SRP portfolio with the growth of VersaBank USA operations (see Non-GAAP and Other Financial Measures); |
|
Return on average common equity (including the $11.3 million non-core expenses noted above) was 6.98% compared with 6.71% (which includes $4.2 million in non-core expenses noted above); |
|
Adjusted (core) return on average common equity (excluding the $11.3 million in non-core expenses noted above) was 8.90% compared with 7.57% (which excludes $4.2 million in non-core expenses noted above) (see Non-GAAP and Other Financial Measures) |
|
Efficiency ratio (including the $11.3 million non-core expenses noted above) was 64% compared with 61% (which includes $4.2 million in non-core expenses noted above); and, |
|
Adjusted (core) efficiency ratio (excluding the $11.3 million in non-core expenses noted above) was 54% compared with 57% (which excludes $4.2 million in non-core expenses noted above) (see Non-GAAP and Other Financial Measures). |
| VersaBank – Q3 2026 MD&A | 14 |
Selected Financial Highlights
|
(unaudited) |
for the three months ended |
for the nine months ended |
||||||||||||||
|
July 31 |
July 31 |
July 31 |
July 31 |
|||||||||||||
|
(thousands of Canadian dollars, except per share amounts) |
2026 |
2025 |
2026 |
2025 |
||||||||||||
|
Results of operations |
||||||||||||||||
|
Interest income |
$ | 89,737 | $ | 73,987 | $ | 254,013 | $ | 218,209 | ||||||||
|
Net interest income |
36,773 | 29,779 | 106,333 | 83,535 | ||||||||||||
|
Non-interest income |
2,036 | 1,804 | 7,283 | 6,014 | ||||||||||||
|
Total revenue |
38,809 | 31,583 | 113,616 | 89,549 | ||||||||||||
|
Provision for (recovery of) credit losses |
(229 | ) | 1,181 | 899 | 3,094 | |||||||||||
|
Non-interest expenses |
25,162 | 21,649 | 73,194 | 54,864 | ||||||||||||
|
Digital Banking |
22,691 | 19,271 | 65,516 | 46,467 | ||||||||||||
|
DRTC |
2,567 | 2,087 | 7,911 | 7,787 | ||||||||||||
|
Digital Meteor |
251 | 634 | 803 | 1,662 | ||||||||||||
|
Net income |
10,060 | 6,582 | 28,654 | 23,254 | ||||||||||||
|
Adjusted (Core) net income* |
12,303 | 9,670 | 36,843 | 26,342 | ||||||||||||
|
Income per common share: |
||||||||||||||||
|
Basic |
$ | 0.31 | $ | 0.20 | $ | 0.89 | $ | 0.74 | ||||||||
|
Diluted |
$ | 0.31 | $ | 0.20 | $ | 0.89 | $ | 0.74 | ||||||||
|
Adjusted (Core) income per common share basic and diluted* |
$ | 0.38 | $ | 0.30 | $ | 1.15 | $ | 0.84 | ||||||||
|
Dividends paid on common shares |
$ | 809 | $ | 807 | $ | 2,410 | $ | 2,433 | ||||||||
|
Yield* |
5.35 | % | 5.58 | % | 5.35 | % | 5.66 | % | ||||||||
|
Cost of funds* |
3.16 | % | 3.33 | % | 3.11 | % | 3.49 | % | ||||||||
|
Net interest margin* |
2.19 | % | 2.25 | % | 2.24 | % | 2.17 | % | ||||||||
|
Net interest margin on credit assets* |
2.44 | % | 2.55 | % | 2.53 | % | 2.50 | % | ||||||||
|
Return on average common equity* |
7.14 | % | 4.94 | % | 6.98 | % | 6.71 | % | ||||||||
|
Adjusted (Core) return on average common equity* |
8.72 | % | 7.24 | % | 8.90 | % | 7.57 | % | ||||||||
|
Book value per common share* |
$ | 17.45 | $ | 16.42 | $ | 17.45 | $ | 16.42 | ||||||||
|
Efficiency ratio* |
65 | % | 69 | % | 64 | % | 61 | % | ||||||||
|
Adjusted (Core) efficiency ratio* |
57 | % | 55 | % | 54 | % | 57 | % | ||||||||
|
Return on average total assets* |
0.60 | % | 0.50 | % | 0.60 | % | 0.60 | % | ||||||||
|
Provision for (recovery of) credit losses as a % of average credit assets* |
(0.02 | %) | 0.10 | % | 0.02 | % | 0.09 | % | ||||||||
|
as at |
||||||||||||||||
|
Balance Sheet Summary |
||||||||||||||||
|
Cash |
$ | 490,049 | $ | 460,312 | $ | 490,049 | $ | 460,312 | ||||||||
|
Securities |
134,178 | 160,136 | 134,178 | 160,136 | ||||||||||||
|
Credit assets, net of allowance for credit losses |
6,161,542 | 4,778,316 | 6,161,542 | 4,778,316 | ||||||||||||
|
Average credit assets |
5,918,711 | 4,651,064 | 5,613,960 | 4,507,216 | ||||||||||||
|
Total assets |
6,875,238 | 5,477,489 | 6,875,238 | 5,477,489 | ||||||||||||
|
Deposits |
5,909,865 | 4,627,410 | 5,909,865 | 4,627,410 | ||||||||||||
|
Subordinated notes payable |
103,793 | 102,148 | 103,793 | 102,148 | ||||||||||||
|
Shareholders' equity |
565,565 | 528,142 | 565,565 | 528,142 | ||||||||||||
|
Capital ratios** |
||||||||||||||||
|
Risk-weighted assets |
$ | 4,717,516 | $ | 3,740,088 | $ | 4,717,516 | $ | 3,740,088 | ||||||||
|
Common Equity Tier 1 capital |
540,934 | 507,212 | 540,934 | 507,212 | ||||||||||||
|
Total regulatory capital |
628,283 | 617,079 | 628,283 | 617,079 | ||||||||||||
|
Common Equity Tier 1 (CET1) ratio |
11.47 | % | 13.56 | % | 11.47 | % | 13.56 | % | ||||||||
|
Tier 1 capital ratio |
11.47 | % | 13.56 | % | 11.47 | % | 13.56 | % | ||||||||
|
Total capital ratio |
13.32 | % | 16.50 | % | 13.32 | % | 16.50 | % | ||||||||
|
Leverage ratio |
7.64 | % | 8.90 | % | 7.64 | % | 8.90 | % | ||||||||
* See definitions under ‘Non-GAAP and Other Financial Measures' in the Q3 2026 Management’s Discussion and Analysis.
** Capital management and leverage measures are in accordance with OSFI's Capital Adequacy Requirements and Basel III Accord.
| VersaBank – Q3 2026 MD&A | 15 |
Financial Review – Earnings
Total Revenue
Total revenue, which consists of net interest income and non-interest income, for the quarter ended July 31, 2026 increased 23% to a record $38.8 million compared with the same period a year ago and increased 1% compared with the second quarter of fiscal 2026. Total revenue for the nine months ended July 31, 2026 increased 27% to $113.6 million compared with the same period last year.
Net Interest Income
|
(thousands of Canadian dollars) |
||||||||||||||||||||||||||||||||
|
For the three months ended: |
For the nine months ended: |
|||||||||||||||||||||||||||||||
|
July 31 |
April 30 |
July 31 |
July 31 |
July 31 |
||||||||||||||||||||||||||||
|
2026 |
2026 |
Change |
2025 |
Change |
2026 |
2025 |
Change |
|||||||||||||||||||||||||
|
Interest income |
||||||||||||||||||||||||||||||||
|
Structured receivable program |
$ | 69,858 | $ | 64,419 | 8 | % | $ | 52,601 | 33 | % | $ | 195,599 | $ | 153,640 | 27 | % | ||||||||||||||||
|
Multi-family residential loans and other |
13,546 | 13,266 | 2 | % | 16,213 | (16 | %) | 41,142 | 48,031 | (14 | %) | |||||||||||||||||||||
|
Other |
6,333 | 5,375 | 18 | % | 5,173 | 22 | % | 17,272 | 16,538 | 4 | % | |||||||||||||||||||||
|
Interest income |
$ | 89,737 | $ | 83,060 | 8 | % | $ | 73,987 | 21 | % | $ | 254,013 | $ | 218,209 | 16 | % | ||||||||||||||||
|
Interest expense |
||||||||||||||||||||||||||||||||
|
Deposit and other |
$ | 51,314 | $ | 46,033 | 11 | % | $ | 42,856 | 20 | % | $ | 143,317 | $ | 130,537 | 10 | % | ||||||||||||||||
|
Subordinated notes |
1,650 | 1,348 | 22 | % | 1,352 | 22 | % | 4,363 | 4,137 | 5 | % | |||||||||||||||||||||
|
Interest expense |
$ | 52,964 | $ | 47,381 | 12 | % | $ | 44,208 | 20 | % | $ | 147,680 | $ | 134,674 | 10 | % | ||||||||||||||||
|
Net interest income |
$ | 36,773 | $ | 35,679 | 3 | % | $ | 29,779 | 23 | % | $ | 106,333 | $ | 83,535 | 27 | % | ||||||||||||||||
|
Non-interest income |
$ | 2,036 | $ | 2,614 | (22 | %) | $ | 1,804 | 13 | % | $ | 7,283 | $ | 6,014 | 21 | % | ||||||||||||||||
|
Total revenue |
$ | 38,809 | $ | 38,293 | 1 | % | $ | 31,583 | 23 | % | $ | 113,616 | $ | 89,549 | 27 | % | ||||||||||||||||
Q3 2026 vs Q3 2025
Net interest income increased 23% to a record $36.8 million primarily due to:
| |
Higher interest income attributable to continued SRP portfolio growth in Canada and in US. |
Offset partially by:
|
Higher interest expense attributable primarily to higher corresponding deposit balance growth to support the credit asset growth; |
|
Higher interest expense associated with the shift in composition of replacing branch originated deposits with higher cost brokered deposits; and, |
|
The impact of the planned transition of some higher yielding, higher regulatory risk-weighted MROL to lower yielding, lower regulatory risk-weighted MROL as part of the Bank’s strategy to capitalize on opportunities for lower regulatory capital risk-weighted credit assets with a higher return on capital deployed. |
| VersaBank – Q3 2026 MD&A | 16 |
Q3 2026 vs Q2 2026
Net interest income increased by 3% to $36.8 million primarily due to:
|
Higher interest income attributable to continued US SRP portfolio growth. |
Offset partially by:
|
Higher interest expense is attributable primarily to higher corresponding deposit balance growth to support credit asset growth; and, |
|
Higher interest expense associated with shift in composition of replacing branch originated deposits with higher cost brokered deposits. |
Q3 YTD 2026 vs Q3 YTD 2025
Net interest income increased 27% to a record $106.3 million primarily due to:
|
Higher interest income attributable to continued SRP portfolio growth in Canada and the US. |
Offset partially by:
|
Higher interest expense attributable primarily to higher corresponding deposit balance growth to support the credit asset growth; |
|
Higher interest expense associated with shift in composition of replacing branch deposits with higher cost brokered deposits; and, |
|
The impact of the planned transition of some higher yielding, higher regulatory risk-weighted MROL to lower yielding, lower regulatory risk-weighted MROL as part of the Bank’s strategy to capitalize on opportunities for lower regulatory capital risk-weighted credit assets with a higher return on capital deployed. |
Net Interest Margin
|
(thousands of Canadian dollars) |
||||||||||||||||||||||||||||||||
|
For the three months ended: |
For the nine months ended: |
|||||||||||||||||||||||||||||||
|
July 31 |
April 30 |
July 31 |
July 31 |
July 31 |
||||||||||||||||||||||||||||
|
2026 |
2026 |
Change |
2025 |
Change |
2026 |
2025 |
Change |
|||||||||||||||||||||||||
|
Interest income |
$ | 89,737 | $ | 83,060 | 8 | % | $ | 73,987 | 21 | % | $ | 254,013 | $ | 218,209 | 16 | % | ||||||||||||||||
|
Interest expense |
52,964 | 47,381 | 12 | % | 44,208 | 20 | % | 147,680 | 134,674 | 10 | % | |||||||||||||||||||||
|
Net interest income |
36,773 | 35,679 | 3 | % | 29,779 | 23 | % | 106,333 | 83,535 | 27 | % | |||||||||||||||||||||
|
Average assets |
$ | 6,657,969 | $ | 6,293,355 | 6 | % | $ | 5,262,311 | 27 | % | $ | 6,341,857 | $ | 5,157,987 | 23 | % | ||||||||||||||||
|
Yield* |
5.35 | % | 5.42 | % | (1 | %) | 5.58 | % | (4 | %) | 5.35 | % | 5.66 | % | (5 | %) | ||||||||||||||||
|
Cost of funds* |
3.16 | % | 3.09 | % | 2 | % | 3.33 | % | (5 | %) | 3.11 | % | 3.49 | % | (11 | %) | ||||||||||||||||
|
Net interest margin* |
2.19 | % | 2.33 | % | (6 | %) | 2.25 | % | (3 | %) | 2.24 | % | 2.17 | % | 3 | % | ||||||||||||||||
|
Average gross credit assets |
$ | 5,899,823 | $ | 5,487,247 | 8 | % | $ | 4,634,349 | 27 | % | $ | 5,595,836 | $ | 4,489,580 | 25 | % | ||||||||||||||||
|
Net interest margin on credit assets* |
2.44 | % | 2.71 | % | (10 | %) | 2.55 | % | (4 | %) | 2.53 | % | 2.50 | % | 1 | % | ||||||||||||||||
* See definition in "Non-GAAP and Other Financial Measures" section below.
| VersaBank – Q3 2026 MD&A | 17 |
Q3 2026 vs Q3 2025
Net interest margin decreased 6 bps primarily due to:
|
Higher than typical GIC (term deposit) rates relative to Government of Canada bond yields; |
|
The replacement of retail deposits with brokered deposits resulting from the sale of the Bank's only physical branch in the US; |
|
The Bank's decision to maintain greater liquidity amidst a challenging Canadian economy; and, |
|
Lower credit asset yields in Canada due to the shift in credit asset mix resulting from the continued growth in the SRP portfolio, as well as growth in lower-risk, lower regulatory risk-weighted insured MROL credit assets from higher-yielding, higher regulatory risk-weighted uninsured MROL credit assets. |
Q3 2026 vs Q2 2026
Net interest margin decreased 14 bps primarily due to:
|
Higher than typical GIC (term deposit) rates relative to Government of Canada bond yields; |
|
The replacement of retail deposits with brokered deposits resulting from the sale of the Bank's only physical branch in the US; |
|
The Bank's decision to maintain greater liquidity amidst a challenging Canadian economy; and, |
|
Lower credit asset yields in Canada due to the shift in credit asset mix resulting from the continued growth in the SRP portfolio, as well as growth in lower-risk, lower regulatory risk-weighted insured MROL credit assets from higher-yielding, higher regulatory risk-weighted uninsured MROL credit assets. |
Q3 YTD 2026 vs Q3 YTD 2025
Net interest margin increased 7 bps primarily due to:
|
Reductions in the cost of funds due to lower rates on renewals of maturing deposits over the course of fiscal 2025; and, |
|
The normalization of the yield curve from the atypically inverted yield curve that existed in the early part of fiscal 2025. |
Offset partially by:
|
The continued growth in the SRP portfolio, which is composed of lower regulatory risk-weighted, lower yielding assets; and a reduction in cost of funds resulting from the renewal of maturing deposits at lower interest rates; and, |
|
The impact of the planned transition of some higher yielding, higher regulatory risk-weighted MROL to lower yielding, lower regulatory risk-weighted MROL as part of the Bank’s strategy to capitalize on opportunities for lower-risk weighted credit assets with a higher return on capital. |
The Bank’s NIM remains amongst the highest of the publicly traded Canadian Schedule I banks.
| VersaBank – Q3 2026 MD&A | 18 |
Non-Interest Income
Non-interest income is composed of revenue generated by DRTC, multi-unit residential (“MUR”) securitization transactions and income derived from miscellaneous transaction fees not directly attributable to credit assets.
Non-interest income increased 13% to $2.0 million from $1.8 million last year and decreased 22% from $2.6 million in the last quarter. The increase year over year was a function primarily of higher client engagements. The decrease quarter over quarter was a function primarily of lower client engagements and a gain on sale of a MUR securitization in the prior quarter.
Non-interest income for the nine months ended July 31, 2026, was $7.3 million compared with $6.0 million for the same period a year ago. The year-over-year trend was primarily due to a gain on the sale of the Bank's legacy equity investment in Stablecorp and a MUR securitization, and higher client engagements.
Provision for Credit Losses
|
(thousands of Canadian dollars) |
||||||||||||||||||||
|
For the three months ended: |
For the nine months ended: |
|||||||||||||||||||
|
July 31 |
April 30 |
July 31 |
July 31 |
July 31 |
||||||||||||||||
|
2026 |
2026 |
2025 |
2026 |
2025 |
||||||||||||||||
|
Provision for (recovery of) credit losses by credit asset: |
||||||||||||||||||||
|
Structured receivable program |
$ | (18 | ) | $ | 472 | $ | 981 | $ | 1,250 | $ | 3,198 | |||||||||
|
Multi-family residential loans and other |
(211 | ) | (44 | ) | 200 | (351 | ) | (104 | ) | |||||||||||
|
Total provision for (recovery of) credit losses |
$ | (229 | ) | $ | 428 | $ | 1,181 | $ | 899 | $ | 3,094 | |||||||||
Q3 2026 vs Q3 2025 vs Q2 2026
VersaBank recorded a recovery of credit losses in the amount of $229,000 in the current quarter compared to a provision for credit losses of $1.2 million last year and $428,000 last quarter, with the recovery primarily due to the sale of branch assets and updates in the forward-looking information used by the Bank in its credit risk models. Provision for credit losses as a percentage of average credit assets was -0.02% compared with 0.10% last year and 0.03% last quarter, which remains among the lowest of the publicly traded Canadian Schedule I banks.
Q3 YTD 2026 vs Q3 YTD 2025
VersaBank recorded a provision for credit losses in the amount of $899,000 in the current period compared to $3.1 million for the same period last year primarily due to the sale of branch assets and updates in the forward-looking information used by the Bank in its credit risk models. Provision for credit losses as a percentage of average credit assets was 0.02% compared with 0.09% for the same period last year.
| VersaBank – Q3 2026 MD&A | 19 |
Non-Interest Expenses
|
(thousands of Canadian dollars) |
||||||||||||||||||||||||||||||||
|
For the three months ended: |
For the nine months ended: |
|||||||||||||||||||||||||||||||
|
July 31 |
April 30 |
July 31 |
July 31 |
July 31 |
||||||||||||||||||||||||||||
|
2026 |
2026 |
Change |
2025 |
Change |
2026 |
2025 |
Change |
|||||||||||||||||||||||||
|
Salaries and benefits |
$ | 12,088 | $ | 11,202 | 8 | % | $ | 10,099 | 20 | % | $ | 33,673 | $ | 27,868 | 21 | % | ||||||||||||||||
|
General and administrative |
$ | 10,701 | 14,400 | (26 | %) | 9,717 | 10 | % | $ | 33,468 | 21,926 | 53 | % | |||||||||||||||||||
|
Premises and equipment |
$ | 2,373 | 1,884 | 26 | % | 1,833 | 29 | % | $ | 6,053 | 5,070 | 19 | % | |||||||||||||||||||
|
Total non-interest expenses |
$ | 25,162 | $ | 27,486 | (8 | %) | $ | 21,649 | 16 | % | $ | 73,194 | $ | 54,864 | 33 | % | ||||||||||||||||
|
Efficiency Ratio |
65 | % | 72 | % | (10 | %) | 69 | % | (6 | %) | 65 | % | 61 | % | 7 | % | ||||||||||||||||
Q3 2026 vs Q3 2025
Non-interest expenses, including non-core expenses in the amount of $3.1 million, composed of $2.5 million related to the project costs associated with the Reorganization and $600,000 related to write-off of capitalized software costs associated with the sale of branch assets and deposits in the quarter, increased 16% to $25.2 million primarily due to:
|
$0.8 million expense related to share-based long-term incentive awards, driven by the Bank's strong share price performance during the quarter; |
|
$1.5 million in other transitory costs that the Bank does not expect to recur; and, |
|
Ongoing project costs associated with the Reorganization and a write off of $600,000 as noted above. |
Q3 2026 vs Q2 2026
Non-interest expenses decreased 8% primarily due to:
|
Lower non-core expenses ($3.1 million in the current quarter compared to $6.7 million in the sequential quarter). |
Offset partially by:
|
$0.8 million expense related to share-based long-term incentive awards, driven by the Bank's strong share price performance during the quarter; and, |
| $1.5 million in other transitory costs that the Bank does not expect to recur. |
Q3 YTD 2026 vs Q3 YTD 2025
Non-interest expenses increased 33% primarily due to:
|
Expense related to share-based long-term incentive awards, driven by the Bank's strong share price performance during the quarter; |
|
Other transitory costs that the Bank does not expect to recur; |
|
Non-core expenses comprised of $8.5 million in costs associated with the Reorganization, a $2.2 million intangible asset write-off and a $600,000 write-off of capitalized software costs resulting from the sale of the Bank’s sole physical branch in the quarter, compared to $4.2 million in non-core expenses associated with the Reorganization a year ago; and, |
| VersaBank – Q3 2026 MD&A | 20 |
|
The onboarding cost of the RBTD™ platform for $0.6 million in the current period. |
Income Tax Provision
The Bank’s effective tax rate for the current and prior year is estimated to be approximately 27%. Shifts in the Bank’s effective tax rate from the statutory rates was a function primarily of adjustments to changes in assumptions on non-deductible expenses and other permanent tax differences, the foreign exchange impact on various assets, as well as changes in earnings allocation between different tax jurisdictions. Increases in the provision for income taxes is primarily driven by increases in net income. Provision for income taxes for the current quarter was $3.8 million compared with $2.2 million last year and $2.9 million last quarter. Provision for income taxes for the nine months ended July 31, 2026, was $10.9 million compared with $8.3 million for the same period a year ago.
| VersaBank – Q3 2026 MD&A | 21 |
Financial Review – Balance Sheet
|
(thousands of Canadian dollars) |
||||||||||||||||||||
|
July 31 |
April 30 |
July 31 |
||||||||||||||||||
|
2026 |
2026 |
Change |
2025 |
Change |
||||||||||||||||
|
Total assets |
$ | 6,875,238 | $ | 6,440,700 | 7 | % | $ | 5,477,489 | 26 | % | ||||||||||
|
Cash and securities |
624,227 | 674,438 | (7 | %) | 620,448 | 1 | % | |||||||||||||
|
Credit assets, net of allowance for credit losses |
6,161,542 | 5,675,879 | 9 | % | 4,778,316 | 29 | % | |||||||||||||
|
Deposits |
5,909,865 | 5,520,909 | 7 | % | 4,627,410 | 28 | % | |||||||||||||
Total Assets
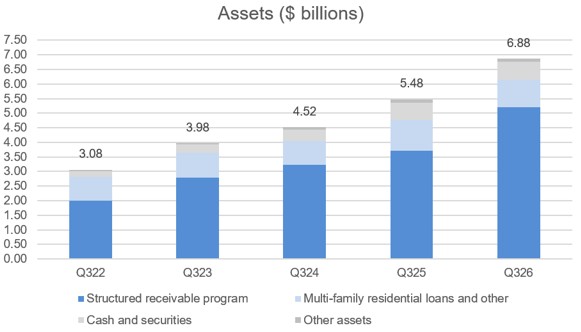
Total assets as at July 31, 2026, were $6.88 billion compared with $5.48 billion a year ago and $6.44 billion last quarter. The year-over-year and sequential increases were primarily due to SRP portfolio growth in the US and Canada.
Cash and securities
Cash and securities, which are held primarily for liquidity purposes, at July 31, 2026, were $624.2 million, or 9% of total assets, compared with $620.4 million, or 11% of total assets a year ago, and $674.4 million, or 10% of total assets last quarter. The decrease in liquidity asset balances reflects the impact of the Bank funding the transaction with Stearns Bank National Association to divest of certain lending assets and deposits held at the Bank’s only branch located in Holdingford, Minnesota, on May 1, 2026, as well as deployment of funds to support lending asset growth.
| VersaBank – Q3 2026 MD&A | 22 |
As at July 31, 2026, the Bank held securities totaling $134.2 million (October 31, 2025 - $80.9 million), including accrued interest, comprised of US Treasury Bills with a carrying value of $122.5 million, Government of Canada Treasury Bills with a carrying value of $3.2 million and other securities with a carrying value of $8.5 million.
In the quarter ended July 31, 2026, the Bank’s US operations had available for pledge its asset-backed securities to the Federal Reserve Discount Window to serve as contingent liquidity. These pledged balances reduce reliance on cash and highly liquid security balances required to meet the Bank’s liquidity requirements. No borrowings were outstanding against these securities as at July 31, 2026. Accordingly, no securities were encumbered.
Credit assets
|
(thousands of Canadian dollars) |
||||||||||||||||||||
|
July 31 |
April 30 |
July 31 |
||||||||||||||||||
|
2026 |
2026 |
Change |
2025 |
Change |
||||||||||||||||
|
Structured receivable program |
$ | 5,207,241 | $ | 4,679,121 | 11 | % | $ | 3,720,442 | 40 | % | ||||||||||
|
Multi-family residential loans and other |
934,191 | 979,093 | (5 | %) | 1,041,076 | (10 | %) | |||||||||||||
| 6,141,432 | 5,658,214 | 9 | % | 4,761,518 | 29 | % | ||||||||||||||
|
Allowance for credit losses |
(8,114 | ) | (8,342 | ) | (6,037 | ) | ||||||||||||||
|
Accrued interest |
28,224 | 26,007 | 22,835 | |||||||||||||||||
|
Total credit assets, net of allowance for credit losses |
$ | 6,161,542 | $ | 5,675,879 | 9 | % | $ | 4,778,316 | 29 | % | ||||||||||
VersaBank organizes its Credit Asset portfolios into the following two broad asset categories: Structured Receivable Program (previously referred to as “Receivable Purchase Program”) and Multi-Family Residential Loans and Other. These categories have been established in VersaBank’s proprietary, internally developed asset management system and have been designed to catalogue individual lending assets as a function primarily of their key risk drivers, the nature of the underlying collateral, and the applicable market segment.
The Structured Receivable Program (“SRP”) category is composed of investments in the expected cash flow streams derived primarily from consumer and small business loans and leases that are originated by VersaBank’s SRP partners, as well as asset-backed securities that have similar underlying assets as the SRP portfolio.
| VersaBank – Q3 2026 MD&A | 23 |
The Multi-Family Residential Loans and Other (“MROL”) category is composed of two major sub-segments: Multi-Family Residential Loans, which consists of CMHC-insured (zero-risk weighted for regulatory capital purposes) loans and uninsured loans to real estate developers to finance the construction phase of development of multi-family, student residence, condominium and retirement home properties, as well as term and bridge loans to real estate developers secured by completed aforementioned properties and units. It also includes public sector and infrastructure loans and leases. The majority of these loans are business-to-business loans with the underlying credit risk exposure being primarily residential in nature, given that the vast majority of the loans are related to properties that are designated primarily for residential use. The portfolio benefits from diversity in its underlying security in the form of a broad range of such collateral properties.
Credit assets increased 29% year-over-year and 9% sequentially to $6.16 billion primarily due to:
|
|
Higher SRP portfolio balances, which increased 40% year-over-year and 11% sequentially, primarily due to new partners and increased business with existing partners in the US and Canada, respectively. |
Residential Mortgage Exposures
In accordance with the OSFI Guideline B-20 – Residential Mortgage Underwriting Practices and Procedures, additional information is provided regarding the Bank’s residential mortgage exposure. For the purposes of the Guideline, a residential mortgage is defined as a loan to an individual that is secured by residential property (one-to-four-unit dwellings) and includes home equity lines of credit (“HELOCs”). This differs from the classification of residential mortgages used by the Bank which also includes multi-family residential mortgages.
Under OSFI’s definition, the Bank’s net exposure after credit risk mitigation to residential mortgages at July 31, 2026, was $5.6 million compared with $4.5 million a year ago and $5.6 million last quarter. The Bank does not currently offer residential mortgages to the public. The Bank did not have any HELOCs outstanding at July 31, 2026, last quarter or a year ago.
Credit Quality and Allowance for Credit Losses
VersaBank’s policy is to closely monitor its credit asset portfolio, the portfolio’s underlying borrowers, as well as its origination partners to help ensure that management maintains effective visibility on credit trends that could provide an early warning indication of the emergence of any elevated risk in VersaBank’s credit asset portfolios.
Allowance for Credit Losses
The Bank maintains an allowance for expected credit losses (or ECL allowance) that is adequate, in management’s opinion, to absorb all credit-related losses in the Bank’s credit assets and treasury portfolios. Under IFRS 9 the Bank’s allowance for expected credit losses is estimated using the expected credit loss methodology and is comprised of expected credit losses recognized on both performing credit assets, and non-performing, or impaired credit assets, even if no actual loss event has occurred.
| VersaBank – Q3 2026 MD&A | 24 |
|
(thousands of Canadian dollars) |
||||||||||||||||||||
|
July 31 |
April 30 |
July 31 |
||||||||||||||||||
|
2026 |
2026 |
Change |
2025 |
Change |
||||||||||||||||
|
ECL allowance by lending asset: |
||||||||||||||||||||
|
Structured receivable program |
$ | 6,681 | $ | 6,699 | 0 | % | $ | 3,981 | 68 | % | ||||||||||
|
Multi-family residential loans and other |
1,433 | 1,643 | (13 | %) | 2,056 | (30 | %) | |||||||||||||
|
Total ECL allowance |
$ | 8,114 | $ | 8,342 | (3 | %) | $ | 6,037 | 34 | % | ||||||||||
|
(thousands of Canadian dollars) |
||||||||||||||||||||
|
July 31 |
April 30 |
July 31 |
||||||||||||||||||
|
2026 |
2026 |
Change |
2025 |
Change |
||||||||||||||||
|
ECL allowance by stage: |
||||||||||||||||||||
|
ECL allowance stage 1 |
$ | 4,011 | $ | 4,604 | (13 | %) | $ | 4,434 | (10 | %) | ||||||||||
|
ECL allowance stage 2 |
304 | 345 | (12 | %) | 399 | (24 | %) | |||||||||||||
|
ECL allowance stage 3 |
3,799 | 3,393 | 12 | % | 1,204 | |||||||||||||||
|
Total ECL allowance |
$ | 8,114 | $ | 8,342 | (3 | %) | $ | 6,037 | 34 | % | ||||||||||
VersaBank’s ECL allowance as at July 31, 2026, was $8.11 million, or 0.13% of total credit assets, compared with $6.04 million a year ago (0.13% of total credit assets) and $8.34 million last quarter (or 0.15% of total credit assets). The trend from prior year was primarily due to the updates in the forward-looking information used by the Bank in its credit risk models, and the trend from the sequential quarter was primarily due to the sale of branch assets.
Forward-looking information
The Bank incorporates the impact of future economic conditions, or more specifically forward-looking information, into the estimation of expected credit losses at the credit risk parameter level. This is accomplished via the credit risk parameter models and proxy datasets that the Bank utilizes to develop probability of default (“PD”) and loss-given default (“LGD”) term structure forecasts for its credit assets. The Bank has sourced credit risk modeling systems and forecast macroeconomic scenario data from Moody’s Analytics, a third-party service provider for the purpose of computing forward-looking credit risk parameters under multiple macroeconomic scenarios that consider both market-wide and idiosyncratic factors and influences. These systems are used in conjunction with the Bank’s internally developed ECL models. Given that the Bank has experienced very limited historical losses and, therefore, does not have available statistically significant loss data inventory for use in developing internal, forward-looking expected credit loss trends, the use of unbiased, third-party forward-looking credit risk parameter modeling systems is particularly important for the Bank in the context of the estimation of expected credit losses.
The Bank utilizes macroeconomic indicator data derived from multiple macroeconomic scenarios in order to mitigate volatility in the estimation of expected credit losses, as well as to satisfy the IFRS 9 requirement that future economic conditions are to be based on an unbiased, probability-weighted assessment of possible future outcomes. More specifically, the macroeconomic indicators set out in the macroeconomic scenarios are used as inputs for the credit risk parameter models utilized by the Bank to sensitize the individual PD and LGD term structure forecasts to the respective macroeconomic trajectory set out in each of the scenarios (see Expected Credit Loss Sensitivity below). Currently the Bank utilizes upside, downside and baseline forecast macroeconomic scenarios and assigns discrete weights to each for use in the estimation of its reported ECL. The Bank has also applied expert credit judgement, where appropriate, to reflect, amongst other items, uncertainty in the US and Canadian macroeconomic environments.
| VersaBank – Q3 2026 MD&A | 25 |
The macroeconomic indicator data sourced from Moody’s Analytics and utilized by the Bank for the purpose of sensitizing probability of default and loss given default term structure data to forward economic conditions include, but are not limited to: real GDP, the national unemployment rate, long term interest rates, the consumer price index, the S&P/TSX Index and the price of oil. These specific macroeconomic indicators were selected in an attempt to ensure that the spectrum of fundamental macroeconomic influences on the key drivers of the credit risk profile of the Bank’s assets, including: corporate, consumer and real estate market dynamics; corporate, consumer and SME borrower performance; geography; as well as collateral value volatility, are appropriately captured and incorporated into the Bank’s forward macroeconomic sensitivity analysis.
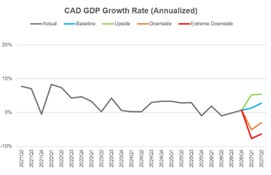
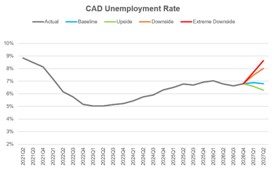
The key assumptions driving the quarterly outlook: Canada’s economy is expected to improve through the second half of fiscal 2026. Recent data suggest that the economy is beginning to recover from a weak start to the year, with modest improvement expected as temporary factors unwind. However, trade uncertainty, tariff-sensitive sectors, soft business investment, and slower population growth continue to restrain momentum. The outlook remains modest for the balance of 2026, with gradual improvement expected as businesses adapt and uncertainty around the Canada-United States-Mexico Agreement review eases. Inflation is expected to remain elevated in the near term before easing gradually. Headline inflation continues to reflect higher energy prices and gasoline-related pressures, while inflation excluding gasoline and core measures remain more contained. The Bank of Canada is expected to maintain a cautious policy stance through the balance of 2026, with persistent inflation risks limiting the scope for rate cuts. The housing market is expected to remain a drag through fiscal 2026. Housing activity has been weaker than expected, with slower population growth, affordability pressures, uncertainty, and still-elevated borrowing costs limiting demand. Prices are expected to face continued downward pressure in 2026 before stabilizing gradually, while housing starts are expected to slow as developers contend with high costs, weaker demand, and elevated inventories. Mortgage resets and rising credit stress continue to pressure some households, keeping activity subdued into 2027.
Management developed ECL estimates using credit risk parameter term structure forecasts sensitized to individual baseline, upside and downside forecast macroeconomic scenarios, each weighted at 100%, and subsequently computed the variance of each to the Bank’s reported ECL as at July 31, 2026 in order to assess the alignment of the Bank’s reported ECL with the Bank’s credit risk profile, and further, to assess the scope, depth and ultimate effectiveness of the credit risk mitigation strategies that the Bank has applied to its lending portfolios.
| VersaBank – Q3 2026 MD&A | 26 |
A summary of the key forecast macroeconomic indicator data trends utilized by VersaBank for the purpose of sensitizing lending asset credit risk parameter term structure forecasts to forward looking information, which in turn are used in the estimation of VersaBank’s reported ECL, as well as in the assessment of same are presented in the charts below (see Expected Credit Loss Sensitivity below).
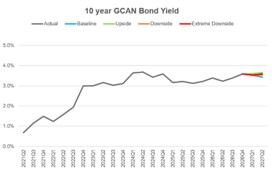
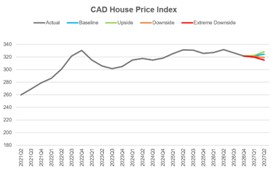
Expected Credit Loss Sensitivity:
The following table presents the sensitivity of the Bank’s estimated ECL to a range of individual forecast macroeconomic scenarios, that in isolation may not reflect the Bank’s actual expected ECL exposure, as well as the variance of each to the Bank’s reported ECL as at July 31, 2026:
|
(thousands of Canadian dollars) |
||||||||||||||||
|
Reported |
100% |
100% |
100% |
|||||||||||||
|
ECL |
Upside |
Baseline |
Downside |
|||||||||||||
|
Allowance for expected credit losses |
$ | 8,114 | $ | 7,553 | $ | 8,019 | $ | 8,875 | ||||||||
|
Provision (recovery) from reported ECL |
(561 | ) | (95 | ) | 761 | |||||||||||
|
Variance from reported ECL (%) |
(7 | %) | (1 | %) | 9 | % | ||||||||||
The uncertainty associated with interest rates, inflation and unemployment trends given the expectation of an economic slowdown in both Canada and the US, as well as elevated geopolitical risk, may result in VersaBank’s estimated ECL amounts exhibiting some future volatility, which in turn may result in the Bank recognizing higher provisions for credit losses in the future.
Considering the analysis set out above and based on management’s review of the credit asset and credit data comprising VersaBank’s lending portfolio, combined with management’s interpretation of the available forecast macroeconomic and industry data, management is of the view that its reported ECL allowance represents a reasonable proxy for potential future credit losses.
| VersaBank – Q3 2026 MD&A | 27 |
Deposits
VersaBank has established three core low-cost deposit funding channels: Deposit brokers in Canada and the US, Licensed Insolvency Trustee firms in Canada, and cash reserves retained from VersaBank’s SRP partners, which are classified as other liabilities.
|
(thousands of Canadian dollars) |
||||||||||||||||||||
|
July 31 |
April 30 |
July 31 |
||||||||||||||||||
|
2026 |
2026 |
Change |
2025 |
Change |
||||||||||||||||
|
Licensed insolvency trustee firms |
1,031,913 | $ | 935,323 | 10 | % | $ | 822,650 | 25 | % | |||||||||||
|
Deposit brokers |
4,877,952 | 4,585,586 | 6 | % | 3,804,760 | 28 | % | |||||||||||||
|
Total deposits |
$ | 5,909,865 | $ | 5,520,909 | 7 | % | $ | 4,627,410 | 28 | % | ||||||||||
The majority of VersaBank’s US and Canadian deposits are sourced through deposit brokers, specifically investment dealers, wealth management firms and financial advisory firms that distribute the Bank’s term deposit products to their respective end clients.
In Canada, the Bank also sources deposits through Licensed Insolvency Trustee firms that value the ability to use proprietary technology developed by VersaBank to seamlessly and efficiently interface with their administrative software, which results in a lower cost of funds to the Bank compared to conventional deposits.
The Bank's primary deposit products are eligible for insurance, by CDIC and FDIC, up to their respective limits.
Q3 2026 vs Q3 2025
Deposits increased 28% to $5.9 billion primarily due to:
|
Higher deposits from brokers attributable to VersaBank increasing activity in its broker market network to fund balance sheet growth; and, |
|
Higher deposits from Licensed Insolvency Trustee firms attributable to an increase in the volume of Canadian consumer and commercial bankruptcy and proposal restructuring proceedings year-over-year. |
Q3 2026 vs Q2 2026
Deposits increased 7% primarily due to:
|
Higher deposits from brokers attributable to VersaBank increasing activity in its broker market network to fund balance sheet growth; and, |
| VersaBank – Q3 2026 MD&A | 28 |
|
Higher deposits from Licensed Insolvency Trustee firms attributable to an increase in the volume of Canadian consumer and commercial bankruptcy and proposal restructuring proceedings quarter-over-quarter. |
Subordinated Notes Payable
|
(thousands of Canadian dollars) |
||||||||||||
|
July 31 |
April 30 |
July 31 |
||||||||||
|
2026 |
2026 |
2025 |
||||||||||
|
Issued April 2021, unsecured, non-viability contingent capital compliant, subordinated notes payable, principal amount of US $75.0 million, maturing May 2031. The notes bore interest at a fixed contractual rate of 5.00% until April 30, 2026, after which the coupon rate reset to 5.92%, based on a CORRA-derived reference rate plus 3.61%, payable quarterly in arrears. The effective interest rate was 5.38% during the fixed-rate period and 6.31% during the three-month floating-rate period ending July 31, 2026.
|
$ | 103,793 | $ | 100,688 | $ | 102,148 | ||||||
| $ | 103,793 | $ | 100,688 | $ | 102,148 | |||||||
Subordinated notes payable, net of issue costs, were $103.8 million as at July 31, 2026, compared with $102.1 million a year ago and $100.7 million last quarter. The year-over-year and quarter-over-quarter variances were a function primarily attributable to the change in the USD/CAD foreign exchange spot rate related to the US $75.0 million subordinated note.
Shareholders’ Equity
Shareholders’ equity was $565.6 million as at July 31 2026, compared with $528.1 million a year ago and $552.2 million last quarter.
On December 18, 2024, the Bank completed a treasury offering of 5,660,378 common shares at a price of USD $13.25 per share, at the time the equivalent of CAD $18.95 per share, for gross proceeds of USD $75.0 million. On December 24, 2024, the underwriters of the aforementioned offering exercised their full over-allotment option to purchase an additional 849,056 common shares (15% of the 5,660,378 common shares issued via the base offering referenced above) at a price of USD $13.25 per share, or at the time the equivalent of CAD $19.07 per share, for gross proceeds of USD $11.2 million. Total net cash proceeds from the common share offering was CAD $116.0 million. However, the Bank’s share capital increased by CAD $116.3 million corresponding to the common share offering and tax effected issue costs in the amount of CAD $6.2 million.
At July 31, 2026, there were 32,419,079 common shares outstanding compared with 32,167,644 common shares outstanding a year ago and 32,195,697 common shares outstanding last quarter.
| VersaBank – Q3 2026 MD&A | 29 |
The Bank issued 223,382 Common Shares in connection with the exercise of stock options during the current quarter for proceeds of $3.6 million. In the same period a year ago, no common shares were issued in connection with the exercise of stock options. In the sequential quarter, the Bank issued 126,250 Common Shares in connection with the exercise of stock options during the sequential quarter for proceeds of $2.0 million. For the nine months ended July 31, 2026, the Bank issues 473,544 Common Shares in connection with the exercise of stock options during this period for proceeds of $7.5 million, compared to 6,775 Common Shares issued over the same period a year ago in connection with the exercise of stock options during this period for proceeds of $110,000.
On April 28, 2026, the Bank received approval from the TSX to renew its Normal Course Issuer Bid ("NCIB") for its common shares. Pursuant to the NCIB, VersaBank may purchase for cancellation up to 2,000,000 of its common shares, representing approximately 9.14% of its public float. As of April 16, 2026, the public float comprised 21,876,251 common shares and there were 32,167,347 issued and outstanding common shares in total. The average daily trading volume ("ADTV") of VersaBank's common shares on the TSX for the six months of October 1, 2025 – March 31, 2026 (the "Preceding Six-Month Period") was 26,510 common shares. Daily purchases under the NCIB will be limited to 25% of the ADTV, which is 6,627 common shares, other than block purchase exceptions. During the Preceding Six-Month Period, 11,929,689 VersaBank common shares were traded on all exchanges. Of that total, 3,313,798 common shares were traded on the TSX, and the remaining 8,615,891 common shares were traded on other exchanges including the Nasdaq.
The ability to make purchases commenced on April 30, 2026, and will terminate on April 29, 2027, or such earlier date as VersaBank may complete its purchases pursuant to the NCIB. The purchases will be made by VersaBank through the facilities of the TSX and the Nasdaq and in accordance with the rules of the TSX or the Nasdaq, as applicable, and the prices that VersaBank will pay for any common shares will be the market price of such shares at the time of acquisition. VersaBank will make no purchases of common shares other than open market purchases. All common shares purchased under the NCIB will be cancelled.
For the quarter ended July 31, 2026, no shares were purchased and cancelled by the Bank. In the same period a year ago, the Bank purchased and cancelled 351,142 common shares for $5.4 million, reducing the Bank’s common share capital value by $3.8 million and retained earnings by $1.7 million. In the sequential quarter, no shares were purchased and cancelled.
For the nine-month period ended July 31, 2026, no shares were purchased and cancelled by the Bank. In the same period a year ago, the Bank purchased and cancelled 351,142 common shares for $5.4 million, reducing the Bank’s common share capital value by $3.8 million and retained earnings by $1.7 million.
Q3 2026 vs Q3 2025 vs Q2 2026
Shareholders’ equity increased 7% compared with a year ago and 2% compared with last quarter. The year-over-year and sequential increases were primarily due to higher retained earnings attributable to net income earned over the current quarter and common shares issued on stock options exercised, offset partially by payment of common share dividends in the current quarter.
VersaBank’s book value per common share as at July 31, 2026, was $17.45 compared with $16.42 a year ago and $17.15 last quarter. The year-over-year and sequential increases were primarily due to higher retained earnings attributable to net income earned in the current quarter, offset partially by common shares issued on stock options exercised and the payment of dividends over the same period.
| VersaBank – Q3 2026 MD&A | 30 |
See note 9 to the unaudited interim consolidated financial statements for additional information relating to share capital.
Stock-Based Compensation
Stock options are accounted for using the fair value method which recognizes the fair value of the stock option over the applicable vesting period as an increase in salaries and benefits expense with the same amount being recorded in contributed surplus. VersaBank recognized compensation expense for the current quarter totaling $5,000 compared with $nil for the same period a year ago and $7,000 last quarter, relating to the estimated fair value of stock options granted. The recognized compensation expense for the nine-month period ended July 31, 2026, totaled $11,000 compared with $75,000 for the same period a year ago. See note 9 to the unaudited interim consolidated financial statements for additional information relating to stock options.
Updated Share Information
As at September 1, 2026, there were no changes since July 31, 2026, in the number of common shares and common share options outstanding.
Off-Balance Sheet Arrangements
As at July 31, 2026, VersaBank did not have any significant off-balance sheet arrangements other than an interest rate swap contract, a foreign exchange forward contract, loan commitments and letters of credit attributable to normal course business activities. See notes 12 and 13 to the unaudited interim consolidated financial statements for more information.
Related Party Transactions
VersaBank’s related parties include members of the Board of Directors and Senior Executive Officers represented as key management personnel and significant minority shareholders. See note 14 to the unaudited interim consolidated financial statements for additional information on related party transactions and balances.
| VersaBank – Q3 2026 MD&A | 31 |
Capital Management and Capital Resources
The table below presents VersaBank’s regulatory capital position, regulatory risk-weighted assets and regulatory capital and leverage ratios for the current and comparative periods.
|
(thousands of Canadian dollars) |
||||||||||||||||||||
|
July 31 |
April 30 |
July 31 |
||||||||||||||||||
|
2026 |
2026 |
Change |
2025 |
Change |
||||||||||||||||
|
Common Equity Tier 1 capital |
$ | 540,934 | $ | 527,758 | 2 | % | $ | 507,212 | 7 | % | ||||||||||
|
Total Tier 1 capital |
$ | 540,934 | $ | 527,758 | 2 | % | $ | 507,212 | 7 | % | ||||||||||
|
Total Tier 2 capital |
$ | 87,349 | $ | 103,865 | (16 | %) | $ | 109,867 | (20 | %) | ||||||||||
|
Total regulatory capital |
$ | 628,283 | $ | 631,623 | (1 | %) | $ | 617,079 | 2 | % | ||||||||||
|
Total risk-weighted assets |
$ | 4,717,516 | $ | 4,285,370 | 10 | % | $ | 3,740,088 | 26 | % | ||||||||||
|
Capital ratios |
||||||||||||||||||||
|
CET1 capital ratio |
11.47 | % | 12.32 | % | (7 | %) | 13.56 | % | (15 | %) | ||||||||||
|
Tier 1 capital ratio |
11.47 | % | 12.32 | % | (7 | %) | 13.56 | % | (15 | %) | ||||||||||
|
Total capital ratio |
13.32 | % | 14.74 | % | (10 | %) | 16.50 | % | (19 | %) | ||||||||||
|
Leverage ratio |
7.64 | % | 7.94 | % | (4 | %) | 8.90 | % | (14 | %) | ||||||||||
VersaBank reports its regulatory capital ratios using the Standardized approach for calculating risk-weighted assets, as defined under Basel III, which may require VersaBank to carry more capital for certain credit exposures compared with requirements under the Advanced Internal Ratings Based (“AIRB”) methodology. As a result, regulatory capital ratios of banks that utilize the Standardized approach are not directly comparable with the large Canadian banks that employ the AIRB methodology.
OSFI requires that all Canadian banks must comply with the Basel III standards on an “all-in” basis for purposes of determining their risk-based capital ratios. Required minimum regulatory capital ratios are a 7.0% Common Equity Tier 1 (“CET1”) capital ratio, an 8.5% Tier 1 capital ratio and a 10.5% total capital ratio, all of which include a 2.5% capital conservation buffer.
The year-over-year and sequential changes exhibited by VersaBank’s reported regulatory capital levels, regulatory capital ratios and leverage ratio were a function primarily of retained earnings growth and changes to VersaBank’s risk-weighted asset balances and composition. The year-over-year and quarter-over-quarter variance also reflects the treasury offering of common shares on December 18, 2024 and the issuance of common shares from stock options exercised, and the purchase and cancellation of common shares under the NCIB.
For more information regarding capital management, please see note 15 to VersaBank’s July 31, 2026, unaudited interim Consolidated Financial Statements as well as the Capital Management and Capital Resources section of VersaBank’s MD&A for the year ended October 31, 2025.
| VersaBank – Q3 2026 MD&A | 32 |
Liquidity
The unaudited Consolidated Statement of Cash Flows for the nine months ended July 31, 2026, shows cash used in operations in the amount of $33.4 million compared with cash used in operations in the amount of $4.9 million for the same period last year. The current period reflects the outflows to fund credit assets, cash for operations and net cash outflow from deposits maturing exceeding deposits raised. The comparative period reflects outflows to fund credit assets as well as a net cash outflow from deposits maturing exceeding deposits raised and cash from operations. Based on factors such as liquidity requirements and opportunities for investment in credit assets and securities, VersaBank may manage the amount of deposits it raises and credit assets it funds in ways that result in the balances of these items giving rise to either negative or positive cash flow from operations. VersaBank will continue to fund its operations and meet contractual obligations as they become due using cash on hand and by closely managing its flow of deposit raising activities.
Interest Rate Sensitivity
The table below presents the duration difference between VersaBank’s assets and liabilities and the potential after-tax impact of a 100-basis point shift in interest rates on VersaBank’s earnings during a 12-month period if no remedial actions are taken. As at July 31, 2026, the duration difference between assets and liabilities was (2.3) months compared with (0.9) months as at October 31, 2025. As at July 31, 2026, VersaBank’s assets would reprice faster than its liabilities in the event of a future change in interest rates.
|
(thousands of Canadian dollars) |
||||||||||||||||
|
July 31, 2026 |
October 31, 2025 |
|||||||||||||||
|
Increase |
Decrease 100 bps |
Increase |
Decrease 100 bps |
|||||||||||||
|
Increase (decrease): |
||||||||||||||||
|
Impact on projected net interest |
||||||||||||||||
|
income during a 12 month period |
$ | 5,059 | $ | (5,076 | ) | $ | 2,582 | $ | (2,824 | ) | ||||||
|
Duration difference between assets and liabilities (months) |
(2.3 | ) | (0.9 | ) | ||||||||||||
Contractual Obligations
As at July 31, 2026, the Bank held a number of designated hedging instruments to manage interest rate and foreign exchange exposures. The Bank had an outstanding interest rate swap with a notional amount of $18.8 million, entered into for asset liability management purposes and qualifying for hedge accounting, which swaps between fixed and floating interest rates.
In addition, the Bank has designated foreign exchange forward contracts as net investment hedges in respect of its US operations: a USD $138.6 million forward to hedge the net investment in VersaBank USA and a USD $14.0 million forward, entered during 2025, to hedge the net investment in VersaFinance US Corp; both instruments are intended to reduce exposure to fluctuations between the Bank’s functional currency (CAD) and the US dollar. The Bank also entered into a USD $12.1 million foreign exchange forward to mitigate foreign exchange risk on an intercompany loan denominated in USD arising from an intercompany transfer of assets. These hedging arrangements are intended to minimize the Bank’s exposure to movements in interest rates and in the CAD/USD exchange rate.
There have been no other significant changes in contractual obligations as disclosed in VersaBank’s MD&A and Audited Consolidated Financial Statements for the year ended October 31, 2025.
| VersaBank – Q3 2026 MD&A | 33 |
Results of Operating Segments
|
(thousands of Canadian dollars) |
||||||||||||||||||||||||
|
for the three months ended |
July 31, 2026 |
|||||||||||||||||||||||
|
Digital Banking Canada |
Digital Banking |
Digital Meteor |
DRTC |
Eliminations/ |
Consolidated |
|||||||||||||||||||
|
Net interest income |
$ | 27,472 | $ | 9,301 | $ | - | $ | - | $ | - | $ | 36,773 | ||||||||||||
|
Non-interest income |
93 | 2 | 413 | 1,875 | (347 | ) | 2,036 | |||||||||||||||||
|
Total revenue |
27,565 | 9,303 | 413 | 1,875 | (347 | ) | 38,809 | |||||||||||||||||
|
Provision for (recovery of) credit losses |
5 | (234 | ) | - | - | - | (229 | ) | ||||||||||||||||
| 27,560 | 9,537 | 413 | 1,875 | (347 | ) | 39,038 | ||||||||||||||||||
|
Non-interest expenses: |
||||||||||||||||||||||||
|
Salaries and benefits |
8,527 | 1,743 | 192 | 1,626 | - | 12,088 | ||||||||||||||||||
|
General and administrative |
9,288 | 1,249 | 28 | 483 | (347 | ) | 10,701 | |||||||||||||||||
|
Premises and equipment |
875 | 1,009 | 31 | 458 | - | 2,373 | ||||||||||||||||||
| 18,690 | 4,001 | 251 | 2,567 | (347 | ) | 25,162 | ||||||||||||||||||
|
Income (loss) before income taxes |
8,870 | 5,536 | 162 | (692 | ) | - | 13,876 | |||||||||||||||||
|
Income tax provision |
2,291 | 1,591 | 48 | (114 | ) | - | 3,816 | |||||||||||||||||
|
Net income (loss) |
$ | 6,579 | $ | 3,945 | $ | 114 | $ | (578 | ) | $ | - | $ | 10,060 | |||||||||||
|
Total assets |
$ | 5,513,067 | $ | 1,355,667 | $ | 11,095 | $ | 15,999 | $ | (20,590 | ) | $ | 6,875,238 | |||||||||||
|
Total liabilities |
$ | 5,223,535 | $ | 1,084,336 | $ | 321 | $ | 29,407 | $ | (27,926 | ) | $ | 6,309,673 | |||||||||||
|
for the three months ended |
April 30, 2026 |
|||||||||||||||||||||||
|
Digital Banking |
Digital Banking |
Digital Meteor |
DRTC |
Eliminations/ |
Consolidated |
|||||||||||||||||||
|
Canada |
USA |
Adjustments |
||||||||||||||||||||||
|
Net interest income |
$ | 27,768 | $ | 7,911 | $ | - | $ | - | $ | - | $ | 35,679 | ||||||||||||
|
Non-interest income |
373 | (15 | ) | 749 | 1,850 | (343 | ) | 2,614 | ||||||||||||||||
|
Total revenue |
28,141 | 7,896 | 749 | 1,850 | (343 | ) | 38,293 | |||||||||||||||||
|
Provision for (recovery of) credit losses |
495 | (67 | ) | - | - | - | 428 | |||||||||||||||||
| 27,646 | 7,963 | 749 | 1,850 | (343 | ) | 37,865 | ||||||||||||||||||
|
Non-interest expenses: |
||||||||||||||||||||||||
|
Salaries and benefits |
7,343 | 2,070 | 172 | 1,617 | - | 11,202 | ||||||||||||||||||
|
General and administrative |
13,824 | 515 | 42 | 362 | (343 | ) | 14,400 | |||||||||||||||||
|
Premises and equipment |
947 | 353 | 54 | 530 | - | 1,884 | ||||||||||||||||||
| 22,114 | 2,938 | 268 | 2,509 | (343 | ) | 27,486 | ||||||||||||||||||
|
Income (loss) before income taxes |
5,532 | 5,025 | 481 | (659 | ) | - | 10,379 | |||||||||||||||||
|
Income tax provision |
1,438 | 1,437 | 130 | (151 | ) | - | 2,854 | |||||||||||||||||
|
Net income (loss) |
$ | 4,094 | $ | 3,588 | $ | 351 | $ | (508 | ) | $ | - | $ | 7,525 | |||||||||||
|
Total assets |
$ | 5,213,682 | $ | 1,221,182 | $ | 10,688 | $ | 15,773 | $ | (20,625 | ) | $ | 6,440,700 | |||||||||||
|
Total liabilities |
$ | 4,926,001 | $ | 961,343 | $ | 370 | $ | 28,344 | $ | (27,596 | ) | $ | 5,888,462 | |||||||||||
|
for the three months ended |
July 31, 2025 |
|||||||||||||||||||||||
|
Digital Banking |
Digital Banking |
Digital Meteor |
DRTC |
Eliminations/ |
Consolidated |
|||||||||||||||||||
|
Net interest income |
$ | 26,656 | $ | 3,123 | $ | - | $ | - | $ | - | $ | 29,779 | ||||||||||||
|
Non-interest income |
(37 | ) | (7 | ) | 622 | 1,569 | (343 | ) | 1,804 | |||||||||||||||
|
Total revenue |
26,619 | 3,116 | 622 | 1,569 | (343 | ) | 31,583 | |||||||||||||||||
|
Provision for (recovery of) credit losses |
1,201 | (20 | ) | - | - | - | 1,181 | |||||||||||||||||
| 25,418 | 3,136 | 622 | 1,569 | (343 | ) | 30,402 | ||||||||||||||||||
|
Non-interest expenses: |
||||||||||||||||||||||||
|
Salaries and benefits |
7,214 | 1,174 | 214 | 1,497 | - | 10,099 | ||||||||||||||||||
|
General and administrative |
8,636 | 1,163 | 47 | 214 | (343 | ) | 9,717 | |||||||||||||||||
|
Premises and equipment |
898 | 186 | 373 | 376 | - | 1,833 | ||||||||||||||||||
| 16,748 | 2,523 | 634 | 2,087 | (343 | ) | 21,649 | ||||||||||||||||||
|
Income (loss) before income taxes |
8,670 | 613 | (12 | ) | (518 | ) | - | 8,753 | ||||||||||||||||
|
Income tax provision |
2,150 | 176 | (35 | ) | (120 | ) | - | 2,171 | ||||||||||||||||
|
Net income (loss) |
$ | 6,520 | $ | 437 | $ | 23 | $ | (398 | ) | $ | - | $ | 6,582 | |||||||||||
|
Total assets |
$ | 5,124,771 | $ | 348,389 | $ | 11,543 | $ | 25,015 | $ | (32,229 | ) | $ | 5,477,489 | |||||||||||
|
Total liabilities |
$ | 4,790,738 | $ | 155,228 | $ | 9,491 | $ | 19,410 | $ | (25,520 | ) | $ | 4,949,347 | |||||||||||
| VersaBank – Q3 2026 MD&A | 34 |
|
(thousands of Canadian dollars) |
||||||||||||||||||||||||
|
for the nine months ended |
July 31, 2026 |
|||||||||||||||||||||||
|
Digital Banking Canada |
Digital Banking |
Digital Meteor |
DRTC |
Eliminations/ |
Consolidated |
|||||||||||||||||||
|
Net interest income |
$ | 82,347 | $ | 23,986 | $ | - | $ | - | $ | - | $ | 106,333 | ||||||||||||
|
Non-interest income |
942 | (13 | ) | 1,690 | 5,700 | (1,036 | ) | 7,283 | ||||||||||||||||
|
Total revenue |
83,289 | 23,973 | 1,690 | 5,700 | (1,036 | ) | 113,616 | |||||||||||||||||
|
Provision for (recovery of) credit losses |
1,181 | (282 | ) | - | - | - | 899 | |||||||||||||||||
| 82,108 | 24,255 | 1,690 | 5,700 | (1,036 | ) | 112,717 | ||||||||||||||||||
|
Non-interest expenses: |
||||||||||||||||||||||||
|
Salaries and benefits |
22,533 | 5,546 | 570 | 5,024 | - | 33,673 | ||||||||||||||||||
|
General and administrative |
30,490 | 2,563 | 100 | 1,351 | (1,036 | ) | 33,468 | |||||||||||||||||
|
Premises and equipment |
2,747 | 1,637 | 133 | 1,536 | - | 6,053 | ||||||||||||||||||
| 55,770 | 9,746 | 803 | 7,911 | (1,036 | ) | 73,194 | ||||||||||||||||||
|
Income (loss) before income taxes |
26,338 | 14,509 | 887 | (2,211 | ) | - | 39,523 | |||||||||||||||||
|
Income tax provision |
6,951 | 4,170 | 242 | (494 | ) | - | 10,869 | |||||||||||||||||
|
Net income (loss) |
$ | 19,387 | $ | 10,339 | $ | 645 | $ | (1,717 | ) | $ | - | $ | 28,654 | |||||||||||
|
Total assets |
$ | 5,513,067 | $ | 1,355,667 | $ | 11,095 | $ | 15,999 | $ | (20,590 | ) | $ | 6,875,238 | |||||||||||
|
Total liabilities |
$ | 5,223,535 | $ | 1,084,336 | $ | 321 | $ | 29,407 | $ | (27,926 | ) | $ | 6,309,673 | |||||||||||
|
for the nine months ended |
July 31, 2025 |
|||||||||||||||||||||||
|
Digital Banking |
Digital Banking |
Digital Meteor |
DRTC |
Eliminations/ |
Consolidated |
|||||||||||||||||||
|
Net interest income |
$ | 75,866 | $ | 7,669 | $ | - | $ | - | $ | - | $ | 83,535 | ||||||||||||
|
Non-interest income |
210 | (24 | ) | 1,533 | 5,347 | (1,052 | ) | 6,014 | ||||||||||||||||
|
Total revenue |
76,076 | 7,645 | 1,533 | 5,347 | (1,052 | ) | 89,549 | |||||||||||||||||
|
Provision for (recovery of) credit losses |
3,188 | (94 | ) | - | - | - | 3,094 | |||||||||||||||||
| 72,888 | 7,739 | 1,533 | 5,347 | (1,052 | ) | 86,455 | ||||||||||||||||||
|
Non-interest expenses: |
||||||||||||||||||||||||
|
Salaries and benefits |
18,339 | 3,802 | 684 | 5,043 | - | 27,868 | ||||||||||||||||||
|
General and administrative |
18,619 | 2,560 | 434 | 1,365 | (1,052 | ) | 21,926 | |||||||||||||||||
|
Premises and equipment |
2,748 | 399 | 544 | 1,379 | - | 5,070 | ||||||||||||||||||
| 39,706 | 6,761 | 1,662 | 7,787 | (1,052 | ) | 54,864 | ||||||||||||||||||
|
Income (loss) before income taxes |
33,182 | 978 | (129 | ) | (2,440 | ) | - | 31,591 | ||||||||||||||||
|
Income tax provision |
8,698 | 305 | (33 | ) | (633 | ) | - | 8,337 | ||||||||||||||||
|
Net income (loss) |
$ | 24,484 | $ | 673 | $ | (96 | ) | $ | (1,807 | ) | $ | - | $ | 23,254 | ||||||||||
|
Total assets |
$ | 5,124,771 | $ | 348,389 | $ | 11,543 | $ | 25,015 | $ | (32,229 | ) | $ | 5,477,489 | |||||||||||
|
Total liabilities |
$ | 4,790,738 | $ | 155,228 | $ | 9,491 | $ | 19,410 | $ | (25,520 | ) | $ | 4,949,347 | |||||||||||
| VersaBank – Q3 2026 MD&A | 35 |
Digital Banking Canada
Note: The financial results for Digital Banking Canada contain certain non-interest expenses that include general corporate administrative costs.
Q3 2026 vs Q3 2025
Net income increased $59,000, or 1%, to $6.6 million primarily due to higher net interest income and lower PCL, offset partially by a $2.5 million charge comprised of project costs associated with the Reorganization, and higher general corporate administrative costs.
Q3 2026 vs Q2 2026
Net income increased $2.5 million, or 61%, primarily due to higher net interest income, a lower PCL and lower project costs associated with the Reorganization, and the prior quarter reflecting the impact of an intangible asset write down resulting from the sale of the Bank’s sole physical branch.
Q3 YTD 2026 vs Q3 YTD 2025
Net income decreased $5.1 million, or 21%, primarily due to non-core expenses composed of project costs associated with the Reorganization, the intangible asset write-down resulting from the sale of the Bank’s sole physical branch, and higher general non-interest expenses, offset partially by higher net interest income and a lower PCL.
Digital Banking USA
Q3 2026 vs Q3 2025
Net income increased $3.5 million to $3.9 million primarily due to higher net interest income, a recovery of provision for credit loss from the sale of branch assets; offset partially by higher non-interest expenses, reflecting the onboarding of staff and related operating expenses to support the expansion of VersaBank USA’s SRP portfolio as well as a $600,000 write-off of capitalized software associated with the disposal of the Bank’s sole physical branch.
Q3 2026 vs Q2 2026
Net income increased $357,000 primarily due to higher net interest income and a recovery of credit loss provisions from the sale of the branch assets, offset partially by higher non-interest expenses and a $600,000 write off of capitalized software associated with the disposal of the Bank’s sole physical branch.
Q3 YTD 2026 vs Q3 YTD 2025
Net income increased $9.7 million to $10.3 million primarily due to higher net interest income and a higher recovery on provision for credit loss from the sale of the branch assets, offset partially by higher non-interest expenses reflecting the onboarding of staff and related operating expense to support the expansion of VersaBank USA, as well as a $600,000 write-off of capitalized software associated with the disposal of the Bank’s sole physical branch.
| VersaBank – Q3 2026 MD&A | 36 |
DRTC (Cybersecurity Services)
Q3 2026 vs Q3 2025
DRTC’s net loss was $578,000 compared to a net loss of $398,000 last year. The increased loss was primarily due to higher non-interest expense, offset partially by higher revenues from an increase in new cybersecurity offerings.
Q3 2026 vs Q2 2026
DRTC’s net loss was $578,000, largely unchanged from last quarter, which reflect a net loss of $508,000.
Q3 YTD 2026 vs Q3 YTD 2025
DRTC’s net loss was $1.7 million compared to a net loss of $1.8 million last year. The decrease was primarily due to higher revenue driven by higher client engagements in the current period.
Strategic Divestiture of DRTC
In furtherance of the Bank’s strategic initiatives and in consideration of current US regulatory requirements, management has expressed its intention to cease or divest of certain activities, including the cybersecurity assets within DRTC, a subsidiary operating within the cybersecurity and financial technology industry, and the Digital Boundary Group Entities, subsidiaries of DRTC operating within the penetration testing industry. The Bank has initiated a process to identify and evaluate alternatives with the objective to maximize the value derived from the divestiture for shareholders.
As of July 31, 2026, the Digital Boundary Group Entities and certain assets in DRTC have not been classified as “held for sale” under IFRS 5 –Non‑current Assets Held for Sale and Discontinued Operations, as certain required criteria have not yet been fully satisfied. While management has not begun actively marketing the Digital Boundary Group Entities and certain assets of DRTC for sale, these subsidiaries and assets are also not yet available for immediate sale in their present condition and continue to be integral to the Bank’s ongoing operations. Management will continue to monitor and evaluate the status of the planned divestiture, including the progress of the active sales program. The subsidiaries will be reclassified as “held for sale” and presented in accordance with IFRS 5 once all conditions for such classification are met.
Certain members of management hold convertible preferred shares in DRTC. In accordance with DRTC’s by‑laws, these shares will automatically convert into an aggregate 28% common share ownership stake in DRTC upon the occurrence of a change‑of‑control event.
| VersaBank – Q3 2026 MD&A | 37 |
Digital Meteor Inc.
Q3 2026 vs Q3 2025
Digital Meteor Inc. net income was $114,000 compared to net income of $23,000 last year. The trend in earnings was primarily due to lower non-interest expenses, offset partially by lower revenue due to lower client engagements in the current period.
Q3 2026 vs Q2 2026
Digital Meteor Inc. net income was $114,000 compared to a net income of $351,000 last quarter. The trend in earnings was primarily due to lower revenue due to lower client engagements in the current quarter.
Q3 YTD 2026 vs Q3 YTD 2025
Digital Meteor Inc. net income was $645,000 compared to a net loss of $96,000 last year. The trend in earnings was primarily due to higher revenue driven by higher client engagements in the current period and lower operating expenses.
Summary of Quarterly Results
|
(thousands of Canadian dollars, except per share amounts) |
2026 |
2025 |
2024 | |||||||||||||||||||||||||||||
|
Q3 |
Q2 |
Q1 |
Q4 |
Q3 |
Q2 |
Q1 |
Q4 |
|||||||||||||||||||||||||
|
Results of operations: |
||||||||||||||||||||||||||||||||
|
Interest income |
$ | 89,737 | $ | 83,060 | $ | 81,216 | $ | 77,471 | $ | 73,987 | $ | 70,976 | $ | 73,246 | $ | 73,238 | ||||||||||||||||
|
Yield on assets (%) |
5.35 | % | 5.42 | % | 5.39 | % | 5.45 | % | 5.58 | % | 5.81 | % | 5.92 | % | 6.23 | % | ||||||||||||||||
|
Interest expense |
52,964 | 47,381 | 47,335 | 44,838 | 44,208 | 42,944 | 47,522 | 48,337 | ||||||||||||||||||||||||
|
Cost of funds (%) |
3.16 | % | 3.09 | % | 3.14 | % | 3.15 | % | 3.33 | % | 3.52 | % | 3.84 | % | 4.11 | % | ||||||||||||||||
|
Net interest income |
36,773 | 35,679 | 33,881 | 32,633 | 29,779 | 28,032 | 25,724 | 24,901 | ||||||||||||||||||||||||
|
Net interest margin (%) |
2.19 | % | 2.33 | % | 2.25 | % | 2.29 | % | 2.25 | % | 2.29 | % | 2.08 | % | 2.12 | % | ||||||||||||||||
|
Net interest margin on credit assets (%) |
2.44 | % | 2.71 | % | 2.64 | % | 2.65 | % | 2.55 | % | 2.59 | % | 2.36 | % | 2.34 | % | ||||||||||||||||
|
Non-interest income |
2,036 | 2,614 | 2,633 | 2,459 | 1,804 | 2,107 | 2,103 | 2,384 | ||||||||||||||||||||||||
|
Total revenue |
38,809 | 38,293 | 36,514 | 35,092 | 31,583 | 30,139 | 27,827 | 27,285 | ||||||||||||||||||||||||
|
Provision for (recovery of) credit losses |
(229 | ) | 428 | 700 | 1,319 | 1,181 | 889 | 1,024 | (156 | ) | ||||||||||||||||||||||
|
Non-interest expenses |
25,162 | 27,486 | 20,546 | 23,871 | 21,649 | 17,516 | 15,699 | 19,365 | ||||||||||||||||||||||||
|
Efficiency ratio |
65 | % | 72 | % | 56 | % | 68 | % | 69 | % | 58 | % | 56 | % | 71 | % | ||||||||||||||||
|
Adjusted (Core) efficiency ratio |
57 | % | 54 | % | 52 | % | 52 | % | 55 | % | 58 | % | 56 | % | 71 | % | ||||||||||||||||
|
Tax provision |
3,816 | 2,854 | 4,199 | 4,698 | 2,171 | 3,205 | 2,961 | 2,560 | ||||||||||||||||||||||||
|
Net income |
$ | 10,060 | $ | 7,525 | $ | 11,069 | $ | 5,204 | $ | 6,582 | $ | 8,529 | $ | 8,143 | $ | 5,516 | ||||||||||||||||
|
Adjusted (Core) net income |
$ | 12,303 | $ | 12,378 | $ | 12,162 | $ | 10,549 | $ | 9,670 | $ | 8,529 | $ | 8,143 | $ | 5,516 | ||||||||||||||||
|
Income per share |
||||||||||||||||||||||||||||||||
|
Basic |
$ | 0.31 | $ | 0.23 | $ | 0.35 | $ | 0.16 | $ | 0.20 | $ | 0.26 | $ | 0.28 | $ | 0.20 | ||||||||||||||||
|
Diluted |
$ | 0.31 | $ | 0.23 | $ | 0.35 | $ | 0.16 | $ | 0.20 | $ | 0.26 | $ | 0.28 | $ | 0.20 | ||||||||||||||||
|
Adjusted (Core) income per common share basic and diluted |
$ | 0.38 | $ | 0.39 | $ | 0.38 | $ | 0.33 | $ | 0.30 | $ | 0.26 | $ | 0.28 | $ | 0.20 | ||||||||||||||||
|
Return on average common equity |
7.14 | % | 5.64 | % | 8.16 | % | 3.89 | % | 4.94 | % | 6.67 | % | 7.02 | % | 5.28 | % | ||||||||||||||||
|
Adjusted (Core) return on average common equity |
8.72 | % | 9.23 | % | 8.95 | % | 7.81 | % | 7.24 | % | 6.67 | % | 7.02 | % | 5.28 | % | ||||||||||||||||
|
Return on average total assets |
0.60 | % | 0.49 | % | 0.73 | % | 0.37 | % | 0.50 | % | 0.70 | % | 0.66 | % | 0.45 | % | ||||||||||||||||
The financial results for each of the last eight quarters are summarized above. Key drivers of VersaBank’s sequential performance changes for the current reporting period were:
|
Credit asset growth attributable to continued growth in the SRP portfolio; |
|
Lower NIM attributable primarily to lower yields earned on the Bank’s credit assets and higher cost of funds; |
|
Lower PCL attributable primarily to the sale of branch assets and updates in the forward-looking information used by the Bank in its credit risk models; and, |
|
Lower non-interest expense attributable primarily to lower project costs associated with the Reorganization and the prior quarter reflecting the intangible asset write down resulting from the sale of the Bank’s sole physical branch, offset partially by higher general operating costs in the quarter and the write off of capitalized software related to the sale of the Bank’s sole physical branch. |
| VersaBank – Q3 2026 MD&A | 38 |
Non-GAAP and Other Financial Measures
Non-GAAP and other financial measures are not standardized financial measures under the financial reporting framework used to prepare the financial statements of the Bank to which these measures relate. These measures may not be comparable to similar financial measures disclosed by other issuers. The Bank uses these financial measures to assess its performance and as such believes these financial measures are useful in providing readers with a better understanding of how management assesses the Bank’s performance.
Non-GAAP Measures
Return on Average Common Equity is defined as annualized net income less amounts relating to preferred share dividends, divided by average common shareholders’ equity, which is average shareholders’ equity less amounts relating to preferred shares recorded in equity.
|
for the three months ended |
for the nine months ended |
|||||||||||||||
|
July 31 |
July 31 |
July 31 |
July 31 |
|||||||||||||
|
(thousands of Canadian dollars) |
2026 |
2025 |
2026 |
2025 |
||||||||||||
|
Return on average common equity |
||||||||||||||||
|
Net income |
$ | 10,060 | $ | 6,582 | $ | 28,654 | $ | 23,254 | ||||||||
|
Annualized net income |
39,912 | 26,113 | 38,310 | 31,091 | ||||||||||||
|
Average common equity |
$ | 558,902 | $ | 528,224 | $ | 549,119 | $ | 463,673 | ||||||||
|
Return on average common equity |
7.14 | % | 4.94 | % | 6.98 | % | 6.71 | % | ||||||||
Adjusted (Core) Return on Average Common Equity is defined as annualized net income less amounts relating to the Reorganization and other non-core items and related tax effect and amounts relating to preferred share dividends, divided by adjusted average common shareholders’ equity, which is average shareholders’ equity less amounts relating to the Reorganization and other non-core items and related tax effect and amounts relating to preferred shares recorded in equity.
| for the three months ended | for the nine months ended | |||||||||||||||
|
(thousands of Canadian dollars) |
2026 |
2025 |
2026 |
2025 |
||||||||||||
|
Adjusted (Core) return on average common equity |
||||||||||||||||
|
Net income |
$ | 10,060 | $ | 6,582 | $ | 28,654 | $ | 23,254 | ||||||||
|
Adjustment to non-interest expenses |
3,094 | 4,230 | 11,334 | 4,230 | ||||||||||||
|
Adjustment to income tax provision |
(851 | ) | (1,142 | ) | (3,145 | ) | (1,142 | ) | ||||||||
|
Adjusted (Core) net income |
12,303 | 9,670 | 36,843 | 26,342 | ||||||||||||
|
Annualized Adjusted (Core) net income |
48,811 | 38,365 | 49,259 | 35,219 | ||||||||||||
|
Adjusted (Core) average common equity |
$ | 560,023 | $ | 529,768 | $ | 553,214 | $ | 465,217 | ||||||||
|
Adjusted (Core) return on average common equity |
8.72 | % | 7.24 | % | 8.90 | % | 7.57 | % | ||||||||
Book Value per Common Share is defined as Shareholders’ Equity less amounts relating to preferred shares recorded in equity, divided by the number of common shares outstanding.
| as at | ||||||||
|
July 31 |
July 31 |
|||||||
|
(thousands of Canadian dollars, except shares outstanding and per share amounts) |
2026 |
2025 |
||||||
|
Book value per common share |
||||||||
|
Common equity |
$ | 565,565 | $ | 528,142 | ||||
|
Shares outstanding |
32,419,079 | 32,167,644 | ||||||
|
Book value per common share |
$ | 17.45 | $ | 16.42 | ||||
| VersaBank – Q3 2026 MD&A | 39 |
Return on Average Total Assets is defined as annualized net income less amounts relating to preferred share dividends, divided by average total assets.
|
for the three months ended |
for the nine months ended |
|||||||||||||||
|
July 31 |
July 31 |
July 31 |
July 31 |
|||||||||||||
|
(thousands of Canadian dollars) |
2026 |
2025 |
2026 |
2025 |
||||||||||||
|
Return on average total assets |
||||||||||||||||
| Net income | $ | 10,060 | $ | 6,582 | $ | 28,654 | $ | 23,254 | ||||||||
| Annualized net income | 39,912 | 26,113 | 38,310 | 31,091 | ||||||||||||
| Average Assets | $ | 6,657,969 | $ | 5,262,311 | $ | 6,341,857 | $ | 5,157,987 | ||||||||
|
Return on average total assets |
0.60 | % | 0.50 | % | 0.60 | % | 0.60 | % | ||||||||
Adjusted (Core) Net Income is defined as net income less amounts relating primarily to the Reorganization and other non-core items and related tax effect. This metric does not have a standardized meaning prescribed by IFRS and, therefore, may not be comparable to similar measures presented by other financial institutions.
|
for the three months ended |
for the nine months ended |
|||||||||||||||
|
July 31 |
July 31 |
July 31 |
July 31 |
|||||||||||||
|
(thousands of Canadian dollars) |
2026 |
2025 |
2026 |
2025 |
||||||||||||
|
Adjusted (Core) net income |
||||||||||||||||
| Net income | $ | 10,060 | $ | 6,582 | $ | 28,654 | $ | 23,254 | ||||||||
| Adjustment to non-interest expenses | 3,094 | 4,230 | 11,334 | 4,230 | ||||||||||||
| Adjustment to income tax provision | (851 | ) | (1,142 | ) | (3,145 | ) | (1,142 | ) | ||||||||
|
Adjusted (Core) net income |
$ | 12,303 | $ | 9,670 | $ | 36,843 | $ | 26,342 | ||||||||
Adjusted (Core) EPS is defined as annualized net income less amounts relating primarily to the Reorganization and other non-core items and related tax effect and amounts relating to preferred share dividends, divided by weighted average numbers of common shares. This metric does not have a standardized meaning prescribed by IFRS and, therefore, may not be comparable to similar measures presented by other financial institutions.
|
for the three months ended |
for the nine months ended |
|||||||||||||||
|
July 31 |
July 31 |
July 31 |
July 31 |
|||||||||||||
|
(thousands of Canadian dollars, except shares outstanding and per share amounts) |
2026 |
2025 |
2026 |
2025 |
||||||||||||
|
Adjusted (Core) income per common share |
||||||||||||||||
| Net income | $ | 10,060 | $ | 6,582 | $ | 28,654 | $ | 23,254 | ||||||||
| Adjustment to non-interest expenses | 3,094 | 4,230 | 11,334 | 4,230 | ||||||||||||
| Adjustment to income tax provision | (851 | ) | (1,142 | ) | (3,145 | ) | (1,142 | ) | ||||||||
| Adjusted (Core) net income | 12,303 | 9,670 | 36,843 | 26,342 | ||||||||||||
| Weighted average number of common shares outstanding | 32,275,242 | 32,368,728 | 32,112,165 | 31,302,938 | ||||||||||||
|
Adjusted (Core) income per common share |
$ | 0.38 | $ | 0.30 | $ | 1.15 | $ | 0.84 | ||||||||
Other Financial Measures
Yield is calculated as interest income (as presented in the Consolidated Statements of Comprehensive Income) divided by average total assets. Yield does not have a standardized meaning prescribed by IFRS and, therefore, may not be comparable to similar measures presented by other financial institutions.
Cost of Funds is calculated as interest expense (as presented in the Consolidated Statements of Comprehensive Income) divided by average total assets. Cost of funds does not have a standardized meaning prescribed by IFRS and, therefore, may not be comparable to similar measures presented by other financial institutions.
| VersaBank – Q3 2026 MD&A | 40 |
Net Interest Margin or Spread are calculated as net interest income divided by average total assets. Net interest margin or spread does not have a standardized meaning prescribed by IFRS and, therefore, may not be comparable to similar measures presented by other financial institutions.
Net Interest Margin on Credit Assets is calculated as net interest income adjusted for the impact of cash, securities and other assets, divided by average gross credit assets. This metric does not have a standardized meaning prescribed by IFRS and, therefore, may not be comparable to similar measures presented by other financial institutions.
Efficiency Ratio is calculated as non-interest expenses from consolidated operations as a percentage of total revenue (as presented in the interim Consolidated Statements of Comprehensive Income). This ratio does not have a standardized meaning prescribed by IFRS and, therefore, may not be comparable to similar measures presented by other financial institutions.
Adjusted (Core) Efficiency Ratio is calculated as non-interest expenses from consolidated operations income less amounts relating primarily to project costs associated with the Reorganization and other non-core items, as a percentage of total revenue (as presented in the interim Consolidated Statements of Comprehensive Income). This ratio does not have a standardized meaning prescribed by IFRS and, therefore, may not be comparable to similar measures presented by other financial institutions.
|
for the three months ended |
for the nine months ended |
|||||||||||||||
|
July 31 |
July 31 |
July 31 |
July 31 |
|||||||||||||
|
(thousands of Canadian dollars) |
2026 |
2025 |
2026 |
2025 |
||||||||||||
|
Adjusted (Core) efficiency ratio |
||||||||||||||||
| Non-interest expenses | $ | 25,162 | $ | 21,649 | $ | 73,194 | $ | 54,864 | ||||||||
| Adjustment to non-interest expenses | (3,094 | ) | (4,230 | ) | (11,334 | ) | (4,230 | ) | ||||||||
| Adjusted non-interest expenses | 22,068 | 17,419 | 61,860 | 50,634 | ||||||||||||
| Total revenue | 38,809 | 31,583 | 113,616 | 89,549 | ||||||||||||
|
Adjusted (Core) efficiency ratio |
57 | % | 55 | % | 54 | % | 57 | % | ||||||||
Provision for (Recovery of) Credit Losses as a Percentage of Average Total Credit Assets captures the provision for (recovery of) credit losses (as presented in the interim Consolidated Statements of Comprehensive Income) as a percentage of VersaBank’s average credit assets, net of allowance for credit losses. This percentage does not have a standardized meaning prescribed by IFRS and, therefore, may not be comparable to similar measures presented by other financial institutions.
Basel III Common Equity Tier 1, Tier 1, Total Capital Adequacy and Leverage Ratios are determined in accordance with guidelines issued by the Office of the Superintendent of Financial Institutions (Canada) (OSFI).
Material Accounting Policies and Use of Estimates and Judgements
Material accounting policies and use of estimates and judgements are detailed in note 2 and note 3 of VersaBank’s 2025 Audited Consolidated Financial Statements. There have been no material changes in accounting policies since October 31, 2025.
| VersaBank – Q3 2026 MD&A | 41 |
Controls and Procedures
During the quarter ended July 31, 2026, there were no changes in VersaBank’s internal controls over financial reporting, that have materially affected or are reasonably likely to materially affect VersaBank’s internal controls over financial reporting.
Additional Information
Additional information regarding VersaBank, including its Annual Information Form for the year ended October 31, 2025, is available on SEDAR+ at www.sedarplus.ca and EDGAR at www.sec.gov/edgar, as well as on VersaBank’s website at www.versabank.com.
| VersaBank – Q3 2026 MD&A | 42 |