Shareholder Report
|
6 Months Ended |
|
Jun. 30, 2026
USD ($)
Holding
|
|---|
| Shareholder Report [Line Items] |
|
| Document Type |
N-CSRS
|
| Amendment Flag |
false
|
| Registrant Name |
X-Square Balanced Fund, LLC
|
| Entity Central Index Key |
0001763143
|
| Entity Investment Company Type |
N-1A
|
| Document Period End Date |
Jun. 30, 2026
|
| C000210871 |
|
| Shareholder Report [Line Items] |
|
| Fund Name |
X-SQUARE BALANCED FUND
|
| Class Name |
Class A
|
| Trading Symbol |
SQBFX
|
| Annual or Semi-Annual Statement [Text Block] |
This semi-annual shareholder report contains important information about X- Square Balanced Fund - A for the period of January 1, 2026 to June 30, 2026.
|
| Shareholder Report Annual or Semi-Annual |
semi-annual shareholder report
|
| Additional Information [Text Block] |
You can find additional information about the Fund at https://xsquarecapital.com/. You can also request this information by contacting us at 1-787-282-1621.
|
| Additional Information Phone Number |
1-787-282-1621
|
| Additional Information Website |
<span style="box-sizing: border-box; color: rgb(35, 31, 32); display: inline; flex-wrap: nowrap; font-size: 12px; font-weight: 700; grid-area: auto; line-height: 14.4px; margin: 0px; overflow: visible; text-align: left; text-align-last: auto; white-space-collapse: preserve-breaks;">https://xsquarecapital.com/</span>
|
| Expenses [Text Block] |
What were the Fund's cost for the last six months? (based on a hypothetical $10,000 investment) Table SummaryClass Name | Cost of a $10,000 Investment | Cost Paid as a Percentage of a $10,000 Investment |
|---|
X- Square Balanced Fund - A | $92 | 1.76% |
|---|
|
| Expenses Paid, Amount |
$ 92
|
| Expense Ratio, Percent |
1.76%
|
| Factors Affecting Performance [Text Block] |
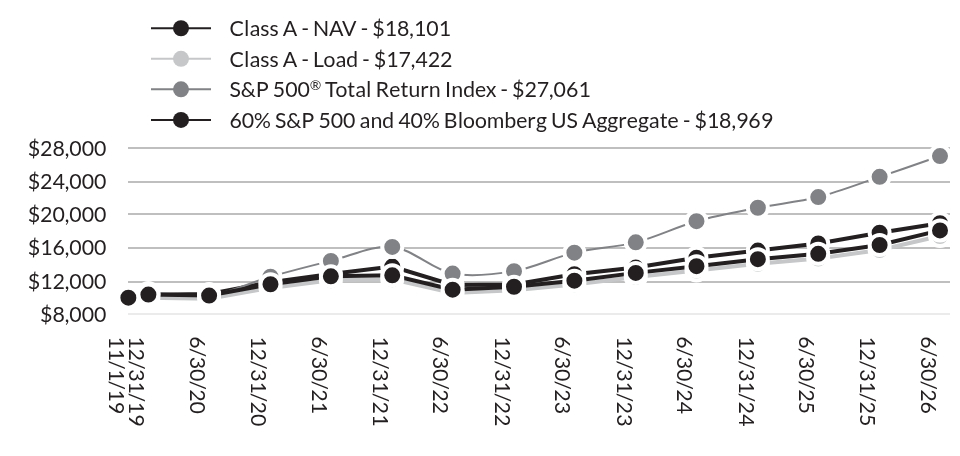
How did the Fund perform during the period? The X-Square Balanced Fund (the “Fund”) registered net gains of 10.74% during the first half of 2026, outperforming the 60/40 benchmark portfolio (S&P 500 Index with the Bloomberg US Aggregate Bond Index), which gained 6.37% over the same period. U.S. markets remained resilient despite periods of volatility driven by geopolitical developments, higher oil prices, and continued uncertainty surrounding the economic outlook. Monetary policy remained stable, with the Federal Reserve neither tightening nor easing as it continued to assess inflation, employment, and growth conditions. Although higher energy prices added inflationary pressure, longer-term inflation expectations remained relatively well anchored, helping support financial conditions.At the same time, accelerating artificial intelligence-related capital expenditures provided a significant tailwind to the U.S. economy, supporting investment across data centers, semiconductors, power infrastructure, and related technologies. Looking ahead, elevated valuations continue to emphasize earnings delivery, disciplined capital allocation, diversification, and attractive risk-adjusted returns for shareholders. |
| Line Graph [Table Text Block] |
Table Summary | Class A - NAV | Class A - Load | S&P 500® Total Return Index | 60% S&P 500 and 40% Bloomberg US Aggregate |
|---|
11/1/19 | $10,000 | $9,625 | $10,000 | $10,000 |
|---|
12/31/19 | $10,370 | $9,981 | $10,573 | $10,343 |
|---|
6/30/20 | $10,250 | $9,865 | $10,247 | $10,445 |
|---|
12/31/20 | $11,610 | $11,174 | $12,518 | $11,866 |
|---|
6/30/21 | $12,570 | $12,098 | $14,427 | $12,849 |
|---|
12/31/21 | $12,691 | $12,215 | $16,111 | $13,748 |
|---|
6/30/22 | $10,960 | $10,549 | $12,896 | $11,533 |
|---|
12/31/22 | $11,310 | $10,886 | $13,193 | $11,578 |
|---|
6/30/23 | $12,044 | $11,592 | $15,422 | $12,829 |
|---|
12/31/23 | $12,983 | $12,496 | $16,662 | $13,623 |
|---|
6/30/24 | $13,788 | $13,270 | $19,209 | $14,808 |
|---|
12/31/24 | $14,632 | $14,082 | $20,830 | $15,673 |
|---|
6/30/25 | $15,282 | $14,708 | $22,122 | $16,529 |
|---|
12/31/25 | $16,346 | $15,733 | $24,555 | $17,820 |
|---|
6/30/26 | $18,101 | $17,422 | $27,061 | $18,969 |
|---|
|
| Average Annual Return [Table Text Block] |
AVERAGE ANNUAL TOTAL RETURNSTable Summary X-Square Balanced Fund | 1 Year | 5 Year | Since Inception |
|---|
Class A - NAV (Incep. November 1, 2019) | 18.45% | 7.57% | 9.31% |
|---|
Class A - Load | 14.01% | 6.74% | 8.69% |
|---|
S&P 500® Total Return Index | 22.32% | 13.41% | 16.11% |
|---|
60% S&P 500 and 40% Bloomberg US Aggregate | 14.76% | 8.10% | 10.09% |
|---|
|
| Performance Inception Date |
Nov. 01, 2019
|
| No Deduction of Taxes [Text Block] |
The table and graph presented above do not reflect the deduction of taxes a shareholder would pay on fund distributions or the redemption of fund shares.
|
| Holdings Count | Holding |
91
|
| Advisory Fees Paid, Amount |
$ 462,780
|
| InvestmentCompanyPortfolioTurnover |
8.00%
|
| Additional Fund Statistics [Text Block] |
- Total Net Asset$105,075,040
- # of Portfolio Holdings91
- Portfolio Turnover Rate8%
- Advisory Fees Paid$462,780
|
| Holdings [Text Block] |
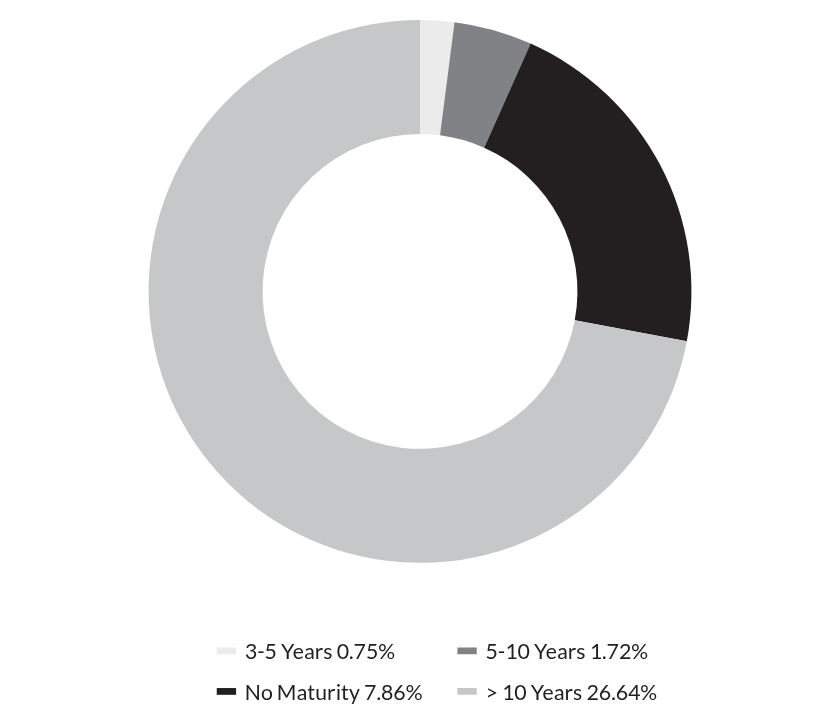
MATURITY WEIGHTINGS (as of % Net Assets)Table SummaryValue | Value |
|---|
3-5 Years | 0.75% | 5-10 Years | 1.72% | No Maturity | 7.86% | > 10 Years | 26.64% | |
| Largest Holdings [Text Block] |
TOP 10 HOLDINGS (as of % Net Assets)Table SummaryTop 10 | Top 10 |
|---|
Micron Technology, Inc. | 4.69% | United States Treasury Bill, 3.74%, 12/03/2026 | 4.59% | Advanced Micro Devices, Inc. | 3.99% | Ginnie Mae II Pool, 3.00%, 02/20/2052 | 3.96% | Ginnie Mae II Pool, 2.00%, 08/20/2051 | 3.36% | Ginnie Mae II Pool, 2.00%, 10/20/2051 | 3.30% | United States Treasury Bill, 3.56%, 07/30/2026 | 3.23% | Ginnie Mae II Pool, 2.00%, 11/20/2050 | 3.21% | Ginnie Mae II Pool, 2.00%, 11/20/2051 | 2.94% | Ginnie Mae II Pool, 2.00%, 06/20/2051 | 2.48% | |
| Material Fund Change [Text Block] |
There have been no material fund changes during the reporting period. |
| Accountant Change Disagreements [Text Block] |
Changes in and Disagreements with AccountantsThere have been no changes in or disagreements with the Fund's independent accounting firm during the reporting period. |
| C000210872 |
|
| Shareholder Report [Line Items] |
|
| Fund Name |
X-SQUARE BALANCED FUND
|
| Class Name |
Class C
|
| Trading Symbol |
SQCBX
|
| Annual or Semi-Annual Statement [Text Block] |
This semi-annual shareholder report contains important information about X- Square Balanced Fund - C for the period of January 1, 2026 to June 30, 2026.
|
| Shareholder Report Annual or Semi-Annual |
semi-annual shareholder report
|
| Additional Information [Text Block] |
You can find additional information about the Fund at https://xsquarecapital.com/. You can also request this information by contacting us at 1-787-282-1621.
|
| Additional Information Phone Number |
1-787-282-1621
|
| Additional Information Website |
<span style="box-sizing: border-box; color: rgb(35, 31, 32); display: inline; flex-wrap: nowrap; font-size: 12px; font-weight: 700; grid-area: auto; line-height: 14.4px; margin: 0px; overflow: visible; text-align: left; text-align-last: auto; white-space-collapse: preserve-breaks;">https://xsquarecapital.com/</span>
|
| Expenses [Text Block] |
What were the Fund's cost for the last six months? (based on a hypothetical $10,000 investment) Table SummaryClass Name | Cost of a $10,000 Investment | Cost Paid as a Percentage of a $10,000 Investment |
|---|
X- Square Balanced Fund - C | $131 | 2.51% |
|---|
|
| Expenses Paid, Amount |
$ 131
|
| Expense Ratio, Percent |
2.51%
|
| Factors Affecting Performance [Text Block] |
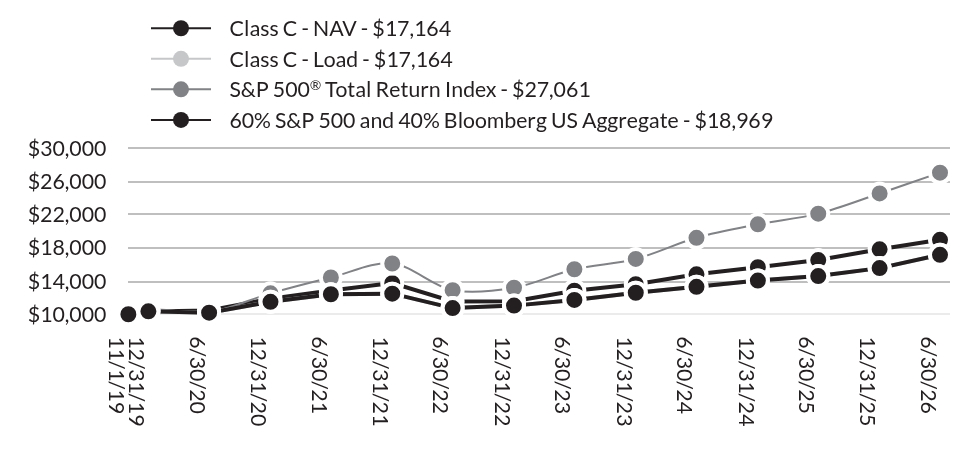
How did the Fund perform during the period? The X-Square Balanced Fund (the “Fund”) registered net gains of 10.74% during the first half of 2026, outperforming the 60/40 benchmark portfolio (S&P 500 Index with the Bloomberg US Aggregate Bond Index), which gained 6.37% over the same period. U.S. markets remained resilient despite periods of volatility driven by geopolitical developments, higher oil prices, and continued uncertainty surrounding the economic outlook. Monetary policy remained stable, with the Federal Reserve neither tightening nor easing as it continued to assess inflation, employment, and growth conditions. Although higher energy prices added inflationary pressure, longer-term inflation expectations remained relatively well anchored, helping support financial conditions.At the same time, accelerating artificial intelligence-related capital expenditures provided a significant tailwind to the U.S. economy, supporting investment across data centers, semiconductors, power infrastructure, and related technologies. Looking ahead, elevated valuations continue to emphasize earnings delivery, disciplined capital allocation, diversification, and attractive risk-adjusted returns for shareholders. |
| Line Graph [Table Text Block] |
Table Summary | Class C - NAV | Class C - Load | S&P 500® Total Return Index | 60% S&P 500 and 40% Bloomberg US Aggregate |
|---|
11/1/19 | $10,000 | $10,000 | $10,000 | $10,000 |
|---|
12/31/19 | $10,350 | $10,350 | $10,573 | $10,343 |
|---|
6/30/20 | $10,190 | $10,190 | $10,247 | $10,445 |
|---|
12/31/20 | $11,500 | $11,500 | $12,518 | $11,866 |
|---|
6/30/21 | $12,410 | $12,410 | $14,427 | $12,849 |
|---|
12/31/21 | $12,481 | $12,481 | $16,111 | $13,748 |
|---|
6/30/22 | $10,739 | $10,739 | $12,896 | $11,533 |
|---|
12/31/22 | $11,038 | $11,038 | $13,193 | $11,578 |
|---|
6/30/23 | $11,720 | $11,720 | $15,422 | $12,829 |
|---|
12/31/23 | $12,587 | $12,587 | $16,662 | $13,623 |
|---|
6/30/24 | $13,308 | $13,308 | $19,209 | $14,808 |
|---|
12/31/24 | $14,056 | $14,056 | $20,830 | $15,673 |
|---|
6/30/25 | $14,600 | $14,600 | $22,122 | $16,529 |
|---|
12/31/25 | $15,558 | $15,558 | $24,555 | $17,820 |
|---|
6/30/26 | $17,164 | $17,164 | $27,061 | $18,969 |
|---|
|
| Average Annual Return [Table Text Block] |
AVERAGE ANNUAL TOTAL RETURNSTable Summary X-Square Balanced Fund | 1 Year | 5 Year | Since Inception |
|---|
Class C - NAV (Incep. November 1, 2019) | 17.56% | 6.70% | 8.45% |
|---|
Class C - Load | 16.56% | 6.70% | 8.45% |
|---|
S&P 500® Total Return Index | 22.32% | 13.41% | 16.11% |
|---|
60% S&P 500 and 40% Bloomberg US Aggregate | 14.76% | 8.10% | 10.09% |
|---|
|
| Performance Inception Date |
Nov. 01, 2019
|
| No Deduction of Taxes [Text Block] |
The table and graph presented above do not reflect the deduction of taxes a shareholder would pay on fund distributions or the redemption of fund shares.
|
| Holdings Count | Holding |
91
|
| Advisory Fees Paid, Amount |
$ 462,780
|
| InvestmentCompanyPortfolioTurnover |
8.00%
|
| Additional Fund Statistics [Text Block] |
- Total Net Asset$105,075,040
- # of Portfolio Holdings91
- Portfolio Turnover Rate8%
- Advisory Fees Paid$462,780
|
| Holdings [Text Block] |
MATURITY WEIGHTINGS (as of % Net Assets)Table SummaryValue | Value |
|---|
3-5 Years | 0.75% | 5-10 Years | 1.72% | No Maturity | 7.86% | > 10 Years | 26.64% | |
| Largest Holdings [Text Block] |
TOP 10 HOLDINGS (as of % Net Assets)Table SummaryTop 10 | Top 10 |
|---|
Micron Technology, Inc. | 4.69% | United States Treasury Bill, 3.74%, 12/03/2026 | 4.59% | Advanced Micro Devices, Inc. | 3.99% | Ginnie Mae II Pool, 3.00%, 02/20/2052 | 3.96% | Ginnie Mae II Pool, 2.00%, 08/20/2051 | 3.36% | Ginnie Mae II Pool, 2.00%, 10/20/2051 | 3.30% | United States Treasury Bill, 3.56%, 07/30/2026 | 3.23% | Ginnie Mae II Pool, 2.00%, 11/20/2050 | 3.21% | Ginnie Mae II Pool, 2.00%, 11/20/2051 | 2.94% | Ginnie Mae II Pool, 2.00%, 06/20/2051 | 2.48% | |
| Material Fund Change [Text Block] |
There have been no material fund changes during the reporting period. |
| Accountant Change Disagreements [Text Block] |
Changes in and Disagreements with AccountantsThere have been no changes in or disagreements with the Fund's independent accounting firm during the reporting period. |
| C000210870 |
|
| Shareholder Report [Line Items] |
|
| Fund Name |
X-SQUARE BALANCED FUND
|
| Class Name |
Institutional
|
| Trading Symbol |
SQBIX
|
| Annual or Semi-Annual Statement [Text Block] |
This semi-annual shareholder report contains important information about X- Square Balanced Fund - Institutional for the period of January 1, 2026 to June 30, 2026.
|
| Shareholder Report Annual or Semi-Annual |
semi-annual shareholder report
|
| Additional Information [Text Block] |
You can find additional information about the Fund at https://xsquarecapital.com/. You can also request this information by contacting us at 1-787-282-1621.
|
| Additional Information Phone Number |
1-787-282-1621
|
| Additional Information Website |
<span style="box-sizing: border-box; color: rgb(35, 31, 32); display: inline; flex-wrap: nowrap; font-size: 12px; font-weight: 700; grid-area: auto; line-height: 14.4px; margin: 0px; overflow: visible; text-align: left; text-align-last: auto; white-space-collapse: preserve-breaks;">https://xsquarecapital.com/</span>
|
| Expenses [Text Block] |
What were the Fund's cost for the last six months? (based on a hypothetical $10,000 investment) Table SummaryClass Name | Cost of a $10,000 Investment | Cost Paid as a Percentage of a $10,000 Investment |
|---|
X- Square Balanced Fund - Institutional | $79 | 1.51% |
|---|
|
| Expenses Paid, Amount |
$ 79
|
| Expense Ratio, Percent |
1.51%
|
| Factors Affecting Performance [Text Block] |
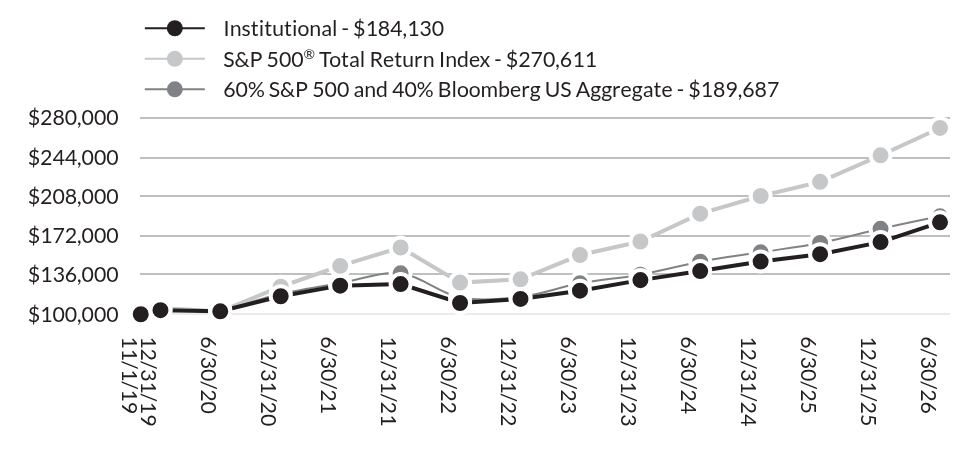
How did the Fund perform during the period? The X-Square Balanced Fund (the “Fund”) registered net gains of 10.74% during the first half of 2026, outperforming the 60/40 benchmark portfolio (S&P 500 Index with the Bloomberg US Aggregate Bond Index), which gained 6.37% over the same period. U.S. markets remained resilient despite periods of volatility driven by geopolitical developments, higher oil prices, and continued uncertainty surrounding the economic outlook. Monetary policy remained stable, with the Federal Reserve neither tightening nor easing as it continued to assess inflation, employment, and growth conditions. Although higher energy prices added inflationary pressure, longer-term inflation expectations remained relatively well anchored, helping support financial conditions.At the same time, accelerating artificial intelligence-related capital expenditures provided a significant tailwind to the U.S. economy, supporting investment across data centers, semiconductors, power infrastructure, and related technologies. Looking ahead, elevated valuations continue to emphasize earnings delivery, disciplined capital allocation, diversification, and attractive risk-adjusted returns for shareholders. |
| Line Graph [Table Text Block] |
Table Summary | Institutional | S&P 500® Total Return Index | 60% S&P 500 and 40% Bloomberg US Aggregate |
|---|
11/1/19 | $100,000 | $100,000 | $100,000 |
|---|
12/31/19 | $103,700 | $105,727 | $103,430 |
|---|
6/30/20 | $102,700 | $102,470 | $104,448 |
|---|
12/31/20 | $116,500 | $125,179 | $118,664 |
|---|
6/30/21 | $126,200 | $144,271 | $128,488 |
|---|
12/31/21 | $127,613 | $161,112 | $137,480 |
|---|
6/30/22 | $110,306 | $128,956 | $115,329 |
|---|
12/31/22 | $114,012 | $131,934 | $115,777 |
|---|
6/30/23 | $121,551 | $154,223 | $128,294 |
|---|
12/31/23 | $131,256 | $166,616 | $136,233 |
|---|
6/30/24 | $139,511 | $192,094 | $148,080 |
|---|
12/31/24 | $148,265 | $208,303 | $156,728 |
|---|
6/30/25 | $154,978 | $221,223 | $165,292 |
|---|
12/31/25 | $166,049 | $245,547 | $178,202 |
|---|
6/30/26 | $184,130 | $270,611 | $189,687 |
|---|
|
| Average Annual Return [Table Text Block] |
AVERAGE ANNUAL TOTAL RETURNSTable Summary X-Square Balanced Fund | 1 Year | 5 Year | Since Inception |
|---|
Institutional (Incep. November 1, 2019) | 18.81% | 7.85% | 9.59% |
|---|
S&P 500® Total Return Index | 22.32% | 13.41% | 16.11% |
|---|
60% S&P 500 and 40% Bloomberg US Aggregate | 14.76% | 8.10% | 10.09% |
|---|
|
| Performance Inception Date |
Nov. 01, 2019
|
| No Deduction of Taxes [Text Block] |
The table and graph presented above do not reflect the deduction of taxes a shareholder would pay on fund distributions or the redemption of fund shares.
|
| Holdings Count | Holding |
91
|
| Advisory Fees Paid, Amount |
$ 462,780
|
| InvestmentCompanyPortfolioTurnover |
8.00%
|
| Additional Fund Statistics [Text Block] |
- Total Net Asset$105,075,040
- # of Portfolio Holdings91
- Portfolio Turnover Rate8%
- Advisory Fees Paid$462,780
|
| Holdings [Text Block] |
MATURITY WEIGHTINGS (as of % Net Assets)Table SummaryValue | Value |
|---|
3-5 Years | 0.75% | 5-10 Years | 1.72% | No Maturity | 7.86% | > 10 Years | 26.64% | |
| Largest Holdings [Text Block] |
TOP 10 HOLDINGS (as of % Net Assets)Table SummaryTop 10 | Top 10 |
|---|
Micron Technology, Inc. | 4.69% | United States Treasury Bill, 3.74%, 12/03/2026 | 4.59% | Advanced Micro Devices, Inc. | 3.99% | Ginnie Mae II Pool, 3.00%, 02/20/2052 | 3.96% | Ginnie Mae II Pool, 2.00%, 08/20/2051 | 3.36% | Ginnie Mae II Pool, 2.00%, 10/20/2051 | 3.30% | United States Treasury Bill, 3.56%, 07/30/2026 | 3.23% | Ginnie Mae II Pool, 2.00%, 11/20/2050 | 3.21% | Ginnie Mae II Pool, 2.00%, 11/20/2051 | 2.94% | Ginnie Mae II Pool, 2.00%, 06/20/2051 | 2.48% | |
| Material Fund Change [Text Block] |
There have been no material fund changes during the reporting period. |
| Accountant Change Disagreements [Text Block] |
Changes in and Disagreements with AccountantsThere have been no changes in or disagreements with the Fund's independent accounting firm during the reporting period. |