
September 3, 2026 Q4 and Year-end Financial Results F’26
F’26 Q4 and Year-end Financial Results Forward-Looking Statements In this release, statements that are not reported financial results or other historic information are “forward-looking statements.” These forward-looking statements relate to, among other things, statements about the success of the acquisition, including anticipated benefits and synergies of the transaction, future opportunities for the combined company, and any other statements regarding the establishment of a new reporting segment for the IPS business, the combined company’s future operations and future financial position, anticipated economic activity, business strategies, targets, future earnings, anticipated growth, market opportunities, debt levels and cash flows, competition and other expectations and estimates for future periods including plans and objectives of management for future operations. The use of words such as “may,” “will,” “expect,” “intend,” “estimate,” “anticipate,” “believe,” “should,” “project,” “plan” or similar terminology are generally intended to identify forward-looking statements. These forward-looking statements by their nature address matters that are, to different degrees, uncertain and are subject to risks, assumptions, and other factors, some of which are beyond the Company’s control, that could cause actual results to differ materially from those expressed or implied by such forward-looking statements. For the Company, uncertainties arise from: the ability of the Company and the IPS business to retain customers and retain and hire key personnel and maintain relationships with their suppliers and customers and on their operating results and businesses generally; potential difficulties integrating the IPS business, or the costs of integrating the IPS business exceeding original estimates; failure of the Company to achieve the anticipated benefits and synergies of the transaction identified in this release on the timeline indicated or at all; the establishment of a new reporting segment for the IPS business; increased cost of materials, labor, material shortages and supply chain disruptions, including as a result of tariffs or other impacts of the global trade environment; decreased demand for the Company’s products; the Company’s ability to compete effectively or to successfully execute our strategy; the Company’s ability to develop technologically advanced products that meet customer demands; the Company’s ability to identify, integrate and grow acquired companies, and to manage contingent liabilities from divested businesses; difficulties in protecting the Company’s websites, networks, and systems against security breaches; extensive regulations by U.S. and non-U.S. governmental and self-regulatory entities; risks associated with the loss of key employees; litigation, including product liability claims; global climate change and environmental regulations; foreign currency fluctuations; our indebtedness, financial condition and fulfillment of obligations thereunder; the ability to service our indebtedness; changes in tax legislation and tax rates; potential write-offs of goodwill and other intangible assets; differing interests of voting and non-voting shareholders and changes in the regulatory and business environment around dual-class voting structures; numerous other matters of national, regional and global scale, including major public health crises and government responses thereto and those of a political, economic, business, competitive, and regulatory nature contained from time to time in the Company’s U.S. Securities and Exchange Commission filings, including, but not limited to, those factors listed in the “Risk Factors” section within Item 1A of Part I of the Company’s Form 10-K for the year ended July 31, 2026. These uncertainties may cause the Company’s actual future results to be materially different than those expressed in its forward-looking statements. The Company does not undertake to update its forward-looking statements except as required by law. 2
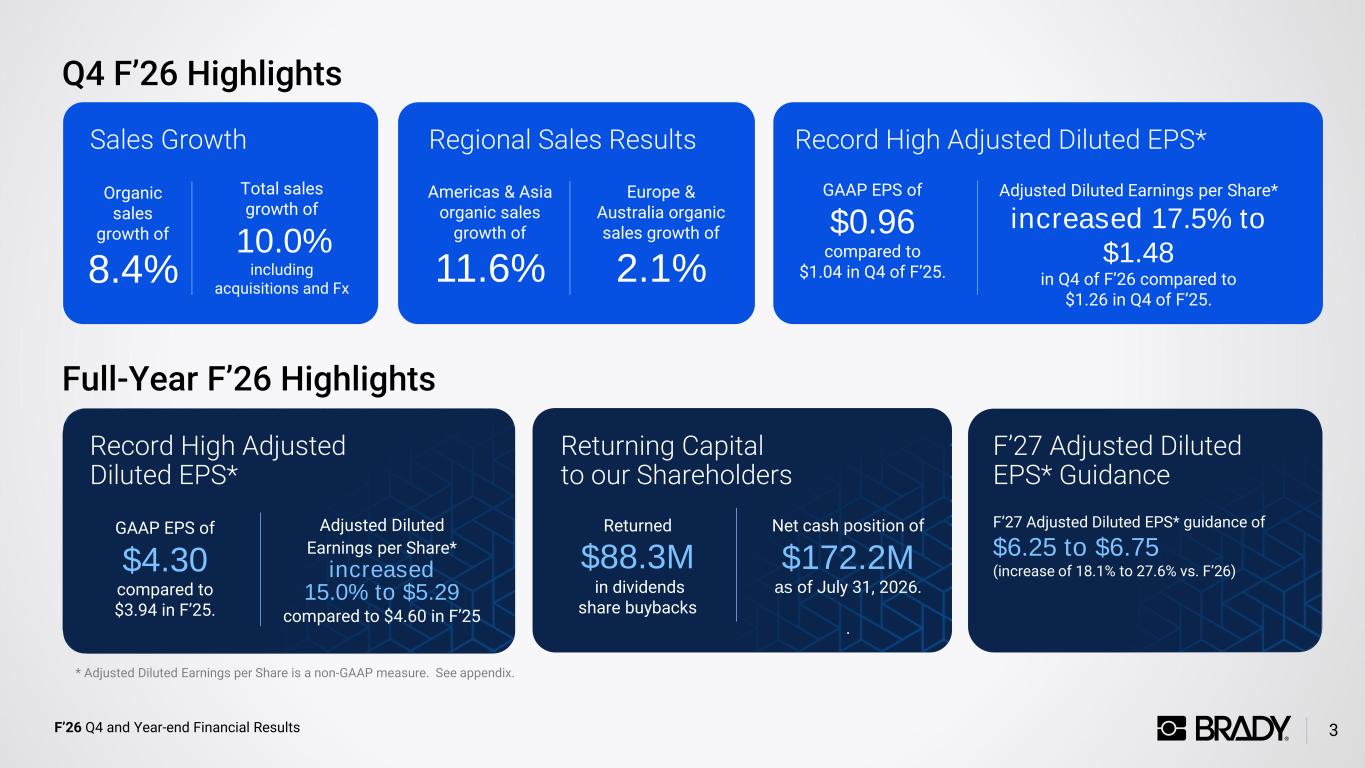
F’26 Q4 and Year-end Financial Results Q4 F’26 Highlights 3 Sales Growth Record High Adjusted Diluted EPS* Returning Capital to our Shareholders Organic sales growth of 8.4% Total sales growth of 10.0% including acquisitions and Fx GAAP EPS of $4.30 compared to $3.94 in F’25. Adjusted Diluted Earnings per Share* increased 15.0% to $5.29 compared to $4.60 in F’25 Returned $88.3M in dividends share buybacks Net cash position of $172.2M as of July 31, 2026. . Record High Adjusted Diluted EPS*Regional Sales Results Americas & Asia organic sales growth of 11.6% Europe & Australia organic sales growth of 2.1% GAAP EPS of $0.96 compared to $1.04 in Q4 of F’25. Adjusted Diluted Earnings per Share* increased 17.5% to $1.48 in Q4 of F’26 compared to $1.26 in Q4 of F’25. * Adjusted Diluted Earnings per Share is a non-GAAP measure. See appendix. F’27 Adjusted Diluted EPS* Guidance F’27 Adjusted Diluted EPS* guidance of $6.25 to $6.75 (increase of 18.1% to 27.6% vs. F’26) Full-Year F’26 Highlights
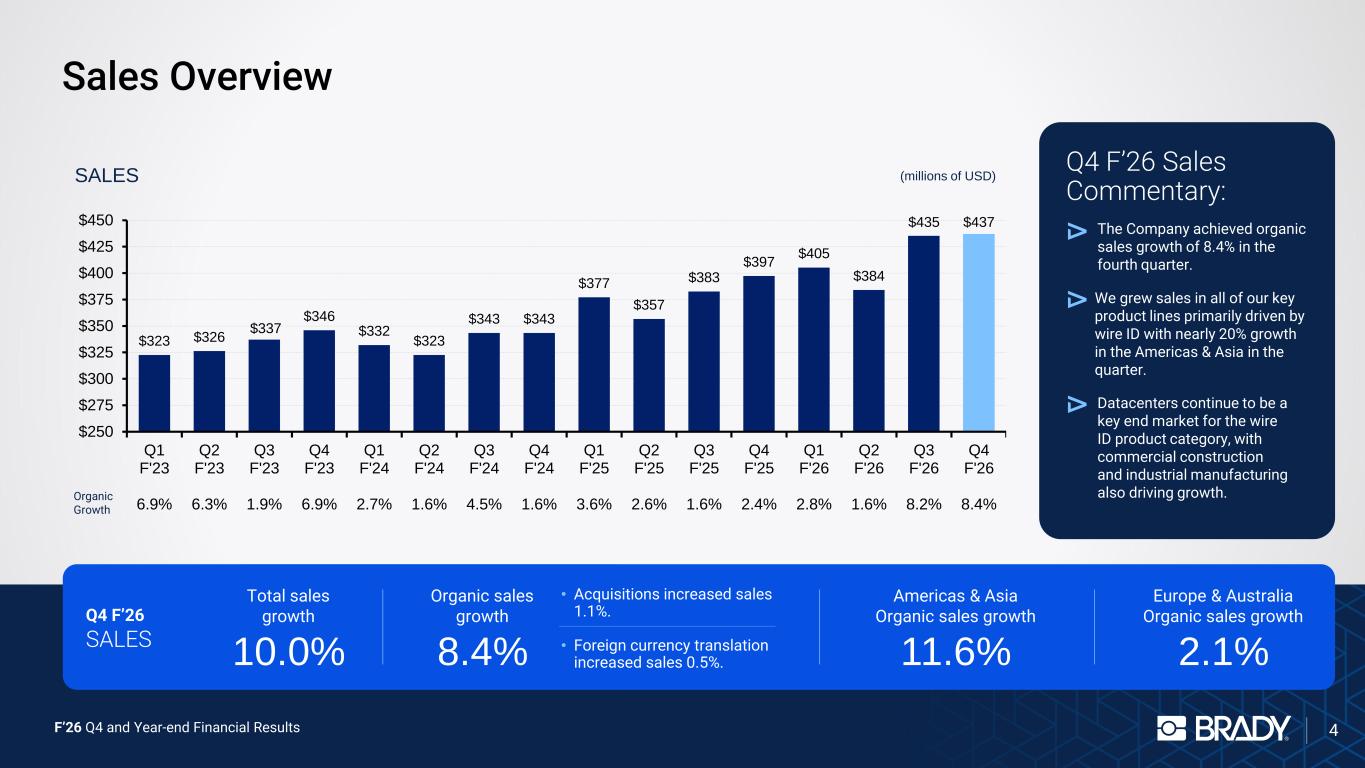
F’26 Q4 and Year-end Financial Results Sales Overview 4 Q4 F’26 Sales Commentary: We grew sales in all of our key product lines primarily driven by wire ID with nearly 20% growth in the Americas & Asia in the quarter. The Company achieved organic sales growth of 8.4% in the fourth quarter. Datacenters continue to be a key end market for the wire ID product category, with commercial construction and industrial manufacturing also driving growth. Total sales growth 10.0% Organic sales growth 8.4% • Acquisitions increased sales 1.1%. • Foreign currency translation increased sales 0.5%. Americas & Asia Organic sales growth 11.6% Europe & Australia Organic sales growth 2.1% $323 $326 $337 $346 $332 $323 $343 $343 $377 $357 $383 $397 $405 $384 $435 $437 $250 $275 $300 $325 $350 $375 $400 $425 $450 Q1 F'23 6.9% Q2 F'23 6.3% Q3 F'23 1.9% Q4 F'23 6.9% Q1 F'24 2.7% Q2 F'24 1.6% Q3 F'24 4.5% Q4 F'24 1.6% Q1 F'25 3.6% Q2 F'25 2.6% Q3 F'25 1.6% Q4 F'25 2.4% Q1 F'26 2.8% Q2 F'26 1.6% Q3 F'26 8.2% Q4 F'26 8.4% Organic Growth SALES (millions of USD) Q4 F’26 SALES
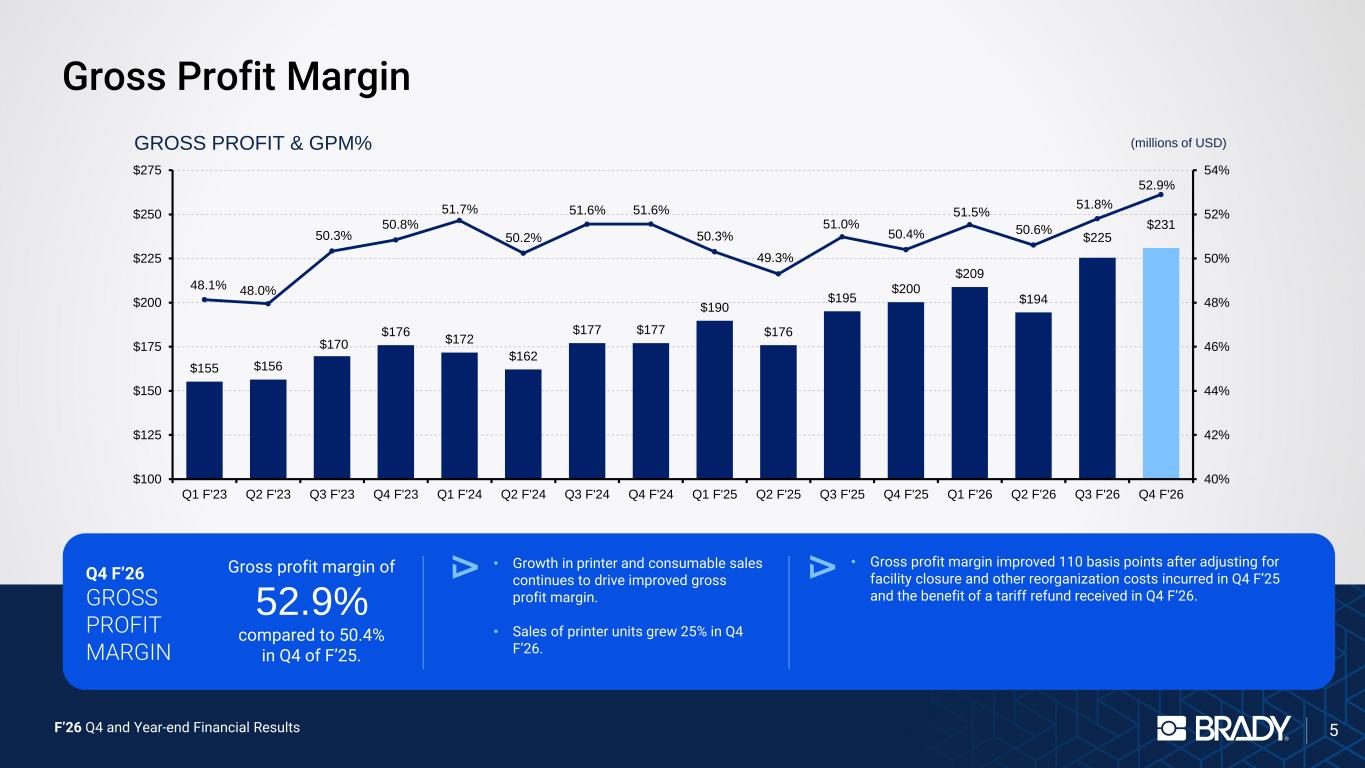
F’26 Q4 and Year-end Financial Results Gross Profit Margin 5 Gross profit margin of 52.9% compared to 50.4% in Q4 of F’25. • Growth in printer and consumable sales continues to drive improved gross profit margin. • Sales of printer units grew 25% in Q4 F’26. $155 $156 $170 $176 $172 $162 $177 $177 $190 $176 $195 $200 $209 $194 $225 $231 48.1% 48.0% 50.3% 50.8% 51.7% 50.2% 51.6% 51.6% 50.3% 49.3% 51.0% 50.4% 51.5% 50.6% 51.8% 52.9% 40% 42% 44% 46% 48% 50% 52% 54% $100 $125 $150 $175 $200 $225 $250 $275 Q1 F'23 Q2 F'23 Q3 F'23 Q4 F'23 Q1 F'24 Q2 F'24 Q3 F'24 Q4 F'24 Q1 F'25 Q2 F'25 Q3 F'25 Q4 F'25 Q1 F'26 Q2 F'26 Q3 F'26 Q4 F'26 GROSS PROFIT & GPM% (millions of USD) • Gross profit margin improved 110 basis points after adjusting for facility closure and other reorganization costs incurred in Q4 F’25 and the benefit of a tariff refund received in Q4 F’26. Q4 F’26 GROSS PROFIT MARGIN
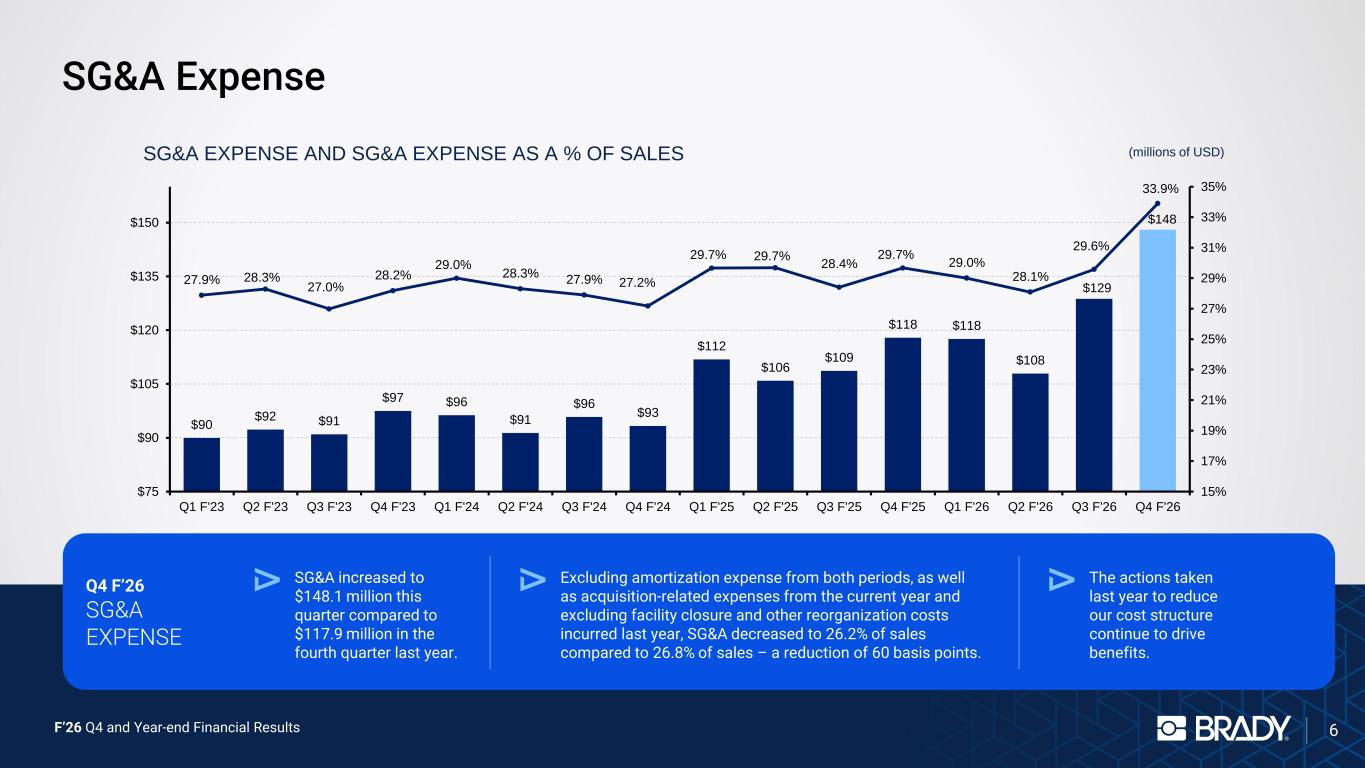
F’26 Q4 and Year-end Financial Results SG&A Expense 6 $90 $92 $91 $97 $96 $91 $96 $93 $112 $106 $109 $118 $118 $108 $129 $148 27.9% 28.3% 27.0% 28.2% 29.0% 28.3% 27.9% 27.2% 29.7% 29.7% 28.4% 29.7% 29.0% 28.1% 29.6% 33.9% 15% 17% 19% 21% 23% 25% 27% 29% 31% 33% 35% $75 $90 $105 $120 $135 $150 Q1 F'23 Q2 F'23 Q3 F'23 Q4 F'23 Q1 F'24 Q2 F'24 Q3 F'24 Q4 F'24 Q1 F'25 Q2 F'25 Q3 F'25 Q4 F'25 Q1 F'26 Q2 F'26 Q3 F'26 Q4 F'26 SG&A EXPENSE AND SG&A EXPENSE AS A % OF SALES (millions of USD) Q4 F’26 SG&A EXPENSE SG&A increased to $148.1 million this quarter compared to $117.9 million in the fourth quarter last year. Excluding amortization expense from both periods, as well as acquisition-related expenses from the current year and excluding facility closure and other reorganization costs incurred last year, SG&A decreased to 26.2% of sales compared to 26.8% of sales – a reduction of 60 basis points. The actions taken last year to reduce our cost structure continue to drive benefits.
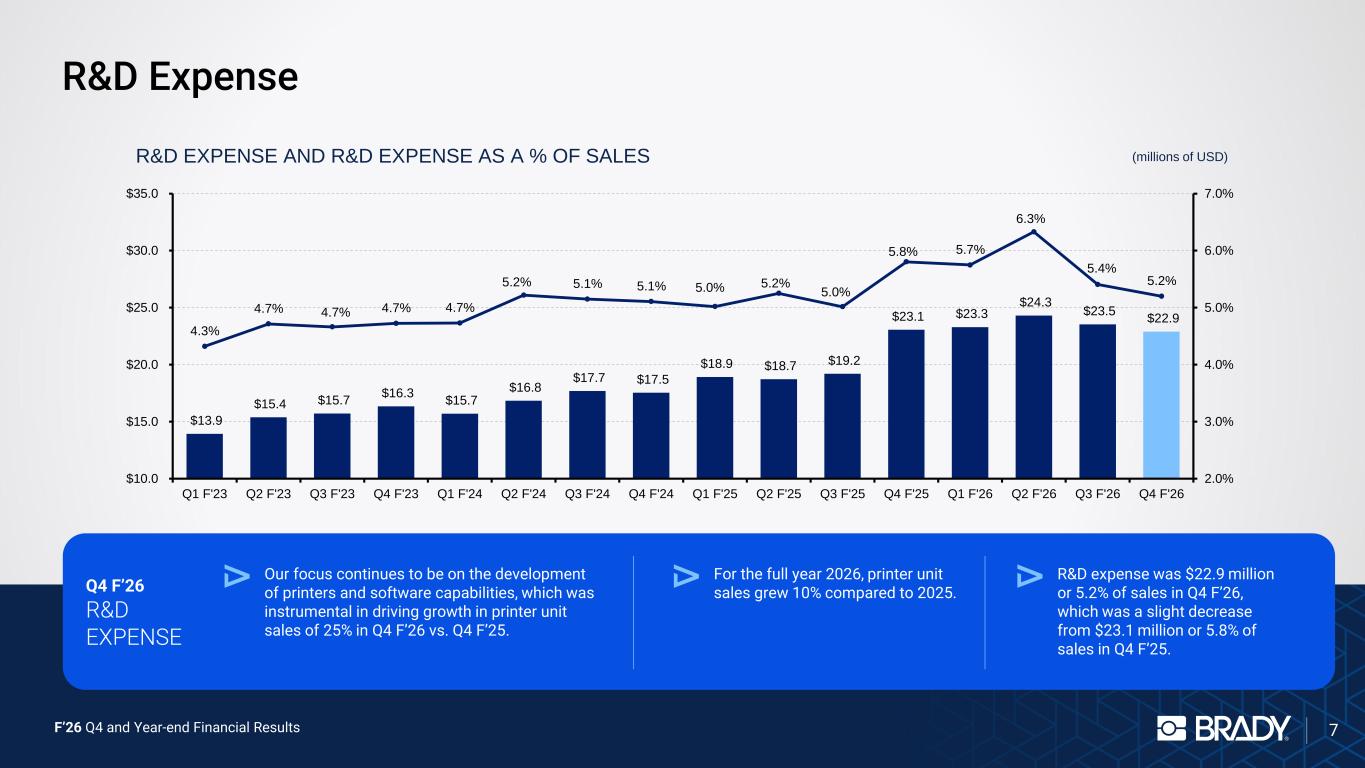
F’26 Q4 and Year-end Financial Results R&D Expense 7 $13.9 $15.4 $15.7 $16.3 $15.7 $16.8 $17.7 $17.5 $18.9 $18.7 $19.2 $23.1 $23.3 $24.3 $23.5 $22.9 4.3% 4.7% 4.7% 4.7% 4.7% 5.2% 5.1% 5.1% 5.0% 5.2% 5.0% 5.8% 5.7% 6.3% 5.4% 5.2% 2.0% 3.0% 4.0% 5.0% 6.0% 7.0% $10.0 $15.0 $20.0 $25.0 $30.0 $35.0 Q1 F'23 Q2 F'23 Q3 F'23 Q4 F'23 Q1 F'24 Q2 F'24 Q3 F'24 Q4 F'24 Q1 F'25 Q2 F'25 Q3 F'25 Q4 F'25 Q1 F'26 Q2 F'26 Q3 F'26 Q4 F'26 R&D EXPENSE AND R&D EXPENSE AS A % OF SALES (millions of USD) Q4 F’26 R&D EXPENSE Our focus continues to be on the development of printers and software capabilities, which was instrumental in driving growth in printer unit sales of 25% in Q4 F’26 vs. Q4 F’25. For the full year 2026, printer unit sales grew 10% compared to 2025. R&D expense was $22.9 million or 5.2% of sales in Q4 F’26, which was a slight decrease from $23.1 million or 5.8% of sales in Q4 F’25.
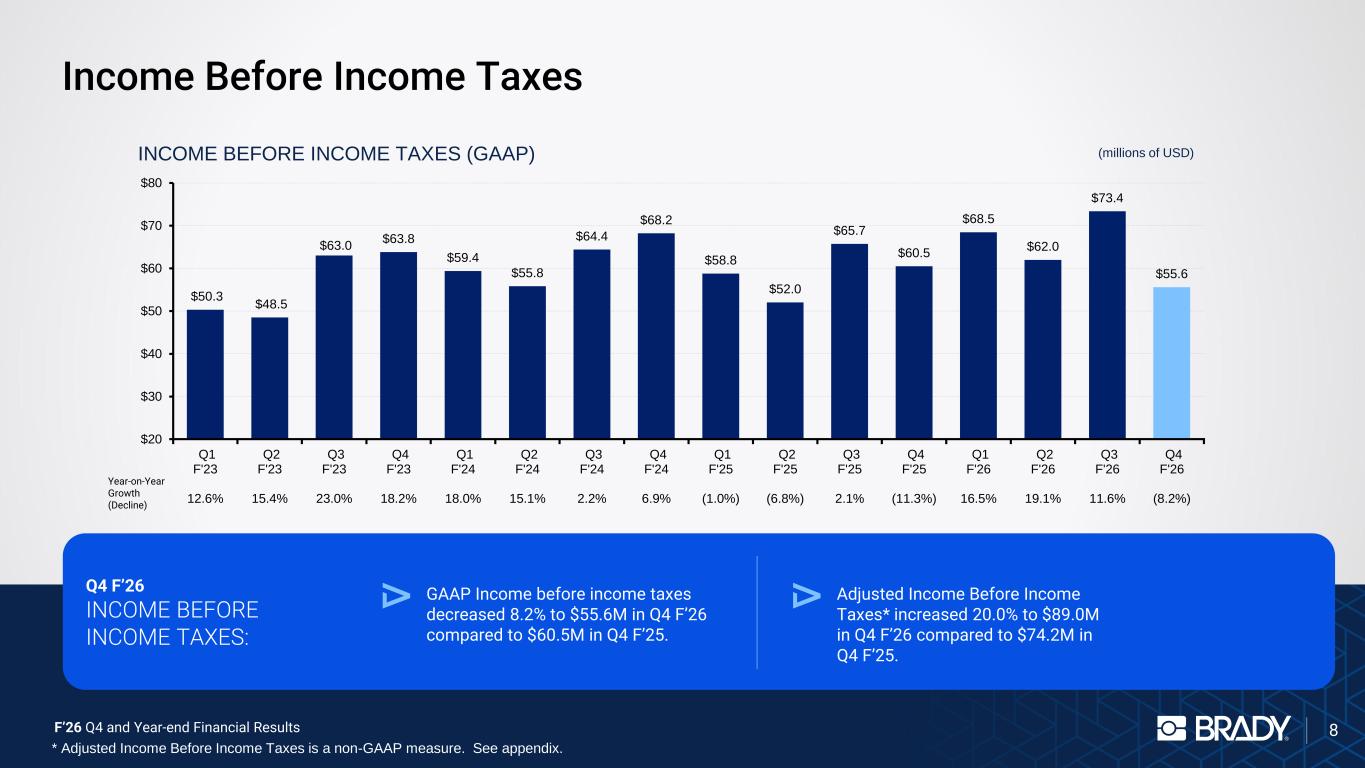
F’26 Q4 and Year-end Financial Results Income Before Income Taxes 8 $50.3 $48.5 $63.0 $63.8 $59.4 $55.8 $64.4 $68.2 $58.8 $52.0 $65.7 $60.5 $68.5 $62.0 $73.4 $55.6 $20 $30 $40 $50 $60 $70 $80 Q1 F'23 12.6% Q2 F'23 15.4% Q3 F'23 23.0% Q4 F'23 18.2% Q1 F'24 18.0% Q2 F'24 15.1% Q3 F'24 2.2% Q4 F'24 6.9% Q1 F'25 (1.0%) Q2 F'25 (6.8%) Q3 F'25 2.1% Q4 F'25 (11.3%) Q1 F'26 16.5% Q2 F'26 19.1% Q3 F'26 11.6% Q4 F'26 (8.2%) (millions of USD)INCOME BEFORE INCOME TAXES (GAAP) Year-on-Year Growth (Decline) Q4 F’26 INCOME BEFORE INCOME TAXES: GAAP Income before income taxes decreased 8.2% to $55.6M in Q4 F’26 compared to $60.5M in Q4 F’25. Adjusted Income Before Income Taxes* increased 20.0% to $89.0M in Q4 F’26 compared to $74.2M in Q4 F’25. * Adjusted Income Before Income Taxes is a non-GAAP measure. See appendix.
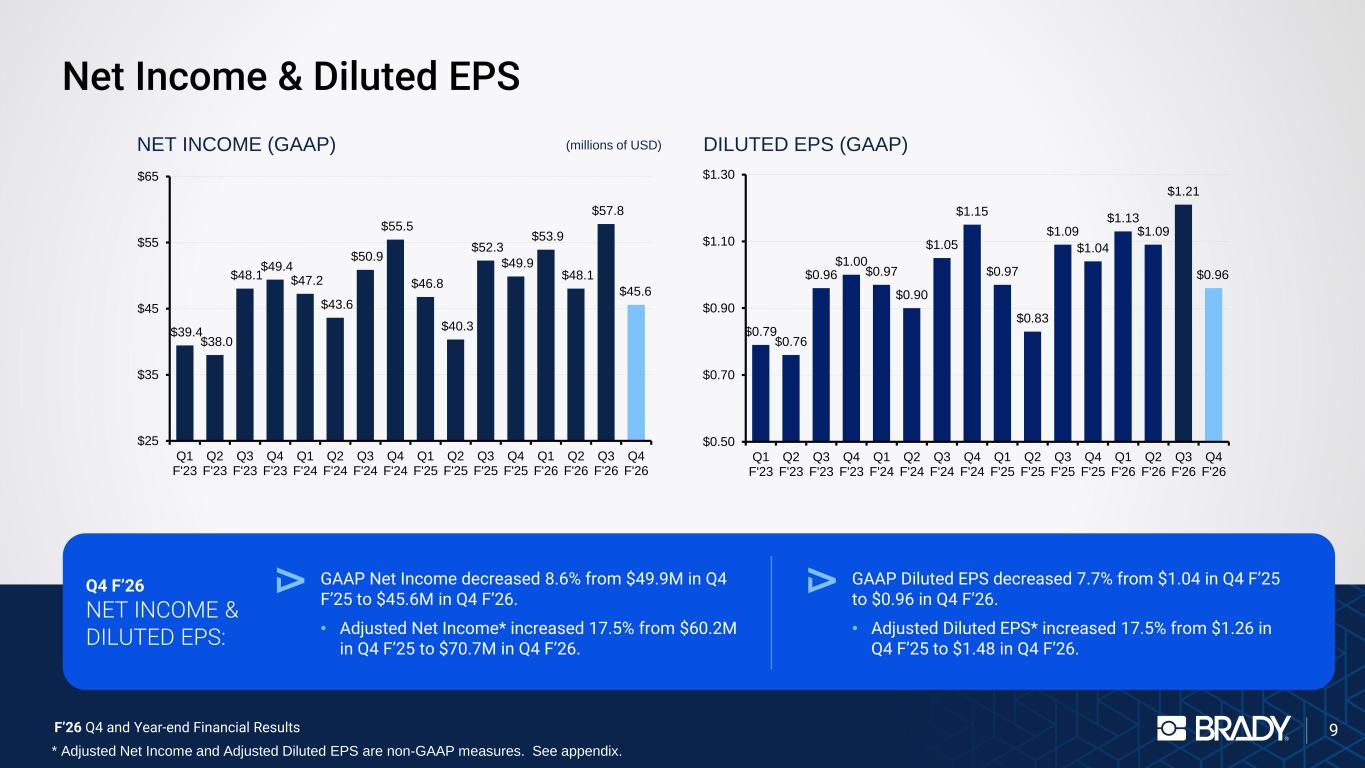
F’26 Q4 and Year-end Financial Results Net Income & Diluted EPS 9 $39.4 $38.0 $48.1 $49.4 $47.2 $43.6 $50.9 $55.5 $46.8 $40.3 $52.3 $49.9 $53.9 $48.1 $57.8 $45.6 $25 $35 $45 $55 $65 Q1 F'23 Q2 F'23 Q3 F'23 Q4 F'23 Q1 F'24 Q2 F'24 Q3 F'24 Q4 F'24 Q1 F'25 Q2 F'25 Q3 F'25 Q4 F'25 Q1 F'26 Q2 F'26 Q3 F'26 Q4 F'26 NET INCOME (GAAP) (millions of USD) $0.79 $0.76 $0.96 $1.00 $0.97 $0.90 $1.05 $1.15 $0.97 $0.83 $1.09 $1.04 $1.13 $1.09 $1.21 $0.96 $0.50 $0.70 $0.90 $1.10 $1.30 Q1 F'23 Q2 F'23 Q3 F'23 Q4 F'23 Q1 F'24 Q2 F'24 Q3 F'24 Q4 F'24 Q1 F'25 Q2 F'25 Q3 F'25 Q4 F'25 Q1 F'26 Q2 F'26 Q3 F'26 Q4 F'26 DILUTED EPS (GAAP) Q4 F’26 NET INCOME & DILUTED EPS: GAAP Net Income decreased 8.6% from $49.9M in Q4 F’25 to $45.6M in Q4 F’26. • Adjusted Net Income* increased 17.5% from $60.2M in Q4 F’25 to $70.7M in Q4 F’26. GAAP Diluted EPS decreased 7.7% from $1.04 in Q4 F’25 to $0.96 in Q4 F’26. • Adjusted Diluted EPS* increased 17.5% from $1.26 in Q4 F’25 to $1.48 in Q4 F’26. * Adjusted Net Income and Adjusted Diluted EPS are non-GAAP measures. See appendix.
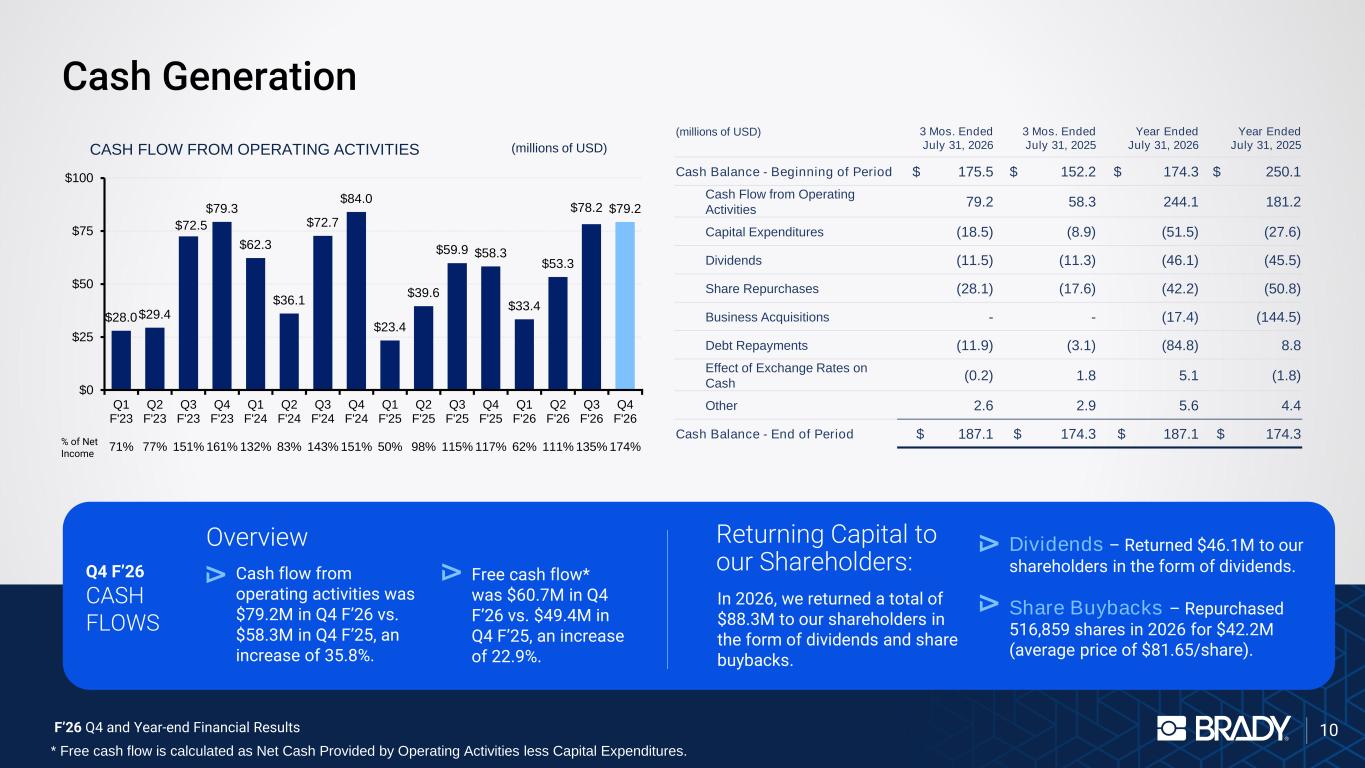
F’26 Q4 and Year-end Financial Results Cash Generation 10 Overview CASH FLOW FROM OPERATING ACTIVITIES $28.0 $29.4 $72.5 $79.3 $62.3 $36.1 $72.7 $84.0 $23.4 $39.6 $59.9 $58.3 $33.4 $53.3 $78.2 $79.2 $0 $25 $50 $75 $100 Q1 F'23 71% Q2 F'23 77% Q3 F'23 151% Q4 F'23 161% Q1 F'24 132% Q2 F'24 83% Q3 F'24 143% Q4 F'24 151% Q1 F'25 50% Q2 F'25 98% Q3 F'25 115% Q4 F'25 117% Q1 F'26 62% Q2 F'26 111% Q3 F'26 135% Q4 F'26 174% % of Net Income (millions of USD) Cash flow from operating activities was $79.2M in Q4 F’26 vs. $58.3M in Q4 F’25, an increase of 35.8%. Free cash flow* was $60.7M in Q4 F’26 vs. $49.4M in Q4 F’25, an increase of 22.9%. Returning Capital to our Shareholders: In 2026, we returned a total of $88.3M to our shareholders in the form of dividends and share buybacks. Dividends – Returned $46.1M to our shareholders in the form of dividends. Share Buybacks – Repurchased 516,859 shares in 2026 for $42.2M (average price of $81.65/share). Q4 F’26 CASH FLOWS (millions of USD) 3 Mos. Ended July 31, 2026 3 Mos. Ended July 31, 2025 Year Ended July 31, 2026 Year Ended July 31, 2025 Cash Balance - Beginning of Period $ 175.5 $ 152.2 $ 174.3 $ 250.1 Cash Flow from Operating Activities 79.2 58.3 244.1 181.2 Capital Expenditures (18.5) (8.9) (51.5) (27.6) Dividends (11.5) (11.3) (46.1) (45.5) Share Repurchases (28.1) (17.6) (42.2) (50.8) Business Acquisitions - - (17.4) (144.5) Debt Repayments (11.9) (3.1) (84.8) 8.8 Effect of Exchange Rates on Cash (0.2) 1.8 5.1 (1.8) Other 2.6 2.9 5.6 4.4 Cash Balance - End of Period $ 187.1 $ 174.3 $ 187.1 $ 174.3 * Free cash flow is calculated as Net Cash Provided by Operating Activities less Capital Expenditures.
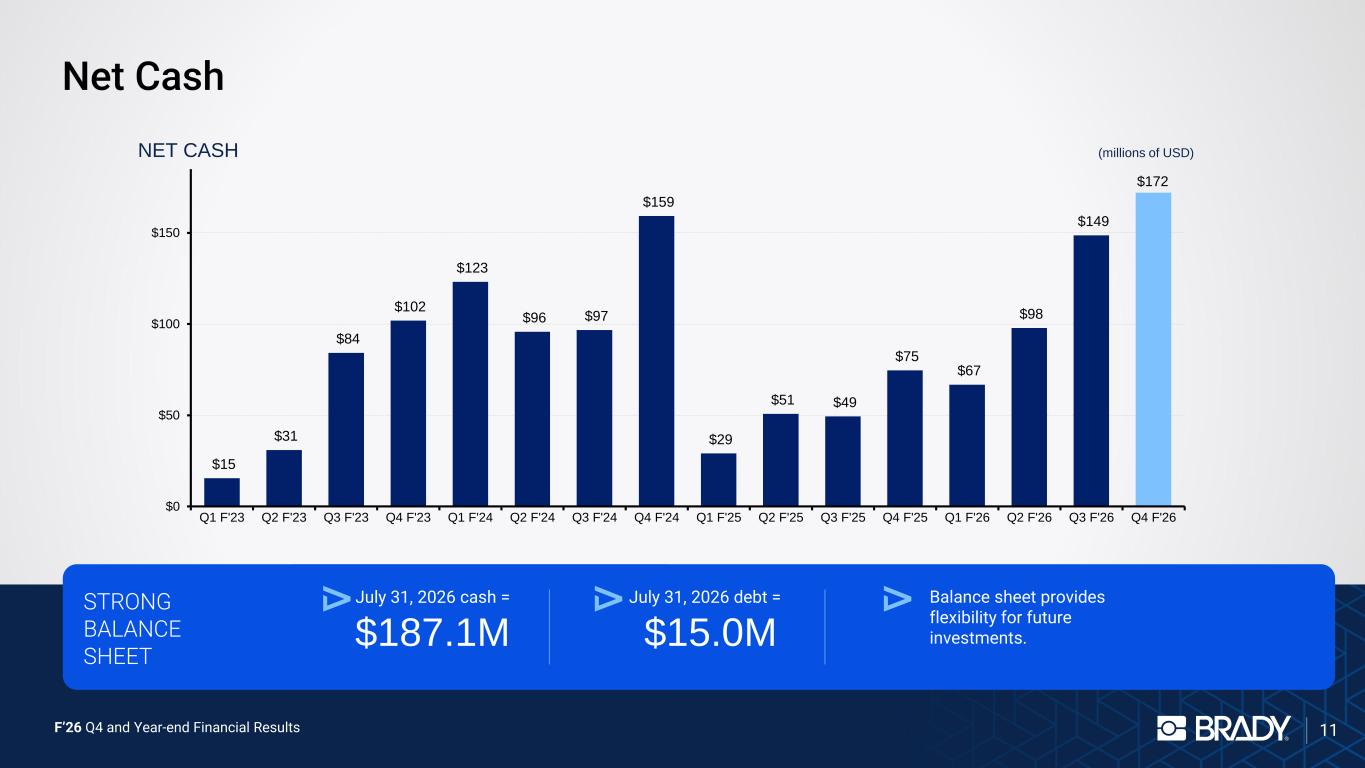
F’26 Q4 and Year-end Financial Results Net Cash 11 $15 $31 $84 $102 $123 $96 $97 $159 $29 $51 $49 $75 $67 $98 $149 $172 $0 $50 $100 $150 Q1 F'23 Q2 F'23 Q3 F'23 Q4 F'23 Q1 F'24 Q2 F'24 Q3 F'24 Q4 F'24 Q1 F'25 Q2 F'25 Q3 F'25 Q4 F'25 Q1 F'26 Q2 F'26 Q3 F'26 Q4 F'26 NET CASH STRONG BALANCE SHEET July 31, 2026 cash = $187.1M Balance sheet provides flexibility for future investments. July 31, 2026 debt = $15.0M (millions of USD)
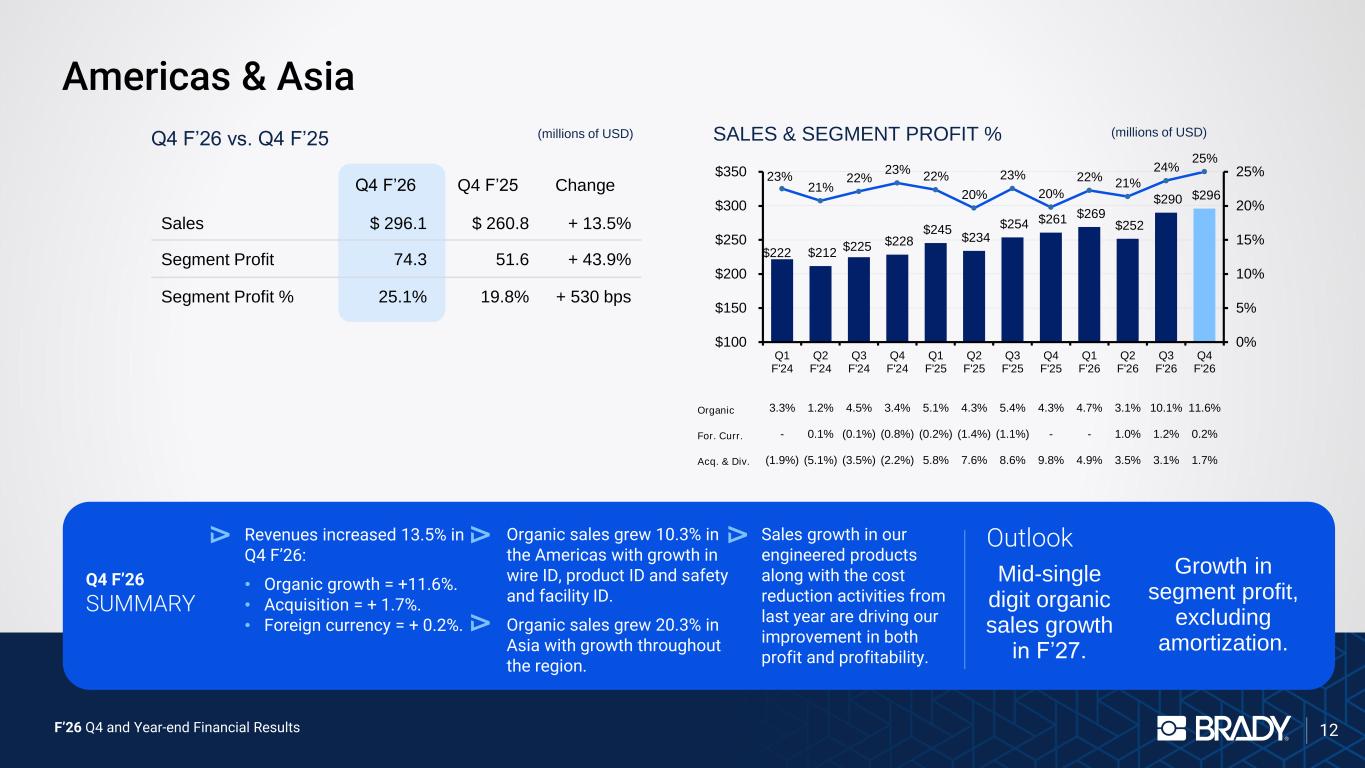
F’26 Q4 and Year-end Financial Results 12 Americas & Asia Q4 F’26 SUMMARY Revenues increased 13.5% in Q4 F’26: • Organic growth = +11.6%. • Acquisition = + 1.7%. • Foreign currency = + 0.2%. Organic sales grew 10.3% in the Americas with growth in wire ID, product ID and safety and facility ID. Organic sales grew 20.3% in Asia with growth throughout the region. Sales growth in our engineered products along with the cost reduction activities from last year are driving our improvement in both profit and profitability. Outlook Mid-single digit organic sales growth in F’27. Growth in segment profit, excluding amortization. Q4 F’26 vs. Q4 F’25 (millions of USD) $222 $212 $225 $228 $245 $234 $254 $261 $269 $252 $290 $296 23% 21% 22% 23% 22% 20% 23% 20% 22% 21% 24% 25% 0% 5% 10% 15% 20% 25% $100 $150 $200 $250 $300 $350 Q1 F'24 3.3% - (1.9%) Q2 F'24 1.2% 0.1% (5.1%) Q3 F'24 4.5% (0.1%) (3.5%) Q4 F'24 3.4% (0.8%) (2.2%) Q1 F'25 5.1% (0.2%) 5.8% Q2 F'25 4.3% (1.4%) 7.6% Q3 F'25 5.4% (1.1%) 8.6% Q4 F'25 4.3% - 9.8% Q1 F'26 4.7% - 4.9% Q2 F'26 3.1% 1.0% 3.5% Q3 F'26 10.1% 1.2% 3.1% Q4 F'26 11.6% 0.2% 1.7% SALES & SEGMENT PROFIT % (millions of USD) Q4 F’26 Q4 F’25 Change Sales $ 296.1 $ 260.8 + 13.5% Segment Profit 74.3 51.6 + 43.9% Segment Profit % 25.1% 19.8% + 530 bps Organic For. Curr. Acq. & Div.
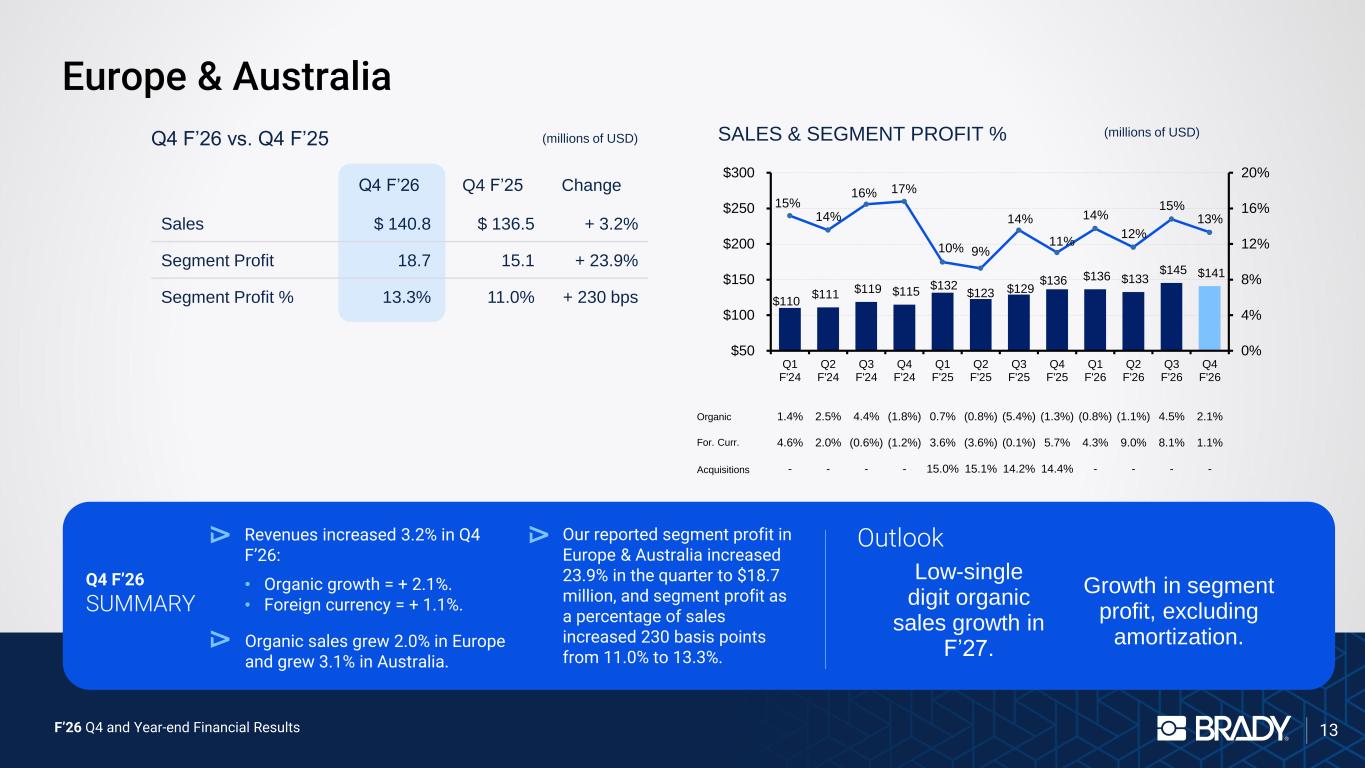
F’26 Q4 and Year-end Financial Results 13 Europe & Australia Q4 F’26 SUMMARY Revenues increased 3.2% in Q4 F’26: • Organic growth = + 2.1%. • Foreign currency = + 1.1%. Organic sales grew 2.0% in Europe and grew 3.1% in Australia. Our reported segment profit in Europe & Australia increased 23.9% in the quarter to $18.7 million, and segment profit as a percentage of sales increased 230 basis points from 11.0% to 13.3%. Outlook Q4 F’26 vs. Q4 F’25 (millions of USD) SALES & SEGMENT PROFIT % (millions of USD) Organic For. Curr. Acquisitions Q4 F’26 Q4 F’25 Change Sales $ 140.8 $ 136.5 + 3.2% Segment Profit 18.7 15.1 + 23.9% Segment Profit % 13.3% 11.0% + 230 bps $110 $111 $119 $115 $132 $123 $129 $136 $136 $133 $145 $141 15% 14% 16% 17% 10% 9% 14% 11% 14% 12% 15% 13% 0% 4% 8% 12% 16% 20% $50 $100 $150 $200 $250 $300 Q1 F'24 1.4% 4.6% - Q2 F'24 2.5% 2.0% - Q3 F'24 4.4% (0.6%) - Q4 F'24 (1.8%) (1.2%) - Q1 F'25 0.7% 3.6% 15.0% Q2 F'25 (0.8%) (3.6%) 15.1% Q3 F'25 (5.4%) (0.1%) 14.2% Q4 F'25 (1.3%) 5.7% 14.4% Q1 F'26 (0.8%) 4.3% - Q2 F'26 (1.1%) 9.0% - Q3 F'26 4.5% 8.1% - Q4 F'26 2.1% 1.1% - Low-single digit organic sales growth in F’27. Growth in segment profit, excluding amortization.
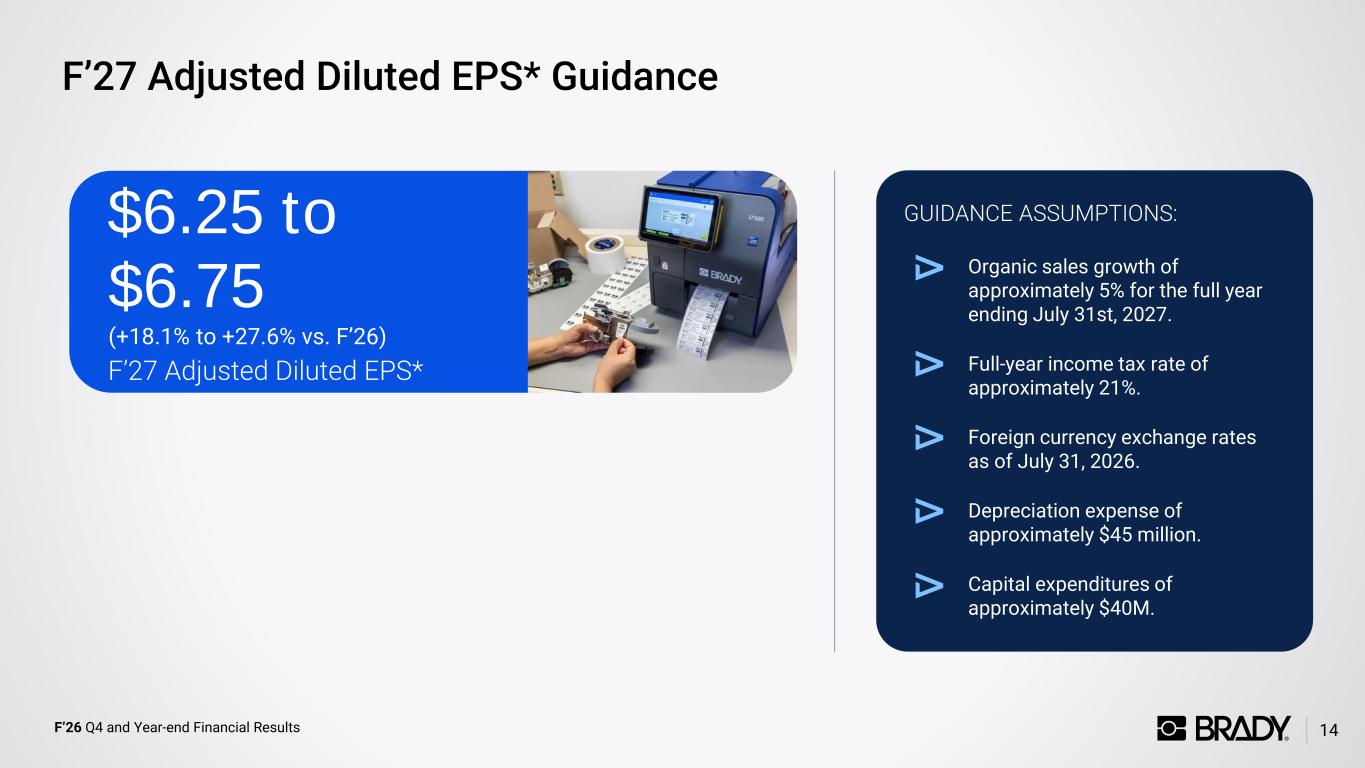
F’26 Q4 and Year-end Financial Results F’27 Adjusted Diluted EPS* Guidance 14 Organic sales growth of approximately 5% for the full year ending July 31st, 2027. Full-year income tax rate of approximately 21%. Foreign currency exchange rates as of July 31, 2026. Depreciation expense of approximately $45 million. Capital expenditures of approximately $40M. GUIDANCE ASSUMPTIONS: F’27 Adjusted Diluted EPS* $6.25 to $6.75 (+18.1% to +27.6% vs. F’26)

F’26 Q4 and Year-end Financial Results Investor Relations 15 Brady Contact: Ann Thornton Investor Relations 414-438-6887 investor@bradycorp.com See our website at www.bradycorp.com/investors

F’26 Q4 and Year-end Financial Results 16 GAAP to Non-GAAP Reconciliations Appendix Need updated reconciliations
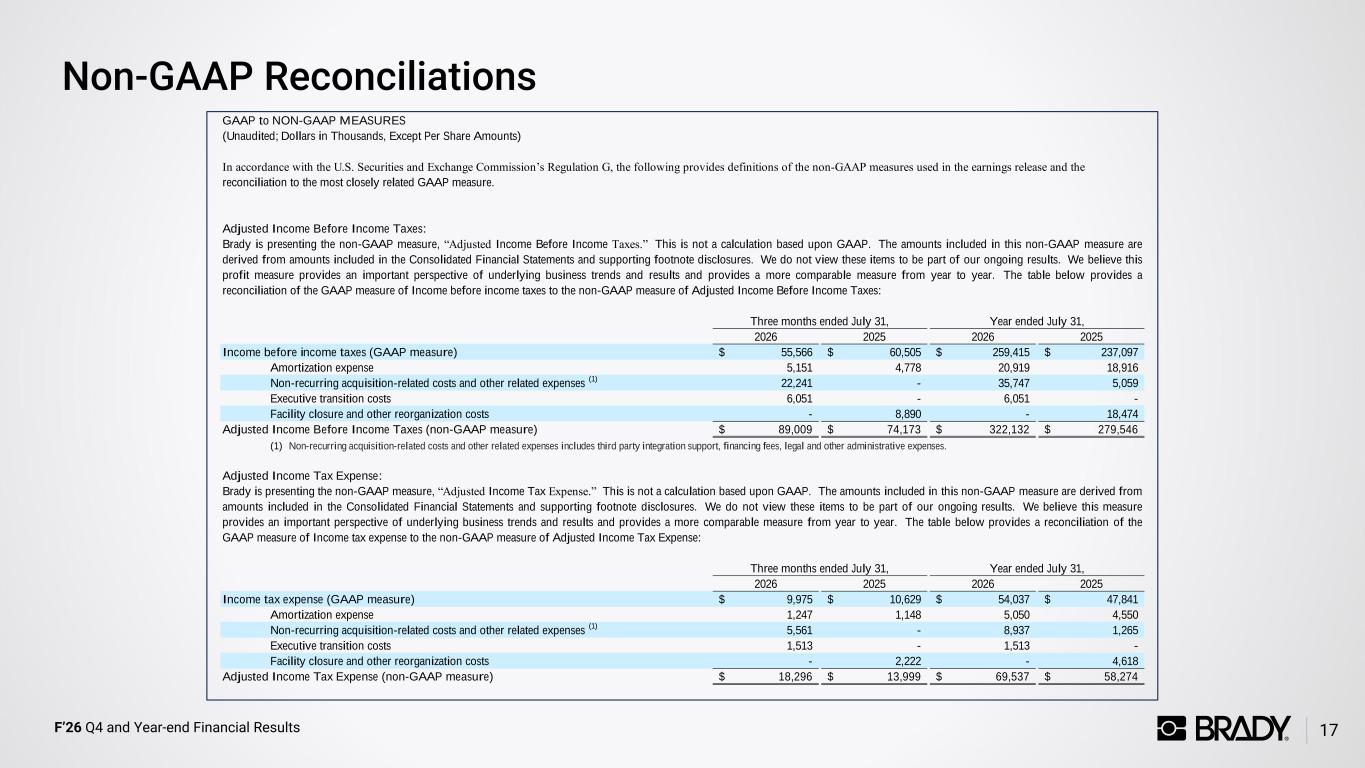
F’26 Q4 and Year-end Financial Results Non-GAAP Reconciliations 17 2026 2025 2026 2025 55,566$ 60,505$ 259,415$ 237,097$ Amortization expense 5,151 4,778 20,919 18,916 Non-recurring acquisition-related costs and other related expenses (1) 22,241 - 35,747 5,059 Executive transition costs 6,051 - 6,051 - Facility closure and other reorganization costs - 8,890 - 18,474 89,009$ 74,173$ 322,132$ 279,546$ (1) Non-recurring acquisition-related costs and other related expenses includes third party integration support, financing fees, legal and other administrative expenses. 2026 2025 2026 2025 9,975$ 10,629$ 54,037$ 47,841$ Amortization expense 1,247 1,148 5,050 4,550 Non-recurring acquisition-related costs and other related expenses (1) 5,561 - 8,937 1,265 Executive transition costs 1,513 - 1,513 - Facility closure and other reorganization costs - 2,222 - 4,618 18,296$ 13,999$ 69,537$ 58,274$ Three months ended July 31, Three months ended July 31, Adjusted Income Tax Expense (non-GAAP measure) Year ended July 31, Income before income taxes (GAAP measure) Adjusted Income Before Income Taxes (non-GAAP measure) Brady is presenting the non-GAAP measure, “Adjusted Income Tax Expense.” This is not a calculation based upon GAAP. The amounts included in this non-GAAP measure are derived from amounts included in the Consolidated Financial Statements and supporting footnote disclosures. We do not view these items to be part of our ongoing results. We believe this measure provides an important perspective of underlying business trends and results and provides a more comparable measure from year to year. The table below provides a reconciliation of the GAAP measure of Income tax expense to the non-GAAP measure of Adjusted Income Tax Expense: Year ended July 31, Income tax expense (GAAP measure) Adjusted Income Tax Expense: GAAP to NON-GAAP MEASURES (Unaudited; Dollars in Thousands, Except Per Share Amounts) In accordance with the U.S. Securities and Exchange Commission’s Regulation G, the following provides definitions of the non-GAAP measures used in the earnings release and the reconciliation to the most closely related GAAP measure. Adjusted Income Before Income Taxes: Brady is presenting the non-GAAP measure, “Adjusted Income Before Income Taxes.” This is not a calculation based upon GAAP. The amounts included in this non-GAAP measure are derived from amounts included in the Consolidated Financial Statements and supporting footnote disclosures. We do not view these items to be part of our ongoing results. We believe this profit measure provides an important perspective of underlying business trends and results and provides a more comparable measure from year to year. The table below provides a reconciliation of the GAAP measure of Income before income taxes to the non-GAAP measure of Adjusted Income Before Income Taxes:
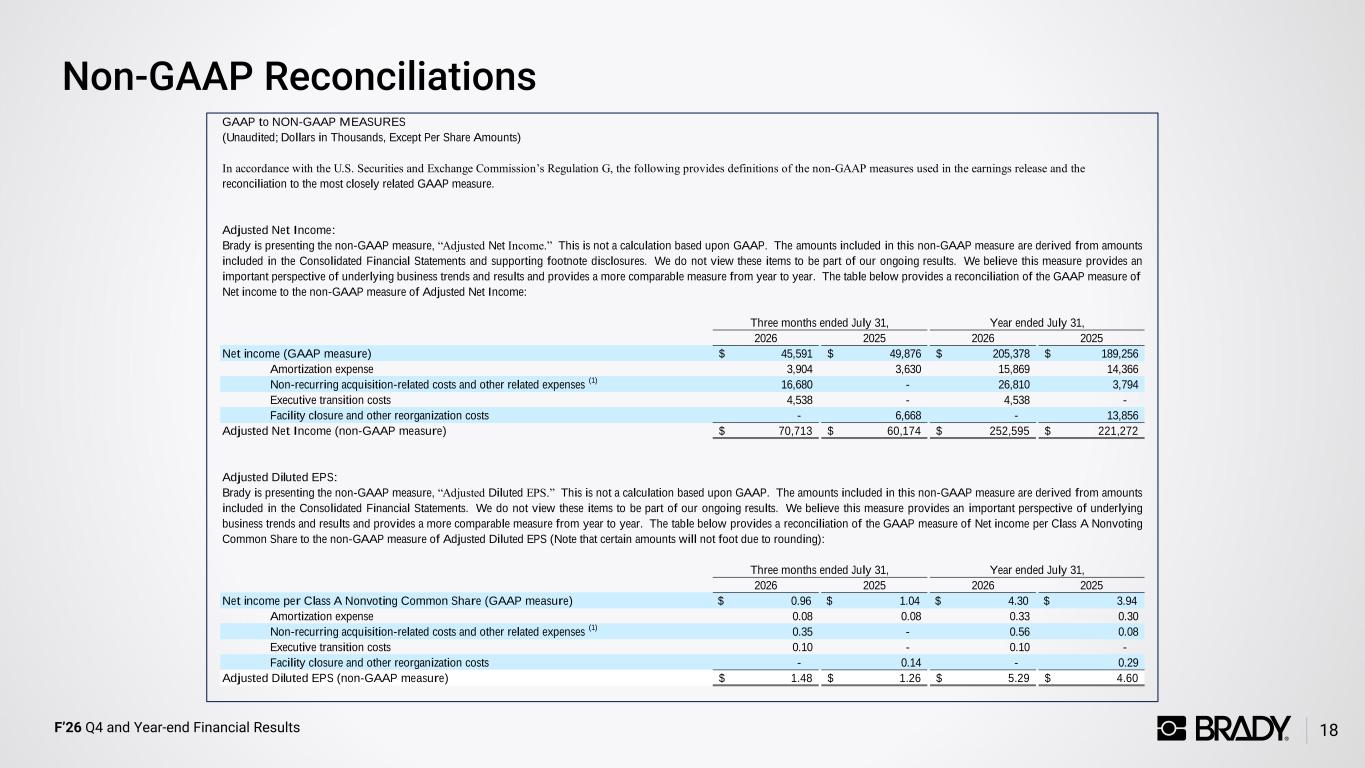
F’26 Q4 and Year-end Financial Results Non-GAAP Reconciliations 18 2026 2025 2026 2025 45,591$ 49,876$ 205,378$ 189,256$ Amortization expense 3,904 3,630 15,869 14,366 Non-recurring acquisition-related costs and other related expenses (1) 16,680 - 26,810 3,794 Executive transition costs 4,538 - 4,538 - Facility closure and other reorganization costs - 6,668 - 13,856 70,713$ 60,174$ 252,595$ 221,272$ 2026 2025 2026 2025 $ 0.96 $ 1.04 $ 4.30 $ 3.94 Amortization expense 0.08 0.08 0.33 0.30 Non-recurring acquisition-related costs and other related expenses (1) 0.35 - 0.56 0.08 Executive transition costs 0.10 - 0.10 - Facility closure and other reorganization costs - 0.14 - 0.29 1.48$ 1.26$ 5.29$ 4.60$ Adjusted Diluted EPS (non-GAAP measure) Three months ended July 31, Brady is presenting the non-GAAP measure, “Adjusted Net Income.” This is not a calculation based upon GAAP. The amounts included in this non-GAAP measure are derived from amounts included in the Consolidated Financial Statements and supporting footnote disclosures. We do not view these items to be part of our ongoing results. We believe this measure provides an important perspective of underlying business trends and results and provides a more comparable measure from year to year. The table below provides a reconciliation of the GAAP measure of Net income to the non-GAAP measure of Adjusted Net Income: Year ended July 31, Net income (GAAP measure) Adjusted Net Income (non-GAAP measure) GAAP to NON-GAAP MEASURES (Unaudited; Dollars in Thousands, Except Per Share Amounts) In accordance with the U.S. Securities and Exchange Commission’s Regulation G, the following provides definitions of the non-GAAP measures used in the earnings release and the reconciliation to the most closely related GAAP measure. Adjusted Net Income: Three months ended July 31, Brady is presenting the non-GAAP measure, “Adjusted Diluted EPS.” This is not a calculation based upon GAAP. The amounts included in this non-GAAP measure are derived from amounts included in the Consolidated Financial Statements. We do not view these items to be part of our ongoing results. We believe this measure provides an important perspective of underlying business trends and results and provides a more comparable measure from year to year. The table below provides a reconciliation of the GAAP measure of Net income per Class A Nonvoting Common Share to the non-GAAP measure of Adjusted Diluted EPS (Note that certain amounts will not foot due to rounding): Year ended July 31, Net income per Class A Nonvoting Common Share (GAAP measure) Adjusted Diluted EPS: