Shareholder Report
Jun. 30, 2026
USD ($)
$ / shares
WHAT WERE THE FUND COSTS FOR THE PERIOD? (based on a hypothetical $10,000 investment)
|
Fund Name
|
Costs of a $10,000 investment*
|
Costs paid as a percentage of a $10,000 investment**
|
|
Arimathea Catholic Core Bond ETF
|
$3
|
0.52%
|
HOW DID THE FUND PERFORM DURING THE PERIOD AND WHAT AFFECTED ITS PERFORMANCE?
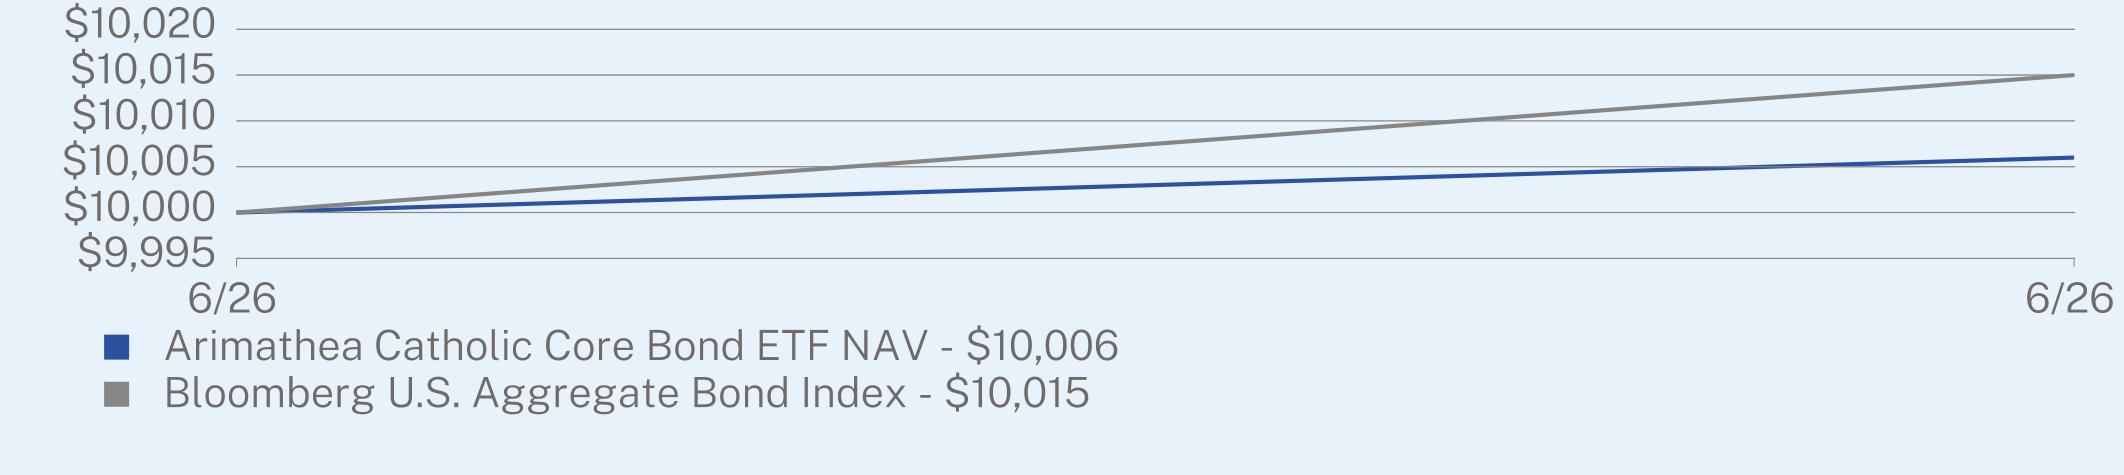
For the period from June 12, 2026 through June 30, 2026, the Fund’s net asset value (“NAV”) return was 0.06% compared to its benchmark index, the Bloomberg U.S. Aggregate Bond Index, which returned 0.15%.
During the period the Fund stepped into a market marked by a bear-flattening Treasury curve, tighter credit spreads, and a new Federal Reserve regime under Chairman Kevin Warsh, and the adviser positioned the portfolio with a modestly short-duration bias, overweights to Treasury and Financial Institutions, and underweights to MBS Passthrough and Industrial credit relative to the benchmark. At period-end the Fund held 87 positions worth $12.12 million with a 4.76% yield to worst and 5.66-year duration, in line with the benchmark’s yield and duration, and its Treasury overweight and zero weights to CMBS, ABS, and Agency securities reflected the Fund’s modest scale during the launch window rather than any directional view on rates or sectors.
CUMULATIVE TOTAL RETURN (%)
|
|
Since Inception
(06/12/2026) |
|
Arimathea Catholic Core Bond ETF NAV
|
0.06
|
|
Bloomberg U.S. Aggregate Bond Index
|
0.15
|
Visit https://faithinvestorservices.com/etfs/shrd/ for more recent performance information.
KEY FUND STATISTICS (as of June 30, 2026)
|
Net Assets
|
$11,999,033
|
|
Number of Holdings
|
87
|
|
Net Advisory Fee
|
$2,223
|
|
Portfolio Turnover
|
0%
|
|
30-Day SEC Yield
|
0.00%
|
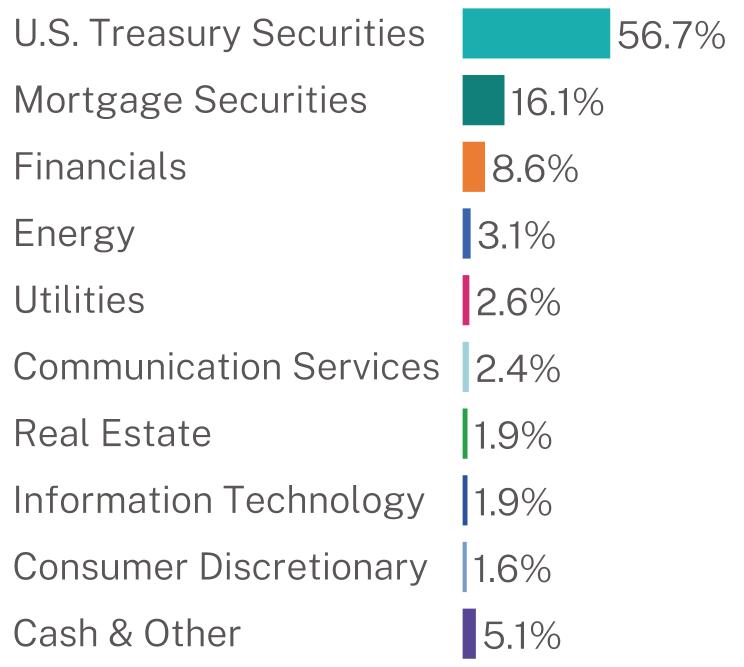
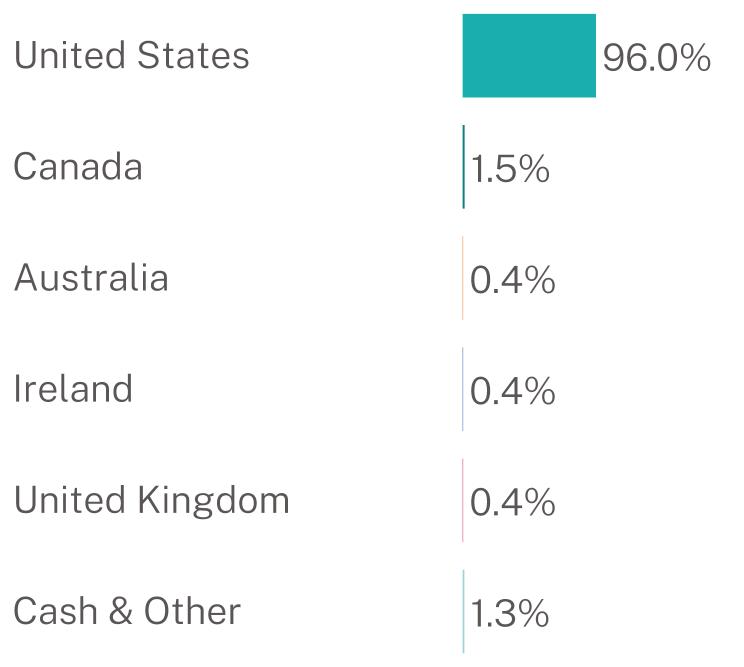
WHAT DID THE FUND INVEST IN? (% of net assets as of June 30, 2026)
Sector Breakdown*
|
Top 10 Issuers
|
||
|
United States Treasury Note/Bond
|
56.7
|
%
|
|
Federal National Mortgage Association
|
10.6
|
%
|
|
Federal Home Loan Mortgage Corp.
|
5.5
|
%
|
|
Charter Communications Operating LLC / Charter Communications Operating Capital
|
1.5
|
%
|
|
JPMorgan Chase & Co.
|
0.8
|
%
|
|
Alphabet, Inc.
|
0.8
|
%
|
|
American Assets Trust LP
|
0.8
|
%
|
|
American Express Co.
|
0.8
|
%
|
|
Salesforce, Inc.
|
0.8
|
%
|
|
Oracle Corp.
|
0.8
|
%
|
Geographic Breakdown
WHAT WERE THE FUND COSTS FOR THE PERIOD? (based on a hypothetical $10,000 investment)
|
Fund Name
|
Costs of a $10,000 investment*
|
Costs paid as a percentage of a $10,000 investment**
|
|
FIS Bright Portfolios Core Bond ETF
|
$14
|
0.49%
|
HOW DID THE FUND PERFORM DURING THE PERIOD AND WHAT AFFECTED ITS PERFORMANCE?
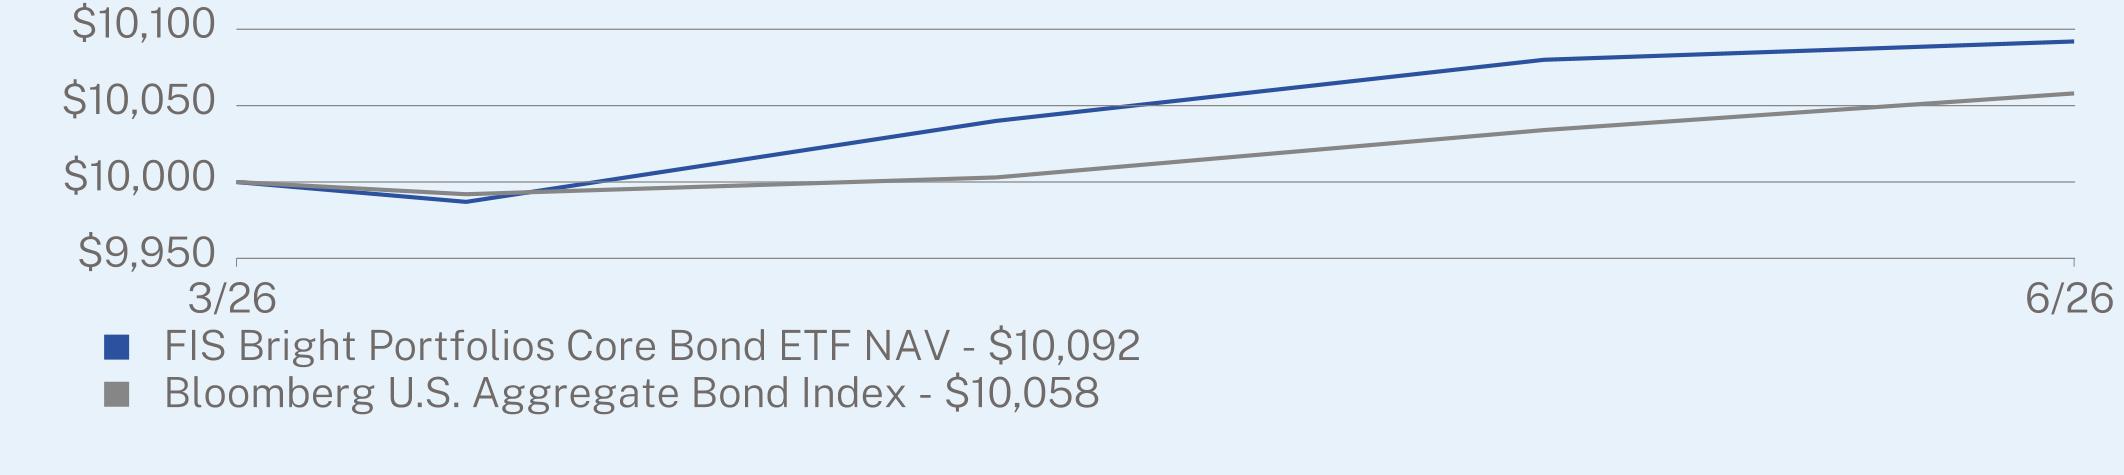
For the period from March 19, 2026 through June 30, 2026, the Fund’s net asset value (“NAV”) return was 0.92% compared to its benchmark index, the Bloomberg U.S. Aggregate Bond Index, which returned 0.58%.
Fixed income markets were weak over the Fund’s first fiscal period. Intermediate and longer maturity bonds declined in March 2026 as yields rose, with the broad investment grade market falling approximately 1.4% in that month alone. Conditions stabilized thereafter, and the market posted small positive returns in each of April, May and June. For the period as a whole the broad investment grade market declined modestly while short-dated instruments produced positive returns, reflecting an environment in which income accrual rather than price appreciation drove results. The Fund is managed as a laddered portfolio of investment grade corporate bonds with staggered maturities. Before any security is considered, Bright Portfolios, LLC, the sub-adviser, applies its elimination framework to the issuer, screening on the basis of the products and services the issuer sells. Eligible bonds are then selected on credit quality, duration, yield and portfolio fit. The Fund generally intends to hold bonds to maturity and to reinvest maturing proceeds, which limits turnover and emphasizes income accrual over trading.
CUMULATIVE TOTAL RETURN (%)
|
|
Since Inception
(03/19/2026) |
|
FIS Bright Portfolios Core Bond ETF NAV
|
0.92
|
|
Bloomberg U.S. Aggregate Bond Index
|
0.58
|
Visit https://faithinvestorservices.com/etfs/brib/ for more recent performance information.
KEY FUND STATISTICS (as of June 30, 2026)
|
Net Assets
|
$52,442,228
|
|
Number of Holdings
|
101
|
|
Net Advisory Fee
|
$51,341
|
|
Portfolio Turnover
|
0%
|
|
30-Day SEC Yield
|
4.53%
|
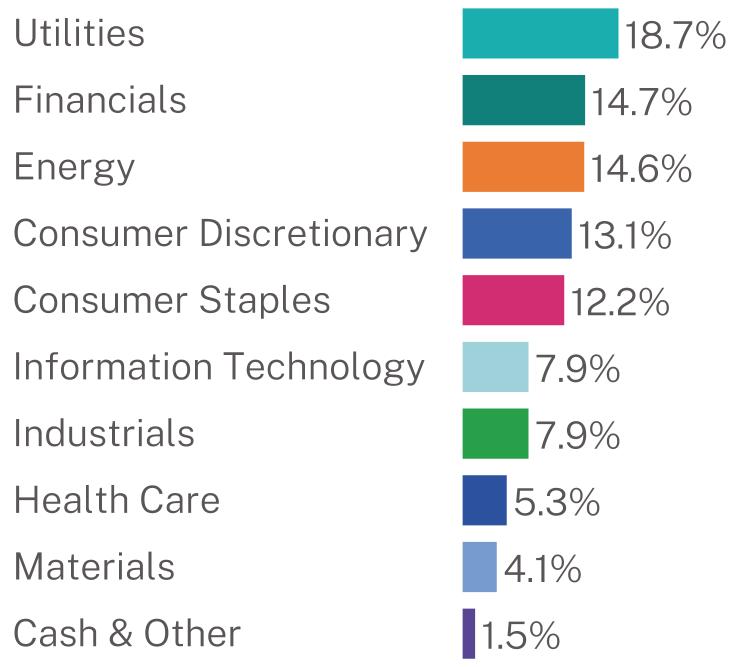
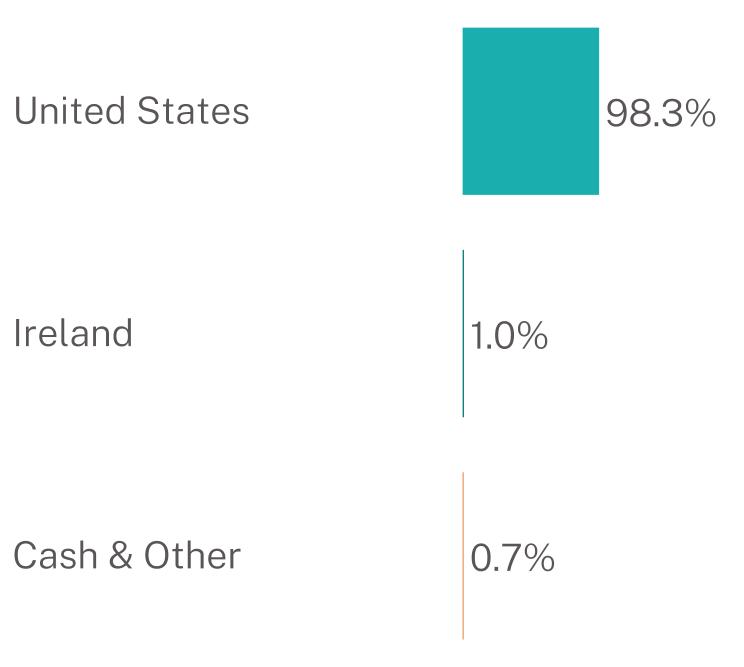
WHAT DID THE FUND INVEST IN? (% of net assets as of June 30, 2026)
Sector Breakdown*
|
Top 10 Issuers
|
||
|
Genuine Parts Co.
|
2.2
|
%
|
|
Revvity, Inc.
|
2.1
|
%
|
|
DCP Midstream Operating LP
|
2.1
|
%
|
|
Trimble, Inc.
|
2.1
|
%
|
|
Expedia Group, Inc.
|
2.1
|
%
|
|
Lennar Corp.
|
2.1
|
%
|
|
Valero Energy Corp.
|
2.1
|
%
|
|
Arizona Public Service Co.
|
2.1
|
%
|
|
Darden Restaurants, Inc.
|
2.1
|
%
|
|
IQVIA, Inc.
|
2.1
|
%
|
Geographic Breakdown
This report describes changes to the Fund that occurred during the reporting period.
WHAT WERE THE FUND COSTS FOR THE PERIOD? (based on a hypothetical $10,000 investment)
|
Fund Name
|
Costs of a $10,000 investment*
|
Costs paid as a percentage of a $10,000 investment**
|
|
FIS Bright Portfolios Focused Equity ETF
|
$5
|
0.65%
|
HOW DID THE FUND PERFORM DURING THE PERIOD AND WHAT AFFECTED ITS PERFORMANCE?
For the period from June 1, 2026 through June 30, 2026, a relatively short period, the Fund returned 3.38% based on net asset value. The Fund’s benchmark, the MSCI USA Index, returned -0.92% over the same period.
U.S. equity markets declined modestly during the period, with the MSCI USA Index falling 0.92%. Beneath that headline, dispersion between individual securities was unusually wide. Several of the largest semiconductor and artificial intelligence related companies that had led the market over the prior year sold off sharply, while industrials, health care and a number of technology companies outside that group advanced. The period was therefore an unfavorable one for concentrated exposure to the largest index constituents and a favorable one for portfolios with earnings driven breadth. The Fund is managed using Bright Portfolios, LLC’s (the “Sub-Adviser”) proprietary Bright Earnings LifeCycle model, which classifies companies according to their position in the earnings revision cycle and combines that assessment with quality and valuation measures. The Sub-Adviser seeks companies whose earnings expectations are improving before that improvement is reflected in share prices, and trims or exits positions once those expectations become widely recognized and valuations extend. Before any security is eligible for purchase, the issuer must clear the Sub-Adviser’s Common Good elimination framework, which screens issuers on the basis of the products and services they sell. The Fund held a concentrated portfolio of approximately 47 positions during the period. The Fund outperformed its benchmark by more than four percentage points during the period, and did so without assistance from its largest holdings. Palo Alto Networks, Inc. was the single largest contributor. Micron Technology, Inc., AbbVie, Inc., Eli Lilly & Co., Caterpillar, Inc. and Cummins, Inc. each contributed meaningfully, as did Allstate Corp. and ASML Holding NV. The breadth of these contributions across technology, health care, industrials and financials reflects the Sub-Adviser’s process of identifying improving earnings expectations across a range of industries rather than within a single theme. The Fund’s two largest positions, Broadcom, Inc. and NVIDIA Corp., both detracted during the period. That the Fund produced a positive return in a declining market despite losses in its two largest holdings reflects the contribution of the balance of the portfolio.
|
Top Contributors
|
|
|
↑
|
Palo Alto Networks, Inc.
|
|
↑
|
Micron Technology, Inc.
|
|
↑
|
AbbVie, Inc.
|
|
Top Detractors
|
|
|
↓
|
Broadcom, Inc.
|
|
↓
|
Oracle Corp.
|
|
↓
|
NVIDIA Corp.
|
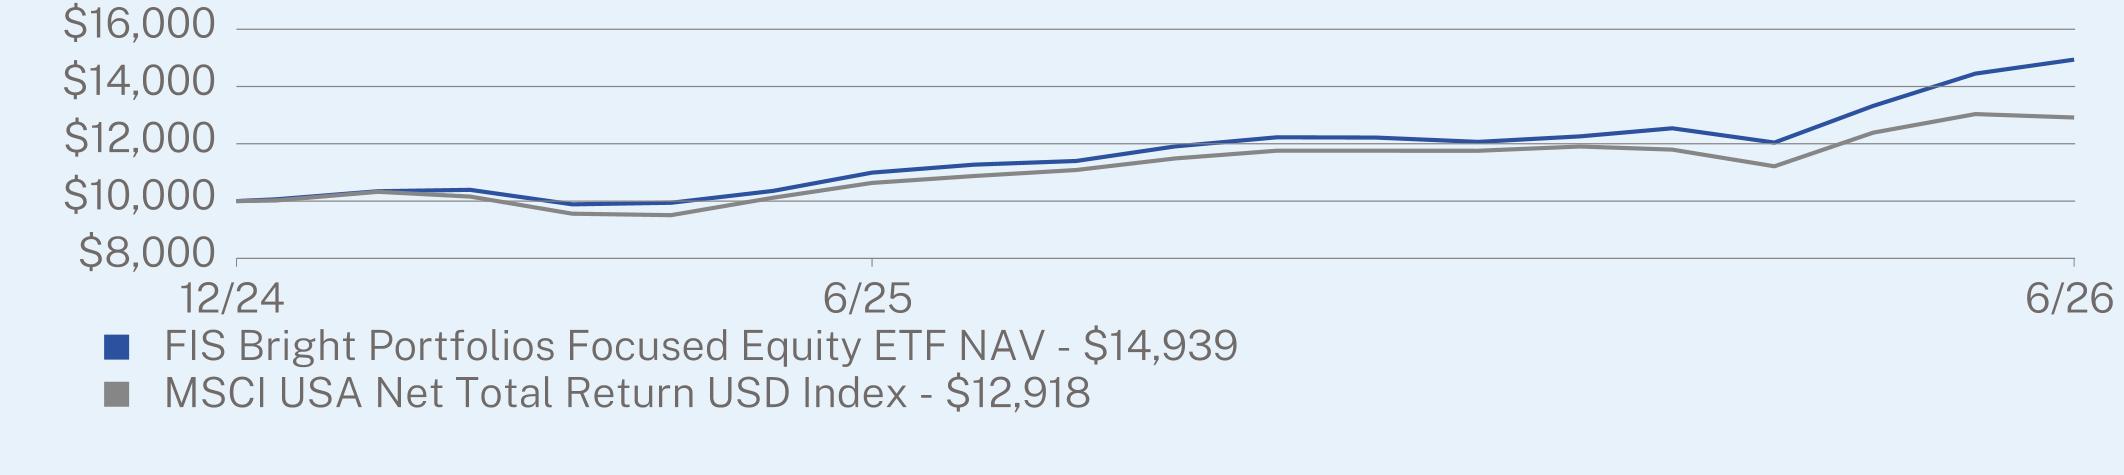
ANNUAL AVERAGE TOTAL RETURN (%)
|
|
06/01/2026 - 06/30/2026
|
1 Year
|
Since Inception
(12/20/2024) |
|
FIS Bright Portfolios Focused Equity ETF NAV
|
3.38
|
35.89
|
30.03
|
|
MSCI USA Net Total Return USD Index
|
-0.92
|
21.46
|
18.23
|
Visit https://faithinvestorservices.com/etfs/brif/ for more recent performance information.
KEY FUND STATISTICS (as of June 30, 2026)
|
Net Assets
|
$154,289,336
|
|
Number of Holdings
|
47
|
|
Net Advisory Fee
|
$79,957
|
|
Portfolio Turnover
|
6%
|
|
30-Day SEC Yield
|
0.37%
|
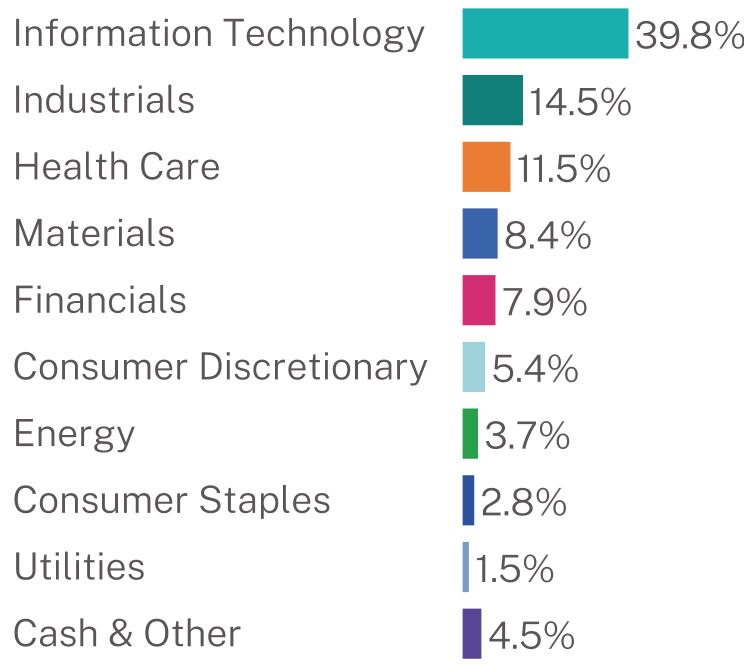
WHAT DID THE FUND INVEST IN? (% of net assets as of June 30, 2026)
Sector Breakdown*
|
Top 10 Issuers
|
||
|
NVIDIA Corp.
|
8.0
|
%
|
|
Broadcom, Inc.
|
5.3
|
%
|
|
Palo Alto Networks, Inc.
|
4.8
|
%
|
|
First American Treasury Obligations Fund
|
4.5
|
%
|
|
Eli Lilly & Co.
|
4.4
|
%
|
|
Dell Technologies, Inc.
|
3.7
|
%
|
|
Cisco Systems, Inc.
|
3.5
|
%
|
|
Arista Networks, Inc.
|
3.4
|
%
|
|
Cummins, Inc.
|
3.4
|
%
|
|
Linde PLC
|
3.1
|
%
|
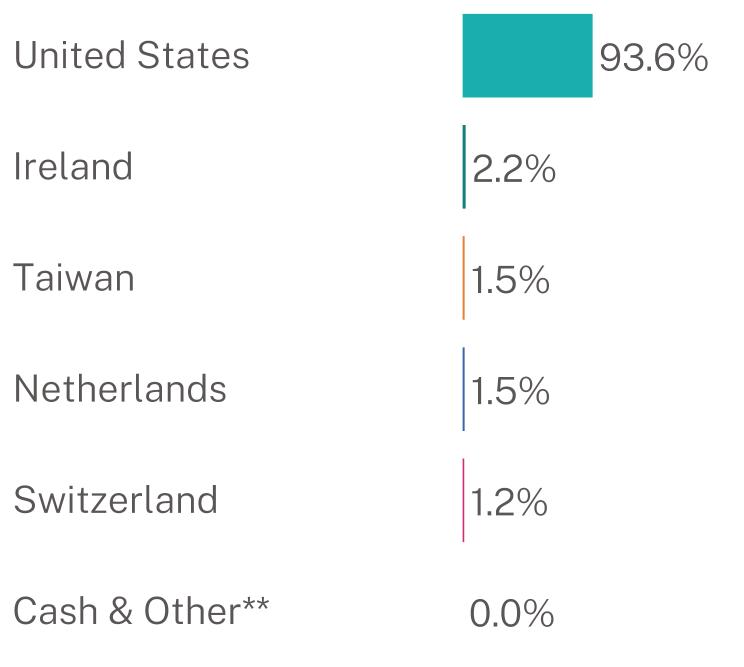
Geographic Breakdown
MATERIAL FUND CHANGES
Changes to the Fund’s Fiscal Year:
At a meeting held on February 18, 2026, the Board approved a change in the Fund’s fiscal year end from May 31 to June 30. As of June 1, 2026, the Fund changed its financial reporting and tax reporting fiscal year end to a June 30 fiscal year end from a May 31 fiscal year end.
This report describes changes to the Fund that occurred during the reporting period.
WHAT WERE THE FUND COSTS FOR THE PERIOD? (based on a hypothetical $10,000 investment)
|
Fund Name
|
Costs of a $10,000 investment*
|
Costs paid as a percentage of a $10,000 investment**
|
|
FIS Christian Stock Fund
|
$6
|
0.68%
|
HOW DID THE FUND PERFORM DURING THE PERIOD AND WHAT AFFECTED ITS PERFORMANCE?
For the period from June 1, 2026 through June 30, 2026, a relatively short period, the Fund generated positive returns of 0.06% for the month. This performance was slightly above the MSCI WORLD Index return of -0.72%.
Against both benchmarks, security selection played a strong role relative to sector allocation. Relative to MSCI ACWI Index, the sectors with the largest positive contribution were industrials, consumer discretionary, and real estate. The three sectors with the largest negative contribution were financials, health care and consumer staples.
Taiwan Semiconductor Manufacturing Co. Ltd. (“TSMC”) was the largest contributor to returns during June. TSMC is one of the largest semiconductor companies in the world and has been driving shareholder value as the largest semiconductor foundry globally. ASML Holding NV was the second largest contributor to returns which benefited from strong demand for lithography machines used in the semiconductor manufacturing process. Caterpillar, Inc. was the third largest contributor and benefited from healthy demand for construction equipment, based in part on particularly strong data center construction outlook. Comfort Systems USA, Inc. was the fourth largest contributor to returns with growth in its business of supplying HVAC systems to a range of commercial customers including data centers. The fifth largest contributor, United Rentals, Inc. benefited from strong demand related to the company’s construction equipment leasing business.
Broadcom, Inc. (“Broadcom”) was the largest portfolio detractor during June as the shares consolidated strong gains realized during the prior two months. Microsoft was the second largest detractor as investors have remained concerned about artificial intelligence (“AI”) threats to its software business while overlooking the AI benefits associated with Microsoft’s Azure data center opportunities. NVIDIA Corp. was the third largest detractor, which like Broadcom consolidated strong gains realized during April and May. The shares of Intercontinental Exchange, Inc. were weak during the period in part due to concerns related to prediction markets and mortgage origination and refinancing volume in the context of higher interest rates. The shares of Alphabet Inc. were weak during June as the stock also consolidated strong gains realized earlier in the second quarter.
|
Top Contributors
|
|
|
↑
|
Taiwan Semiconductor Manufacturing Co. Ltd.
|
|
↑
|
ASML Holding NV
|
|
↑
|
Caterpillar, Inc.
|
|
↑
|
Comfort Systems USA, Inc.
|
|
↑
|
United Rentals, Inc.
|
|
Top Detractors
|
|
|
↓
|
Broadcom, Inc.
|
|
↓
|
Microsoft Corp.
|
|
↓
|
NVIDIA Corp.
|
|
↓
|
Intercontinental Exchange, Inc.
|
|
↓
|
Alphabet Inc. - Class A
|
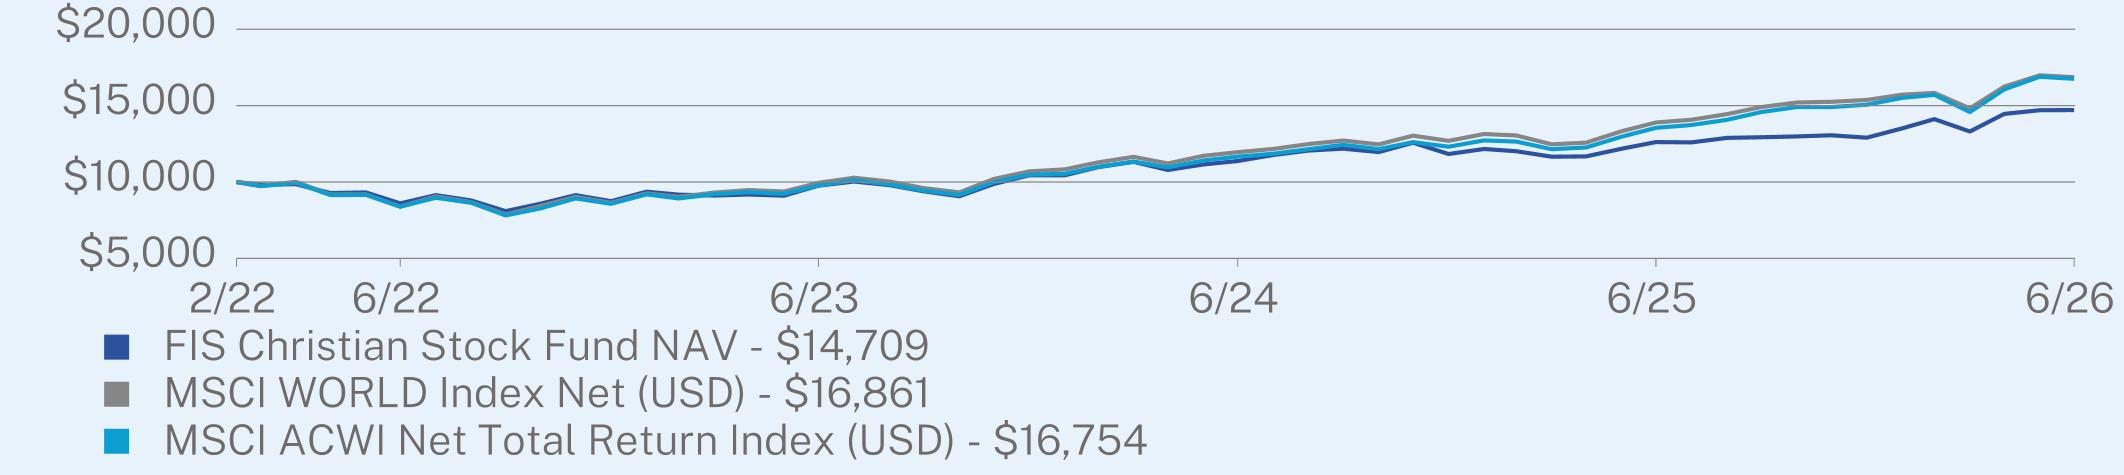
ANNUAL AVERAGE TOTAL RETURN (%)
|
|
06/01/2026 - 6/30/2026
|
1 Year
|
Since Inception
(02/08/2022) |
|
FIS Christian Stock Fund NAV
|
0.06
|
16.62
|
9.18
|
|
MSCI WORLD Index Net (USD)
|
-0.72
|
21.34
|
12.63
|
|
MSCI ACWI Net Total Return Index (USD)
|
-0.80
|
23.67
|
12.47
|
Visit https://faithinvestorservices.com/pray/ for more recent performance information.
KEY FUND STATISTICS (as of June 30, 2026)
|
Net Assets
|
$78,524,081
|
|
Number of Holdings
|
68
|
|
Net Advisory Fee
|
$44,821
|
|
Portfolio Turnover
|
0%
|
|
30-Day SEC Yield
|
0.47%
|
WHAT DID THE FUND INVEST IN? (% of net assets as of June 30, 2026)
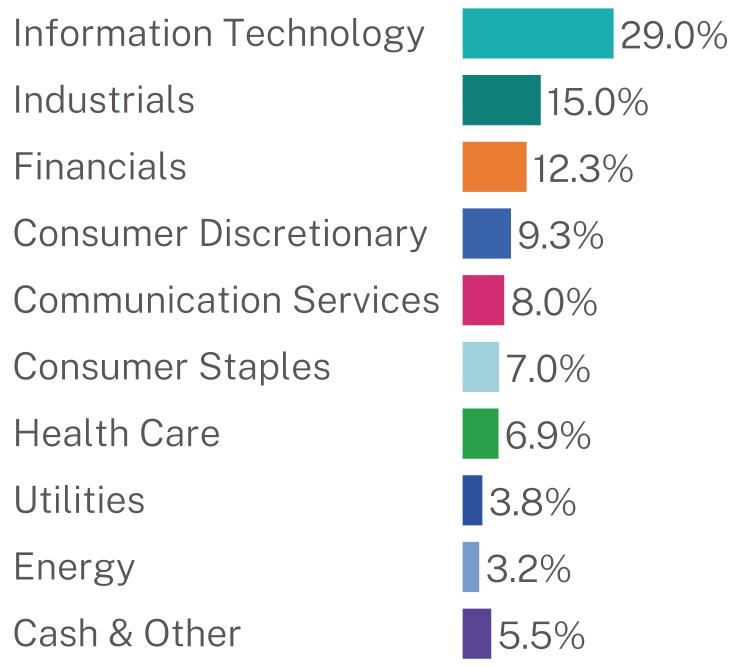
Sector Breakdown*
|
Top 10 Issuers
|
||
|
Samsung Electronics Co. Ltd.
|
7.2
|
%
|
|
NVIDIA Corp.
|
6.1
|
%
|
|
Casey’s General Stores, Inc.
|
4.5
|
%
|
|
Taiwan Semiconductor Manufacturing Co. Ltd.
|
4.2
|
%
|
|
Comfort Systems USA, Inc.
|
3.6
|
%
|
|
Alphabet, Inc.
|
3.2
|
%
|
|
Interactive Brokers Group, Inc.
|
3.2
|
%
|
|
Broadcom, Inc.
|
2.9
|
%
|
|
ASML Holding NV
|
2.5
|
%
|
|
Prosus NV
|
2.3
|
%
|
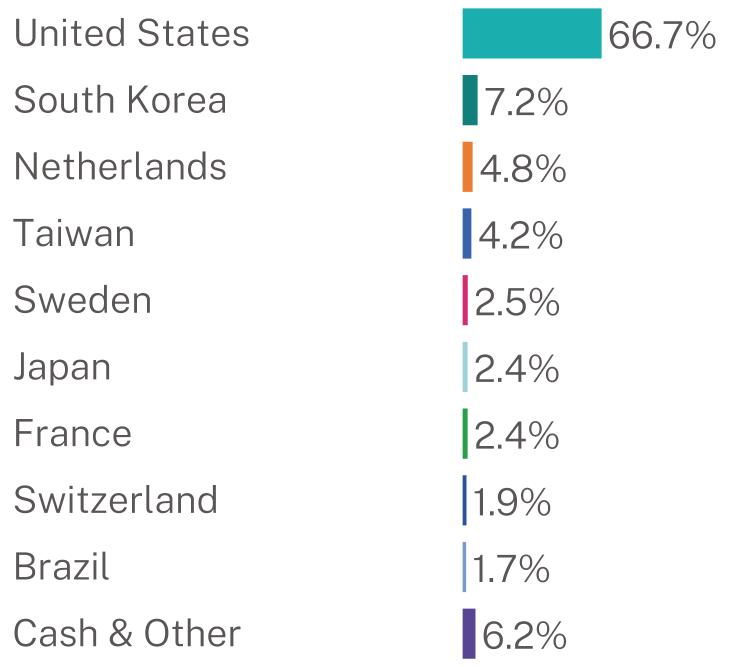
Geographic Breakdown
MATERIAL FUND CHANGES
Changes to the Fund’s Fiscal Year:
At a meeting held on February 18, 2026, the Board approved a change in the Fund’s fiscal year end from May 31 to June 30. As of June 1, 2026, the Fund changed its financial reporting and tax reporting fiscal year end to a June 30 fiscal year end from a May 31 fiscal year end.
WHAT WERE THE FUND COSTS FOR THE PERIOD? (based on a hypothetical $10,000 investment)
|
Fund Name
|
Costs of a $10,000 investment*
|
Costs paid as a percentage of a $10,000 investment**
|
|
FIS Faith Income ETF
|
$19
|
0.65%
|
HOW DID THE FUND PERFORM DURING THE PERIOD AND WHAT AFFECTED ITS PERFORMANCE?
For the period from March 19, 2026 through June 30, 2026, the Fund’s net asset value (“NAV”) return was 2.05% compared to its benchmark index, the Bloomberg U.S. Aggregate Bond Index, which returned 0.58%.
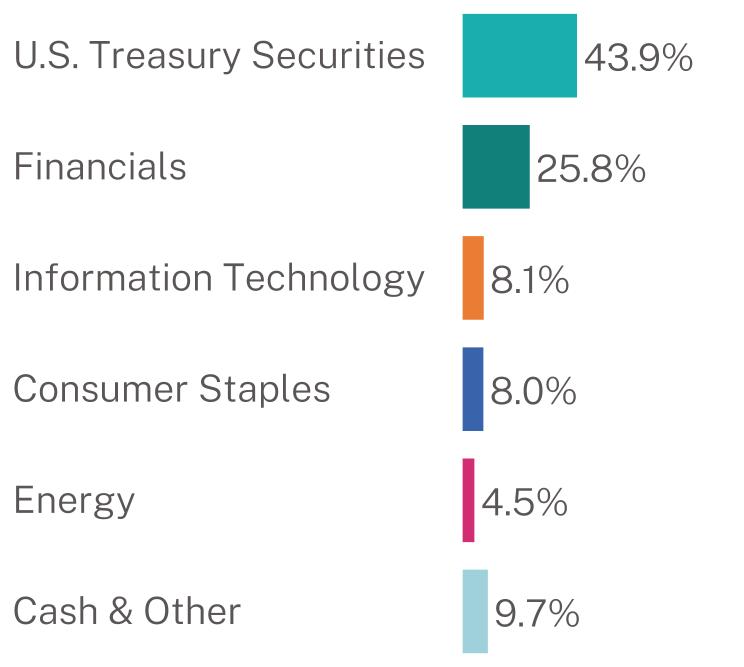
The portfolio focused on investment grade credit, a modestly underweight duration bias, and an overweight to financials issuers (in particular MREITs, BDCs, and insurers). Performance was strong versus the benchmark due to the underweight duration bias and overweight to financials and a convertible bond from a SaaS company.
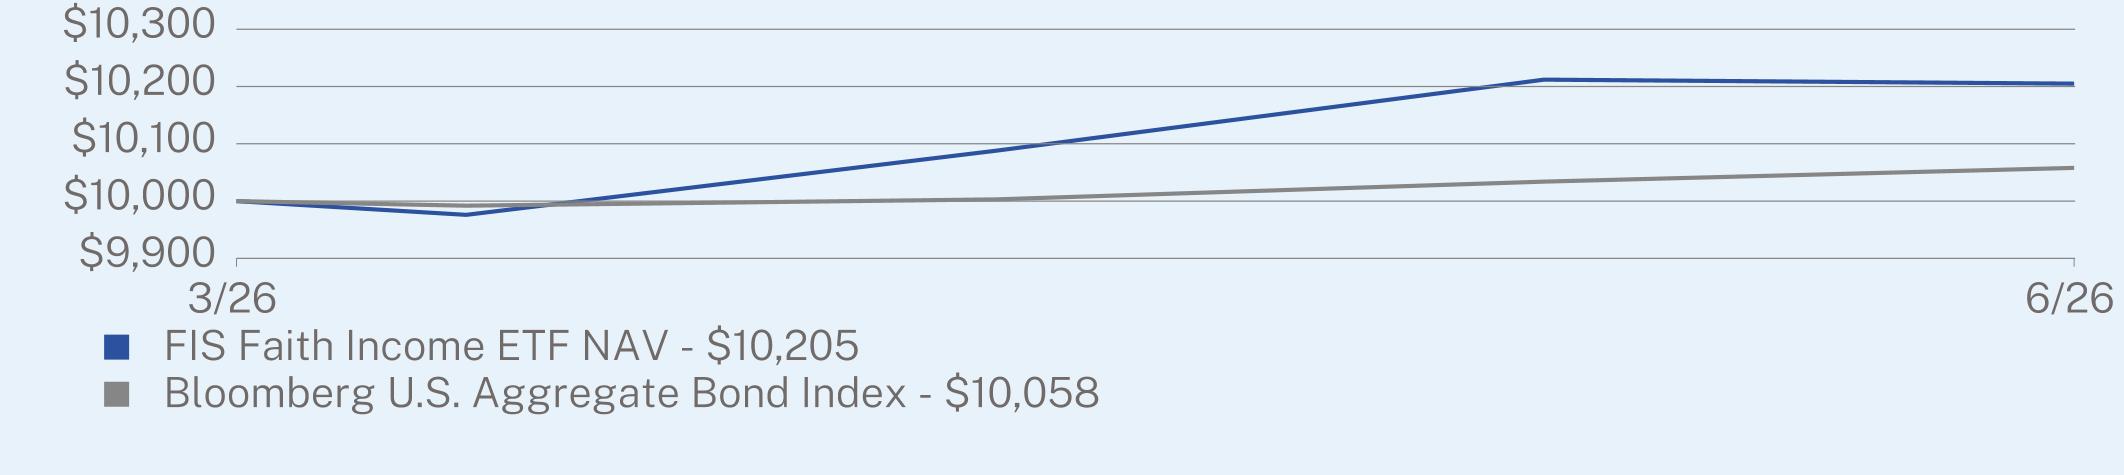
CUMULATIVE TOTAL RETURN (%)
|
|
Since Inception
(03/19/2026) |
|
FIS Faith Income ETF NAV
|
2.05
|
|
Bloomberg U.S. Aggregate Bond Index
|
0.58
|
Visit https://faithinvestorservices.com/etfs/fthb/ for more recent performance information.
KEY FUND STATISTICS (as of June 30, 2026)
|
Net Assets
|
$6,061,157
|
|
Number of Holdings
|
18
|
|
Net Advisory Fee
|
$8,358
|
|
Portfolio Turnover
|
52%
|
|
30-Day SEC Yield
|
4.62%
|
WHAT DID THE FUND INVEST IN? (% of net assets as of June 30, 2026)
Sector Breakdown*
|
Top 10 Issuers
|
||
|
United States Treasury Note/Bond
|
43.9
|
%
|
|
First American Treasury Obligations Fund
|
5.3
|
%
|
|
Rithm Capital Corp.
|
5.0
|
%
|
|
MFA Financial, Inc.
|
4.9
|
%
|
|
Chevron USA, Inc.
|
4.5
|
%
|
|
Apple, Inc.
|
4.5
|
%
|
|
Nissan Motor Acceptance Co. LLC
|
4.4
|
%
|
|
Morgan Stanley
|
4.4
|
%
|
|
Walmart, Inc.
|
4.0
|
%
|
|
Coca-Cola Co.
|
4.0
|
%
|
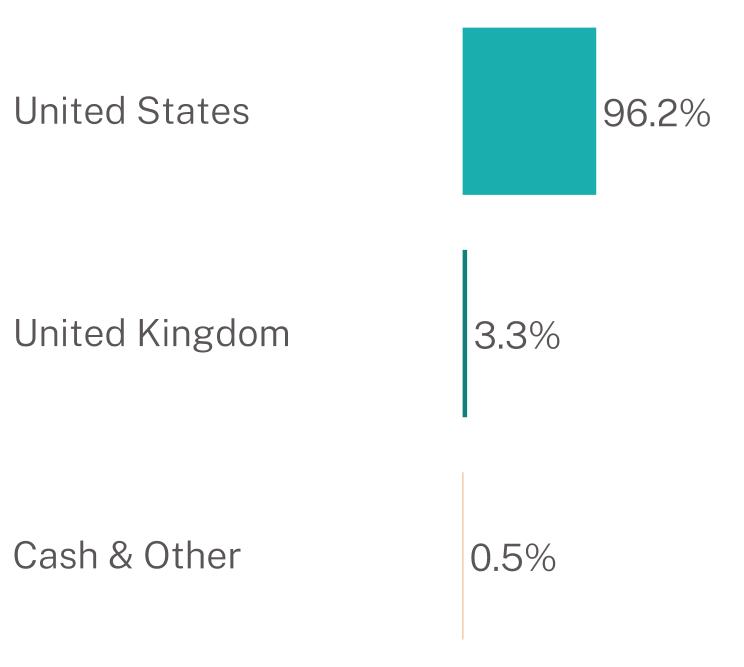
Geographic Breakdown
WHAT WERE THE FUND COSTS FOR THE PERIOD? (based on a hypothetical $10,000 investment)
|
Fund Name
|
Costs of a $10,000 investment*
|
Costs paid as a percentage of a $10,000 investment**
|
|
FIS Tactical Equity ETF
|
$21
|
0.69%
|
HOW DID THE FUND PERFORM DURING THE PERIOD AND WHAT AFFECTED ITS PERFORMANCE?
For the period from fund inception on March 19, 2026 through June 30, 2026 the Fund rose 17.87%. This performance was well above the S&P 500® Total Return Index return of 13.56%.
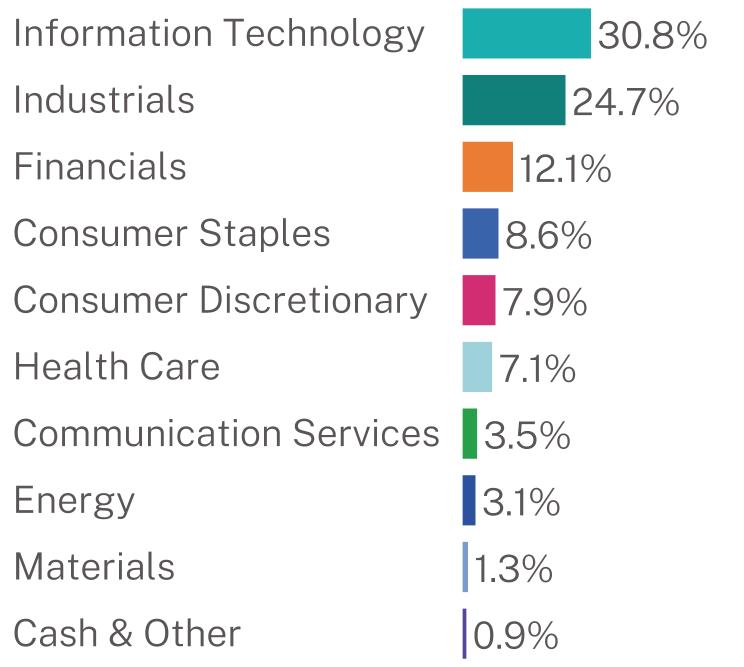
Against the S&P 500® Total Return Index benchmark, security selection drove about 95% of the outperformance with the balance a function of sector allocation. Relative to the S&P 500®, the sectors with the largest positive contribution were industrials, health care and utilities. The three sectors with the largest negative contribution were materials, consumer discretionary and consumer staples.
Amkor Technology, Inc. drove the largest contribution during the period on the back of a June partnership announcement with TSMC plus customer wins with AMD and Nvidia. Bloom Energy Corp. delivered strong performance as power demand from AI-driven data centers accelerated the adoption of its fuel cell solutions. Carpenter Technology Corp. performed well on strong demand within commercial aerospace and defense markets from both OEMS and aftermarket parts and services all played a role in improved investor views of the shares. The shares of KLA Corp. performed well on a strong outlook for the semiconductor advanced packaging and inspection business segments. Monolithic Power Systems, Inc. outpaced the broader market primarily due to surging demand for its high-performance power management integrated circuits used in artificial intelligence servers and cloud data center infrastructure.
InterDigital, Inc. saw the weakest investment performance during the period on the back of revenue volatility inherent to its patent licensing model and market anxiety around the timing of major handset contract renewals. TIM SA faced headwinds in 2Q26 after macro pressures—including foreign exchange volatility in the Brazilian Real and elevated domestic interest rates—weighed on Brazilian equities. Ubiquiti, Inc. experienced share price weakness as sequential revenue growth cooled and quarterly financial results fell short of expectations. Although year-over-year metrics appeared solid, high input cost volatility—particularly memory chip surcharges implemented across its networking hardware line—raised demand elasticity and gross margin concerns. EQT Corp.’s financial results were impacted by a sequential drop in natural gas prices following peak winter demand. The compression in margins also reflected losses on natural gas hedging positions. Jack Henry & Associates, Inc. faced headwinds as regional banks and credit unions curtailed software IT spending.
|
Top Contributors
|
|
|
↑
|
Amkor Technology, Inc.
|
|
↑
|
Bloom Energy Corp. - Class A
|
|
↑
|
Carpenter Technology Corp.
|
|
↑
|
KLA Corp.
|
|
↑
|
Monolithic Power Systems, Inc.
|
|
Top Detractors
|
|
|
↓
|
InterDigital, Inc.
|
|
↓
|
TIM SA
|
|
↓
|
Ubiquiti, Inc.
|
|
↓
|
EQT Corp.
|
|
↓
|
Jack Henry & Associates, Inc.
|
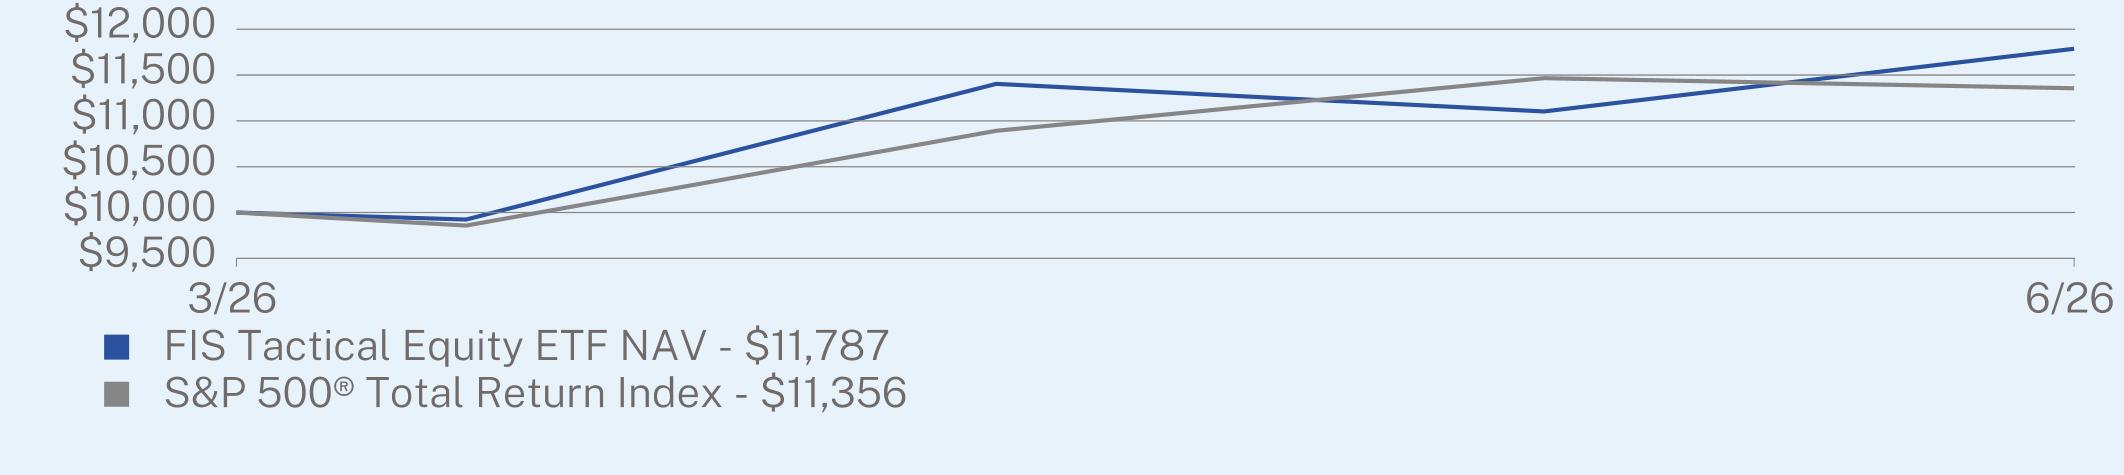
CUMULATIVE TOTAL RETURN (%)
|
|
Since Inception
(03/19/2026) |
|
FIS Tactical Equity ETF NAV
|
17.87
|
|
S&P 500® Total Return Index
|
13.56
|
Visit https://faithinvestorservices.com/etfs/acts/ for more recent performance information.
KEY FUND STATISTICS (as of June 30, 2026)
|
Net Assets
|
$9,592,007
|
|
Number of Holdings
|
35
|
|
Net Advisory Fee
|
$17,889
|
|
Portfolio Turnover
|
0%
|
|
30-Day SEC Yield
|
0.18%
|
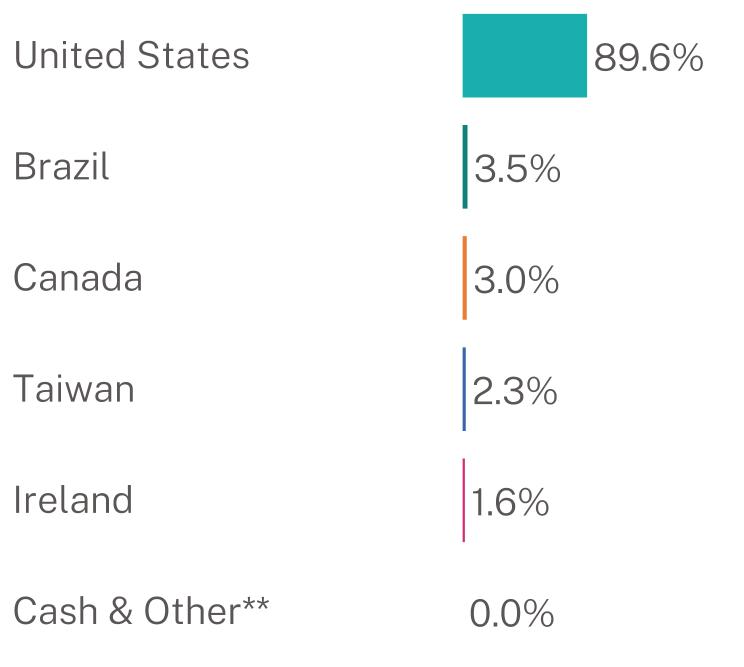
WHAT DID THE FUND INVEST IN? (% of net assets as of June 30, 2026)
Sector Breakdown*
|
Top 10 Issuers
|
||
|
Bloom Energy Corp.
|
6.5
|
%
|
|
Amkor Technology, Inc.
|
6.4
|
%
|
|
Carpenter Technology Corp.
|
5.5
|
%
|
|
VSE Corp.
|
5.0
|
%
|
|
FirstCash Holdings, Inc.
|
4.7
|
%
|
|
Interactive Brokers Group, Inc.
|
4.4
|
%
|
|
Monolithic Power Systems, Inc.
|
4.3
|
%
|
|
Casey’s General Stores, Inc.
|
4.1
|
%
|
|
TIM SA
|
3.5
|
%
|
|
API Group Corp.
|
3.5
|
%
|
Geographic Breakdown
| [1] |
|
||
| [2] |
|
||
| [3] |
|
||
| [4] |
|
||
| [5] |
|
||
| [6] |
|
||
| [7] |
|
||
| [8] |
|
||
| [9] |
|
||
| [10] |
|
||
| [11] |
|
||
| [12] |
|
||
| [13] |
|
||
| [14] |
|
||
| [15] |
|
||
| [16] |
|
||
| [17] |
|
||
| [18] |
|
||
| [19] |
|
||
| [20] |
|