What were the Fund costs for last year?
(Based on a hypothetical $10,000 investment)
| Fund Name | Cost of a $10,000 investment | Costs paid as a percentage of a $10,000 investment |
| SAUFX | $41 | 0.40% |
How did the Fund perform last year and what affected its performance?
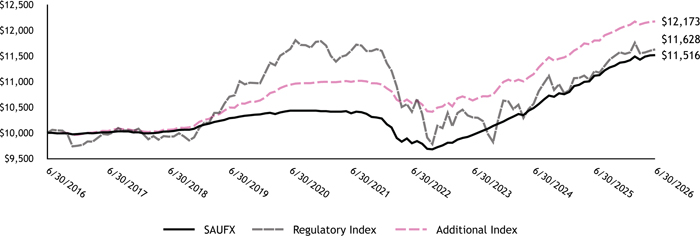
Investment performance of the Fund is judged against the performance of certain market indexes. For this Fund, performance is compared to a broad-based securities market index (the “Regulatory Index”) known as the Morningstar® US Core Bond IndexSM, which is composed of U.S. dollar-denominated investment grade bonds and is designed to be representative of the U.S. bond market overall. The Fund’s performance is also compared to an additional index (the “Additional Index”) known as the Morningstar® US 1-3 Year Composite Government and Corporate Bond IndexSM, which is designed to measure the performance of U.S. dollar-denominated government and corporate bonds with maturities between one and three years. The Additional Index is closer in scope to the universe of securities that could be chosen within the Fund. The market indexes are unmanaged and do not involve fees and expenses like the Fund.
For the fiscal year ended June 30, 2026, the Fund had a net return of 3.62%, compared to a return of 3.15% for the Fund’s Additional Index. The Fund outperformed the Additional Index by 0.47% after deducting the Fund’s net operating expenses for the year. The outperformance of the Fund relative to its Additional Index was due to the Fund's overweight position in securities at the shortest end of the yield curve, where returns across the fiscal year were stronger.
Fund Performance
The following line chart and table are intended to help you understand the risks of investing in the Fund. The chart shows the growth of $10,000 over the past ten years. The table shows the total return for the selected time periods for the SA Fund as well as for the Regulatory Index and for the Additional Index.
| Average Annual Total Returns | |||
| 1 Year | 5 Years | 10 Years | |
| SAUFX | 3.62% | 2.09% | 1.42% |
| Regulatory Index | 3.81% | 0.04% | 1.52% |
| Additional Index | 3.15% | 2.06% | 1.99% |
| Key Fund Statistics | |
| Total Net Assets | $447,417,805 |
| # of Portfolio Holdings | 141 |
| Portfolio Turnover Rate | 51% |
| Total Advisory Fees Paid | $588,408 |
What did the Fund invest in?
Portfolio Composition (As a % of long-term investments) | |
| Corporate Bonds and Notes | 56.1% |
| U.S. Government & Agency Obligations | 30.0 |
| Yankee Corporate Bonds and Notes | 13.9 |
What were the Fund costs for last year?
(Based on a hypothetical $10,000 investment)
| Fund Name | Cost of a $10,000 investment | Costs paid as a percentage of a $10,000 investment |
| SAXIX | $53 | 0.52% |
How did the Fund perform last year and what affected its performance?
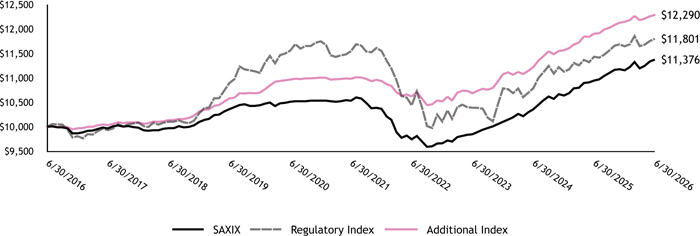
Investment performance of the Fund is judged against the performance of certain market indexes. For this Fund, performance is compared to a broad-based securities market index (the “Regulatory Index”) known as the Morningstar® Global Core Bond Hedged IndexSM, which is composed of investment grade bonds and is designed to be representative of the global bond market overall. The Fund’s performance is also compared to an additional index (the “Additional Index”) known as the Morningstar® Global 1-5 Year Treasury Bond Hedged IndexSM, which is designed to measure the performance of global investment grade government bonds with maturities between one and five years. The Additional Index is closer in scope to the universe of securities that could be chosen within the Fund. The market indexes are unmanaged and do not involve fees and expenses like the Fund.
For the fiscal year ended June 30, 2026, the Fund had a net return of 3.93%, compared to a return of 3.22% for the Fund’s Additional Index. The Fund outperformed the Additional Index for the fiscal year by 0.71%, after deducting the Fund’s net operating expenses for the year. The outperformance was primarily due to the Fund's overweight exposure (relative to the Additional Index) in higher grade bonds.
Fund Performance
The following line chart and table are intended to help you understand the risks of investing in the Fund. The chart shows the growth of $10,000 over the past ten years. The table shows the total return for the selected time periods for the SA Fund as well as for the Regulatory Index and for the Additional Index.
| Average Annual Total Returns | ||||
| 1 Year | 5 Years | 10 Years | ||
| SAXIX | 3.93% | 1.55% | 1.30% | |
| Regulatory Index | 3.21% | 0.43% | 1.67% | |
| Additional Index | 3.22% | 2.28% | 2.08% | |
| Key Fund Statistics | |
| Total Net Assets | $547,800,313 |
| # of Portfolio Holdings | 135 |
| Portfolio Turnover Rate | 32% |
| Total Advisory Fees Paid | $1,363,757 |
What did the Fund invest in?
| Portfolio Composition | |
| (As a % of long-term investments) | |
| Sovereign Bonds and Notes | 45.7% |
| Corporate Bonds and Notes | 33.8 |
| U.S. Government & Agency Obligations | 20.5 |
| Top Ten Largest Countries | |
| (As a % of long-term investments) | |
| United States | 36.3% |
| Canada | 20.0 |
| Supranational | 12.9 |
| Australia | 7.6 |
| New Zealand | 5.5 |
| Finland | 3.7 |
| France | 2.9 |
| Denmark | 2.7 |
| Netherlands | 2.2 |
| Others | 6.2 |
What were the Fund costs for last year?
(Based on a hypothetical $10,000 investment)
| Fund Name | Cost of a $10,000 investment | Costs paid as a percentage of a $10,000 investment |
| SAMKX | $73 | 0.66% |
How did the Fund perform last year and what affected its performance?
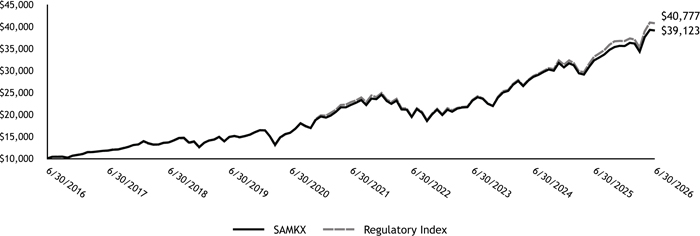
Investment performance of the Fund is judged against the performance of a broad-based securities market index. For this Fund, performance is compared to the Morningstar® US Market Extended IndexSM (the "Regulatory Index"), which is composed of large, mid, and small cap U.S. stocks. The Regulatory Index is unmanaged and does not involve fees and expenses like the Fund.
For the fiscal year ended June 30, 2026, the Fund had a net return of 21.06% compared to a return of 23.02% for the Fund’s Regulatory Index. The Fund underperformed the Regulatory Index during the fiscal year by 1.96%, after deducting the Fund’s net operating expenses for the year. During the fiscal year the Fund held a larger position than the Regulatory Index in stocks of companies with higher levels of operating profitability ("high profitability stocks") while also holding a smaller position than the Regulatory Index in stocks of companies with lower levels of operating profitability ("low profitability stocks"). However, during the fiscal year, the returns of low profitability stocks were stronger than the returns of higher profitability stocks, hence the Fund's lower exposure to low profitability stocks contributed to the underperformance of the Fund relative to its Regulatory Index.
Fund Performance
The following line chart and table are intended to help you understand the risks of investing in the Fund. The chart shows the growth of $10,000 over the past ten years. The table shows the total return for the selected time periods for the SA Fund as well as for the Regulatory Index.
| Average Annual Total Returns | |||
| 1 Year | 5 Years | 10 Years | |
| SAMKX | 21.06% | 12.00% | 14.62% |
| Regulatory Index | 23.02% | 12.31% | 15.09% |
| Key Fund Statistics | |
| Total Net Assets | $746,046,200 |
| # of Portfolio Holdings | 827 |
| Portfolio Turnover Rate | 1% |
| Total Advisory Fees Paid | $2,805,532 |
What did the Fund invest in?
| Top Ten Largest Sectors | ||
| (As a % of long-term investments) | ||
| Information Technology | 33.6% | |
| Financials | 15.4 | |
| Communication Services | 9.8 | |
| Health Care | 9.6 | |
| Industrials | 9.6 | |
| Consumer Discretionary | 9.4 | |
| Consumer Staples | 5.5 | |
| Utilities | 2.7 | |
| Energy | 2.6 | |
| Materials | 1.7 | |
What were the Fund costs for last year?
(Based on a hypothetical $10,000 investment)
| Fund Name | Cost of a $10,000 investment | Costs paid as a percentage of a $10,000 investment |
| SABTX | $86 | 0.74% |
How did the Fund perform last year and what affected its performance?
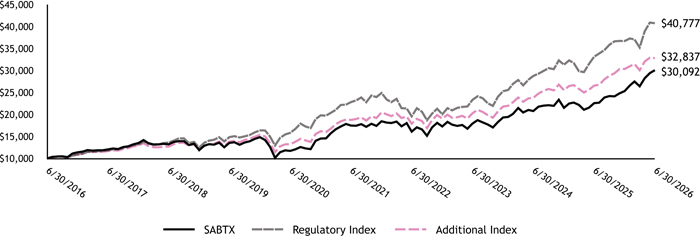
Investment performance of the Fund is judged against the performance of certain market indexes. For this Fund, performance is compared to a broad-based securities market index (the “Regulatory Index”) known as the Morningstar® US Market Extended IndexSM, which is composed of large, mid, and small cap U.S. stocks. The Fund’s performance is also compared to an additional index (the “Additional Index”) known as the Morningstar® US Large-Mid Cap Broad Value IndexSM, which is designed to measure the performance of value stocks within the large and mid-capitalization segment of the U.S. stock market. The Additional Index is closer in scope to the universe of securities that could be chosen within the Fund. The market indexes are unmanaged and do not involve fees and expenses like the Fund.
For the fiscal year ended June 30, 2026, the Fund had a net return of 33.24%, compared to a return of 23.55% for the Fund’s Additional Index. The Fund outperformed this Additional Index during the fiscal year by 9.69%, after deducting the Fund’s net operating expenses for the year. During the fiscal year the Fund held larger positions than the Additional Index in the stocks of companies whose ratio of price-to-book-value was below the average level of stocks and the Fund held smaller positions than the Additional Index in the stocks of companies whose ratio of price-to-book-value was above the average level of stocks. This positioning - in particular the decision to avoid larger positions in stocks with higher levels of price-to-book-value - helped the Fund outperform the Additional Index, since the stocks with higher price-to-book-value ratios tended to underperform the market during the fiscal year.
Fund Performance
The following line chart and table are intended to help you understand the risks of investing in the Fund. The chart shows the growth of $10,000 over the past ten years. The table shows the total return for the selected time periods for the SA Fund as well as for the Regulatory Index and for the Additional Index.
| Average Annual Total Returns | |||
| 1 Year | 5 Years | 10 Years | |
| SABTX | 33.24% | 11.46% | 11.65% |
| Regulatory Index | 23.02% | 12.31% | 15.09% |
| Additional Index | 23.55% | 11.83% | 12.63% |
| Key Fund Statistics | |
| Total Net Assets | $636,861,543 |
| # of Portfolio Holdings | 266 |
| Portfolio Turnover Rate | 14% |
| Total Advisory Fees Paid | $2,301,736 |
What did the Fund invest in?
Top Ten Largest Sectors (As a % of long-term investments) | |
| Financials | 22.5% |
| Information Technology | 16.4 |
| Health Care | 14.7 |
| Industrials | 13.0 |
| Energy | 10.3 |
| Consumer Discretionary | 7.1 |
| Materials | 6.2 |
| Communication Services | 5.2 |
| Consumer Staples | 4.1 |
| Real Estate | 0.5 |
What were the Fund costs for last year?
(Based on a hypothetical $10,000 investment)
| Fund Name | Cost of a $10,000 investment | Costs paid as a percentage of a $10,000 investment |
| SAUMX | $103 | 0.89% |
How did the Fund perform last year and what affected its performance?
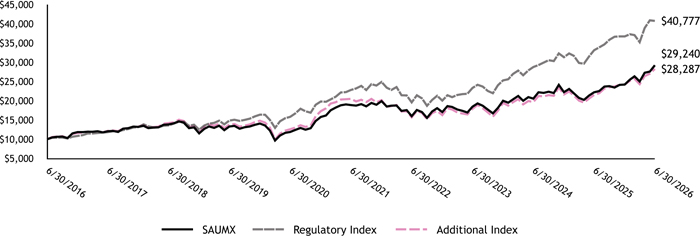
Investment performance of the Fund is judged against the performance of certain market indexes. For this Fund, performance is compared to a broad-based securities market index (the “Regulatory Index”) known as the Morningstar® US Market Extended IndexSM, which is composed of large, mid, and small cap U.S. stocks. The Fund’s performance is also compared to an additional index (the “Additional Index”) known as the Morningstar® US Small Cap Extended Market IndexSM, which is designed to measure the performance of small cap stocks within the U.S. stock market. The Additional Index is closer in scope to the universe of securities that could be chosen within the Fund. The market indexes are unmanaged and do not involve fees and expenses like the Fund.
For the fiscal year ended June 30, 2026, the Fund had a net return of 31.62%, compared to a return of 31.35% for the Fund’s Additional Index. The Fund outperformed this Additional Index during the fiscal year by 0.27% after deducting the Fund’s net operating expenses for the year. The Fund’s outperformance relative to the Additional Index over the fiscal year was the result of three factors relating to the Fund's portfolio: first, the Fund's greater holdings of mid-cap stocks than the Additional Index; second, the Fund's greater holding of the smallest stocks than the Additional Index; and third, the Fund's exclusion of real estate securities. Both mid-cap stocks and the smallest capitalization stocks performed strongly during the fiscal year, benefiting the Fund's overweight position in those security types. Real estate securities during the fiscal year had weak performance, which also benefited the Fund by virtue of the Fund's exclusion of real estate securities during the fiscal year.
Fund Performance
The following line chart and table are intended to help you understand the risks of investing in the Fund. The chart shows the growth of $10,000 over the past ten years. The table shows the total return for the selected time periods for the SA Fund as well as for the Regulatory Index and for the Additional Index.
| Average Annual Total Returns | |||
| 1 Year | 5 Years | 10 Years | |
| SAUMX | 31.62% | 9.13% | 11.33% |
| Regulatory Index | 23.02% | 12.31% | 15.09% |
| Additional Index | 31.35% | 6.64% | 10.96% |
| Key Fund Statistics | |
| Total Net Assets | $358,060,549 |
| # of Portfolio Holdings | 1,559 |
| Portfolio Turnover Rate | 14% |
| Total Advisory Fees Paid | $1,279,590 |
| What did the Fund invest in? | ||
| Top Ten Largest Sectors | ||
| (As a % of long-term investments) | ||
| Industrials | 22.6% | |
| Financials | 21.3 | |
| Information Technology | 14.0 | |
| Consumer Discretionary | 13.1 | |
| Health Care | 10.6 | |
| Materials | 4.5 | |
| Energy | 4.4 | |
| Consumer Staples | 4.1 | |
| Utilities | 2.8 | |
| Communication Services | 1.9 | |
What were the Fund costs for last year?
(Based on a hypothetical $10,000 investment)
| Fund Name | Cost of a $10,000 investment | Costs paid as a percentage of a $10,000 investment |
| SAHMX | $104 | 0.91% |
How did the Fund perform last year and what affected its performance?
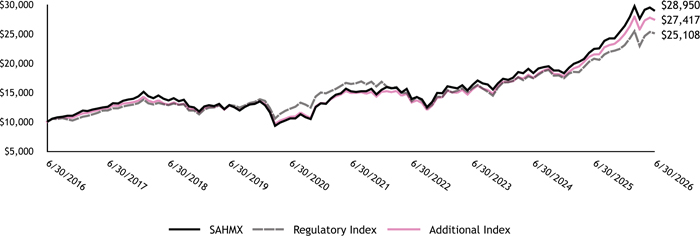
Investment performance of the Fund is judged against the performance of certain market indexes. For this Fund, performance is compared to a broad-based securities market index (the “Regulatory Index”) known as the Morningstar® Developed Markets ex-US All Cap Target Market Exposure IndexSM, which is composed of large, mid, and small cap stocks trading in international developed markets. The Fund’s performance is also compared to an additional index (the “Additional Index”) known as the Morningstar® Developed Markets ex-US Value Target Market Exposure IndexSM, which is designed to measure the performance of value stocks within the large and mid-capitalization segments of the international developed markets. The Additional Index is closer in scope to the universe of securities that could be chosen within the Fund. The market indexes are unmanaged and do not involve fees and expenses like the Fund.
For the fiscal year ended June 30, 2026, the Fund had a net return of 28.93%, compared to a return of 27.47% for the Fund’s Additional Index. The Fund outperformed the Additional Index during the fiscal year by 1.46% after deducting the Fund’s net operating expenses for the year. During the fiscal year the Fund maintained a larger position than the Additional Index in the stocks of companies whose ratio of price-to-book-value were among the lowest in the Additional Index (known as “deeper value stocks”), while the Fund had less weight than the Additional Index in stocks with higher ratios of price-to-book-value. During the fiscal year, returns on deeper value stocks were stronger, on average, than the returns of the other stocks in the Additional Index with higher ratios of price-to-book-value, hence the Fund's greater allocation to deeper value stocks contributed to the Fund outperforming the Additional Index for the fiscal year.
Fund Performance
The following line chart and table are intended to help you understand the risks of investing in the Fund. The chart shows the growth of $10,000 over the past ten years. The table shows the total return for the selected time periods for the SA Fund as well as for the Regulatory Index and for the Additional Index.
| Average Annual Total Returns | |||
| 1 Year | 5 Years | 10 Years | |
| SAHMX | 28.93% | 13.73% | 11.22% |
| Regulatory Index | 20.85% | 8.80% | 9.64% |
| Additional Index | 27.47% | 12.92% | 10.61% |
| Key Fund Statistics | |
| Total Net Assets | $620,473,199 |
| # of Portfolio Holdings | 399 |
| Portfolio Turnover Rate | 4% |
| Total Advisory Fees Paid | $2,772,850 |
| What did the Fund invest in? |
| Top Ten Largest Sectors | |
| (As a % of long-term investments) | |
| Financials | 37.8% |
| Energy | 13.7 |
| Materials | 10.9 |
| Consumer Discretionary | 10.0 |
| Industrials | 9.3 |
| Consumer Staples | 5.0 |
| Health Care | 4.5 |
| Communication Services | 3.3 |
| Utilities | 2.5 |
| Real Estate | 1.9 |
| Top Ten Largest Countries | |
| (As a % of long-term investments) | |
| Japan | 22.6% |
| United Kingdom | 11.1 |
| France | 10.7 |
| Canada | 10.6 |
| Switzerland | 8.1 |
| Germany | 7.8 |
| Australia | 6.0 |
| Netherlands | 4.9 |
| Spain | 3.8 |
| Others | 14.4 |
What were the Fund costs for last year?
(Based on a hypothetical $10,000 investment)
| Fund Name | Cost of a $10,000 investment | Costs paid as a percentage of a $10,000 investment |
| SAISX | $57 | 0.52% |
How did the Fund perform last year and what affected its performance?
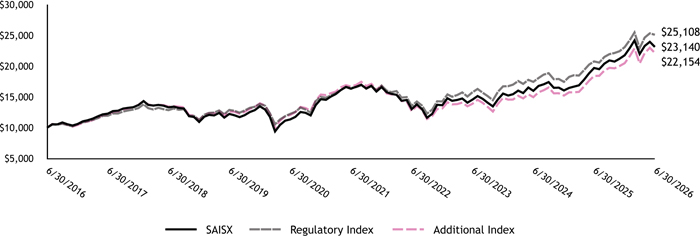
Investment performance of the Fund is judged against the performance of certain market indexes. For this Fund, performance is compared to a broad-based securities market index (the “Regulatory Index”) known as the Morningstar® Developed Markets ex-US All Cap Target Market Exposure IndexSM, which is composed of large, mid, and small cap stocks trading in international developed markets. The Fund’s performance is also compared to an additional index (the “Additional Index”) known as the Morningstar® Developed Markets ex-US Small Cap Target Market Exposure IndexSM, which is designed to measure the performance of small cap stocks within the international developed markets. The Additional Index is closer in scope to the universe of securities that could be chosen within the Fund. The market indexes are unmanaged and do not involve fees and expenses like the Fund.
For the fiscal year ended June 30, 2026, the Fund had a net return of 17.41%, compared to a return of 20.30% for the Fund’s Additional Index. The Fund underperformed the Additional Index during the fiscal year by 2.89% after deducting the Fund’s net operating expenses for the year. During the fiscal year, the Fund held smaller exposures than the Additional Index in stocks considered to be mid-cap stocks and larger small cap stocks. During the fiscal year, however, such stocks, and especially the mid-cap stocks, performed more strongly than the smaller cap stocks held predominantly by the Fund, hence the Fund underperformed the Additional Index during the fiscal year.
Fund Performance
The following line chart and table are intended to help you understand the risks of investing in the Fund. The chart shows the growth of $10,000 over the past ten years. The table shows the total return for the selected time periods for the SA Fund as well as for the Regulatory Index and for the Additional Index.
| Average Annual Total Returns | |||
| 1 Year | 5 Years | 10 Years | |
| SAISX | 17.41% | 7.21% | 8.75% |
| Regulatory Index | 20.85% | 8.80% | 9.64% |
| Additional Index | 20.30% | 5.82% | 8.28% |
| Key Fund Statistics | |
| Total Net Assets | $281,444,908 |
| # of Portfolio Holdings | 1 |
| Portfolio Turnover Rate | 5% |
| Total Advisory Fees Paid | $705,786 |
What did the Fund invest in?
Largest Holdings (As a % of total investments) | |
| DFA International Small Company Portfolio, Class Institutional * | 100.0% |
| * | The Fund pursues its goal by investing substantially all its assets in the International Small Company Portfolio of DFA Investment Dimensions Group Inc. (the “DFA Portfolio”), a separate registered investment company with the same investment objective and investment policies as the Fund. The DFA Portfolio invests substantially all its assets in the following series of The DFA Investment Trust Company: The Japanese Small Company Series, The United Kingdom Small Company Series, The Continental Small Company Series, The Asia Pacific Small Company Series and The Canadian Small Company Series. Financial statements and other information about the DFA International Small Company Portfolio, including its portfolio holdings, are available at https://www.dimensional.com/usen/funds/dfisx/international-small-company-portfolio-i. |
What were the Fund costs for last year?
(Based on a hypothetical $10,000 investment)
| Fund Name | Cost of a $10,000 investment | Costs paid as a percentage of a $10,000 investment |
| SAEMX | $124 | 1.04% |
How did the Fund perform last year and what affected its performance?
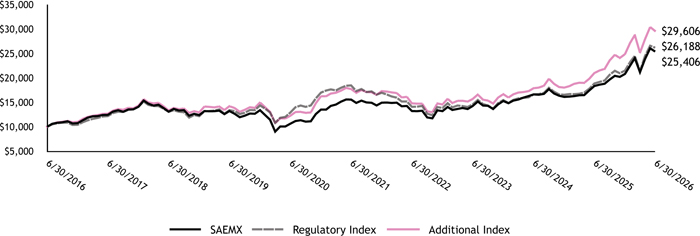
Investment performance of the Fund is judged against the performance of certain market indexes. For this Fund, performance is compared to a broad-based securities market index (the “Regulatory Index”) known as the Morningstar® Emerging Markets All Cap Target Market Exposure IndexSM, which is composed of large, mid, and small cap stocks trading in emerging markets. The Fund’s performance is also compared to an additional index (the “Additional Index”) known as the Morningstar® Emerging Markets Value Target Market Exposure IndexSM, which is designed to measure the performance of value stocks within the large and mid-capitalization segment of the emerging markets. The Additional Index is closer in scope to the universe of securities that could be chosen within the Fund. The market indexes are unmanaged and do not involve fees and expenses like the Fund.
For the fiscal year ended June 30, 2026, the Fund had a net return of 38.50%, compared to a return of 40.98% for the Fund’s Additional Index. The Fund underperformed the Additional Index during the fiscal year by 2.48% after deducting the Fund’s net operating expenses for the year. Across the fiscal year the Fund maintained a larger position than that of the Additional Index in the stocks of companies whose ratio of price-to-book-value were among the lowest in the Additional Index (known as “deeper value stocks”), while the Fund maintained a smaller position than that of the Additional Index in those value stocks with higher ratios of price-to-book-value. During the fiscal year, returns on value stocks with higher price-to-book-value in the Additional Index were strong, hence the Fund's lower allocation to those stocks contributed to the Fund’s underperformance relative to the Additional Index.
Fund Performance
The following line chart and table are intended to help you understand the risks of investing in the Fund. The chart shows the growth of $10,000 over the past ten years. The table shows the total return for the selected time periods for the SA Fund as well as for the Regulatory Index and for the Additional Index.
| Average Annual Total Returns | |||
| 1 Year | 5 Years | 10 Years | |
| SAEMX | 38.50% | 10.29% | 9.77% |
| Regulatory Index | 38.85% | 7.23% | 10.11% |
| Additional Index | 40.98% | 10.80% | 11.46% |
Key Fund Statistics | |
| Total Net Assets | $246,329,102 |
| # of Portfolio Holdings | 1,778 |
| Portfolio Turnover Rate | 10% |
| Total Advisory Fees Paid | $421,189 |
What did the Fund invest in?
| Top
Ten Largest Sectors (As a % of long-term investments) |
|
| Information Technology | 32.4% |
| Financials | 24.4 |
| Consumer Discretionary | 8.9 |
| Materials | 8.5 |
| Industrials | 8.5 |
| Energy | 7.4 |
| Communication Services | 2.7 |
| Health Care | 2.2 |
| Consumer Staples | 2.0 |
| Real Estate | 1.9 |
|
Top Ten Largest Countries (As a % of long-term investments) | |
| Taiwan | 32.6% |
| China | 20.2 |
| Korea | 18.1 |
| India | 13.4 |
| South Africa | 3.1 |
| Brazil | 2.8 |
| Mexico | 1.6 |
| Malaysia | 1.2 |
| Poland | 1.2 |
| Others | 5.8 |
What were the Fund costs for last year?
(Based on a hypothetical $10,000 investment)
| Fund Name | Cost of a $10,000 investment | Costs paid as a percentage of a $10,000 investment |
| SAREX | $81 | 0.76% |
How did the Fund perform last year and what affected its performance?
Investment performance of the Fund is judged against the performance of certain market indexes. For this Fund, performance is compared to a broad-based securities market index (the “Regulatory Index”) known as the Morningstar® US Market Extended IndexSM, which is composed of large, mid, and small cap U.S. stocks. The Fund’s performance is also compared to an additional index (the “Additional Index”) known as the Morningstar® US REIT IndexSM, which is designed to measure the performance of real estate stocks within the U.S. stock market. The Additional Index is closer in scope to the universe of securities that could be chosen within the Fund. The market indexes are unmanaged and do not involve fees and expenses like the Fund.
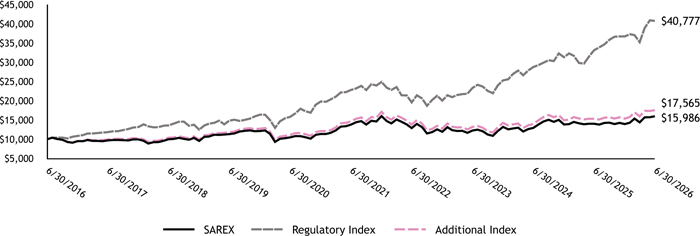
For the fiscal year ended June 30, 2026, the Fund had a net return of 13.93%, compared to a return of 14.74% for the Fund’s Additional Index. The Fund underperformed the Additional Index during the fiscal year by 0.81% after deducting the Fund’s net operating expenses for the year. Most of the Fund's underperformance to the Additional Index during the fiscal year was due to the fact that the Fund charges operating expenses while the Additional Index does not. Prior to the deduction of the Fund's operating expenses, the Fund's performance was slightly ahead of that of the Additional Index. Once the Fund's operating expenses were taken into consideration, however, the Fund underperformed the Additional Index.
Fund Performance
The following line chart and table are intended to help you understand the risks of investing in the Fund. The chart shows the growth of $10,000 over the past ten years. The table shows the total return for the selected time periods for the SA Fund as well as for the Regulatory Index and for the Additional Index.
| Average Annual Total Returns | |||
| 1 Year | 5 Years | 10 Years | |
| SAREX | 13.93% | 2.98% | 4.80% |
| Regulatory Index | 23.02% | 12.31% | 15.09% |
| Additional Index | 14.74% | 3.67% | 5.80% |
| Key Fund Statistics | |
| Total Net Assets | $127,045,767 |
| # of Portfolio Holdings | 123 |
| Portfolio Turnover Rate | 9% |
| Total Advisory Fees Paid | $287,286 |
What did the Fund invest in?
Largest Industry Holdings (As a % of long-term investments) | |
| Specialized REITs | 33.2% |
| Retail REITs | 18.1 |
| Health Care REITs | 16.9 |
| Residential REITs | 12.9 |
| Industrial REITs | 10.2 |
| Hotel & Resort REITs | 3.3 |
| Office REITs | 3.1 |
| Diversified REITs | 2.3 |
What were the Fund costs for last year?
(Based on a hypothetical $10,000 investment)
| Fund Name | Cost of a $10,000 investment | Costs paid as a percentage of a $10,000 investment |
| SAWMX | $0* | 0.00%* |
| * | Focus Advisor Solutions, LLC (the "Adviser") has contractually agreed to waive fees and/or reimburse expenses to the Fund (excluding interest, taxes, brokerage commissions, acquired fund fees and expenses and extraordinary expenses), as further described in the Fund's prospectus. Shareholders would have paid $78, or 0.71% when considering the acquired fund fees and expenses. |
How did the Fund perform last year and what affected its performance?
Investment performance of the Fund is judged against the performance of certain market indexes. For this Fund, performance is compared to a broad-based securities market index (the “Regulatory Index”) known as the Morningstar® Global Markets IndexSM, which is composed of large, mid, and small cap stocks and is designed to be representative of the global stock market overall. The Fund’s performance is also compared to an additional index (the “Additional Index”) known as the Morningstar® US Moderate Target Allocation IndexSM, which is designed to measure the performance of a portfolio holding 60% global stocks and 40% global bonds. The Additional Index is closer in scope to the universe of securities that could be chosen within the Fund. The market indexes are unmanaged and do not involve fees and expenses like the Fund.
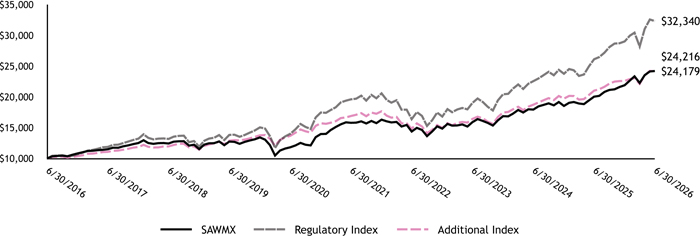
For the fiscal year ended June 30, 2026, the Fund had a net return of 20.79%, compared to a return of 15.00% for the Fund’s Additional Index. The Fund outperformed the Additional Index for the fiscal year by 5.79%. Since the Fund invests exclusively in shares of the SA Fund family (the “Underlying Funds”), the performance of the Fund relative to the Additional Index is driven primarily by the performance of each of the Underlying Funds against the Fund's Additional Index. For the fiscal year, five of the eight Underlying Funds contributed positively to relative performance, notably the SA U.S. Value Fund and the SA International Value Fund. Three of the eight underlying funds contributed negatively to relative performance for the fiscal year, most notably the SA U.S. Core Market Fund and the SA Global Fixed Income Fund.
Fund Performance
The following line chart and table are intended to help you understand the risks of investing in the Fund. The chart shows the growth of $10,000 over the past ten years. The table shows the total return for the selected time periods for the SA Fund as well as for the Regulatory Index and for the Additional Index.
| Average Annual Total Returns | |||
| 1 Year | 5 Years | 10 Years | |
| SAWMX | 20.79% | 8.91% | 9.25% |
| Regulatory Index | 23.78% | 10.51% | 12.45% |
| Additional Index | 15.00% | 7.42% | 9.23% |
| Key Fund Statistics | |
| Total Net Assets | $23,519,162 |
| # of Portfolio Holdings | 8 |
| Portfolio Turnover Rate | 11% |
| Total Advisory Fees Paid | $0 |
What did the Fund invest in?
Largest Holdings (As a % of total investments) | |
| SA International Value Fund | 19.8% |
| SA U.S. Value Fund | 17.0 |
| SA U.S. Core Market Fund | 16.9 |
| SA Global Fixed Income Fund | 14.9 |
| SA U.S. Fixed Income Fund | 14.8 |
| SA U.S. Small Company Fund | 6.9 |
| SA Emerging Markets Value Fund | 6.7 |
| SA Real Estate Securities Fund | 3.0 |
| [1] | Focus Advisor Solutions, LLC (the "Adviser") has contractually agreed to waive fees and/or reimburse expenses to the Fund (excluding interest, taxes, brokerage commissions, acquired fund fees and expenses and extraordinary expenses), as further described in the Fund's prospectus. Shareholders would have paid $78, or 0.71% when considering the acquired fund fees and expenses. |