Shareholder Report
|
12 Months Ended |
|
Jun. 30, 2026
USD ($)
Holding
|
|---|
| Shareholder Report [Line Items] |
|
| Document Type |
N-CSR
|
| Amendment Flag |
false
|
| Registrant Name |
Victory Portfolios
|
| Entity Central Index Key |
0000802716
|
| Entity Investment Company Type |
N-1A
|
| Document Period End Date |
Jun. 30, 2026
|
| Shareholder Report Annual or Semi-Annual |
annual shareholder report
|
| C000145004 |
|
| Shareholder Report [Line Items] |
|
| Fund Name |
Victory Integrity Discovery Fund
|
| Class Name |
Class A
|
| Trading Symbol |
MMEAX
|
| Annual or Semi-Annual Statement [Text Block] |
Annual Shareholder Report
|
| Additional Information [Text Block] |
You can find additional information about the Fund at advisor.vcm.com/literature/mutual-fund-prospectuses. You may also request more information by calling 800-539-3863 or visiting vcm.com/contact-us.
|
| Additional Information Phone Number |
800-539-3863
|
| Additional Information Website |
vcm.com
|
| Expenses [Text Block] |
What were the Fund's costs for the last year?(based on a hypothetical $10,000 investment) Table SummaryClass Name | Costs of a $10,000 Investment | Costs paid as a percentage of a $10,000 Investment |
|---|
Class A | $198 | 1.55% |
|---|
| | |
|---|
|
| Expenses Paid, Amount |
$ 198
|
| Expense Ratio, Percent |
1.55%
|
| Factors Affecting Performance [Text Block] |
What affected the Fund’s performance during the last year?For the fiscal year ended June 30, 2026, the Fund outperformed its benchmark, the Russell Microcap® Value Index (the “Index”). Over the last 12 months, U.S. equity market reactions to the Federal Reserve’s interest rate policy, all things related to AI, and geopolitical turmoil were large headline factors. Equities continued to make all-time highs in the second half of 2025 on the heels of earnings momentum and continued signs of runway for the AI secular growth theme. 2025 came to a close with muted results in December driven by a late-month rotation out of AI/technology stocks, profit taking, and uncertainty on the pace of future Federal Reserve interest rate cuts in 2026. As the calendar turned to 2026, the first quarter of the year was defined by a sharp transition from early-year momentum to late-quarter volatility, primarily driven by a significant geopolitical shock and shifting interest rate expectations. After starting the year with modest gains in January, major indices sold off in March as conflict in the Middle East sparked a massive spike in oil prices, reigniting inflation fears. U.S. equity markets saw a powerful 2026 second quarter advance fueled by robust momentum in AI-related technology sectors, strong corporate earnings, and easing geopolitical concerns surrounding the U.S.-Iran conflict. While the early gains were led by large-cap growth, the rally ultimately broadened to include value and small-cap benchmarks. For the one-year period ending June 30, 2026, microcap value stocks outperformed microcap growth stocks. Top contributors to performance: From an Index perspective, health care and information technology were the top-performing sectors. Stock selection in information technology and financials sectors were the largest positive contributors to the Fund’s performance. From a style perspective, the Fund’s holdings on average had a higher market capitalization relative to the benchmark and this was a tailwind.
Top detractors from performance: From an Index perspective, utilities and consumer staples sectors were the worst-performing sectors. Security selection within health care and materials weighed most heavily on the Fund’s relative performance. Sector allocation detracted from the Fund’s performance relative to the Index, largely attributable to the underweight position in health care. From a style perspective, the Fund’s holdings on average had lower volatility relative to the Index and this was a headwind.
|
| Performance Past Does Not Indicate Future [Text] |
The investment return and principal value will fluctuate so that an investor's shares, when redeemed, may be worth more or less than the original cost. Past performance is not a good predictor of the Fund's future performance.
|
| Line Graph [Table Text Block] |
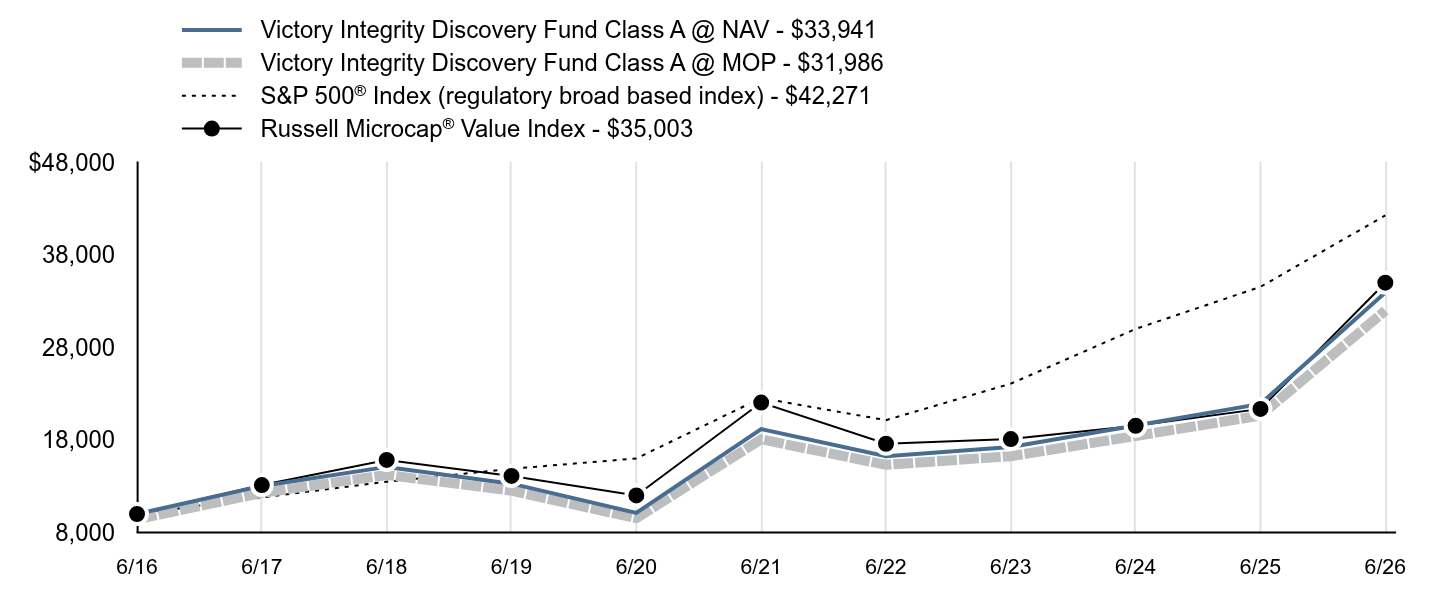
Table Summary | Victory Integrity Discovery Fund Class A @ NAV - $33,941 | Victory Integrity Discovery Fund Class A @ MOP - $31,986 | S&P 500® Index (regulatory broad based index) - $42,271 | Russell Microcap® Value Index - $35,003 |
|---|
6/16 | $10,000 | $9,424 | $10,000 | $10,000 |
|---|
6/17 | $13,036 | $12,285 | $11,790 | $13,126 |
|---|
6/18 | $15,091 | $14,221 | $13,484 | $15,843 |
|---|
6/19 | $13,278 | $12,513 | $14,889 | $14,114 |
|---|
6/20 | $10,121 | $9,538 | $16,006 | $12,006 |
|---|
6/21 | $19,181 | $18,075 | $22,536 | $22,045 |
|---|
6/22 | $16,252 | $15,315 | $20,144 | $17,594 |
|---|
6/23 | $17,244 | $16,251 | $24,091 | $18,097 |
|---|
6/24 | $19,561 | $18,434 | $30,006 | $19,538 |
|---|
6/25 | $21,906 | $20,644 | $34,556 | $21,359 |
|---|
6/26 | $33,941 | $31,986 | $42,271 | $35,003 |
|---|
|
| Average Annual Return [Table Text Block] |
Table Summary | 1 Year | 5 Year | 10 Year |
|---|
Class A @ NAV | 54.94%Footnote Reference | 12.09% | 13.00% |
|---|
Class A @ MOP | 46.02% | 10.77% | 12.33% |
|---|
S&P 500® Index | 22.32% | 13.41% | 15.51% |
|---|
Russell Microcap® Value Index | 63.88% | 9.69% | 13.35% |
|---|
|
| No Deduction of Taxes [Text Block] |
The graph and table total returns do not reflect the deduction of taxes that a shareholder would pay on Fund distributions, or redemption of shares.
|
| Previous Investment Adviser [Text Block] |
The maximum offering price (“MOP”) figures reflect a maximum sales charge of 5.75% for Class A. The Net Asset Value ("NAV") figures do not reflect sales charges.
|
| AssetsNet |
$ 91,665,000
|
| Holdings Count | Holding |
135
|
| Advisory Fees Paid, Amount |
$ 685,000
|
| InvestmentCompanyPortfolioTurnover |
61.00%
|
| Additional Fund Statistics [Text Block] |
FUND STATISTICS($ amounts in 000s)(as of June 30, 2026)Table SummaryNet Assets | $91,665 |
|---|
Number of Holdings | 135 |
|---|
Investment Advisory Fees | $685 |
|---|
Portfolio Turnover | 61% |
|---|
|
| Holdings [Text Block] |
Top SectorsFootnote Reference* (% of Net Assets)Footnote Reference(as of June 30, 2026)Table SummaryValue | Value |
|---|
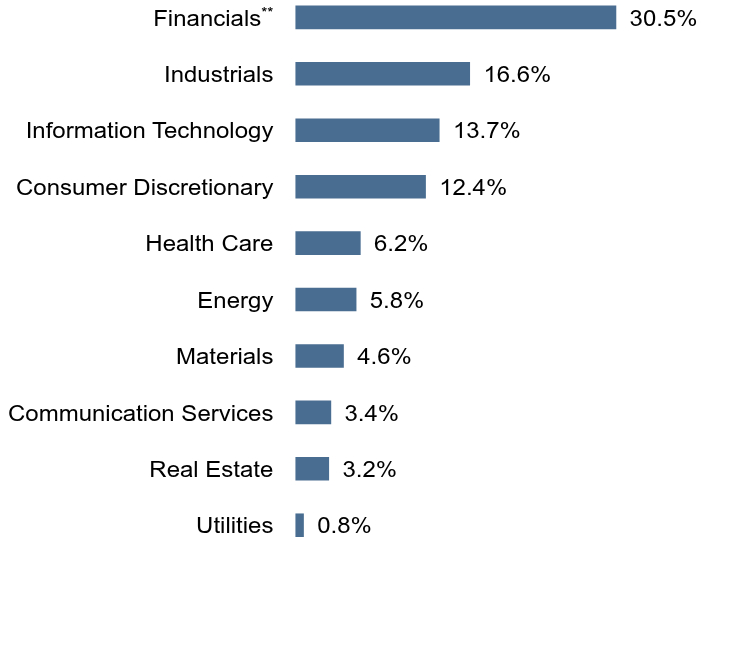
Utilities | 0.8% | Real Estate | 3.2% | Communication Services | 3.4% | Materials | 4.6% | Energy | 5.8% | Health Care | 6.2% | Consumer Discretionary | 12.4% | Information Technology | 13.7% | Industrials | 16.6% | FinancialsFootnote Reference** | 30.5% | Top 10 HoldingsFootnote Reference* (% of Net Assets)Footnote Reference(as of June 30, 2026)Table SummaryLindblad Expeditions Holdings, Inc. | 1.3% |
|---|
Vishay Precision Group, Inc. | 1.2% |
|---|
Horizon Bancorp, Inc. | 1.1% |
|---|
Peoples Bancorp, Inc. | 1.1% |
|---|
HealthStream, Inc. | 1.1% |
|---|
The Marcus Corp. | 1.0% |
|---|
Interface, Inc., Class A | 1.0% |
|---|
Quanex Building Products Corp. | 1.0% |
|---|
Chiron Real Estate, Inc. | 1.0% |
|---|
First Mid Bancshares, Inc. | 1.0% |
|---|
|
| C000145005 |
|
| Shareholder Report [Line Items] |
|
| Fund Name |
Victory Integrity Discovery Fund
|
| Class Name |
Class C
|
| Trading Symbol |
MMECX
|
| Annual or Semi-Annual Statement [Text Block] |
Annual Shareholder Report
|
| Additional Information [Text Block] |
You can find additional information about the Fund at advisor.vcm.com/literature/mutual-fund-prospectuses. You may also request more information by calling 800-539-3863 or visiting vcm.com/contact-us.
|
| Additional Information Phone Number |
800-539-3863
|
| Additional Information Website |
vcm.com
|
| Expenses [Text Block] |
What were the Fund's costs for the last year?(based on a hypothetical $10,000 investment) Table SummaryClass Name | Costs of a $10,000 Investment | Costs paid as a percentage of a $10,000 Investment |
|---|
Class C | $311 | 2.45% |
|---|
| | |
|---|
|
| Expenses Paid, Amount |
$ 311
|
| Expense Ratio, Percent |
2.45%
|
| Factors Affecting Performance [Text Block] |
What affected the Fund’s performance during the last year?For the fiscal year ended June 30, 2026, the Fund outperformed its benchmark, the Russell Microcap® Value Index (the “Index”). Over the last 12 months, U.S. equity market reactions to the Federal Reserve’s interest rate policy, all things related to AI, and geopolitical turmoil were large headline factors. Equities continued to make all-time highs in the second half of 2025 on the heels of earnings momentum and continued signs of runway for the AI secular growth theme. 2025 came to a close with muted results in December driven by a late-month rotation out of AI/technology stocks, profit taking, and uncertainty on the pace of future Federal Reserve interest rate cuts in 2026. As the calendar turned to 2026, the first quarter of the year was defined by a sharp transition from early-year momentum to late-quarter volatility, primarily driven by a significant geopolitical shock and shifting interest rate expectations. After starting the year with modest gains in January, major indices sold off in March as conflict in the Middle East sparked a massive spike in oil prices, reigniting inflation fears. U.S. equity markets saw a powerful 2026 second quarter advance fueled by robust momentum in AI-related technology sectors, strong corporate earnings, and easing geopolitical concerns surrounding the U.S.-Iran conflict. While the early gains were led by large-cap growth, the rally ultimately broadened to include value and small-cap benchmarks. For the one-year period ending June 30, 2026, microcap value stocks outperformed microcap growth stocks. Top contributors to performance: From an Index perspective, health care and information technology were the top-performing sectors. Stock selection in information technology and financials sectors were the largest positive contributors to the Fund’s performance. From a style perspective, the Fund’s holdings on average had a higher market capitalization relative to the benchmark and this was a tailwind.
Top detractors from performance: From an Index perspective, utilities and consumer staples sectors were the worst-performing sectors. Security selection within health care and materials weighed most heavily on the Fund’s relative performance. Sector allocation detracted from the Fund’s performance relative to the Index, largely attributable to the underweight position in health care. From a style perspective, the Fund’s holdings on average had lower volatility relative to the Index and this was a headwind.
|
| Performance Past Does Not Indicate Future [Text] |
The investment return and principal value will fluctuate so that an investor's shares, when redeemed, may be worth more or less than the original cost. Past performance is not a good predictor of the Fund's future performance.
|
| Line Graph [Table Text Block] |
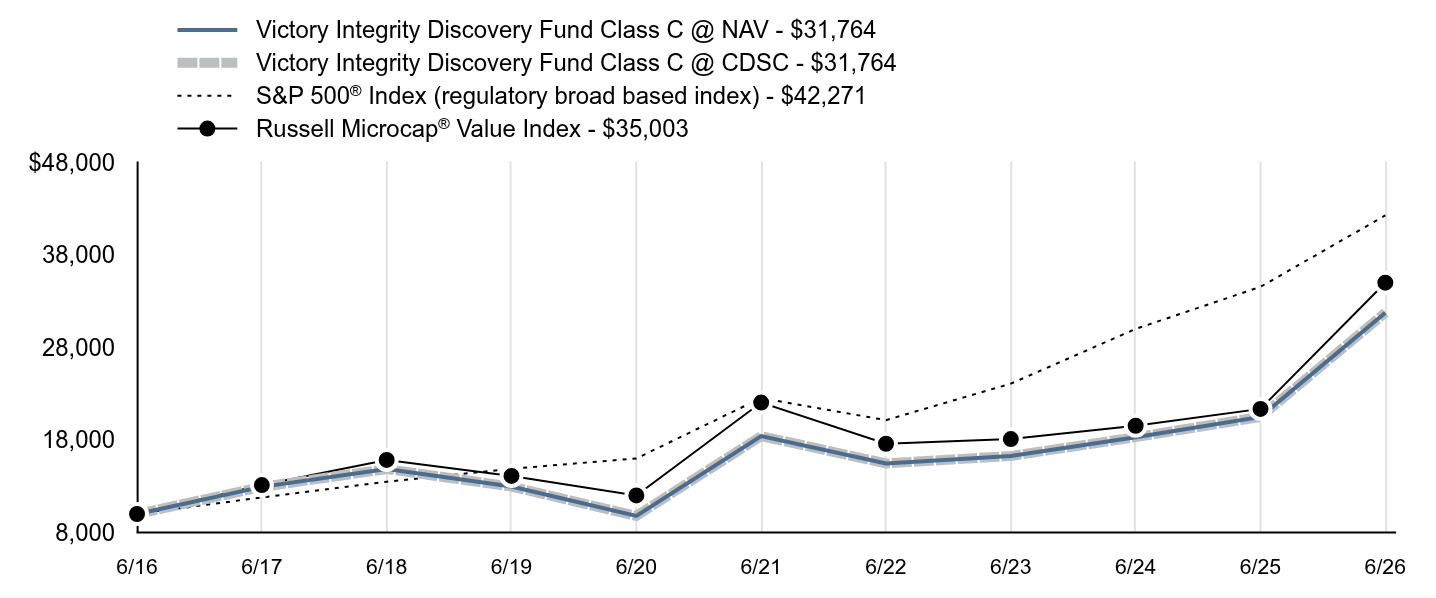
Table Summary | Victory Integrity Discovery Fund Class C @ NAV - $31,764 | Victory Integrity Discovery Fund Class C @ CDSC - $31,764 | S&P 500® Index (regulatory broad based index) - $42,271 | Russell Microcap® Value Index - $35,003 |
|---|
6/16 | $10,000 | $10,000 | $10,000 | $10,000 |
|---|
6/17 | $12,933 | $12,933 | $11,790 | $13,126 |
|---|
6/18 | $14,858 | $14,858 | $13,484 | $15,843 |
|---|
6/19 | $12,964 | $12,964 | $14,889 | $14,114 |
|---|
6/20 | $9,799 | $9,799 | $16,006 | $12,006 |
|---|
6/21 | $18,415 | $18,415 | $22,536 | $22,045 |
|---|
6/22 | $15,471 | $15,471 | $20,144 | $17,594 |
|---|
6/23 | $16,271 | $16,271 | $24,091 | $18,097 |
|---|
6/24 | $18,306 | $18,306 | $30,006 | $19,538 |
|---|
6/25 | $20,501 | $20,501 | $34,556 | $21,359 |
|---|
6/26 | $31,764 | $31,764 | $42,271 | $35,003 |
|---|
|
| Average Annual Return [Table Text Block] |
Table Summary | 1 Year | 5 Year | 10 Year |
|---|
Class C @ NAV | 53.56%Footnote Reference | 11.12% | 12.25% |
|---|
Class C @ CDSC | 52.56% | 11.12% | 12.25% |
|---|
S&P 500® Index | 22.32% | 13.41% | 15.51% |
|---|
Russell Microcap® Value Index | 63.88% | 9.69% | 13.35% |
|---|
|
| No Deduction of Taxes [Text Block] |
The graph and table total returns do not reflect the deduction of taxes that a shareholder would pay on Fund distributions, or redemption of shares.
|
| Previous Investment Adviser [Text Block] |
Class C is not subject to an initial sales charge, but is subject to Contingent Deferred Sales Charge (“CDSC”) of 1.00% on shares redeemed within one year of purchase. The Net Asset Value ("NAV") figures do not reflect sales charges.
|
| AssetsNet |
$ 91,665,000
|
| Holdings Count | Holding |
135
|
| Advisory Fees Paid, Amount |
$ 685,000
|
| InvestmentCompanyPortfolioTurnover |
61.00%
|
| Additional Fund Statistics [Text Block] |
FUND STATISTICS($ amounts in 000s)(as of June 30, 2026)Table SummaryNet Assets | $91,665 |
|---|
Number of Holdings | 135 |
|---|
Investment Advisory Fees | $685 |
|---|
Portfolio Turnover | 61% |
|---|
|
| Holdings [Text Block] |
Top SectorsFootnote Reference* (% of Net Assets)Footnote Reference(as of June 30, 2026)Table SummaryValue | Value |
|---|
Utilities | 0.8% | Real Estate | 3.2% | Communication Services | 3.4% | Materials | 4.6% | Energy | 5.8% | Health Care | 6.2% | Consumer Discretionary | 12.4% | Information Technology | 13.7% | Industrials | 16.6% | FinancialsFootnote Reference** | 30.5% | Top 10 HoldingsFootnote Reference* (% of Net Assets)Footnote Reference(as of June 30, 2026)Table SummaryLindblad Expeditions Holdings, Inc. | 1.3% |
|---|
Vishay Precision Group, Inc. | 1.2% |
|---|
Horizon Bancorp, Inc. | 1.1% |
|---|
Peoples Bancorp, Inc. | 1.1% |
|---|
HealthStream, Inc. | 1.1% |
|---|
The Marcus Corp. | 1.0% |
|---|
Interface, Inc., Class A | 1.0% |
|---|
Quanex Building Products Corp. | 1.0% |
|---|
Chiron Real Estate, Inc. | 1.0% |
|---|
First Mid Bancshares, Inc. | 1.0% |
|---|
|
| C000145007 |
|
| Shareholder Report [Line Items] |
|
| Fund Name |
Victory Integrity Discovery Fund
|
| Class Name |
Class Y
|
| Trading Symbol |
MMEYX
|
| Annual or Semi-Annual Statement [Text Block] |
Annual Shareholder Report
|
| Additional Information [Text Block] |
You can find additional information about the Fund at advisor.vcm.com/literature/mutual-fund-prospectuses. You may also request more information by calling 800-539-3863 or visiting vcm.com/contact-us.
|
| Additional Information Phone Number |
800-539-3863
|
| Additional Information Website |
vcm.com
|
| Expenses [Text Block] |
What were the Fund's costs for the last year?(based on a hypothetical $10,000 investment) Table SummaryClass Name | Costs of a $10,000 Investment | Costs paid as a percentage of a $10,000 Investment |
|---|
Class Y | $177 | 1.39% |
|---|
| | |
|---|
|
| Expenses Paid, Amount |
$ 177
|
| Expense Ratio, Percent |
1.39%
|
| Factors Affecting Performance [Text Block] |
What affected the Fund’s performance during the last year?For the fiscal year ended June 30, 2026, the Fund outperformed its benchmark, the Russell Microcap® Value Index (the “Index”). Over the last 12 months, U.S. equity market reactions to the Federal Reserve’s interest rate policy, all things related to AI, and geopolitical turmoil were large headline factors. Equities continued to make all-time highs in the second half of 2025 on the heels of earnings momentum and continued signs of runway for the AI secular growth theme. 2025 came to a close with muted results in December driven by a late-month rotation out of AI/technology stocks, profit taking, and uncertainty on the pace of future Federal Reserve interest rate cuts in 2026. As the calendar turned to 2026, the first quarter of the year was defined by a sharp transition from early-year momentum to late-quarter volatility, primarily driven by a significant geopolitical shock and shifting interest rate expectations. After starting the year with modest gains in January, major indices sold off in March as conflict in the Middle East sparked a massive spike in oil prices, reigniting inflation fears. U.S. equity markets saw a powerful 2026 second quarter advance fueled by robust momentum in AI-related technology sectors, strong corporate earnings, and easing geopolitical concerns surrounding the U.S.-Iran conflict. While the early gains were led by large-cap growth, the rally ultimately broadened to include value and small-cap benchmarks. For the one-year period ending June 30, 2026, microcap value stocks outperformed microcap growth stocks. Top contributors to performance: From an Index perspective, health care and information technology were the top-performing sectors. Stock selection in information technology and financials sectors were the largest positive contributors to the Fund’s performance. From a style perspective, the Fund’s holdings on average had a higher market capitalization relative to the benchmark and this was a tailwind.
Top detractors from performance: From an Index perspective, utilities and consumer staples sectors were the worst-performing sectors. Security selection within health care and materials weighed most heavily on the Fund’s relative performance. Sector allocation detracted from the Fund’s performance relative to the Index, largely attributable to the underweight position in health care. From a style perspective, the Fund’s holdings on average had lower volatility relative to the Index and this was a headwind.
|
| Performance Past Does Not Indicate Future [Text] |
The investment return and principal value will fluctuate so that an investor's shares, when redeemed, may be worth more or less than the original cost. Past performance is not a good predictor of the Fund's future performance.
|
| Line Graph [Table Text Block] |
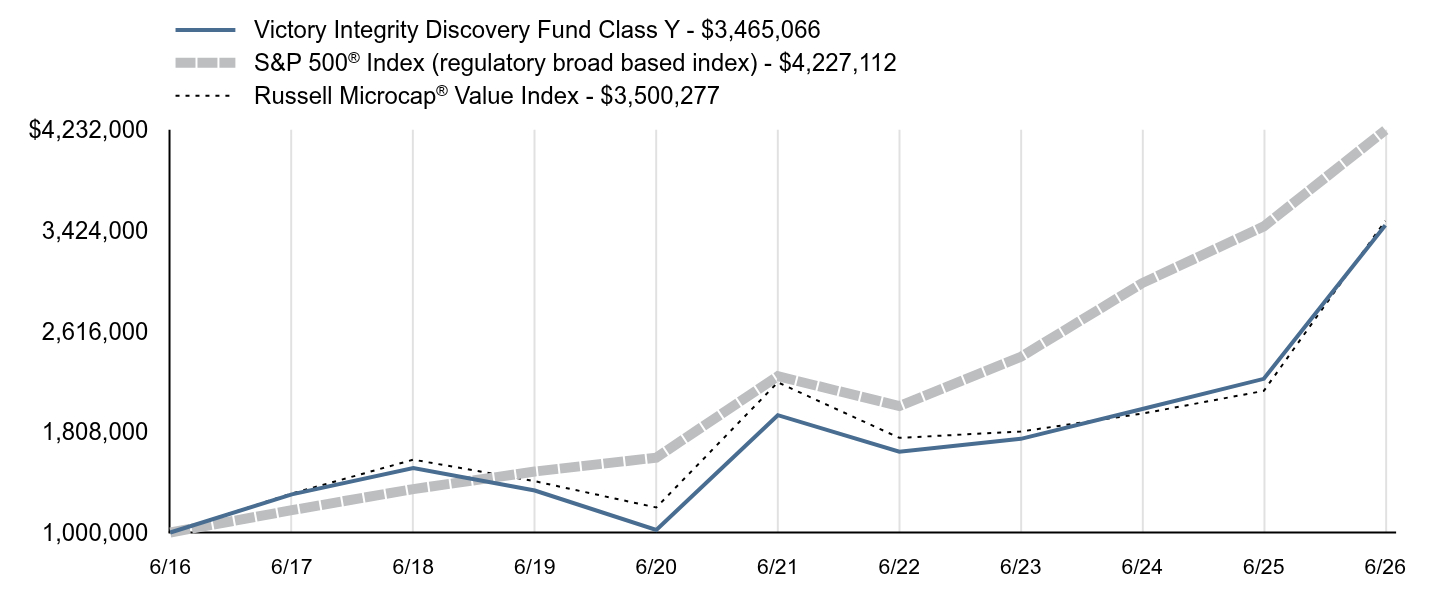
Table Summary | Victory Integrity Discovery Fund Class Y - $3,465,066 | S&P 500® Index (regulatory broad based index) - $4,227,112 | Russell Microcap® Value Index - $3,500,277 |
|---|
6/16 | $1,000,000 | $1,000,000 | $1,000,000 |
|---|
6/17 | $1,306,183 | $1,178,960 | $1,312,624 |
|---|
6/18 | $1,516,174 | $1,348,424 | $1,584,257 |
|---|
6/19 | $1,337,037 | $1,488,895 | $1,411,359 |
|---|
6/20 | $1,020,998 | $1,600,639 | $1,200,619 |
|---|
6/21 | $1,940,815 | $2,253,606 | $2,204,538 |
|---|
6/22 | $1,647,540 | $2,014,367 | $1,759,396 |
|---|
6/23 | $1,751,134 | $2,409,064 | $1,809,731 |
|---|
6/24 | $1,990,447 | $3,000,635 | $1,953,786 |
|---|
6/25 | $2,232,732 | $3,455,641 | $2,135,903 |
|---|
6/26 | $3,465,066 | $4,227,112 | $3,500,277 |
|---|
|
| Average Annual Return [Table Text Block] |
Table Summary | 1 Year | 5 Year | 10 Year |
|---|
Class Y | 55.19%Footnote Reference | 12.29% | 13.23% |
|---|
S&P 500® Index | 22.32% | 13.41% | 15.51% |
|---|
Russell Microcap® Value Index | 63.88% | 9.69% | 13.35% |
|---|
|
| No Deduction of Taxes [Text Block] |
The graph and table total returns do not reflect the deduction of taxes that a shareholder would pay on Fund distributions, or redemption of shares.
|
| AssetsNet |
$ 91,665,000
|
| Holdings Count | Holding |
135
|
| Advisory Fees Paid, Amount |
$ 685,000
|
| InvestmentCompanyPortfolioTurnover |
61.00%
|
| Additional Fund Statistics [Text Block] |
FUND STATISTICS($ amounts in 000s)(as of June 30, 2026)Table SummaryNet Assets | $91,665 |
|---|
Number of Holdings | 135 |
|---|
Investment Advisory Fees | $685 |
|---|
Portfolio Turnover | 61% |
|---|
|
| Holdings [Text Block] |
Top SectorsFootnote Reference* (% of Net Assets)Footnote Reference(as of June 30, 2026)Table SummaryValue | Value |
|---|
Utilities | 0.8% | Real Estate | 3.2% | Communication Services | 3.4% | Materials | 4.6% | Energy | 5.8% | Health Care | 6.2% | Consumer Discretionary | 12.4% | Information Technology | 13.7% | Industrials | 16.6% | FinancialsFootnote Reference** | 30.5% | Top 10 HoldingsFootnote Reference* (% of Net Assets)Footnote Reference(as of June 30, 2026)Table SummaryLindblad Expeditions Holdings, Inc. | 1.3% |
|---|
Vishay Precision Group, Inc. | 1.2% |
|---|
Horizon Bancorp, Inc. | 1.1% |
|---|
Peoples Bancorp, Inc. | 1.1% |
|---|
HealthStream, Inc. | 1.1% |
|---|
The Marcus Corp. | 1.0% |
|---|
Interface, Inc., Class A | 1.0% |
|---|
Quanex Building Products Corp. | 1.0% |
|---|
Chiron Real Estate, Inc. | 1.0% |
|---|
First Mid Bancshares, Inc. | 1.0% |
|---|
|
| C000219865 |
|
| Shareholder Report [Line Items] |
|
| Fund Name |
Victory Integrity Discovery Fund
|
| Class Name |
Member Class
|
| Trading Symbol |
MMMMX
|
| Annual or Semi-Annual Statement [Text Block] |
Annual Shareholder Report
|
| Additional Information [Text Block] |
You can find additional information about the Fund at advisor.vcm.com/literature/mutual-fund-prospectuses. You may also request more information by calling 800-235-8396 or visiting vcm.com/contact-us.
|
| Additional Information Phone Number |
800-235-8396
|
| Additional Information Website |
vcm.com
|
| Expenses [Text Block] |
What were the Fund's costs for the last year?(based on a hypothetical $10,000 investment) Table SummaryClass Name | Costs of a $10,000 Investment | Costs paid as a percentage of a $10,000 Investment |
|---|
Member Class | $191 | 1.50% |
|---|
| | |
|---|
|
| Expenses Paid, Amount |
$ 191
|
| Expense Ratio, Percent |
1.50%
|
| Factors Affecting Performance [Text Block] |
What affected the Fund’s performance during the last year?For the fiscal year ended June 30, 2026, the Fund outperformed its benchmark, the Russell Microcap® Value Index (the “Index”). Over the last 12 months, U.S. equity market reactions to the Federal Reserve’s interest rate policy, all things related to AI, and geopolitical turmoil were large headline factors. Equities continued to make all-time highs in the second half of 2025 on the heels of earnings momentum and continued signs of runway for the AI secular growth theme. 2025 came to a close with muted results in December driven by a late-month rotation out of AI/technology stocks, profit taking, and uncertainty on the pace of future Federal Reserve interest rate cuts in 2026. As the calendar turned to 2026, the first quarter of the year was defined by a sharp transition from early-year momentum to late-quarter volatility, primarily driven by a significant geopolitical shock and shifting interest rate expectations. After starting the year with modest gains in January, major indices sold off in March as conflict in the Middle East sparked a massive spike in oil prices, reigniting inflation fears. U.S. equity markets saw a powerful 2026 second quarter advance fueled by robust momentum in AI-related technology sectors, strong corporate earnings, and easing geopolitical concerns surrounding the U.S.-Iran conflict. While the early gains were led by large-cap growth, the rally ultimately broadened to include value and small-cap benchmarks. For the one-year period ending June 30, 2026, microcap value stocks outperformed microcap growth stocks. Top contributors to performance: From an Index perspective, health care and information technology were the top-performing sectors. Stock selection in information technology and financials sectors were the largest positive contributors to the Fund’s performance. From a style perspective, the Fund’s holdings on average had a higher market capitalization relative to the benchmark and this was a tailwind.
Top detractors from performance: From an Index perspective, utilities and consumer staples sectors were the worst-performing sectors. Security selection within health care and materials weighed most heavily on the Fund’s relative performance. Sector allocation detracted from the Fund’s performance relative to the Index, largely attributable to the underweight position in health care. From a style perspective, the Fund’s holdings on average had lower volatility relative to the Index and this was a headwind.
|
| Performance Past Does Not Indicate Future [Text] |
The investment return and principal value will fluctuate so that an investor's shares, when redeemed, may be worth more or less than the original cost. Past performance is not a good predictor of the Fund's future performance.
|
| Line Graph [Table Text Block] |
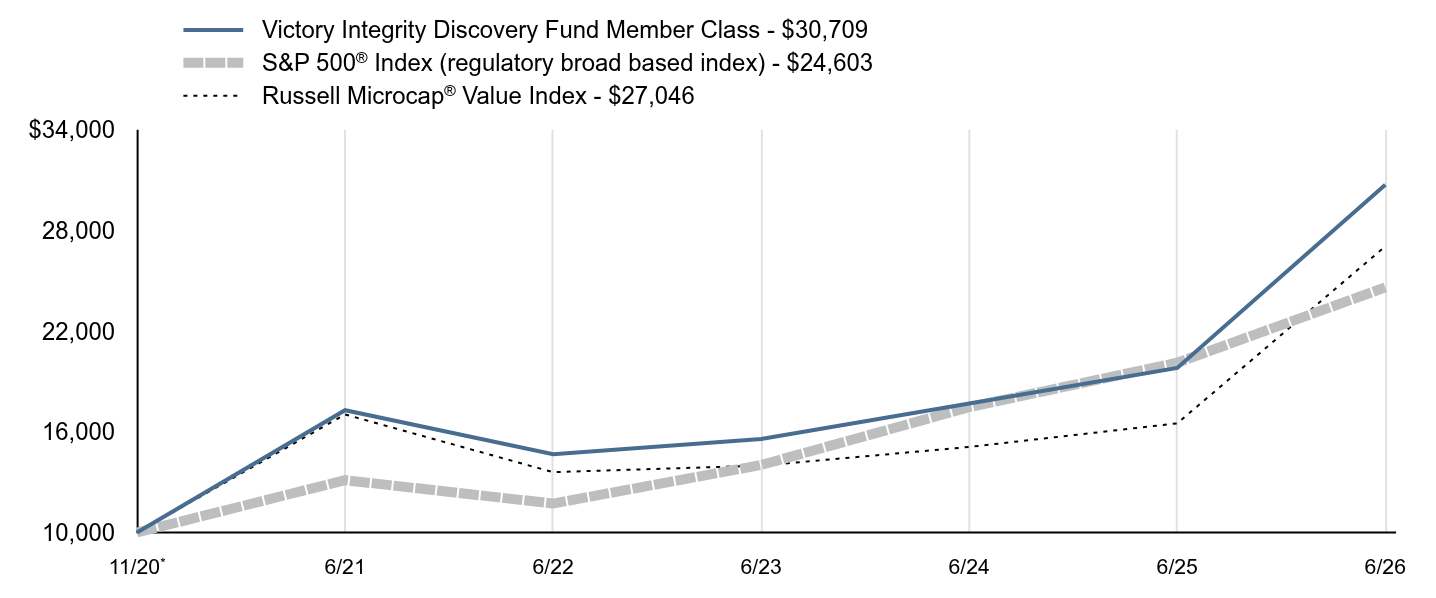
Table Summary | Victory Integrity Discovery Fund Member Class - $30,709 | S&P 500® Index (regulatory broad based index) - $24,603 | Russell Microcap® Value Index - $27,046 |
|---|
11/20Footnote Reference* | $10,000 | $10,000 | $10,000 |
|---|
6/21 | $17,285 | $13,117 | $17,034 |
|---|
6/22 | $14,663 | $11,724 | $13,594 |
|---|
6/23 | $15,566 | $14,021 | $13,983 |
|---|
6/24 | $17,679 | $17,465 | $15,096 |
|---|
6/25 | $19,801 | $20,113 | $16,503 |
|---|
6/26 | $30,709 | $24,603 | $27,046 |
|---|
|
| Average Annual Return [Table Text Block] |
Table Summary | 1 Year | 5 Year | Since Inception |
|---|
Member Class | 55.09%Footnote Reference | 12.18% | 21.93%Footnote Reference |
|---|
S&P 500® Index | 22.32% | 13.41% | 17.25% |
|---|
Russell Microcap® Value Index | 63.88% | 9.69% | 19.23% |
|---|
|
| No Deduction of Taxes [Text Block] |
The graph and table total returns do not reflect the deduction of taxes that a shareholder would pay on Fund distributions, or redemption of shares.
|
| AssetsNet |
$ 91,665,000
|
| Holdings Count | Holding |
135
|
| Advisory Fees Paid, Amount |
$ 685,000
|
| InvestmentCompanyPortfolioTurnover |
61.00%
|
| Additional Fund Statistics [Text Block] |
FUND STATISTICS($ amounts in 000s)(as of June 30, 2026)Table SummaryNet Assets | $91,665 |
|---|
Number of Holdings | 135 |
|---|
Investment Advisory Fees | $685 |
|---|
Portfolio Turnover | 61% |
|---|
|
| Holdings [Text Block] |
Top SectorsFootnote Reference* (% of Net Assets)Footnote Reference(as of June 30, 2026)Table SummaryValue | Value |
|---|
Utilities | 0.8% | Real Estate | 3.2% | Communication Services | 3.4% | Materials | 4.6% | Energy | 5.8% | Health Care | 6.2% | Consumer Discretionary | 12.4% | Information Technology | 13.7% | Industrials | 16.6% | FinancialsFootnote Reference** | 30.5% | Top 10 HoldingsFootnote Reference* (% of Net Assets)Footnote Reference(as of June 30, 2026)Table SummaryLindblad Expeditions Holdings, Inc. | 1.3% |
|---|
Vishay Precision Group, Inc. | 1.2% |
|---|
Horizon Bancorp, Inc. | 1.1% |
|---|
Peoples Bancorp, Inc. | 1.1% |
|---|
HealthStream, Inc. | 1.1% |
|---|
The Marcus Corp. | 1.0% |
|---|
Interface, Inc., Class A | 1.0% |
|---|
Quanex Building Products Corp. | 1.0% |
|---|
Chiron Real Estate, Inc. | 1.0% |
|---|
First Mid Bancshares, Inc. | 1.0% |
|---|
|
| C000144991 |
|
| Shareholder Report [Line Items] |
|
| Fund Name |
Victory Integrity Mid-Cap Value Fund
|
| Class Name |
Class A
|
| Trading Symbol |
MAIMX
|
| Annual or Semi-Annual Statement [Text Block] |
Annual Shareholder Report
|
| Additional Information [Text Block] |
You can find additional information about the Fund at advisor.vcm.com/literature/ mutual-fund-prospectuses. You may also request more information by calling 800-539-3863 or visiting vcm.com/contact-us.
|
| Additional Information Phone Number |
800-539-3863
|
| Additional Information Website |
vcm.com
|
| Expenses [Text Block] |
What were the Fund's costs for the last year?(based on a hypothetical $10,000 investment) Table SummaryClass Name | Costs of a $10,000 Investment | Costs paid as a percentage of a $10,000 Investment |
|---|
Class A | $112 | 1.00% |
|---|
| | |
|---|
|
| Expenses Paid, Amount |
$ 112
|
| Expense Ratio, Percent |
1.00%
|
| Factors Affecting Performance [Text Block] |
What affected the Fund’s performance during the last year?For the fiscal year ended June 30, 2026, the Fund underperformed its benchmark, the Russell Midcap® Value Index (the “Index”). Over the last 12 months, U.S. equity market reactions to the Federal Reserve’s interest rate policy, all things related to AI, and geopolitical turmoil were large headline factors. Equities continued to make all-time highs in the second half of 2025 on the heels of earnings momentum and continued signs of runway for the AI secular growth theme. 2025 came to a close with muted results in December driven by a late-month rotation out of AI/technology stocks, profit taking, and uncertainty on the pace of future Federal Reserve interest rate cuts in 2026. As the calendar turned to 2026, the first quarter of the year was defined by a sharp transition from early-year momentum to late-quarter volatility, primarily driven by a significant geopolitical shock and shifting interest rate expectations. After starting the year with modest gains in January, major indices sold off in March as conflict in the Middle East sparked a massive spike in oil prices, reigniting inflation fears. U.S. equity markets saw a powerful 2026 second quarter advance fueled by robust momentum in AI-related technology sectors, strong corporate earnings, and easing geopolitical concerns surrounding the U.S.-Iran conflict. While the early gains were led by large-cap growth, the rally ultimately broadened to include value and small-cap benchmarks. For the one-year period ending June 30, 2026, mid-cap value stocks outperformed mid-cap growth stocks. Top contributors to performance: • From an Index perspective, information technology and energy were the top-performing sectors. • The industrials, financials, and real estate sectors were the largest positive contributors to the Fund’s relative performance. Top detractors from performance: • From an Index perspective, consumer staples and real estate were the worst-performing sectors. • Security selection in the information technology sector was the largest detractor to the Fund’s performance. • The Fund’s lower volume and smaller market capitalization relative to the Index were both style headwinds. |
| Performance Past Does Not Indicate Future [Text] |
The investment return and principal value will fluctuate so that an investor's shares, when redeemed, may be worth more or less than the original cost. Past performance is not a good predictor of the Fund's future performance.
|
| Line Graph [Table Text Block] |
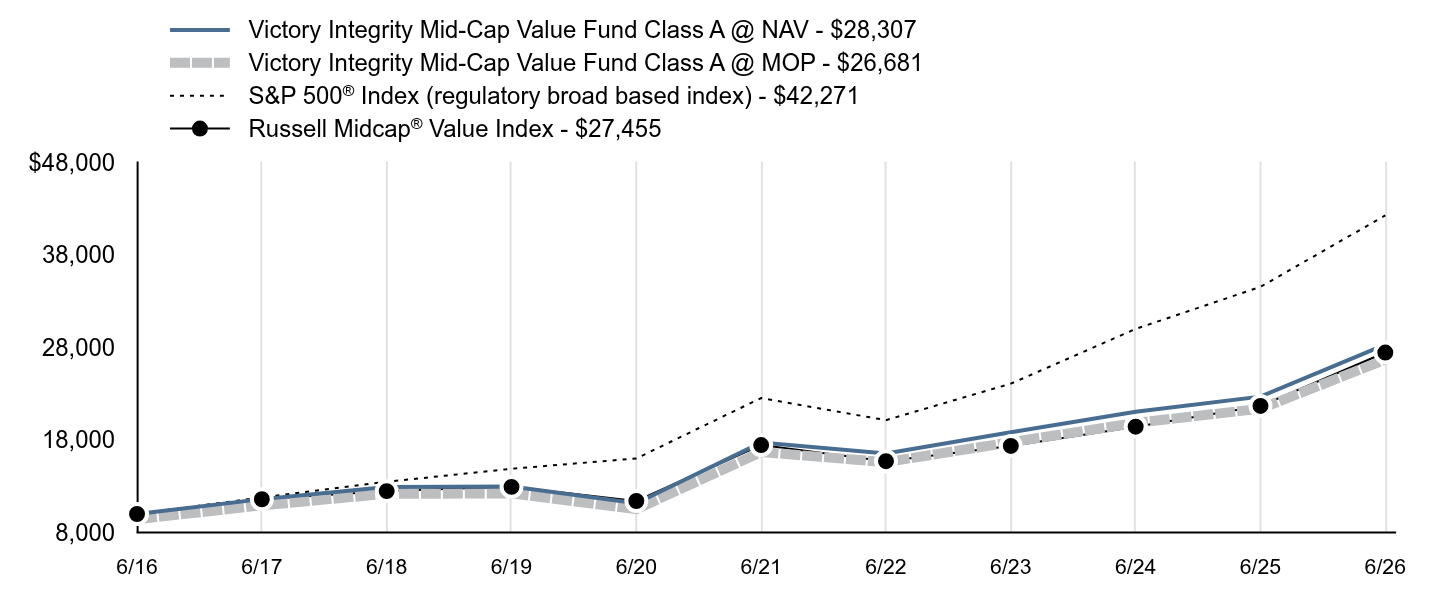
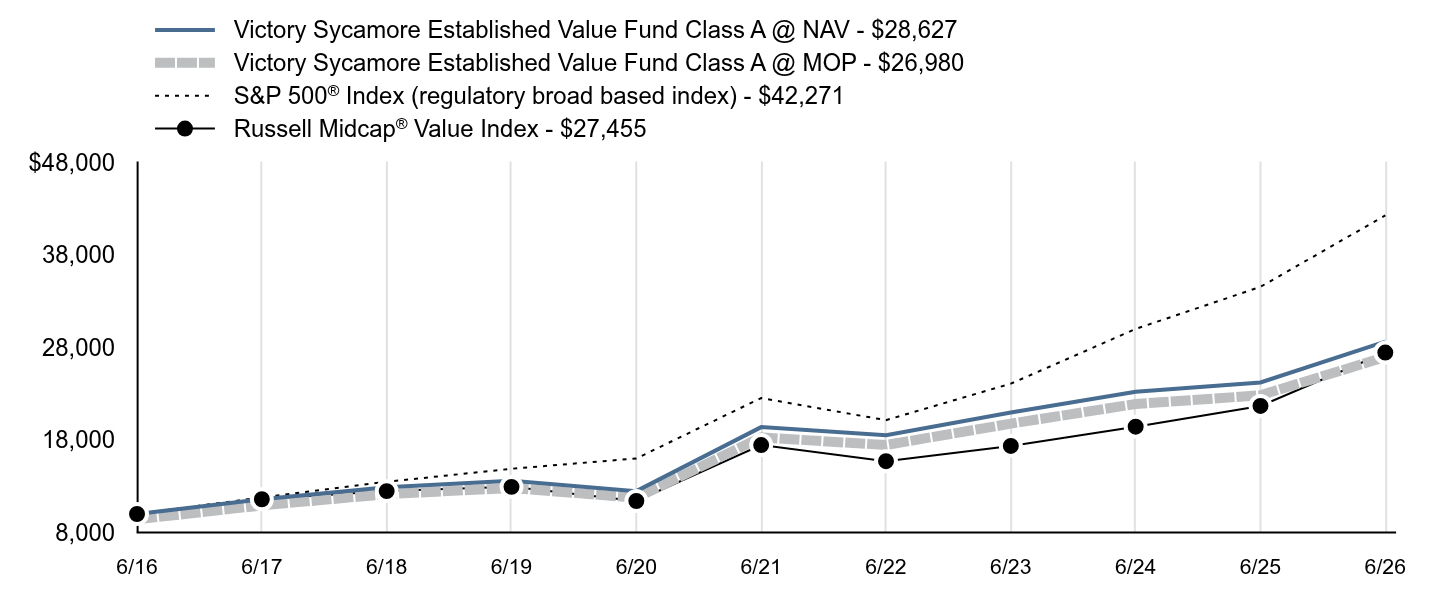
Table Summary | Victory Integrity Mid-Cap Value Fund Class A @ NAV - $28,307 | Victory Integrity Mid-Cap Value Fund Class A @ MOP - $26,681 | S&P 500® Index (regulatory broad based index) - $42,271 | Russell Midcap® Value Index - $27,455 |
|---|
6/16 | $10,000 | $9,426 | $10,000 | $10,000 |
|---|
6/17 | $11,607 | $10,941 | $11,790 | $11,593 |
|---|
6/18 | $12,922 | $12,180 | $13,484 | $12,473 |
|---|
6/19 | $12,969 | $12,224 | $14,889 | $12,932 |
|---|
6/20 | $11,166 | $10,525 | $16,006 | $11,405 |
|---|
6/21 | $17,715 | $16,698 | $22,536 | $17,456 |
|---|
6/22 | $16,553 | $15,603 | $20,144 | $15,711 |
|---|
6/23 | $18,843 | $17,761 | $24,091 | $17,361 |
|---|
6/24 | $21,050 | $19,842 | $30,006 | $19,441 |
|---|
6/25 | $22,688 | $21,385 | $34,556 | $21,683 |
|---|
6/26 | $28,307 | $26,681 | $42,271 | $27,455 |
|---|
|
| Average Annual Return [Table Text Block] |
Table Summary | 1 Year | 5 Year | 10 Year |
|---|
Class A @ NAV | 24.76%Footnote Reference | 9.83% | 10.97% |
|---|
Class A @ MOP | 17.59% | 8.53% | 10.31% |
|---|
S&P 500® Index | 22.32% | 13.41% | 15.51% |
|---|
Russell Midcap® Value Index | 26.62% | 9.48% | 10.63% |
|---|
|
| No Deduction of Taxes [Text Block] |
The graph and table total returns do not reflect the deduction of taxes that a shareholder would pay on Fund distributions, or redemption of shares.
|
| Previous Investment Adviser [Text Block] |
The maximum offering price (“MOP”) figures reflect a maximum sales charge of 5.75% for Class A. The Net Asset Value ("NAV") figures do not reflect sales charges.
|
| AssetsNet |
$ 376,079,000
|
| Holdings Count | Holding |
119
|
| Advisory Fees Paid, Amount |
$ 2,545,000
|
| InvestmentCompanyPortfolioTurnover |
42.00%
|
| Additional Fund Statistics [Text Block] |
FUND STATISTICS($ amounts in 000s)(as of June 30, 2026)Table SummaryNet Assets | $376,079 |
|---|
Number of Holdings | 119 |
|---|
Investment Advisory Fees | $2,545 |
|---|
Portfolio Turnover | 42% |
|---|
|
| Holdings [Text Block] |
Top SectorsFootnote Reference* (% of Net Assets)Footnote Reference(as of June 30, 2026)Table SummaryValue | Value |
|---|
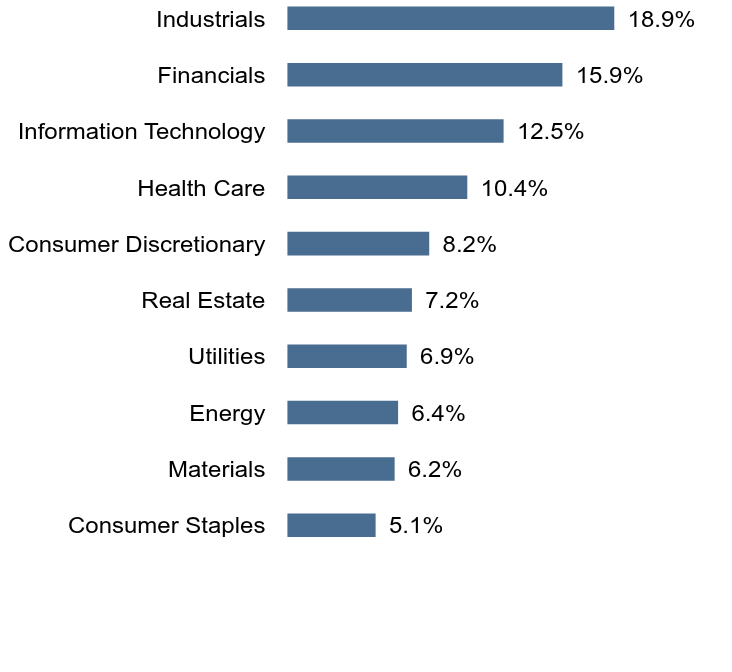
Consumer Staples | 5.1% | Materials | 6.2% | Energy | 6.4% | Utilities | 6.9% | Real Estate | 7.2% | Consumer Discretionary | 8.2% | Health Care | 10.4% | Information Technology | 12.5% | Financials | 15.9% | Industrials | 18.9% | Top 10 HoldingsFootnote Reference* (% of Net Assets)Footnote Reference(as of June 30, 2026)Table SummaryFifth Third Bancorp | 1.4% |
|---|
MKS, Inc. | 1.3% |
|---|
Knight-Swift Transportation Holdings, Inc., Class A | 1.3% |
|---|
State Street Corp. | 1.3% |
|---|
Valero Energy Corp. | 1.3% |
|---|
M&T Bank Corp. | 1.3% |
|---|
AMETEK, Inc. | 1.3% |
|---|
Nucor Corp. | 1.3% |
|---|
Xcel Energy, Inc. | 1.2% |
|---|
Sensata Technologies Holding PLC | 1.2% |
|---|
|
| C000217047 |
|
| Shareholder Report [Line Items] |
|
| Fund Name |
Victory Integrity Mid-Cap Value Fund
|
| Class Name |
Class C
|
| Trading Symbol |
MCIMX
|
| Annual or Semi-Annual Statement [Text Block] |
Annual Shareholder Report
|
| Additional Information [Text Block] |
You can find additional information about the Fund at advisor.vcm.com/literature/ mutual-fund-prospectuses. You may also request more information by calling 800-539-3863 or visiting vcm.com/contact-us.
|
| Additional Information Phone Number |
800-539-3863
|
| Additional Information Website |
vcm.com
|
| Expenses [Text Block] |
What were the Fund's costs for the last year?(based on a hypothetical $10,000 investment) Table SummaryClass Name | Costs of a $10,000 Investment | Costs paid as a percentage of a $10,000 Investment |
|---|
Class C | $196 | 1.75% |
|---|
| | |
|---|
|
| Expenses Paid, Amount |
$ 196
|
| Expense Ratio, Percent |
1.75%
|
| Factors Affecting Performance [Text Block] |
What affected the Fund’s performance during the last year?For the fiscal year ended June 30, 2026, the Fund underperformed its benchmark, the Russell Midcap® Value Index (the “Index”). Over the last 12 months, U.S. equity market reactions to the Federal Reserve’s interest rate policy, all things related to AI, and geopolitical turmoil were large headline factors. Equities continued to make all-time highs in the second half of 2025 on the heels of earnings momentum and continued signs of runway for the AI secular growth theme. 2025 came to a close with muted results in December driven by a late-month rotation out of AI/technology stocks, profit taking, and uncertainty on the pace of future Federal Reserve interest rate cuts in 2026. As the calendar turned to 2026, the first quarter of the year was defined by a sharp transition from early-year momentum to late-quarter volatility, primarily driven by a significant geopolitical shock and shifting interest rate expectations. After starting the year with modest gains in January, major indices sold off in March as conflict in the Middle East sparked a massive spike in oil prices, reigniting inflation fears. U.S. equity markets saw a powerful 2026 second quarter advance fueled by robust momentum in AI-related technology sectors, strong corporate earnings, and easing geopolitical concerns surrounding the U.S.-Iran conflict. While the early gains were led by large-cap growth, the rally ultimately broadened to include value and small-cap benchmarks. For the one-year period ending June 30, 2026, mid-cap value stocks outperformed mid-cap growth stocks. Top contributors to performance: • From an Index perspective, information technology and energy were the top-performing sectors. • The industrials, financials, and real estate sectors were the largest positive contributors to the Fund’s relative performance. Top detractors from performance: • From an Index perspective, consumer staples and real estate were the worst-performing sectors. • Security selection in the information technology sector was the largest detractor to the Fund’s performance. • The Fund’s lower volume and smaller market capitalization relative to the Index were both style headwinds. |
| Performance Past Does Not Indicate Future [Text] |
The investment return and principal value will fluctuate so that an investor's shares, when redeemed, may be worth more or less than the original cost. Past performance is not a good predictor of the Fund's future performance.
|
| Line Graph [Table Text Block] |
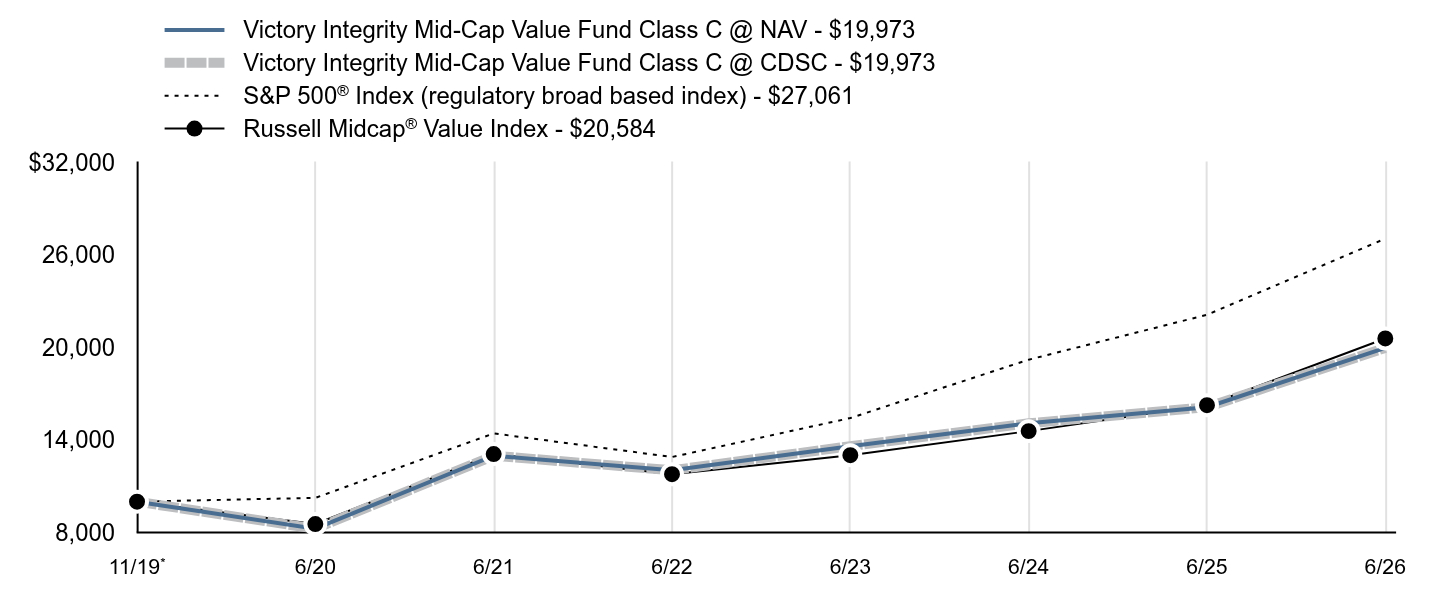
Table Summary | Victory Integrity Mid-Cap Value Fund Class C @ NAV - $19,973 | Victory Integrity Mid-Cap Value Fund Class C @ CDSC - $19,973 | S&P 500® Index (regulatory broad based index) - $27,061 | Russell Midcap® Value Index - $20,584 |
|---|
11/19Footnote Reference* | $10,000 | $10,000 | $10,000 | $10,000 |
|---|
6/20 | $8,245 | $8,245 | $10,247 | $8,550 |
|---|
6/21 | $12,979 | $12,979 | $14,427 | $13,088 |
|---|
6/22 | $12,036 | $12,036 | $12,896 | $11,779 |
|---|
6/23 | $13,599 | $13,599 | $15,422 | $13,016 |
|---|
6/24 | $15,081 | $15,081 | $19,209 | $14,575 |
|---|
6/25 | $16,127 | $16,127 | $22,122 | $16,256 |
|---|
6/26 | $19,973 | $19,973 | $27,061 | $20,584 |
|---|
|
| Average Annual Return [Table Text Block] |
Table Summary | 1 Year | 5 Year | Since Inception |
|---|
Class C @ NAV | 23.85%Footnote Reference | 9.00% | 10.94% |
|---|
Class C @ CDSC | 22.85% | 9.00% | 10.94% |
|---|
S&P 500® Index | 22.32% | 13.41% | 16.11% |
|---|
Russell Midcap® Value Index | 26.62% | 9.48% | 11.44% |
|---|
|
| No Deduction of Taxes [Text Block] |
The graph and table total returns do not reflect the deduction of taxes that a shareholder would pay on Fund distributions, or redemption of shares.
|
| Previous Investment Adviser [Text Block] |
Class C is not subject to an initial sales charge, but is subject to Contingent Deferred Sales Charge (“CDSC”) of 1.00% on shares redeemed within one year of purchase. The Net Asset Value ("NAV") figures do not reflect sales charges.
|
| AssetsNet |
$ 376,079,000
|
| Holdings Count | Holding |
119
|
| Advisory Fees Paid, Amount |
$ 2,545,000
|
| InvestmentCompanyPortfolioTurnover |
42.00%
|
| Additional Fund Statistics [Text Block] |
FUND STATISTICS($ amounts in 000s)(as of June 30, 2026)Table SummaryNet Assets | $376,079 |
|---|
Number of Holdings | 119 |
|---|
Investment Advisory Fees | $2,545 |
|---|
Portfolio Turnover | 42% |
|---|
|
| Holdings [Text Block] |
Top SectorsFootnote Reference* (% of Net Assets)Footnote Reference(as of June 30, 2026)Table SummaryValue | Value |
|---|
Consumer Staples | 5.1% | Materials | 6.2% | Energy | 6.4% | Utilities | 6.9% | Real Estate | 7.2% | Consumer Discretionary | 8.2% | Health Care | 10.4% | Information Technology | 12.5% | Financials | 15.9% | Industrials | 18.9% | Top 10 HoldingsFootnote Reference* (% of Net Assets)Footnote Reference(as of June 30, 2026)Table SummaryFifth Third Bancorp | 1.4% |
|---|
MKS, Inc. | 1.3% |
|---|
Knight-Swift Transportation Holdings, Inc., Class A | 1.3% |
|---|
State Street Corp. | 1.3% |
|---|
Valero Energy Corp. | 1.3% |
|---|
M&T Bank Corp. | 1.3% |
|---|
AMETEK, Inc. | 1.3% |
|---|
Nucor Corp. | 1.3% |
|---|
Xcel Energy, Inc. | 1.2% |
|---|
Sensata Technologies Holding PLC | 1.2% |
|---|
|
| C000164741 |
|
| Shareholder Report [Line Items] |
|
| Fund Name |
Victory Integrity Mid-Cap Value Fund
|
| Class Name |
Class R6
|
| Trading Symbol |
MRIMX
|
| Annual or Semi-Annual Statement [Text Block] |
Annual Shareholder Report
|
| Additional Information [Text Block] |
You can find additional information about the Fund at advisor.vcm.com/literature/ mutual-fund-prospectuses. You may also request more information by calling 800-539-3863 or visiting vcm.com/contact-us.
|
| Additional Information Phone Number |
800-539-3863
|
| Additional Information Website |
vcm.com
|
| Expenses [Text Block] |
What were the Fund's costs for the last year?(based on a hypothetical $10,000 investment) Table SummaryClass Name | Costs of a $10,000 Investment | Costs paid as a percentage of a $10,000 Investment |
|---|
Class R6 | $68 | 0.60% |
|---|
| | |
|---|
|
| Expenses Paid, Amount |
$ 68
|
| Expense Ratio, Percent |
0.60%
|
| Factors Affecting Performance [Text Block] |
What affected the Fund’s performance during the last year?For the fiscal year ended June 30, 2026, the Fund underperformed its benchmark, the Russell Midcap® Value Index (the “Index”). Over the last 12 months, U.S. equity market reactions to the Federal Reserve’s interest rate policy, all things related to AI, and geopolitical turmoil were large headline factors. Equities continued to make all-time highs in the second half of 2025 on the heels of earnings momentum and continued signs of runway for the AI secular growth theme. 2025 came to a close with muted results in December driven by a late-month rotation out of AI/technology stocks, profit taking, and uncertainty on the pace of future Federal Reserve interest rate cuts in 2026. As the calendar turned to 2026, the first quarter of the year was defined by a sharp transition from early-year momentum to late-quarter volatility, primarily driven by a significant geopolitical shock and shifting interest rate expectations. After starting the year with modest gains in January, major indices sold off in March as conflict in the Middle East sparked a massive spike in oil prices, reigniting inflation fears. U.S. equity markets saw a powerful 2026 second quarter advance fueled by robust momentum in AI-related technology sectors, strong corporate earnings, and easing geopolitical concerns surrounding the U.S.-Iran conflict. While the early gains were led by large-cap growth, the rally ultimately broadened to include value and small-cap benchmarks. For the one-year period ending June 30, 2026, mid-cap value stocks outperformed mid-cap growth stocks. Top contributors to performance: • From an Index perspective, information technology and energy were the top-performing sectors. • The industrials, financials, and real estate sectors were the largest positive contributors to the Fund’s relative performance. Top detractors from performance: • From an Index perspective, consumer staples and real estate were the worst-performing sectors. • Security selection in the information technology sector was the largest detractor to the Fund’s performance. • The Fund’s lower volume and smaller market capitalization relative to the Index were both style headwinds. |
| Performance Past Does Not Indicate Future [Text] |
The investment return and principal value will fluctuate so that an investor's shares, when redeemed, may be worth more or less than the original cost. Past performance is not a good predictor of the Fund's future performance.
|
| Line Graph [Table Text Block] |
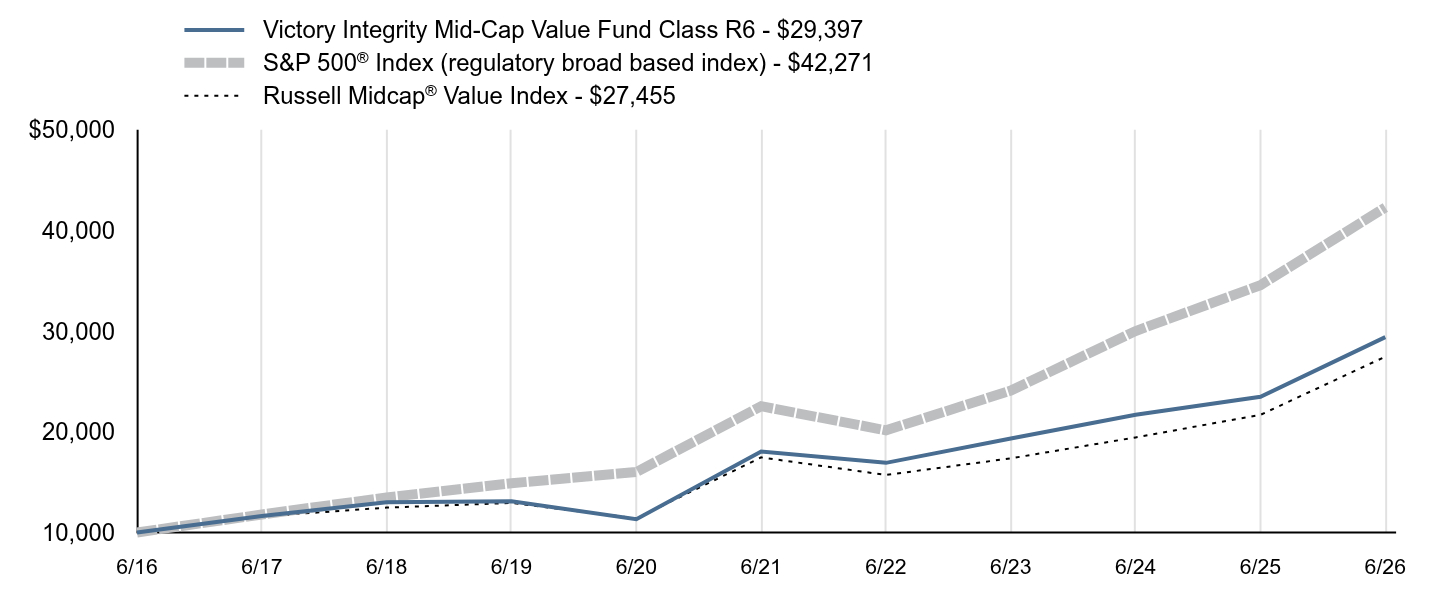
Table Summary | Victory Integrity Mid-Cap Value Fund Class R6 - $29,397 | S&P 500® Index (regulatory broad based index) - $42,271 | Russell Midcap® Value Index - $27,455 |
|---|
6/16 | $10,000 | $10,000 | $10,000 |
|---|
6/17 | $11,642 | $11,790 | $11,593 |
|---|
6/18 | $13,003 | $13,484 | $12,473 |
|---|
6/19 | $13,097 | $14,889 | $12,932 |
|---|
6/20 | $11,325 | $16,006 | $11,405 |
|---|
6/21 | $18,035 | $22,536 | $17,456 |
|---|
6/22 | $16,916 | $20,144 | $15,711 |
|---|
6/23 | $19,333 | $24,091 | $17,361 |
|---|
6/24 | $21,693 | $30,006 | $19,441 |
|---|
6/25 | $23,467 | $34,556 | $21,683 |
|---|
6/26 | $29,397 | $42,271 | $27,455 |
|---|
|
| Average Annual Return [Table Text Block] |
Table Summary | 1 Year | 5 Year | 10 Year |
|---|
Class R6 | 25.27%Footnote Reference | 10.27% | 11.39% |
|---|
S&P 500® Index | 22.32% | 13.41% | 15.51% |
|---|
Russell Midcap® Value Index | 26.62% | 9.48% | 10.63% |
|---|
|
| No Deduction of Taxes [Text Block] |
The graph and table total returns do not reflect the deduction of taxes that a shareholder would pay on Fund distributions, or redemption of shares.
|
| AssetsNet |
$ 376,079,000
|
| Holdings Count | Holding |
119
|
| Advisory Fees Paid, Amount |
$ 2,545,000
|
| InvestmentCompanyPortfolioTurnover |
42.00%
|
| Additional Fund Statistics [Text Block] |
FUND STATISTICS($ amounts in 000s)(as of June 30, 2026)Table SummaryNet Assets | $376,079 |
|---|
Number of Holdings | 119 |
|---|
Investment Advisory Fees | $2,545 |
|---|
Portfolio Turnover | 42% |
|---|
|
| Holdings [Text Block] |
Top SectorsFootnote Reference* (% of Net Assets)Footnote Reference(as of June 30, 2026)Table SummaryValue | Value |
|---|
Consumer Staples | 5.1% | Materials | 6.2% | Energy | 6.4% | Utilities | 6.9% | Real Estate | 7.2% | Consumer Discretionary | 8.2% | Health Care | 10.4% | Information Technology | 12.5% | Financials | 15.9% | Industrials | 18.9% | Top 10 HoldingsFootnote Reference* (% of Net Assets)Footnote Reference(as of June 30, 2026)Table SummaryFifth Third Bancorp | 1.4% |
|---|
MKS, Inc. | 1.3% |
|---|
Knight-Swift Transportation Holdings, Inc., Class A | 1.3% |
|---|
State Street Corp. | 1.3% |
|---|
Valero Energy Corp. | 1.3% |
|---|
M&T Bank Corp. | 1.3% |
|---|
AMETEK, Inc. | 1.3% |
|---|
Nucor Corp. | 1.3% |
|---|
Xcel Energy, Inc. | 1.2% |
|---|
Sensata Technologies Holding PLC | 1.2% |
|---|
|
| C000144992 |
|
| Shareholder Report [Line Items] |
|
| Fund Name |
Victory Integrity Mid-Cap Value Fund
|
| Class Name |
Class Y
|
| Trading Symbol |
MYIMX
|
| Annual or Semi-Annual Statement [Text Block] |
Annual Shareholder Report
|
| Additional Information [Text Block] |
You can find additional information about the Fund at advisor.vcm.com/literature/ mutual-fund-prospectuses. You may also request more information by calling 800-539-3863 or visiting vcm.com/contact-us.
|
| Additional Information Phone Number |
800-539-3863
|
| Additional Information Website |
vcm.com
|
| Expenses [Text Block] |
What were the Fund's costs for the last year?(based on a hypothetical $10,000 investment) Table SummaryClass Name | Costs of a $10,000 Investment | Costs paid as a percentage of a $10,000 Investment |
|---|
Class Y | $84 | 0.75% |
|---|
| | |
|---|
|
| Expenses Paid, Amount |
$ 84
|
| Expense Ratio, Percent |
0.75%
|
| Factors Affecting Performance [Text Block] |
What affected the Fund’s performance during the last year?For the fiscal year ended June 30, 2026, the Fund underperformed its benchmark, the Russell Midcap® Value Index (the “Index”). Over the last 12 months, U.S. equity market reactions to the Federal Reserve’s interest rate policy, all things related to AI, and geopolitical turmoil were large headline factors. Equities continued to make all-time highs in the second half of 2025 on the heels of earnings momentum and continued signs of runway for the AI secular growth theme. 2025 came to a close with muted results in December driven by a late-month rotation out of AI/technology stocks, profit taking, and uncertainty on the pace of future Federal Reserve interest rate cuts in 2026. As the calendar turned to 2026, the first quarter of the year was defined by a sharp transition from early-year momentum to late-quarter volatility, primarily driven by a significant geopolitical shock and shifting interest rate expectations. After starting the year with modest gains in January, major indices sold off in March as conflict in the Middle East sparked a massive spike in oil prices, reigniting inflation fears. U.S. equity markets saw a powerful 2026 second quarter advance fueled by robust momentum in AI-related technology sectors, strong corporate earnings, and easing geopolitical concerns surrounding the U.S.-Iran conflict. While the early gains were led by large-cap growth, the rally ultimately broadened to include value and small-cap benchmarks. For the one-year period ending June 30, 2026, mid-cap value stocks outperformed mid-cap growth stocks. Top contributors to performance: • From an Index perspective, information technology and energy were the top-performing sectors. • The industrials, financials, and real estate sectors were the largest positive contributors to the Fund’s relative performance. Top detractors from performance: • From an Index perspective, consumer staples and real estate were the worst-performing sectors. • Security selection in the information technology sector was the largest detractor to the Fund’s performance. • The Fund’s lower volume and smaller market capitalization relative to the Index were both style headwinds. |
| Performance Past Does Not Indicate Future [Text] |
The investment return and principal value will fluctuate so that an investor's shares, when redeemed, may be worth more or less than the original cost. Past performance is not a good predictor of the Fund's future performance.
|
| Line Graph [Table Text Block] |
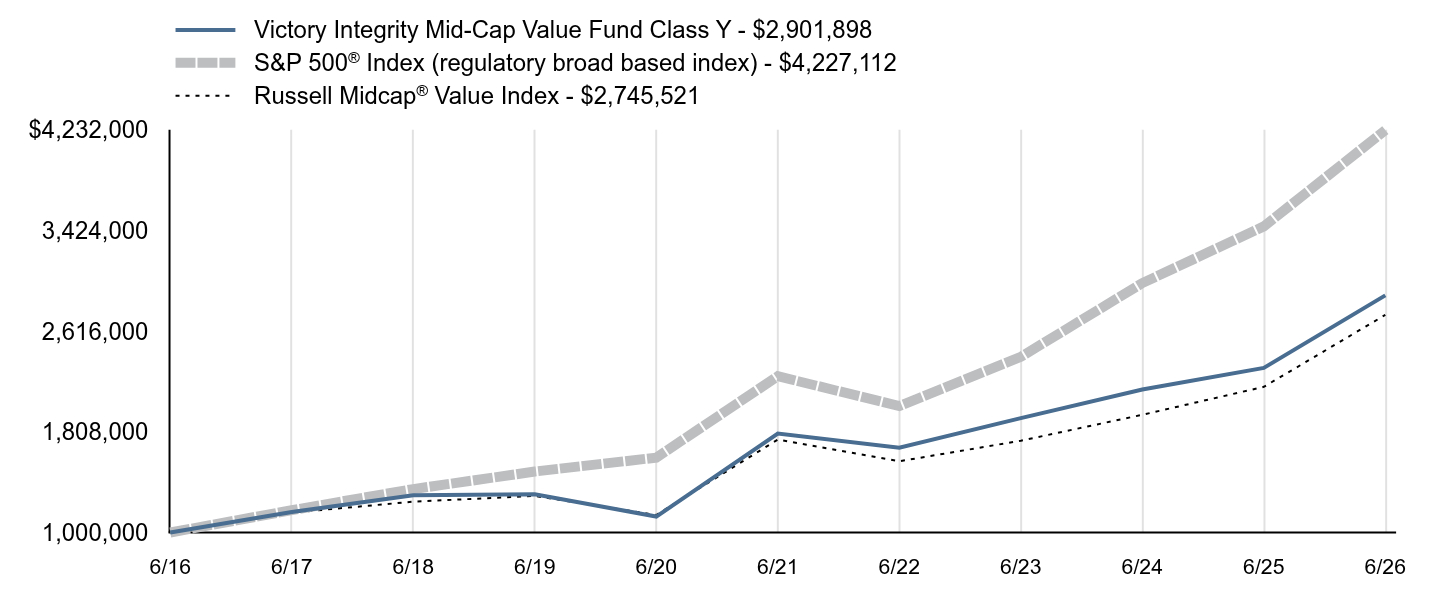
Table Summary | Victory Integrity Mid-Cap Value Fund Class Y - $2,901,898 | S&P 500® Index (regulatory broad based index) - $4,227,112 | Russell Midcap® Value Index - $2,745,521 |
|---|
6/16 | $1,000,000 | $1,000,000 | $1,000,000 |
|---|
6/17 | $1,164,313 | $1,178,960 | $1,159,255 |
|---|
6/18 | $1,299,160 | $1,348,424 | $1,247,304 |
|---|
6/19 | $1,306,677 | $1,488,895 | $1,293,221 |
|---|
6/20 | $1,128,058 | $1,600,639 | $1,140,467 |
|---|
6/21 | $1,793,980 | $2,253,606 | $1,745,645 |
|---|
6/22 | $1,680,026 | $2,014,367 | $1,571,133 |
|---|
6/23 | $1,917,564 | $2,409,064 | $1,736,145 |
|---|
6/24 | $2,147,381 | $3,000,635 | $1,944,092 |
|---|
6/25 | $2,319,877 | $3,455,641 | $2,168,324 |
|---|
6/26 | $2,901,898 | $4,227,112 | $2,745,521 |
|---|
|
| Average Annual Return [Table Text Block] |
Table Summary | 1 Year | 5 Year | 10 Year |
|---|
Class Y | 25.09%Footnote Reference | 10.10% | 11.24% |
|---|
S&P 500® Index | 22.32% | 13.41% | 15.51% |
|---|
Russell Midcap® Value Index | 26.62% | 9.48% | 10.63% |
|---|
|
| No Deduction of Taxes [Text Block] |
The graph and table total returns do not reflect the deduction of taxes that a shareholder would pay on Fund distributions, or redemption of shares.
|
| AssetsNet |
$ 376,079,000
|
| Holdings Count | Holding |
119
|
| Advisory Fees Paid, Amount |
$ 2,545,000
|
| InvestmentCompanyPortfolioTurnover |
42.00%
|
| Additional Fund Statistics [Text Block] |
FUND STATISTICS($ amounts in 000s)(as of June 30, 2026)Table SummaryNet Assets | $376,079 |
|---|
Number of Holdings | 119 |
|---|
Investment Advisory Fees | $2,545 |
|---|
Portfolio Turnover | 42% |
|---|
|
| Holdings [Text Block] |
Top SectorsFootnote Reference* (% of Net Assets)Footnote Reference(as of June 30, 2026)Table SummaryValue | Value |
|---|
Consumer Staples | 5.1% | Materials | 6.2% | Energy | 6.4% | Utilities | 6.9% | Real Estate | 7.2% | Consumer Discretionary | 8.2% | Health Care | 10.4% | Information Technology | 12.5% | Financials | 15.9% | Industrials | 18.9% | Top 10 HoldingsFootnote Reference* (% of Net Assets)Footnote Reference(as of June 30, 2026)Table SummaryFifth Third Bancorp | 1.4% |
|---|
MKS, Inc. | 1.3% |
|---|
Knight-Swift Transportation Holdings, Inc., Class A | 1.3% |
|---|
State Street Corp. | 1.3% |
|---|
Valero Energy Corp. | 1.3% |
|---|
M&T Bank Corp. | 1.3% |
|---|
AMETEK, Inc. | 1.3% |
|---|
Nucor Corp. | 1.3% |
|---|
Xcel Energy, Inc. | 1.2% |
|---|
Sensata Technologies Holding PLC | 1.2% |
|---|
|
| C000219863 |
|
| Shareholder Report [Line Items] |
|
| Fund Name |
Victory Integrity Mid-Cap Value Fund
|
| Class Name |
Member Class
|
| Trading Symbol |
MMIJX
|
| Annual or Semi-Annual Statement [Text Block] |
Annual Shareholder Report
|
| Additional Information [Text Block] |
You can find additional information about the Fund at advisor.vcm.com/literature/ mutual-fund-prospectuses. You may also request more information by calling 800-235-8396 or visiting vcm.com/contact-us.
|
| Additional Information Phone Number |
800-235-8396
|
| Additional Information Website |
vcm.com
|
| Expenses [Text Block] |
What were the Fund's costs for the last year?(based on a hypothetical $10,000 investment) Table SummaryClass Name | Costs of a $10,000 Investment | Costs paid as a percentage of a $10,000 Investment |
|---|
Member Class | $96 | 0.85% |
|---|
| | |
|---|
|
| Expenses Paid, Amount |
$ 96
|
| Expense Ratio, Percent |
0.85%
|
| Factors Affecting Performance [Text Block] |
What affected the Fund’s performance during the last year?For the fiscal year ended June 30, 2026, the Fund underperformed its benchmark, the Russell Midcap® Value Index (the “Index”). Over the last 12 months, U.S. equity market reactions to the Federal Reserve’s interest rate policy, all things related to AI, and geopolitical turmoil were large headline factors. Equities continued to make all-time highs in the second half of 2025 on the heels of earnings momentum and continued signs of runway for the AI secular growth theme. 2025 came to a close with muted results in December driven by a late-month rotation out of AI/technology stocks, profit taking, and uncertainty on the pace of future Federal Reserve interest rate cuts in 2026. As the calendar turned to 2026, the first quarter of the year was defined by a sharp transition from early-year momentum to late-quarter volatility, primarily driven by a significant geopolitical shock and shifting interest rate expectations. After starting the year with modest gains in January, major indices sold off in March as conflict in the Middle East sparked a massive spike in oil prices, reigniting inflation fears. U.S. equity markets saw a powerful 2026 second quarter advance fueled by robust momentum in AI-related technology sectors, strong corporate earnings, and easing geopolitical concerns surrounding the U.S.-Iran conflict. While the early gains were led by large-cap growth, the rally ultimately broadened to include value and small-cap benchmarks. For the one-year period ending June 30, 2026, mid-cap value stocks outperformed mid-cap growth stocks. Top contributors to performance: • From an Index perspective, information technology and energy were the top-performing sectors. • The industrials, financials, and real estate sectors were the largest positive contributors to the Fund’s relative performance. Top detractors from performance: • From an Index perspective, consumer staples and real estate were the worst-performing sectors. • Security selection in the information technology sector was the largest detractor to the Fund’s performance. • The Fund’s lower volume and smaller market capitalization relative to the Index were both style headwinds. |
| Performance Past Does Not Indicate Future [Text] |
The investment return and principal value will fluctuate so that an investor's shares, when redeemed, may be worth more or less than the original cost. Past performance is not a good predictor of the Fund's future performance.
|
| Line Graph [Table Text Block] |
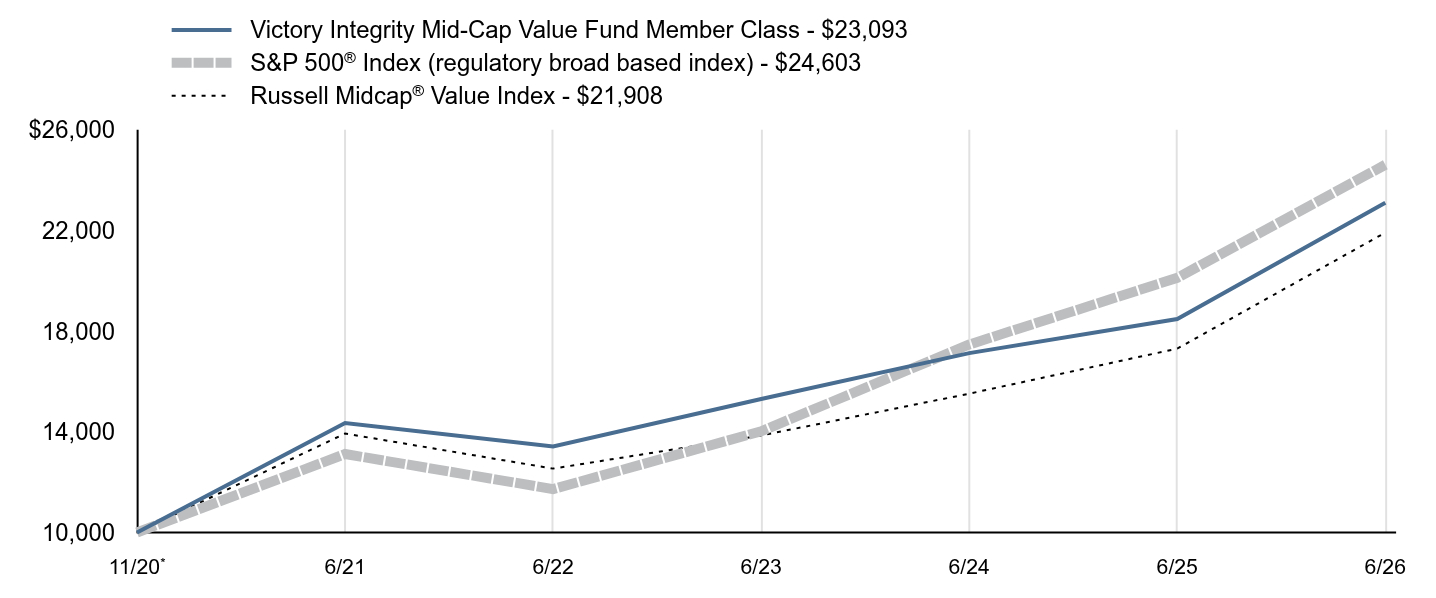
Table Summary | Victory Integrity Mid-Cap Value Fund Member Class - $23,093 | S&P 500® Index (regulatory broad based index) - $24,603 | Russell Midcap® Value Index - $21,908 |
|---|
11/20Footnote Reference* | $10,000 | $10,000 | $10,000 |
|---|
6/21 | $14,346 | $13,117 | $13,929 |
|---|
6/22 | $13,420 | $11,724 | $12,537 |
|---|
6/23 | $15,301 | $14,021 | $13,853 |
|---|
6/24 | $17,124 | $17,465 | $15,513 |
|---|
6/25 | $18,476 | $20,113 | $17,302 |
|---|
6/26 | $23,093 | $24,603 | $21,908 |
|---|
|
| Average Annual Return [Table Text Block] |
Table Summary | 1 Year | 5 Year | Since Inception |
|---|
Member Class | 24.99%Footnote Reference | 9.99% | 15.94%Footnote Reference |
|---|
S&P 500® Index | 22.32% | 13.41% | 17.25% |
|---|
Russell Midcap® Value Index | 26.62% | 9.48% | 14.87% |
|---|
|
| No Deduction of Taxes [Text Block] |
The graph and table total returns do not reflect the deduction of taxes that a shareholder would pay on Fund distributions, or redemption of shares.
|
| AssetsNet |
$ 376,079,000
|
| Holdings Count | Holding |
119
|
| Advisory Fees Paid, Amount |
$ 2,545,000
|
| InvestmentCompanyPortfolioTurnover |
42.00%
|
| Additional Fund Statistics [Text Block] |
FUND STATISTICS($ amounts in 000s)(as of June 30, 2026)Table SummaryNet Assets | $376,079 |
|---|
Number of Holdings | 119 |
|---|
Investment Advisory Fees | $2,545 |
|---|
Portfolio Turnover | 42% |
|---|
|
| Holdings [Text Block] |
Top SectorsFootnote Reference* (% of Net Assets)Footnote Reference(as of June 30, 2026)Table SummaryValue | Value |
|---|
Consumer Staples | 5.1% | Materials | 6.2% | Energy | 6.4% | Utilities | 6.9% | Real Estate | 7.2% | Consumer Discretionary | 8.2% | Health Care | 10.4% | Information Technology | 12.5% | Financials | 15.9% | Industrials | 18.9% | Top 10 HoldingsFootnote Reference* (% of Net Assets)Footnote Reference(as of June 30, 2026)Table SummaryFifth Third Bancorp | 1.4% |
|---|
MKS, Inc. | 1.3% |
|---|
Knight-Swift Transportation Holdings, Inc., Class A | 1.3% |
|---|
State Street Corp. | 1.3% |
|---|
Valero Energy Corp. | 1.3% |
|---|
M&T Bank Corp. | 1.3% |
|---|
AMETEK, Inc. | 1.3% |
|---|
Nucor Corp. | 1.3% |
|---|
Xcel Energy, Inc. | 1.2% |
|---|
Sensata Technologies Holding PLC | 1.2% |
|---|
|
| C000144977 |
|
| Shareholder Report [Line Items] |
|
| Fund Name |
Victory Integrity Small-Cap Value Fund
|
| Class Name |
Class A
|
| Trading Symbol |
VSCVX
|
| Annual or Semi-Annual Statement [Text Block] |
Annual Shareholder Report
|
| Additional Information [Text Block] |
You can find additional information about the Fund at advisor.vcm.com/literature/mutual-fund-prospectuses. You may also request more information by calling 800-539-3863 or visiting vcm.com/contact-us.
|
| Additional Information Phone Number |
800-539-3863
|
| Additional Information Website |
vcm.com
|
| Expenses [Text Block] |
What were the Fund's costs for the last year?(based on a hypothetical $10,000 investment) Table SummaryClass Name | Costs of a $10,000 Investment | Costs paid as a percentage of a $10,000 Investment |
|---|
Class A | $169 | 1.41% |
|---|
| | |
|---|
|
| Expenses Paid, Amount |
$ 169
|
| Expense Ratio, Percent |
1.41%
|
| Factors Affecting Performance [Text Block] |
What affected the Fund’s performance during the last year?For the fiscal year ended June 30, 2026, the Fund underperformed its benchmark, the Russell 2000® Value Index (the “Index”). Over the last 12 months, U.S. equity market reactions to the Federal Reserve’s interest rate policy, all things related to AI, and geopolitical turmoil were large headline factors. Equities continued to make all-time highs in the second half of 2025 on the heels of earnings momentum and continued signs of runway for the AI secular growth theme. 2025 came to a close with muted results in December driven by a late-month rotation out of AI/technology stocks, profit taking, and uncertainty on the pace of future Federal Reserve interest rate cuts in 2026. As the calendar turned to 2026, the first quarter of the year was defined by a sharp transition from early-year momentum to late-quarter volatility, primarily driven by a significant geopolitical shock and shifting interest rate expectations. After starting the year with modest gains in January, major indices sold off in March as conflict in the Middle East sparked a massive spike in oil prices, reigniting inflation fears. U.S. equity markets saw a powerful 2026 second quarter advance fueled by robust momentum in AI-related technology sectors, strong corporate earnings, and easing geopolitical concerns surrounding the U.S.-Iran conflict. While the early gains were led by large-cap growth, the rally ultimately broadened to include value and small-cap benchmarks. For the one-year period ending June 30, 2026, small value stocks outperformed small growth stocks. Top contributors to performance: Information technology, health care, and communication services were the top-performing sectors within the Index. The information technology, consumer discretionary, and utilities sectors were the largest positive contributors to the Fund’s performance. Sector weights were modestly positive on the Fund’s performance relative to the Index largely due to our overweight to information technology.
Top detractors from performance: Utilities and consumer staples were the worst-performing sectors within the Index. Security selection in the health care, financials, and communication services sectors was the largest detractor from the Fund’s performance. The Fund’s lower-volatility and larger-market-capitalization exposures relative to the Index were style headwinds.
|
| Performance Past Does Not Indicate Future [Text] |
The investment return and principal value will fluctuate so that an investor's shares, when redeemed, may be worth more or less than the original cost. Past performance is not a good predictor of the Fund's future performance.
|
| Line Graph [Table Text Block] |
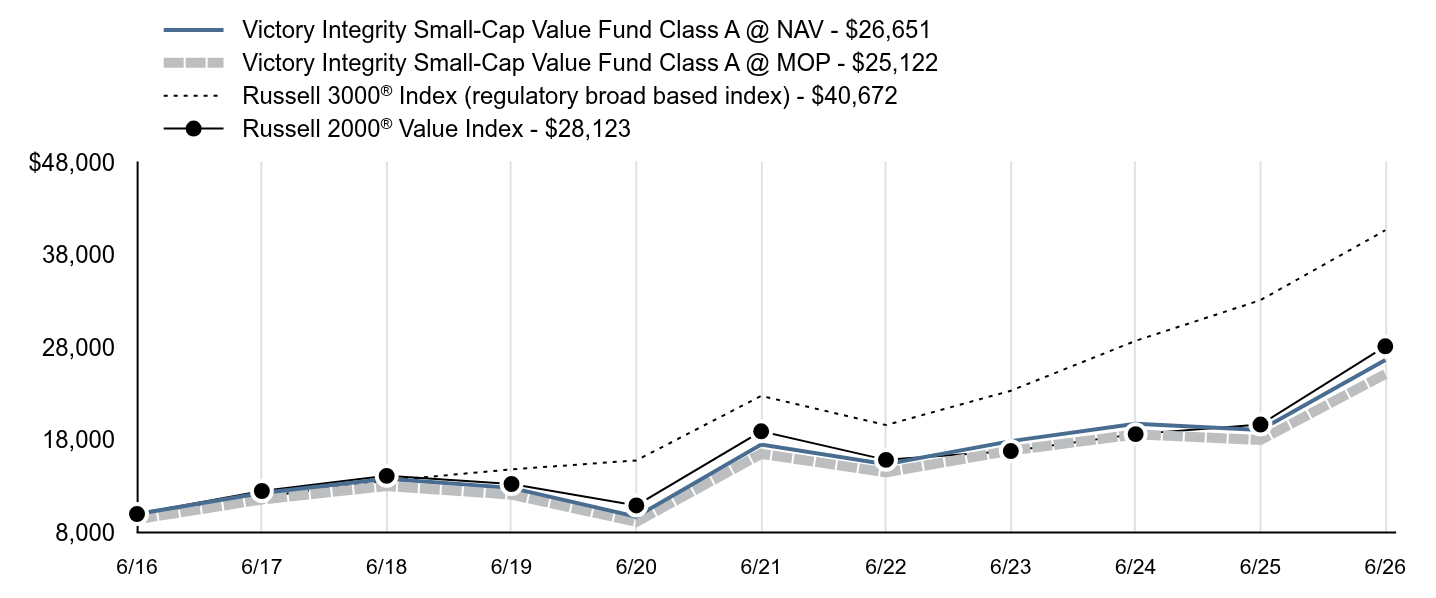
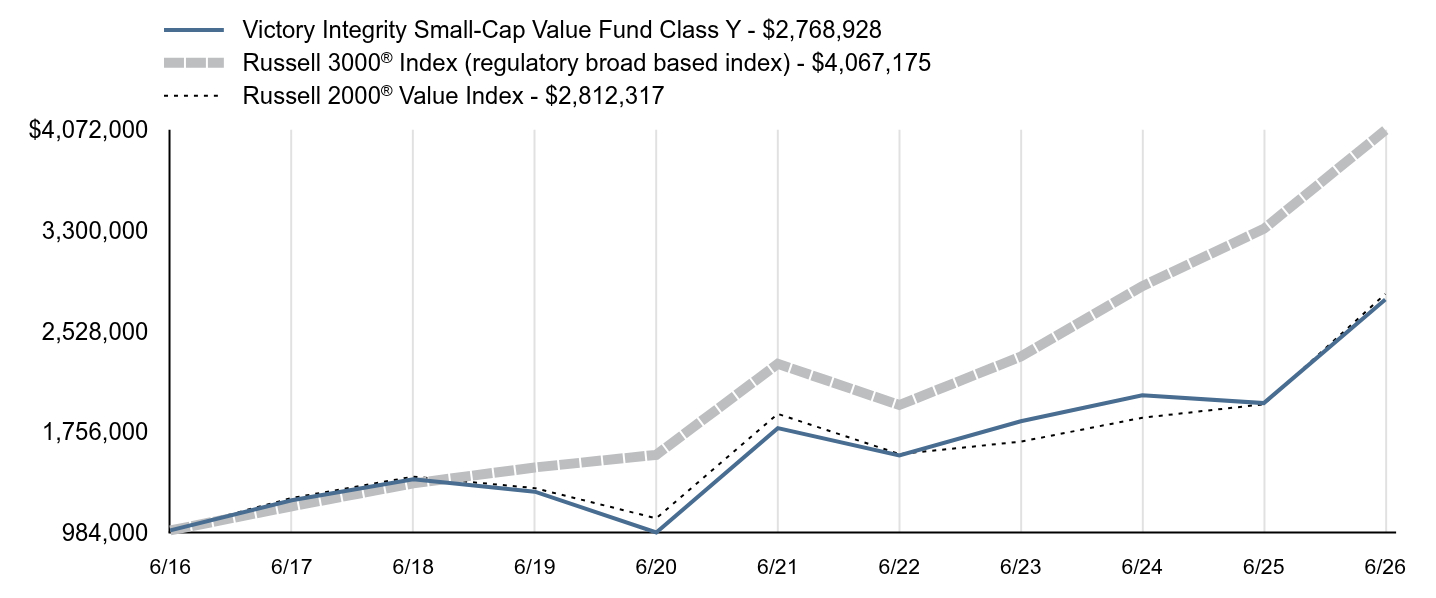
Table Summary | Victory Integrity Small-Cap Value Fund Class A @ NAV - $26,651 | Victory Integrity Small-Cap Value Fund Class A @ MOP - $25,122 | Russell 3000® Index (regulatory broad based index) - $40,672 | Russell 2000® Value Index - $28,123 |
|---|
6/16 | $10,000 | $9,426 | $10,000 | $10,000 |
|---|
6/17 | $12,272 | $11,568 | $11,851 | $12,486 |
|---|
6/18 | $13,813 | $13,020 | $13,602 | $14,121 |
|---|
6/19 | $12,823 | $12,088 | $14,824 | $13,241 |
|---|
6/20 | $9,704 | $9,147 | $15,792 | $10,927 |
|---|
6/21 | $17,507 | $16,502 | $22,767 | $18,934 |
|---|
6/22 | $15,383 | $14,500 | $19,610 | $15,851 |
|---|
6/23 | $17,879 | $16,854 | $23,327 | $16,803 |
|---|
6/24 | $19,742 | $18,610 | $28,721 | $18,634 |
|---|
6/25 | $19,088 | $17,993 | $33,114 | $19,666 |
|---|
6/26 | $26,651 | $25,122 | $40,672 | $28,123 |
|---|
|
| Average Annual Return [Table Text Block] |
Table Summary | 1 Year | 5 Year | 10 Year |
|---|
Class A @ NAV | 39.62%Footnote Reference | 8.77% | 10.30% |
|---|
Class A @ MOP | 31.58% | 7.49% | 9.65% |
|---|
Russell 3000® Index | 22.82% | 12.31% | 15.06% |
|---|
Russell 2000® Value Index | 43.01% | 8.23% | 10.89% |
|---|
|
| No Deduction of Taxes [Text Block] |
The graph and table total returns do not reflect the deduction of taxes that a shareholder would pay on Fund distributions, or redemption of shares.
|
| Previous Investment Adviser [Text Block] |
The maximum offering price (“MOP”) figures reflect a maximum sales charge of 5.75% for Class A. The Net Asset Value ("NAV") figures do not reflect sales charges.
|
| AssetsNet |
$ 1,148,547,000
|
| Holdings Count | Holding |
130
|
| Advisory Fees Paid, Amount |
$ 9,106,000
|
| InvestmentCompanyPortfolioTurnover |
45.00%
|
| Additional Fund Statistics [Text Block] |
FUND STATISTICS($ amounts in 000s)(as of June 30, 2026)Table SummaryNet Assets | $1,148,547 |
|---|
Number of Holdings | 130 |
|---|
Investment Advisory Fees | $9,106 |
|---|
Portfolio Turnover | 45% |
|---|
|
| Holdings [Text Block] |
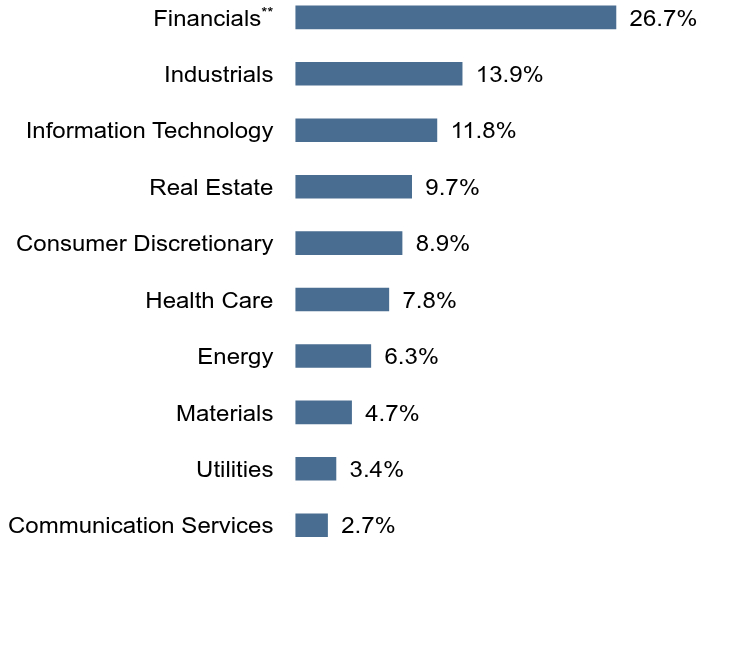
Top SectorsFootnote Reference* (% of Net Assets)Footnote Reference(as of June 30, 2026)Table SummaryValue | Value |
|---|
Communication Services | 2.7% | Utilities | 3.4% | Materials | 4.7% | Energy | 6.3% | Health Care | 7.8% | Consumer Discretionary | 8.9% | Real Estate | 9.7% | Information Technology | 11.8% | Industrials | 13.9% | FinancialsFootnote Reference** | 26.7% | Top 10 HoldingsFootnote Reference* (% of Net Assets)Footnote Reference(as of June 30, 2026)Table SummaryCommerce Bancshares, Inc. | 1.3% |
|---|
The Chefs' Warehouse, Inc. | 1.2% |
|---|
Glacier Bancorp, Inc. | 1.2% |
|---|
Hancock Whitney Corp. | 1.2% |
|---|
M/I Homes, Inc. | 1.2% |
|---|
Essent Group Ltd. | 1.1% |
|---|
Ameris Bancorp | 1.1% |
|---|
The Timken Co. | 1.1% |
|---|
CVB Financial Corp. | 1.1% |
|---|
Curbline Properties Corp. | 1.1% |
|---|
|
| C000144978 |
|
| Shareholder Report [Line Items] |
|
| Fund Name |
Victory Integrity Small-Cap Value Fund
|
| Class Name |
Class C
|
| Trading Symbol |
MCVSX
|
| Annual or Semi-Annual Statement [Text Block] |
Annual Shareholder Report
|
| Additional Information [Text Block] |
You can find additional information about the Fund at advisor.vcm.com/literature/mutual-fund-prospectuses. You may also request more information by calling 800-539-3863 or visiting vcm.com/contact-us.
|
| Additional Information Phone Number |
800-539-3863
|
| Additional Information Website |
vcm.com
|
| Expenses [Text Block] |
What were the Fund's costs for the last year?(based on a hypothetical $10,000 investment) Table SummaryClass Name | Costs of a $10,000 Investment | Costs paid as a percentage of a $10,000 Investment |
|---|
Class C | $280 | 2.35% |
|---|
| | |
|---|
|
| Expenses Paid, Amount |
$ 280
|
| Expense Ratio, Percent |
2.35%
|
| Factors Affecting Performance [Text Block] |
What affected the Fund’s performance during the last year?For the fiscal year ended June 30, 2026, the Fund underperformed its benchmark, the Russell 2000® Value Index (the “Index”). Over the last 12 months, U.S. equity market reactions to the Federal Reserve’s interest rate policy, all things related to AI, and geopolitical turmoil were large headline factors. Equities continued to make all-time highs in the second half of 2025 on the heels of earnings momentum and continued signs of runway for the AI secular growth theme. 2025 came to a close with muted results in December driven by a late-month rotation out of AI/technology stocks, profit taking, and uncertainty on the pace of future Federal Reserve interest rate cuts in 2026. As the calendar turned to 2026, the first quarter of the year was defined by a sharp transition from early-year momentum to late-quarter volatility, primarily driven by a significant geopolitical shock and shifting interest rate expectations. After starting the year with modest gains in January, major indices sold off in March as conflict in the Middle East sparked a massive spike in oil prices, reigniting inflation fears. U.S. equity markets saw a powerful 2026 second quarter advance fueled by robust momentum in AI-related technology sectors, strong corporate earnings, and easing geopolitical concerns surrounding the U.S.-Iran conflict. While the early gains were led by large-cap growth, the rally ultimately broadened to include value and small-cap benchmarks. For the one-year period ending June 30, 2026, small value stocks outperformed small growth stocks. Top contributors to performance: Information technology, health care, and communication services were the top-performing sectors within the Index. The information technology, consumer discretionary, and utilities sectors were the largest positive contributors to the Fund’s performance. Sector weights were modestly positive on the Fund’s performance relative to the Index largely due to our overweight to information technology.
Top detractors from performance: Utilities and consumer staples were the worst-performing sectors within the Index. Security selection in the health care, financials, and communication services sectors was the largest detractor from the Fund’s performance. The Fund’s lower-volatility and larger-market-capitalization exposures relative to the Index were style headwinds.
|
| Performance Past Does Not Indicate Future [Text] |
The investment return and principal value will fluctuate so that an investor's shares, when redeemed, may be worth more or less than the original cost. Past performance is not a good predictor of the Fund's future performance.
|
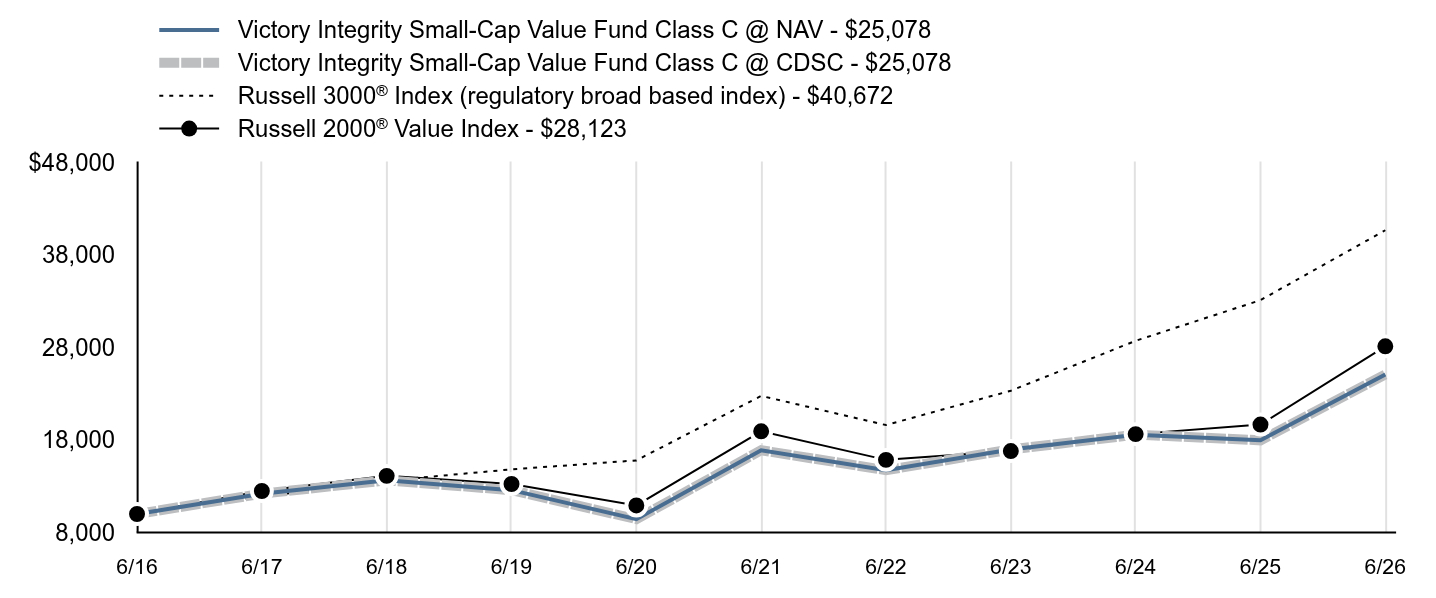
| Line Graph [Table Text Block] |
Table Summary | Victory Integrity Small-Cap Value Fund Class C @ NAV - $25,078 | Victory Integrity Small-Cap Value Fund Class C @ CDSC - $25,078 | Russell 3000® Index (regulatory broad based index) - $40,672 | Russell 2000® Value Index - $28,123 |
|---|
6/16 | $10,000 | $10,000 | $10,000 | $10,000 |
|---|
6/17 | $12,192 | $12,192 | $11,851 | $12,486 |
|---|
6/18 | $13,639 | $13,639 | $13,602 | $14,121 |
|---|
6/19 | $12,577 | $12,577 | $14,824 | $13,241 |
|---|
6/20 | $9,444 | $9,444 | $15,792 | $10,927 |
|---|
6/21 | $16,891 | $16,891 | $22,767 | $18,934 |
|---|
6/22 | $14,734 | $14,734 | $19,610 | $15,851 |
|---|
6/23 | $16,978 | $16,978 | $23,327 | $16,803 |
|---|
6/24 | $18,577 | $18,577 | $28,721 | $18,634 |
|---|
6/25 | $17,962 | $17,962 | $33,114 | $19,666 |
|---|
6/26 | $25,078 | $25,078 | $40,672 | $28,123 |
|---|
|
| Average Annual Return [Table Text Block] |
Table Summary | 1 Year | 5 Year | 10 Year |
|---|
Class C @ NAV | 38.31%Footnote Reference | 7.81% | 9.63% |
|---|
Class C @ CDSC | 37.31% | 7.81% | 9.63% |
|---|
Russell 3000® Index | 22.82% | 12.31% | 15.06% |
|---|
Russell 2000® Value Index | 43.01% | 8.23% | 10.89% |
|---|
|
| No Deduction of Taxes [Text Block] |
The graph and table total returns do not reflect the deduction of taxes that a shareholder would pay on Fund distributions, or redemption of shares.
|
| Previous Investment Adviser [Text Block] |
Class C is not subject to an initial sales charge, but is subject to Contingent Deferred Sales Charge (“CDSC”) of 1.00% on shares redeemed within one year of purchase. The Net Asset Value ("NAV") figures do not reflect sales charges.
|
| AssetsNet |
$ 1,148,547,000
|
| Holdings Count | Holding |
130
|
| Advisory Fees Paid, Amount |
$ 9,106,000
|
| InvestmentCompanyPortfolioTurnover |
45.00%
|
| Additional Fund Statistics [Text Block] |
FUND STATISTICS($ amounts in 000s)(as of June 30, 2026)Table SummaryNet Assets | $1,148,547 |
|---|
Number of Holdings | 130 |
|---|
Investment Advisory Fees | $9,106 |
|---|
Portfolio Turnover | 45% |
|---|
|
| Holdings [Text Block] |
Top SectorsFootnote Reference* (% of Net Assets)Footnote Reference(as of June 30, 2026)Table SummaryValue | Value |
|---|
Communication Services | 2.7% | Utilities | 3.4% | Materials | 4.7% | Energy | 6.3% | Health Care | 7.8% | Consumer Discretionary | 8.9% | Real Estate | 9.7% | Information Technology | 11.8% | Industrials | 13.9% | FinancialsFootnote Reference** | 26.7% | Top 10 HoldingsFootnote Reference* (% of Net Assets)Footnote Reference(as of June 30, 2026)Table SummaryCommerce Bancshares, Inc. | 1.3% |
|---|
The Chefs' Warehouse, Inc. | 1.2% |
|---|
Glacier Bancorp, Inc. | 1.2% |
|---|
Hancock Whitney Corp. | 1.2% |
|---|
M/I Homes, Inc. | 1.2% |
|---|
Essent Group Ltd. | 1.1% |
|---|
Ameris Bancorp | 1.1% |
|---|
The Timken Co. | 1.1% |
|---|
CVB Financial Corp. | 1.1% |
|---|
Curbline Properties Corp. | 1.1% |
|---|
|
| C000144979 |
|
| Shareholder Report [Line Items] |
|
| Fund Name |
Victory Integrity Small-Cap Value Fund
|
| Class Name |
Class R
|
| Trading Symbol |
MRVSX
|
| Annual or Semi-Annual Statement [Text Block] |
Annual Shareholder Report
|
| Additional Information [Text Block] |
You can find additional information about the Fund at advisor.vcm.com/literature/mutual-fund-prospectuses. You may also request more information by calling 800-539-3863 or visiting vcm.com/contact-us.
|
| Additional Information Phone Number |
800-539-3863
|
| Additional Information Website |
vcm.com
|
| Expenses [Text Block] |
What were the Fund's costs for the last year?(based on a hypothetical $10,000 investment) Table SummaryClass Name | Costs of a $10,000 Investment | Costs paid as a percentage of a $10,000 Investment |
|---|
Class R | $209 | 1.75% |
|---|
| | |
|---|
|
| Expenses Paid, Amount |
$ 209
|
| Expense Ratio, Percent |
1.75%
|
| Factors Affecting Performance [Text Block] |
What affected the Fund’s performance during the last year?For the fiscal year ended June 30, 2026, the Fund underperformed its benchmark, the Russell 2000® Value Index (the “Index”). Over the last 12 months, U.S. equity market reactions to the Federal Reserve’s interest rate policy, all things related to AI, and geopolitical turmoil were large headline factors. Equities continued to make all-time highs in the second half of 2025 on the heels of earnings momentum and continued signs of runway for the AI secular growth theme. 2025 came to a close with muted results in December driven by a late-month rotation out of AI/technology stocks, profit taking, and uncertainty on the pace of future Federal Reserve interest rate cuts in 2026. As the calendar turned to 2026, the first quarter of the year was defined by a sharp transition from early-year momentum to late-quarter volatility, primarily driven by a significant geopolitical shock and shifting interest rate expectations. After starting the year with modest gains in January, major indices sold off in March as conflict in the Middle East sparked a massive spike in oil prices, reigniting inflation fears. U.S. equity markets saw a powerful 2026 second quarter advance fueled by robust momentum in AI-related technology sectors, strong corporate earnings, and easing geopolitical concerns surrounding the U.S.-Iran conflict. While the early gains were led by large-cap growth, the rally ultimately broadened to include value and small-cap benchmarks. For the one-year period ending June 30, 2026, small value stocks outperformed small growth stocks. Top contributors to performance: Information technology, health care, and communication services were the top-performing sectors within the Index. The information technology, consumer discretionary, and utilities sectors were the largest positive contributors to the Fund’s performance. Sector weights were modestly positive on the Fund’s performance relative to the Index largely due to our overweight to information technology.
Top detractors from performance: Utilities and consumer staples were the worst-performing sectors within the Index. Security selection in the health care, financials, and communication services sectors was the largest detractor from the Fund’s performance. The Fund’s lower-volatility and larger-market-capitalization exposures relative to the Index were style headwinds.
|
| Performance Past Does Not Indicate Future [Text] |
The investment return and principal value will fluctuate so that an investor's shares, when redeemed, may be worth more or less than the original cost. Past performance is not a good predictor of the Fund's future performance.
|
| Line Graph [Table Text Block] |
Table Summary | Victory Integrity Small-Cap Value Fund Class R - $25,915 | Russell 3000® Index (regulatory broad based index) - $40,672 | Russell 2000® Value Index - $28,123 |
|---|
6/16 | $10,000 | $10,000 | $10,000 |
|---|
6/17 | $12,242 | $11,851 | $12,486 |
|---|
6/18 | $13,746 | $13,602 | $14,121 |
|---|
6/19 | $12,730 | $14,824 | $13,241 |
|---|
6/20 | $9,606 | $15,792 | $10,927 |
|---|
6/21 | $17,283 | $22,767 | $18,934 |
|---|
6/22 | $15,154 | $19,610 | $15,851 |
|---|
6/23 | $17,558 | $23,327 | $16,803 |
|---|
6/24 | $19,324 | $28,721 | $18,634 |
|---|
6/25 | $18,623 | $33,114 | $19,666 |
|---|
6/26 | $25,915 | $40,672 | $28,123 |
|---|
|
| Average Annual Return [Table Text Block] |
Table Summary | 1 Year | 5 Year | 10 Year |
|---|
Class R | 39.16%Footnote Reference | 8.44% | 9.99% |
|---|
Russell 3000® Index | 22.82% | 12.31% | 15.06% |
|---|
Russell 2000® Value Index | 43.01% | 8.23% | 10.89% |
|---|
|
| No Deduction of Taxes [Text Block] |
The graph and table total returns do not reflect the deduction of taxes that a shareholder would pay on Fund distributions, or redemption of shares.
|
| AssetsNet |
$ 1,148,547,000
|
| Holdings Count | Holding |
130
|
| Advisory Fees Paid, Amount |
$ 9,106,000
|
| InvestmentCompanyPortfolioTurnover |
45.00%
|
| Additional Fund Statistics [Text Block] |
FUND STATISTICS($ amounts in 000s)(as of June 30, 2026)Table SummaryNet Assets | $1,148,547 |
|---|
Number of Holdings | 130 |
|---|
Investment Advisory Fees | $9,106 |
|---|
Portfolio Turnover | 45% |
|---|
|
| Holdings [Text Block] |
Top SectorsFootnote Reference* (% of Net Assets)Footnote Reference(as of June 30, 2026)Table SummaryValue | Value |
|---|
Communication Services | 2.7% | Utilities | 3.4% | Materials | 4.7% | Energy | 6.3% | Health Care | 7.8% | Consumer Discretionary | 8.9% | Real Estate | 9.7% | Information Technology | 11.8% | Industrials | 13.9% | FinancialsFootnote Reference** | 26.7% | Top 10 HoldingsFootnote Reference* (% of Net Assets)Footnote Reference(as of June 30, 2026)Table SummaryCommerce Bancshares, Inc. | 1.3% |
|---|
The Chefs' Warehouse, Inc. | 1.2% |
|---|
Glacier Bancorp, Inc. | 1.2% |
|---|
Hancock Whitney Corp. | 1.2% |
|---|
M/I Homes, Inc. | 1.2% |
|---|
Essent Group Ltd. | 1.1% |
|---|
Ameris Bancorp | 1.1% |
|---|
The Timken Co. | 1.1% |
|---|
CVB Financial Corp. | 1.1% |
|---|
Curbline Properties Corp. | 1.1% |
|---|
|
| C000144980 |
|
| Shareholder Report [Line Items] |
|
| Fund Name |
Victory Integrity Small-Cap Value Fund
|
| Class Name |
Class R6
|
| Trading Symbol |
MVSSX
|
| Annual or Semi-Annual Statement [Text Block] |
Annual Shareholder Report
|
| Additional Information [Text Block] |
You can find additional information about the Fund at advisor.vcm.com/literature/mutual-fund-prospectuses. You may also request more information by calling 800-539-3863 or visiting vcm.com/contact-us.
|
| Additional Information Phone Number |
800-539-3863
|
| Additional Information Website |
vcm.com
|
| Expenses [Text Block] |
What were the Fund's costs for the last year?(based on a hypothetical $10,000 investment) Table SummaryClass Name | Costs of a $10,000 Investment | Costs paid as a percentage of a $10,000 Investment |
|---|
Class R6 | $113 | 0.94% |
|---|
| | |
|---|
|
| Expenses Paid, Amount |
$ 113
|
| Expense Ratio, Percent |
0.94%
|
| Factors Affecting Performance [Text Block] |
What affected the Fund’s performance during the last year?For the fiscal year ended June 30, 2026, the Fund underperformed its benchmark, the Russell 2000® Value Index (the “Index”). Over the last 12 months, U.S. equity market reactions to the Federal Reserve’s interest rate policy, all things related to AI, and geopolitical turmoil were large headline factors. Equities continued to make all-time highs in the second half of 2025 on the heels of earnings momentum and continued signs of runway for the AI secular growth theme. 2025 came to a close with muted results in December driven by a late-month rotation out of AI/technology stocks, profit taking, and uncertainty on the pace of future Federal Reserve interest rate cuts in 2026. As the calendar turned to 2026, the first quarter of the year was defined by a sharp transition from early-year momentum to late-quarter volatility, primarily driven by a significant geopolitical shock and shifting interest rate expectations. After starting the year with modest gains in January, major indices sold off in March as conflict in the Middle East sparked a massive spike in oil prices, reigniting inflation fears. U.S. equity markets saw a powerful 2026 second quarter advance fueled by robust momentum in AI-related technology sectors, strong corporate earnings, and easing geopolitical concerns surrounding the U.S.-Iran conflict. While the early gains were led by large-cap growth, the rally ultimately broadened to include value and small-cap benchmarks. For the one-year period ending June 30, 2026, small value stocks outperformed small growth stocks. Top contributors to performance: Information technology, health care, and communication services were the top-performing sectors within the Index. The information technology, consumer discretionary, and utilities sectors were the largest positive contributors to the Fund’s performance. Sector weights were modestly positive on the Fund’s performance relative to the Index largely due to our overweight to information technology.
Top detractors from performance: Utilities and consumer staples were the worst-performing sectors within the Index. Security selection in the health care, financials, and communication services sectors was the largest detractor from the Fund’s performance. The Fund’s lower-volatility and larger-market-capitalization exposures relative to the Index were style headwinds.
|
| Performance Past Does Not Indicate Future [Text] |
The investment return and principal value will fluctuate so that an investor's shares, when redeemed, may be worth more or less than the original cost. Past performance is not a good predictor of the Fund's future performance.
|
| Line Graph [Table Text Block] |
Table Summary | Victory Integrity Small-Cap Value Fund Class R6 - $28,055 | Russell 3000® Index (regulatory broad based index) - $40,672 | Russell 2000® Value Index - $28,123 |
|---|
6/16 | $10,000 | $10,000 | $10,000 |
|---|
6/17 | $12,340 | $11,851 | $12,486 |
|---|
6/18 | $13,966 | $13,602 | $14,121 |
|---|
6/19 | $13,034 | $14,824 | $13,241 |
|---|
6/20 | $9,913 | $15,792 | $10,927 |
|---|
6/21 | $17,984 | $22,767 | $18,934 |
|---|
6/22 | $15,892 | $19,610 | $15,851 |
|---|
6/23 | $18,559 | $23,327 | $16,803 |
|---|
6/24 | $20,589 | $28,721 | $18,634 |
|---|
6/25 | $20,001 | $33,114 | $19,666 |
|---|
6/26 | $28,055 | $40,672 | $28,123 |
|---|
|
| Average Annual Return [Table Text Block] |
Table Summary | 1 Year | 5 Year | 10 Year |
|---|
Class R6 | 40.27%Footnote Reference | 9.30% | 10.87% |
|---|
Russell 3000® Index | 22.82% | 12.31% | 15.06% |
|---|
Russell 2000® Value Index | 43.01% | 8.23% | 10.89% |
|---|
|
| No Deduction of Taxes [Text Block] |
The graph and table total returns do not reflect the deduction of taxes that a shareholder would pay on Fund distributions, or redemption of shares.
|
| AssetsNet |
$ 1,148,547,000
|
| Holdings Count | Holding |
130
|
| Advisory Fees Paid, Amount |
$ 9,106,000
|
| InvestmentCompanyPortfolioTurnover |
45.00%
|
| Additional Fund Statistics [Text Block] |
FUND STATISTICS($ amounts in 000s)(as of June 30, 2026)Table SummaryNet Assets | $1,148,547 |
|---|
Number of Holdings | 130 |
|---|
Investment Advisory Fees | $9,106 |
|---|
Portfolio Turnover | 45% |
|---|
|
| Holdings [Text Block] |
Top SectorsFootnote Reference* (% of Net Assets)Footnote Reference(as of June 30, 2026)Table SummaryValue | Value |
|---|
Communication Services | 2.7% | Utilities | 3.4% | Materials | 4.7% | Energy | 6.3% | Health Care | 7.8% | Consumer Discretionary | 8.9% | Real Estate | 9.7% | Information Technology | 11.8% | Industrials | 13.9% | FinancialsFootnote Reference** | 26.7% | Top 10 HoldingsFootnote Reference* (% of Net Assets)Footnote Reference(as of June 30, 2026)Table SummaryCommerce Bancshares, Inc. | 1.3% |
|---|
The Chefs' Warehouse, Inc. | 1.2% |
|---|
Glacier Bancorp, Inc. | 1.2% |
|---|
Hancock Whitney Corp. | 1.2% |
|---|
M/I Homes, Inc. | 1.2% |
|---|
Essent Group Ltd. | 1.1% |
|---|
Ameris Bancorp | 1.1% |
|---|
The Timken Co. | 1.1% |
|---|
CVB Financial Corp. | 1.1% |
|---|
Curbline Properties Corp. | 1.1% |
|---|
|
| C000144981 |
|
| Shareholder Report [Line Items] |
|
| Fund Name |
Victory Integrity Small-Cap Value Fund
|
| Class Name |
Class Y
|
| Trading Symbol |
VSVIX
|
| Annual or Semi-Annual Statement [Text Block] |
Annual Shareholder Report
|
| Additional Information [Text Block] |
You can find additional information about the Fund at advisor.vcm.com/literature/mutual-fund-prospectuses. You may also request more information by calling 800-539-3863 or visiting vcm.com/contact-us.
|
| Additional Information Phone Number |
800-539-3863
|
| Additional Information Website |
vcm.com
|
| Expenses [Text Block] |
What were the Fund's costs for the last year?(based on a hypothetical $10,000 investment) Table SummaryClass Name | Costs of a $10,000 Investment | Costs paid as a percentage of a $10,000 Investment |
|---|
Class Y | $126 | 1.05% |
|---|
| | |
|---|
|
| Expenses Paid, Amount |
$ 126
|
| Expense Ratio, Percent |
1.05%
|
| Factors Affecting Performance [Text Block] |
What affected the Fund’s performance during the last year?For the fiscal year ended June 30, 2026, the Fund underperformed its benchmark, the Russell 2000® Value Index (the “Index”). Over the last 12 months, U.S. equity market reactions to the Federal Reserve’s interest rate policy, all things related to AI, and geopolitical turmoil were large headline factors. Equities continued to make all-time highs in the second half of 2025 on the heels of earnings momentum and continued signs of runway for the AI secular growth theme. 2025 came to a close with muted results in December driven by a late-month rotation out of AI/technology stocks, profit taking, and uncertainty on the pace of future Federal Reserve interest rate cuts in 2026. As the calendar turned to 2026, the first quarter of the year was defined by a sharp transition from early-year momentum to late-quarter volatility, primarily driven by a significant geopolitical shock and shifting interest rate expectations. After starting the year with modest gains in January, major indices sold off in March as conflict in the Middle East sparked a massive spike in oil prices, reigniting inflation fears. U.S. equity markets saw a powerful 2026 second quarter advance fueled by robust momentum in AI-related technology sectors, strong corporate earnings, and easing geopolitical concerns surrounding the U.S.-Iran conflict. While the early gains were led by large-cap growth, the rally ultimately broadened to include value and small-cap benchmarks. For the one-year period ending June 30, 2026, small value stocks outperformed small growth stocks. Top contributors to performance: Information technology, health care, and communication services were the top-performing sectors within the Index. The information technology, consumer discretionary, and utilities sectors were the largest positive contributors to the Fund’s performance. Sector weights were modestly positive on the Fund’s performance relative to the Index largely due to our overweight to information technology.
Top detractors from performance: Utilities and consumer staples were the worst-performing sectors within the Index. Security selection in the health care, financials, and communication services sectors was the largest detractor from the Fund’s performance. The Fund’s lower-volatility and larger-market-capitalization exposures relative to the Index were style headwinds.
|
| Performance Past Does Not Indicate Future [Text] |
The investment return and principal value will fluctuate so that an investor's shares, when redeemed, may be worth more or less than the original cost. Past performance is not a good predictor of the Fund's future performance.
|
| Line Graph [Table Text Block] |
Table Summary | Victory Integrity Small-Cap Value Fund Class Y - $2,768,928 | Russell 3000® Index (regulatory broad based index) - $4,067,175 | Russell 2000® Value Index - $2,812,317 |
|---|
6/16 | $1,000,000 | $1,000,000 | $1,000,000 |
|---|
6/17 | $1,231,376 | $1,185,095 | $1,248,570 |
|---|
6/18 | $1,391,527 | $1,360,229 | $1,412,122 |
|---|
6/19 | $1,296,429 | $1,482,412 | $1,324,070 |
|---|
6/20 | $984,765 | $1,579,207 | $1,092,663 |
|---|
6/21 | $1,783,711 | $2,276,654 | $1,893,362 |
|---|
6/22 | $1,574,622 | $1,960,982 | $1,585,114 |
|---|
6/23 | $1,836,827 | $2,332,660 | $1,680,340 |
|---|
6/24 | $2,035,994 | $2,872,090 | $1,863,426 |
|---|
6/25 | $1,975,780 | $3,311,398 | $1,966,573 |
|---|
6/26 | $2,768,928 | $4,067,175 | $2,812,317 |
|---|
|
| Average Annual Return [Table Text Block] |
Table Summary | 1 Year | 5 Year | 10 Year |
|---|
Class Y | 40.14%Footnote Reference | 9.19% | 10.72% |
|---|
Russell 3000® Index | 22.82% | 12.31% | 15.06% |
|---|
Russell 2000® Value Index | 43.01% | 8.23% | 10.89% |
|---|
|
| No Deduction of Taxes [Text Block] |
The graph and table total returns do not reflect the deduction of taxes that a shareholder would pay on Fund distributions, or redemption of shares.
|
| AssetsNet |
$ 1,148,547,000
|
| Holdings Count | Holding |
130
|
| Advisory Fees Paid, Amount |
$ 9,106,000
|
| InvestmentCompanyPortfolioTurnover |
45.00%
|
| Additional Fund Statistics [Text Block] |
FUND STATISTICS($ amounts in 000s)(as of June 30, 2026)Table SummaryNet Assets | $1,148,547 |
|---|
Number of Holdings | 130 |
|---|
Investment Advisory Fees | $9,106 |
|---|
Portfolio Turnover | 45% |
|---|
|
| Holdings [Text Block] |
Top SectorsFootnote Reference* (% of Net Assets)Footnote Reference(as of June 30, 2026)Table SummaryValue | Value |
|---|
Communication Services | 2.7% | Utilities | 3.4% | Materials | 4.7% | Energy | 6.3% | Health Care | 7.8% | Consumer Discretionary | 8.9% | Real Estate | 9.7% | Information Technology | 11.8% | Industrials | 13.9% | FinancialsFootnote Reference** | 26.7% | Top 10 HoldingsFootnote Reference* (% of Net Assets)Footnote Reference(as of June 30, 2026)Table SummaryCommerce Bancshares, Inc. | 1.3% |
|---|
The Chefs' Warehouse, Inc. | 1.2% |
|---|
Glacier Bancorp, Inc. | 1.2% |
|---|
Hancock Whitney Corp. | 1.2% |
|---|
M/I Homes, Inc. | 1.2% |
|---|
Essent Group Ltd. | 1.1% |
|---|
Ameris Bancorp | 1.1% |
|---|
The Timken Co. | 1.1% |
|---|
CVB Financial Corp. | 1.1% |
|---|
Curbline Properties Corp. | 1.1% |
|---|
|
| C000144993 |
|
| Shareholder Report [Line Items] |
|
| Fund Name |
Victory Integrity Small/Mid-Cap Value Fund
|
| Class Name |
Class A
|
| Trading Symbol |
MAISX
|
| Annual or Semi-Annual Statement [Text Block] |
Annual Shareholder Report
|
| Additional Information [Text Block] |
You can find additional information about the Fund at advisor.vcm.com/literature/ mutual-fund-prospectuses. You may also request more information by calling 800-539-3863 or visiting vcm.com/contact-us.
|
| Additional Information Phone Number |
800-539-3863
|
| Additional Information Website |
vcm.com
|
| Expenses [Text Block] |
What were the Fund's costs for the last year?(based on a hypothetical $10,000 investment) Table SummaryClass Name | Costs of a $10,000 Investment | Costs paid as a percentage of a $10,000 Investment |
|---|
Class A | $131 | 1.13% |
|---|
| | |
|---|
|
| Expenses Paid, Amount |
$ 131
|
| Expense Ratio, Percent |
1.13%
|
| Factors Affecting Performance [Text Block] |
What affected the Fund’s performance during the last year?For the fiscal year ended June 30, 2026, the Fund underperformed its benchmark, the Russell 2500TM Value Index (the “Index”). Over the last 12 months, U.S. equity market reactions to the Federal Reserve’s interest rate policy, all things related to AI, and geopolitical turmoil were large headline factors. Equities continued to make all-time highs in the second half of 2025 on the heels of earnings momentum and continued signs of runway for the AI secular growth theme. 2025 came to a close with muted results in December driven by a late-month rotation out of AI/technology stocks, profit taking, and uncertainty on the pace of future Federal Reserve interest rate cuts in 2026. As the calendar turned to 2026, the first quarter of the year was defined by a sharp transition from early-year momentum to late-quarter volatility, primarily driven by a significant geopolitical shock and shifting interest rate expectations. After starting the year with modest gains in January, major indices sold off in March as conflict in the Middle East sparked a massive spike in oil prices, reigniting inflation fears. U.S. equity markets saw a powerful 2026 second quarter advance fueled by robust momentum in AI-related technology sectors, strong corporate earnings, and easing geopolitical concerns surrounding the U.S.-Iran conflict. While the early gains were led by large-cap growth, the rally ultimately broadened to include value and small-cap benchmarks. For the one-year period ending June 30, 2026, small/mid-cap value stocks outperformed small/mid-cap growth stocks. Top contributors to performance: • From an Index perspective, information technology, health care, and energy were the top-performing sectors. • Consumer discretionary, industrials, and materials were the largest positive contributors to the Fund’s performance. Top detractors from performance: • From an Index perspective, consumer staples and consumer discretionary were the worst-performing sectors. • Security selection in information technology was the largest detractor to the Fund’s performance. • Sector weights were a drag on the Fund’s performance relative to the Index largely due to the Fund’s underweight in information technology. • The Fund’s lower volatility and higher-volume exposures relative to the Index were style headwinds. |
| Performance Past Does Not Indicate Future [Text] |
The investment return and principal value will fluctuate so that an investor's shares, when redeemed, may be worth more or less than the original cost. Past performance is not a good predictor of the Fund's future performance.
|
| Line Graph [Table Text Block] |
Table Summary | Victory Integrity Small/Mid-Cap Value Fund Class A @ NAV - $29,360 | Victory Integrity Small/Mid-Cap Value Fund Class A @ MOP - $27,670 | Russell 3000® Index (regulatory broad based index) - $40,672 | Russell 2500™ Value Index - $29,117 |
|---|
6/16 | $10,000 | $9,424 | $10,000 | $10,000 |
|---|
6/17 | $12,097 | $11,400 | $11,851 | $11,836 |
|---|
6/18 | $13,567 | $12,786 | $13,602 | $13,196 |
|---|
6/19 | $13,342 | $12,574 | $14,824 | $12,942 |
|---|
6/20 | $10,811 | $10,189 | $15,792 | $10,936 |
|---|
6/21 | $18,726 | $17,648 | $22,767 | $17,851 |
|---|
6/22 | $17,107 | $16,122 | $19,610 | $15,496 |
|---|
6/23 | $19,687 | $18,554 | $23,327 | $17,103 |
|---|
6/24 | $21,581 | $20,339 | $28,721 | $19,026 |
|---|
6/25 | $22,217 | $20,938 | $33,114 | $21,017 |
|---|
6/26 | $29,360 | $27,670 | $40,672 | $29,117 |
|---|
|
| Average Annual Return [Table Text Block] |
Table Summary | 1 Year | 5 Year | 10 Year |
|---|
Class A @ NAV | 32.15%Footnote Reference | 9.41% | 11.37% |
|---|
Class A @ MOP | 24.56% | 8.12% | 10.71% |
|---|
Russell 3000® Index | 22.82% | 12.31% | 15.06% |
|---|
Russell 2500™ Value Index | 38.54% | 10.28% | 11.28% |
|---|
|
| No Deduction of Taxes [Text Block] |
The graph and table total returns do not reflect the deduction of taxes that a shareholder would pay on Fund distributions, or redemption of shares.
|
| Previous Investment Adviser [Text Block] |
The maximum offering price (“MOP”) figures reflect a maximum sales charge of 5.75% for Class A. The Net Asset Value ("NAV") figures do not reflect sales charges.
|
| AssetsNet |
$ 371,664,000
|
| Holdings Count | Holding |
122
|
| Advisory Fees Paid, Amount |
$ 2,651,000
|
| InvestmentCompanyPortfolioTurnover |
50.00%
|
| Additional Fund Statistics [Text Block] |
FUND STATISTICS($ amounts in 000s)(as of June 30, 2026)Table SummaryNet Assets | $371,664 |
|---|
Number of Holdings | 122 |
|---|
Investment Advisory Fees | $2,651 |
|---|
Portfolio Turnover | 50% |
|---|
|
| Holdings [Text Block] |
Top SectorsFootnote Reference* (% of Net Assets)Footnote Reference(as of June 30, 2026)Table SummaryValue | Value |
|---|
Consumer Staples | 3.2% | Utilities | 3.5% | Energy | 4.2% | Materials | 6.2% | Consumer Discretionary | 8.0% | Real Estate | 8.7% | Health Care | 9.4% | Information Technology | 14.4% | Financials | 19.0% | Industrials | 20.0% | Top 10 HoldingsFootnote Reference* (% of Net Assets)Footnote Reference(as of June 30, 2026)Table SummaryValmont Industries, Inc. | 1.6% |
|---|
The Timken Co. | 1.5% |
|---|
Commerce Bancshares, Inc. | 1.4% |
|---|
MKS, Inc. | 1.3% |
|---|
F5, Inc. | 1.2% |
|---|
WESCO International, Inc. | 1.2% |
|---|
Sensata Technologies Holding PLC | 1.2% |
|---|
Camden Property Trust | 1.2% |
|---|
Textron, Inc. | 1.2% |
|---|
C.H. Robinson Worldwide, Inc. | 1.2% |
|---|
|
| C000155526 |
|
| Shareholder Report [Line Items] |
|
| Fund Name |
Victory Integrity Small/Mid-Cap Value Fund
|
| Class Name |
Class R6
|
| Trading Symbol |
MIRSX
|
| Annual or Semi-Annual Statement [Text Block] |
Annual Shareholder Report
|
| Additional Information [Text Block] |
You can find additional information about the Fund at advisor.vcm.com/literature/ mutual-fund-prospectuses. You may also request more information by calling 800-539-3863 or visiting vcm.com/contact-us.
|
| Additional Information Phone Number |
800-539-3863
|
| Additional Information Website |
vcm.com
|
| Expenses [Text Block] |
What were the Fund's costs for the last year?(based on a hypothetical $10,000 investment) Table SummaryClass Name | Costs of a $10,000 Investment | Costs paid as a percentage of a $10,000 Investment |
|---|
Class R6 | $96 | 0.83% |
|---|
| | |
|---|
|
| Expenses Paid, Amount |
$ 96
|
| Expense Ratio, Percent |
0.83%
|
| Factors Affecting Performance [Text Block] |
What affected the Fund’s performance during the last year?For the fiscal year ended June 30, 2026, the Fund underperformed its benchmark, the Russell 2500TM Value Index (the “Index”). Over the last 12 months, U.S. equity market reactions to the Federal Reserve’s interest rate policy, all things related to AI, and geopolitical turmoil were large headline factors. Equities continued to make all-time highs in the second half of 2025 on the heels of earnings momentum and continued signs of runway for the AI secular growth theme. 2025 came to a close with muted results in December driven by a late-month rotation out of AI/technology stocks, profit taking, and uncertainty on the pace of future Federal Reserve interest rate cuts in 2026. As the calendar turned to 2026, the first quarter of the year was defined by a sharp transition from early-year momentum to late-quarter volatility, primarily driven by a significant geopolitical shock and shifting interest rate expectations. After starting the year with modest gains in January, major indices sold off in March as conflict in the Middle East sparked a massive spike in oil prices, reigniting inflation fears. U.S. equity markets saw a powerful 2026 second quarter advance fueled by robust momentum in AI-related technology sectors, strong corporate earnings, and easing geopolitical concerns surrounding the U.S.-Iran conflict. While the early gains were led by large-cap growth, the rally ultimately broadened to include value and small-cap benchmarks. For the one-year period ending June 30, 2026, small/mid-cap value stocks outperformed small/mid-cap growth stocks. Top contributors to performance: • From an Index perspective, information technology, health care, and energy were the top-performing sectors. • Consumer discretionary, industrials, and materials were the largest positive contributors to the Fund’s performance. Top detractors from performance: • From an Index perspective, consumer staples and consumer discretionary were the worst-performing sectors. • Security selection in information technology was the largest detractor to the Fund’s performance. • Sector weights were a drag on the Fund’s performance relative to the Index largely due to the Fund’s underweight in information technology. • The Fund’s lower volatility and higher-volume exposures relative to the Index were style headwinds. |
| Performance Past Does Not Indicate Future [Text] |
The investment return and principal value will fluctuate so that an investor's shares, when redeemed, may be worth more or less than the original cost. Past performance is not a good predictor of the Fund's future performance.
|
| Line Graph [Table Text Block] |
Table Summary | Victory Integrity Small/Mid-Cap Value Fund Class R6 - $30,263 | Russell 3000® Index (regulatory broad based index) - $40,672 | Russell 2500™ Value Index - $29,117 |
|---|
6/16 | $10,000 | $10,000 | $10,000 |
|---|
6/17 | $12,135 | $11,851 | $11,836 |
|---|
6/18 | $13,656 | $13,602 | $13,196 |
|---|
6/19 | $13,467 | $14,824 | $12,942 |
|---|
6/20 | $10,948 | $15,792 | $10,936 |
|---|
6/21 | $19,015 | $22,767 | $17,851 |
|---|
6/22 | $17,421 | $19,610 | $15,496 |
|---|
6/23 | $20,115 | $23,327 | $17,103 |
|---|
6/24 | $22,122 | $28,721 | $19,026 |
|---|
6/25 | $22,844 | $33,114 | $21,017 |
|---|
6/26 | $30,263 | $40,672 | $29,117 |
|---|
|
| Average Annual Return [Table Text Block] |
Table Summary | 1 Year | 5 Year | 10 Year |
|---|
Class R6 | 32.48%Footnote Reference | 9.74% | 11.71% |
|---|
Russell 3000® Index | 22.82% | 12.31% | 15.06% |
|---|
Russell 2500™ Value Index | 38.54% | 10.28% | 11.28% |
|---|
|
| No Deduction of Taxes [Text Block] |
The graph and table total returns do not reflect the deduction of taxes that a shareholder would pay on Fund distributions, or redemption of shares.
|
| AssetsNet |
$ 371,664,000
|
| Holdings Count | Holding |
122
|
| Advisory Fees Paid, Amount |
$ 2,651,000
|
| InvestmentCompanyPortfolioTurnover |
50.00%
|
| Additional Fund Statistics [Text Block] |
FUND STATISTICS($ amounts in 000s)(as of June 30, 2026)Table SummaryNet Assets | $371,664 |
|---|
Number of Holdings | 122 |
|---|
Investment Advisory Fees | $2,651 |
|---|
Portfolio Turnover | 50% |
|---|
|
| Holdings [Text Block] |
Top SectorsFootnote Reference* (% of Net Assets)Footnote Reference(as of June 30, 2026)Table SummaryValue | Value |
|---|
Consumer Staples | 3.2% | Utilities | 3.5% | Energy | 4.2% | Materials | 6.2% | Consumer Discretionary | 8.0% | Real Estate | 8.7% | Health Care | 9.4% | Information Technology | 14.4% | Financials | 19.0% | Industrials | 20.0% | Top 10 HoldingsFootnote Reference* (% of Net Assets)Footnote Reference(as of June 30, 2026)Table SummaryValmont Industries, Inc. | 1.6% |
|---|
The Timken Co. | 1.5% |
|---|
Commerce Bancshares, Inc. | 1.4% |
|---|
MKS, Inc. | 1.3% |
|---|
F5, Inc. | 1.2% |
|---|
WESCO International, Inc. | 1.2% |
|---|
Sensata Technologies Holding PLC | 1.2% |
|---|
Camden Property Trust | 1.2% |
|---|
Textron, Inc. | 1.2% |
|---|
C.H. Robinson Worldwide, Inc. | 1.2% |
|---|
|
| C000144994 |
|
| Shareholder Report [Line Items] |
|
| Fund Name |
Victory Integrity Small/Mid-Cap Value Fund
|
| Class Name |
Class Y
|
| Trading Symbol |
MYISX
|
| Annual or Semi-Annual Statement [Text Block] |
Annual Shareholder Report
|
| Additional Information [Text Block] |
You can find additional information about the Fund at advisor.vcm.com/literature/ mutual-fund-prospectuses. You may also request more information by calling 800-539-3863 or visiting vcm.com/contact-us.
|
| Additional Information Phone Number |
800-539-3863
|
| Additional Information Website |
vcm.com
|
| Expenses [Text Block] |
What were the Fund's costs for the last year?(based on a hypothetical $10,000 investment) Table SummaryClass Name | Costs of a $10,000 Investment | Costs paid as a percentage of a $10,000 Investment |
|---|
Class Y | $102 | 0.88% |
|---|
| | |
|---|
|
| Expenses Paid, Amount |
$ 102
|
| Expense Ratio, Percent |
0.88%
|
| Factors Affecting Performance [Text Block] |
What affected the Fund’s performance during the last year?For the fiscal year ended June 30, 2026, the Fund underperformed its benchmark, the Russell 2500TM Value Index (the “Index”). Over the last 12 months, U.S. equity market reactions to the Federal Reserve’s interest rate policy, all things related to AI, and geopolitical turmoil were large headline factors. Equities continued to make all-time highs in the second half of 2025 on the heels of earnings momentum and continued signs of runway for the AI secular growth theme. 2025 came to a close with muted results in December driven by a late-month rotation out of AI/technology stocks, profit taking, and uncertainty on the pace of future Federal Reserve interest rate cuts in 2026. As the calendar turned to 2026, the first quarter of the year was defined by a sharp transition from early-year momentum to late-quarter volatility, primarily driven by a significant geopolitical shock and shifting interest rate expectations. After starting the year with modest gains in January, major indices sold off in March as conflict in the Middle East sparked a massive spike in oil prices, reigniting inflation fears. U.S. equity markets saw a powerful 2026 second quarter advance fueled by robust momentum in AI-related technology sectors, strong corporate earnings, and easing geopolitical concerns surrounding the U.S.-Iran conflict. While the early gains were led by large-cap growth, the rally ultimately broadened to include value and small-cap benchmarks. For the one-year period ending June 30, 2026, small/mid-cap value stocks outperformed small/mid-cap growth stocks. Top contributors to performance: • From an Index perspective, information technology, health care, and energy were the top-performing sectors. • Consumer discretionary, industrials, and materials were the largest positive contributors to the Fund’s performance. Top detractors from performance: • From an Index perspective, consumer staples and consumer discretionary were the worst-performing sectors. • Security selection in information technology was the largest detractor to the Fund’s performance. • Sector weights were a drag on the Fund’s performance relative to the Index largely due to the Fund’s underweight in information technology. • The Fund’s lower volatility and higher-volume exposures relative to the Index were style headwinds. |
| Performance Past Does Not Indicate Future [Text] |
The investment return and principal value will fluctuate so that an investor's shares, when redeemed, may be worth more or less than the original cost. Past performance is not a good predictor of the Fund's future performance.
|
| Line Graph [Table Text Block] |
Table Summary | Victory Integrity Small/Mid-Cap Value Fund Class Y - $3,010,999 | Russell 3000® Index (regulatory broad based index) - $4,067,175 | Russell 2500™ Value Index - $2,911,702 |
|---|
6/16 | $1,000,000 | $1,000,000 | $1,000,000 |
|---|
6/17 | $1,212,486 | $1,185,095 | $1,183,606 |
|---|
6/18 | $1,364,215 | $1,360,229 | $1,319,589 |
|---|
6/19 | $1,344,427 | $1,482,412 | $1,294,199 |
|---|
6/20 | $1,092,589 | $1,579,207 | $1,093,616 |
|---|
6/21 | $1,896,803 | $2,276,654 | $1,785,118 |
|---|
6/22 | $1,736,617 | $1,960,982 | $1,549,600 |
|---|
6/23 | $2,004,468 | $2,332,660 | $1,710,302 |
|---|
6/24 | $2,202,463 | $2,872,090 | $1,902,570 |
|---|
6/25 | $2,272,551 | $3,311,398 | $2,101,739 |
|---|
6/26 | $3,010,999 | $4,067,175 | $2,911,702 |
|---|
|
| Average Annual Return [Table Text Block] |
Table Summary | 1 Year | 5 Year | 10 Year |
|---|
Class Y | 32.49%Footnote Reference | 9.68% | 11.65% |
|---|
Russell 3000® Index | 22.82% | 12.31% | 15.06% |
|---|
Russell 2500™ Value Index | 38.54% | 10.28% | 11.28% |
|---|
|
| No Deduction of Taxes [Text Block] |
The graph and table total returns do not reflect the deduction of taxes that a shareholder would pay on Fund distributions, or redemption of shares.
|
| AssetsNet |
$ 371,664,000
|
| Holdings Count | Holding |
122
|
| Advisory Fees Paid, Amount |
$ 2,651,000
|
| InvestmentCompanyPortfolioTurnover |
50.00%
|
| Additional Fund Statistics [Text Block] |
FUND STATISTICS($ amounts in 000s)(as of June 30, 2026)Table SummaryNet Assets | $371,664 |
|---|
Number of Holdings | 122 |
|---|
Investment Advisory Fees | $2,651 |
|---|
Portfolio Turnover | 50% |
|---|
|
| Holdings [Text Block] |
Top SectorsFootnote Reference* (% of Net Assets)Footnote Reference(as of June 30, 2026)Table SummaryValue | Value |
|---|
Consumer Staples | 3.2% | Utilities | 3.5% | Energy | 4.2% | Materials | 6.2% | Consumer Discretionary | 8.0% | Real Estate | 8.7% | Health Care | 9.4% | Information Technology | 14.4% | Financials | 19.0% | Industrials | 20.0% | Top 10 HoldingsFootnote Reference* (% of Net Assets)Footnote Reference(as of June 30, 2026)Table SummaryValmont Industries, Inc. | 1.6% |
|---|
The Timken Co. | 1.5% |
|---|
Commerce Bancshares, Inc. | 1.4% |
|---|
MKS, Inc. | 1.3% |
|---|
F5, Inc. | 1.2% |
|---|
WESCO International, Inc. | 1.2% |
|---|
Sensata Technologies Holding PLC | 1.2% |
|---|
Camden Property Trust | 1.2% |
|---|
Textron, Inc. | 1.2% |
|---|
C.H. Robinson Worldwide, Inc. | 1.2% |
|---|
|
| C000219864 |
|
| Shareholder Report [Line Items] |
|
| Fund Name |
Victory Integrity Small/Mid-Cap Value Fund
|
| Class Name |
Member Class
|
| Trading Symbol |
MMMSX
|
| Annual or Semi-Annual Statement [Text Block] |
Annual Shareholder Report
|
| Additional Information [Text Block] |
You can find additional information about the Fund at advisor.vcm.com/literature/ mutual-fund-prospectuses. You may also request more information by calling 800-235-8396 or visiting vcm.com/contact-us.
|
| Additional Information Phone Number |
800-235-8396
|
| Additional Information Website |
vcm.com
|
| Expenses [Text Block] |
What were the Fund's costs for the last year?(based on a hypothetical $10,000 investment) Table SummaryClass Name | Costs of a $10,000 Investment | Costs paid as a percentage of a $10,000 Investment |
|---|
Member Class | $110 | 0.95% |
|---|
| | |
|---|
|
| Expenses Paid, Amount |
$ 110
|
| Expense Ratio, Percent |
0.95%
|
| Factors Affecting Performance [Text Block] |
What affected the Fund’s performance during the last year?For the fiscal year ended June 30, 2026, the Fund underperformed its benchmark, the Russell 2500TM Value Index (the “Index”). Over the last 12 months, U.S. equity market reactions to the Federal Reserve’s interest rate policy, all things related to AI, and geopolitical turmoil were large headline factors. Equities continued to make all-time highs in the second half of 2025 on the heels of earnings momentum and continued signs of runway for the AI secular growth theme. 2025 came to a close with muted results in December driven by a late-month rotation out of AI/technology stocks, profit taking, and uncertainty on the pace of future Federal Reserve interest rate cuts in 2026. As the calendar turned to 2026, the first quarter of the year was defined by a sharp transition from early-year momentum to late-quarter volatility, primarily driven by a significant geopolitical shock and shifting interest rate expectations. After starting the year with modest gains in January, major indices sold off in March as conflict in the Middle East sparked a massive spike in oil prices, reigniting inflation fears. U.S. equity markets saw a powerful 2026 second quarter advance fueled by robust momentum in AI-related technology sectors, strong corporate earnings, and easing geopolitical concerns surrounding the U.S.-Iran conflict. While the early gains were led by large-cap growth, the rally ultimately broadened to include value and small-cap benchmarks. For the one-year period ending June 30, 2026, small/mid-cap value stocks outperformed small/mid-cap growth stocks. Top contributors to performance: • From an Index perspective, information technology, health care, and energy were the top-performing sectors. • Consumer discretionary, industrials, and materials were the largest positive contributors to the Fund’s performance. Top detractors from performance: • From an Index perspective, consumer staples and consumer discretionary were the worst-performing sectors. • Security selection in information technology was the largest detractor to the Fund’s performance. • Sector weights were a drag on the Fund’s performance relative to the Index largely due to the Fund’s underweight in information technology. • The Fund’s lower volatility and higher-volume exposures relative to the Index were style headwinds. |
| Performance Past Does Not Indicate Future [Text] |
The investment return and principal value will fluctuate so that an investor's shares, when redeemed, may be worth more or less than the original cost. Past performance is not a good predictor of the Fund's future performance.
|
| Line Graph [Table Text Block] |
Table Summary | Victory Integrity Small/Mid-Cap Value Fund Member Class - $24,859 | Russell 3000® Index (regulatory broad based index) - $23,807 | Russell 2500™ Value Index - $24,555 |
|---|
11/20Footnote Reference* | $10,000 | $10,000 | $10,000 |
|---|
6/21 | $15,717 | $13,326 | $15,054 |
|---|
6/22 | $14,373 | $11,478 | $13,068 |
|---|
6/23 | $16,578 | $13,654 | $14,423 |
|---|
6/24 | $18,209 | $16,812 | $16,045 |
|---|
6/25 | $18,779 | $19,383 | $17,724 |
|---|
6/26 | $24,859 | $23,807 | $24,555 |
|---|
|
| Average Annual Return [Table Text Block] |
Table Summary | 1 Year | 5 Year | Since Inception |
|---|
Member Class | 32.38%Footnote Reference | 9.60% | 17.46%Footnote Reference |
|---|
Russell 3000® Index | 22.82% | 12.31% | 16.57% |
|---|
Russell 2500™ Value Index | 38.54% | 10.28% | 17.21% |
|---|
|
| No Deduction of Taxes [Text Block] |
The graph and table total returns do not reflect the deduction of taxes that a shareholder would pay on Fund distributions, or redemption of shares.
|
| AssetsNet |
$ 371,664,000
|
| Holdings Count | Holding |
122
|
| Advisory Fees Paid, Amount |
$ 2,651,000
|
| InvestmentCompanyPortfolioTurnover |
50.00%
|
| Additional Fund Statistics [Text Block] |
FUND STATISTICS($ amounts in 000s)(as of June 30, 2026)Table SummaryNet Assets | $371,664 |
|---|
Number of Holdings | 122 |
|---|
Investment Advisory Fees | $2,651 |
|---|
Portfolio Turnover | 50% |
|---|
|
| Holdings [Text Block] |
Top SectorsFootnote Reference* (% of Net Assets)Footnote Reference(as of June 30, 2026)Table SummaryValue | Value |
|---|
Consumer Staples | 3.2% | Utilities | 3.5% | Energy | 4.2% | Materials | 6.2% | Consumer Discretionary | 8.0% | Real Estate | 8.7% | Health Care | 9.4% | Information Technology | 14.4% | Financials | 19.0% | Industrials | 20.0% | Top 10 HoldingsFootnote Reference* (% of Net Assets)Footnote Reference(as of June 30, 2026)Table SummaryValmont Industries, Inc. | 1.6% |
|---|
The Timken Co. | 1.5% |
|---|
Commerce Bancshares, Inc. | 1.4% |
|---|
MKS, Inc. | 1.3% |
|---|
F5, Inc. | 1.2% |
|---|
WESCO International, Inc. | 1.2% |
|---|
Sensata Technologies Holding PLC | 1.2% |
|---|
Camden Property Trust | 1.2% |
|---|
Textron, Inc. | 1.2% |
|---|
C.H. Robinson Worldwide, Inc. | 1.2% |
|---|
|
| C000144984 |
|
| Shareholder Report [Line Items] |
|
| Fund Name |
Victory Multi-Cap Fund
|
| Class Name |
Class A
|
| Trading Symbol |
MNNAX
|
| Annual or Semi-Annual Statement [Text Block] |
Annual Shareholder Report
|
| Additional Information [Text Block] |
You can find additional information about the Fund at advisor.vcm.com/literature/mutual-fund-prospectuses. You may also request more information by calling 800-539-3863 or visiting vcm.com/contact-us.
This report describes changes to the Fund that occurred during the period.
|
| Additional Information Phone Number |
800-539-3863
|
| Additional Information Website |
vcm.com
|
| Expenses [Text Block] |
What were the Fund's costs for the last year?(based on a hypothetical $10,000 investment) Table SummaryClass Name | Costs of a $10,000 Investment | Costs paid as a percentage of a $10,000 Investment |
|---|
Class A | $139 | 1.21% |
|---|
| | |
|---|
|
| Expenses Paid, Amount |
$ 139
|
| Expense Ratio, Percent |
1.21%
|
| Factors Affecting Performance [Text Block] |
What affected the Fund’s performance during the last year?Top contributors to performance: • Relative to the Russell 3000® Index, the Fund generated its strongest relative performance within the financials, information technology, and health care sectors. • Stocks that contributed most positively to the Fund’s relative performance were KLA Corp. and Seagate Technology Holdings PLC. Top detractors from performance: • The absence of positions in Advanced Micro Devices, Inc. and Intel Corp. detracted from the Fund’s relative performance. • The materials sector was the largest detractor from the Fund's relative performance. |
| Performance Past Does Not Indicate Future [Text] |
The investment return and principal value will fluctuate so that an investor's shares, when redeemed, may be worth more or less than the original cost. Past performance is not a good predictor of the Fund's future performance.
|
| Line Graph [Table Text Block] |
Table Summary | Victory Multi-Cap Fund Class A @ NAV - $40,543 | Victory Multi-Cap Fund Class A @ MOP - $38,212 | Russell 3000® Index (regulatory broad based index) - $40,672 | S&P 500® Index - $42,271 |
|---|
6/16 | $10,000 | $9,425 | $10,000 | $10,000 |
|---|
6/17 | $11,740 | $11,065 | $11,851 | $11,790 |
|---|
6/18 | $13,310 | $12,545 | $13,602 | $13,484 |
|---|
6/19 | $13,691 | $12,904 | $14,824 | $14,889 |
|---|
6/20 | $13,899 | $13,101 | $15,792 | $16,006 |
|---|
6/21 | $19,465 | $18,346 | $22,767 | $22,536 |
|---|
6/22 | $17,768 | $16,747 | $19,610 | $20,144 |
|---|
6/23 | $21,645 | $20,401 | $23,327 | $24,091 |
|---|
6/24 | $26,631 | $25,100 | $28,721 | $30,006 |
|---|
6/25 | $31,055 | $29,270 | $33,114 | $34,556 |
|---|
6/26 | $40,543 | $38,212 | $40,672 | $42,271 |
|---|
|
| Average Annual Return [Table Text Block] |
Table Summary | 1 Year | 5 Year | 10 Year |
|---|
Class A @ NAV | 30.55%Footnote Reference | 15.81%Footnote Reference | 15.02%Footnote Reference |
|---|
Class A @ MOP | 23.05% | 14.44% | 14.35% |
|---|
Russell 3000® Index | 22.82% | 12.31% | 15.06% |
|---|
S&P 500® Index | 22.32% | 13.41% | 15.51% |
|---|
|
| No Deduction of Taxes [Text Block] |
The graph and table total returns do not reflect the deduction of taxes that a shareholder would pay on Fund distributions, or redemption of shares.
|
| Previous Investment Adviser [Text Block] |
The maximum offering price (“MOP”) figures reflect a maximum sales charge of 5.75% for Class A. The Net Asset Value ("NAV") figures do not reflect sales charges.
|
| AssetsNet |
$ 584,325,000
|
| Holdings Count | Holding |
124
|
| Advisory Fees Paid, Amount |
$ 4,005,000
|
| InvestmentCompanyPortfolioTurnover |
69.00%
|
| Additional Fund Statistics [Text Block] |
FUND STATISTICS($ amounts in 000s)(as of June 30, 2026)Table SummaryNet Assets | $584,325 |
|---|
Number of Holdings | 124 |
|---|
Investment Advisory Fees | $4,005 |
|---|
Portfolio Turnover | 69% |
|---|
|
| Holdings [Text Block] |
Top SectorsFootnote Reference* (% of Net Assets)Footnote Reference(as of June 30, 2026)Table SummaryValue | Value |
|---|
Materials | 1.4% | Utilities | 1.5% | Energy | 3.3% | Consumer Staples | 5.0% | Communication Services | 7.6% | Consumer Discretionary | 7.8% | Industrials | 9.4% | Financials | 9.6% | Health Care | 12.0% | Information TechnologyFootnote Reference** | 39.8% | Top 10 HoldingsFootnote Reference* (% of Net Assets)Footnote Reference(as of June 30, 2026)Table SummaryNVIDIA Corp. | 7.7% |
|---|
Apple, Inc. | 7.6% |
|---|
Alphabet, Inc., Class A | 4.6% |
|---|
KLA Corp. | 3.9% |
|---|
Microsoft Corp. | 3.9% |
|---|
Broadcom, Inc. | 2.9% |
|---|
Amazon.com, Inc. | 2.7% |
|---|
Eli Lilly & Co. | 2.5% |
|---|
Micron Technology, Inc. | 2.2% |
|---|
JPMorgan Chase & Co. | 2.0% |
|---|
|
| Material Fund Change [Text Block] |
Effective November 1, 2025, Victory Munder Multi-Cap Fund was renamed to Victory Multi-Cap Fund. The Fund’s investment objective, principal investment strategies, principal risks and management did not change. For more complete information, you may review the Fund's prospectus, issued November 1, 2025. |
| C000144985 |
|
| Shareholder Report [Line Items] |
|
| Fund Name |
Victory Multi-Cap Fund
|
| Class Name |
Class C
|
| Trading Symbol |
MNNCX
|
| Annual or Semi-Annual Statement [Text Block] |
Annual Shareholder Report
|
| Additional Information [Text Block] |
You can find additional information about the Fund at advisor.vcm.com/literature/mutual-fund-prospectuses. You may also request more information by calling 800-539-3863 or visiting vcm.com/contact-us.
This report describes changes to the Fund that occurred during the period.
|
| Additional Information Phone Number |
800-539-3863
|
| Additional Information Website |
vcm.com
|
| Expenses [Text Block] |
What were the Fund's costs for the last year?(based on a hypothetical $10,000 investment) Table SummaryClass Name | Costs of a $10,000 Investment | Costs paid as a percentage of a $10,000 Investment |
|---|
Class C | $248 | 2.16% |
|---|
| | |
|---|
|
| Expenses Paid, Amount |
$ 248
|
| Expense Ratio, Percent |
2.16%
|
| Factors Affecting Performance [Text Block] |
What affected the Fund’s performance during the last year?Top contributors to performance: • Relative to the Russell 3000® Index, the Fund generated its strongest relative performance within the financials, information technology, and health care sectors. • Stocks that contributed most positively to the Fund’s relative performance were KLA Corp. and Seagate Technology Holdings PLC. Top detractors from performance: • The absence of positions in Advanced Micro Devices, Inc. and Intel Corp. detracted from the Fund’s relative performance. • The materials sector was the largest detractor from the Fund's relative performance. |
| Performance Past Does Not Indicate Future [Text] |
The investment return and principal value will fluctuate so that an investor's shares, when redeemed, may be worth more or less than the original cost. Past performance is not a good predictor of the Fund's future performance.
|
| Line Graph [Table Text Block] |
Table Summary | Victory Multi-Cap Fund Class C @ NAV - $37,972 | Victory Multi-Cap Fund Class C @ CDSC - $37,972 | Russell 3000® Index (regulatory broad based index) - $40,672 | S&P 500® Index - $42,271 |
|---|
6/16 | $10,000 | $10,000 | $10,000 | $10,000 |
|---|
6/17 | $11,645 | $11,645 | $11,851 | $11,790 |
|---|
6/18 | $13,099 | $13,099 | $13,602 | $13,484 |
|---|
6/19 | $13,389 | $13,389 | $14,824 | $14,889 |
|---|
6/20 | $13,481 | $13,481 | $15,792 | $16,006 |
|---|
6/21 | $18,722 | $18,722 | $22,767 | $22,536 |
|---|
6/22 | $16,939 | $16,939 | $19,610 | $20,144 |
|---|
6/23 | $20,458 | $20,458 | $23,327 | $24,091 |
|---|
6/24 | $24,943 | $24,943 | $28,721 | $30,006 |
|---|
6/25 | $29,086 | $29,086 | $33,114 | $34,556 |
|---|
6/26 | $37,972 | $37,972 | $40,672 | $42,271 |
|---|
|
| Average Annual Return [Table Text Block] |
Table Summary | 1 Year | 5 Year | 10 Year |
|---|
Class C @ NAV | 29.34%Footnote Reference | 14.76% | 14.27% |
|---|
Class C @ CDSC | 28.34% | 14.76% | 14.27% |
|---|
Russell 3000® Index | 22.82% | 12.31% | 15.06% |
|---|
S&P 500® Index | 22.32% | 13.41% | 15.51% |
|---|
|
| No Deduction of Taxes [Text Block] |
The graph and table total returns do not reflect the deduction of taxes that a shareholder would pay on Fund distributions, or redemption of shares.
|
| Previous Investment Adviser [Text Block] |
Class C is not subject to an initial sales charge, but is subject to Contingent Deferred Sales Charge (“CDSC”) of 1.00% on shares redeemed within one year of purchase. The Net Asset Value ("NAV") figures do not reflect sales charges.
|
| AssetsNet |
$ 584,325,000
|
| Holdings Count | Holding |
124
|
| Advisory Fees Paid, Amount |
$ 4,005,000
|
| InvestmentCompanyPortfolioTurnover |
69.00%
|
| Additional Fund Statistics [Text Block] |
FUND STATISTICS($ amounts in 000s)(as of June 30, 2026)Table SummaryNet Assets | $584,325 |
|---|
Number of Holdings | 124 |
|---|
Investment Advisory Fees | $4,005 |
|---|
Portfolio Turnover | 69% |
|---|
|
| Holdings [Text Block] |
Top SectorsFootnote Reference* (% of Net Assets)Footnote Reference(as of June 30, 2026)Table SummaryValue | Value |
|---|
Materials | 1.4% | Utilities | 1.5% | Energy | 3.3% | Consumer Staples | 5.0% | Communication Services | 7.6% | Consumer Discretionary | 7.8% | Industrials | 9.4% | Financials | 9.6% | Health Care | 12.0% | Information TechnologyFootnote Reference** | 39.8% | Top 10 HoldingsFootnote Reference* (% of Net Assets)Footnote Reference(as of June 30, 2026)Table SummaryNVIDIA Corp. | 7.7% |
|---|
Apple, Inc. | 7.6% |
|---|
Alphabet, Inc., Class A | 4.6% |
|---|
KLA Corp. | 3.9% |
|---|
Microsoft Corp. | 3.9% |
|---|
Broadcom, Inc. | 2.9% |
|---|
Amazon.com, Inc. | 2.7% |
|---|
Eli Lilly & Co. | 2.5% |
|---|
Micron Technology, Inc. | 2.2% |
|---|
JPMorgan Chase & Co. | 2.0% |
|---|
|
| Material Fund Change [Text Block] |
Effective November 1, 2025, Victory Munder Multi-Cap Fund was renamed to Victory Multi-Cap Fund. The Fund’s investment objective, principal investment strategies, principal risks and management did not change. For more complete information, you may review the Fund's prospectus, issued November 1, 2025. |
| C000144987 |
|
| Shareholder Report [Line Items] |
|
| Fund Name |
Victory Multi-Cap Fund
|
| Class Name |
Class Y
|
| Trading Symbol |
MNNYX
|
| Annual or Semi-Annual Statement [Text Block] |
Annual Shareholder Report
|
| Additional Information [Text Block] |
You can find additional information about the Fund at advisor.vcm.com/literature/mutual-fund-prospectuses. You may also request more information by calling 800-539-3863 or visiting vcm.com/contact-us.
This report describes changes to the Fund that occurred during the period.
|
| Additional Information Phone Number |
800-539-3863
|
| Additional Information Website |
vcm.com
|
| Expenses [Text Block] |
What were the Fund's costs for the last year?(based on a hypothetical $10,000 investment) Table SummaryClass Name | Costs of a $10,000 Investment | Costs paid as a percentage of a $10,000 Investment |
|---|
Class Y | $109 | 0.94% |
|---|
| | |
|---|
|
| Expenses Paid, Amount |
$ 109
|
| Expense Ratio, Percent |
0.94%
|
| Factors Affecting Performance [Text Block] |
What affected the Fund’s performance during the last year?Top contributors to performance: • Relative to the Russell 3000® Index, the Fund generated its strongest relative performance within the financials, information technology, and health care sectors. • Stocks that contributed most positively to the Fund’s relative performance were KLA Corp. and Seagate Technology Holdings PLC. Top detractors from performance: • The absence of positions in Advanced Micro Devices, Inc. and Intel Corp. detracted from the Fund’s relative performance. • The materials sector was the largest detractor from the Fund's relative performance. |
| Performance Past Does Not Indicate Future [Text] |
The investment return and principal value will fluctuate so that an investor's shares, when redeemed, may be worth more or less than the original cost. Past performance is not a good predictor of the Fund's future performance.
|
| Line Graph [Table Text Block] |
Table Summary | Victory Multi-Cap Fund Class Y - $4,192,304 | Russell 3000® Index (regulatory broad based index) - $4,067,175 | S&P 500® Index - $4,227,112 |
|---|
6/16 | $1,000,000 | $1,000,000 | $1,000,000 |
|---|
6/17 | $1,178,553 | $1,185,095 | $1,178,960 |
|---|
6/18 | $1,341,270 | $1,360,229 | $1,348,424 |
|---|
6/19 | $1,384,285 | $1,482,412 | $1,488,895 |
|---|
6/20 | $1,410,936 | $1,579,207 | $1,600,639 |
|---|
6/21 | $1,982,898 | $2,276,654 | $2,253,606 |
|---|
6/22 | $1,815,892 | $1,960,982 | $2,014,367 |
|---|
6/23 | $2,219,008 | $2,332,660 | $2,409,064 |
|---|
6/24 | $2,738,695 | $2,872,090 | $3,000,635 |
|---|
6/25 | $3,202,497 | $3,311,398 | $3,455,641 |
|---|
6/26 | $4,192,304 | $4,067,175 | $4,227,112 |
|---|
|
| Average Annual Return [Table Text Block] |
Table Summary | 1 Year | 5 Year | 10 Year |
|---|
Class Y | 30.91%Footnote Reference | 16.15%Footnote Reference | 15.41%Footnote Reference |
|---|
Russell 3000® Index | 22.82% | 12.31% | 15.06% |
|---|
S&P 500® Index | 22.32% | 13.41% | 15.51% |
|---|
|
| No Deduction of Taxes [Text Block] |
The graph and table total returns do not reflect the deduction of taxes that a shareholder would pay on Fund distributions, or redemption of shares.
|
| AssetsNet |
$ 584,325,000
|
| Holdings Count | Holding |
124
|
| Advisory Fees Paid, Amount |
$ 4,005,000
|
| InvestmentCompanyPortfolioTurnover |
69.00%
|
| Additional Fund Statistics [Text Block] |
FUND STATISTICS($ amounts in 000s)(as of June 30, 2026)Table SummaryNet Assets | $584,325 |
|---|
Number of Holdings | 124 |
|---|
Investment Advisory Fees | $4,005 |
|---|
Portfolio Turnover | 69% |
|---|
|
| Holdings [Text Block] |
Top SectorsFootnote Reference* (% of Net Assets)Footnote Reference(as of June 30, 2026)Table SummaryValue | Value |
|---|
Materials | 1.4% | Utilities | 1.5% | Energy | 3.3% | Consumer Staples | 5.0% | Communication Services | 7.6% | Consumer Discretionary | 7.8% | Industrials | 9.4% | Financials | 9.6% | Health Care | 12.0% | Information TechnologyFootnote Reference** | 39.8% | Top 10 HoldingsFootnote Reference* (% of Net Assets)Footnote Reference(as of June 30, 2026)Table SummaryNVIDIA Corp. | 7.7% |
|---|
Apple, Inc. | 7.6% |
|---|
Alphabet, Inc., Class A | 4.6% |
|---|
KLA Corp. | 3.9% |
|---|
Microsoft Corp. | 3.9% |
|---|
Broadcom, Inc. | 2.9% |
|---|
Amazon.com, Inc. | 2.7% |
|---|
Eli Lilly & Co. | 2.5% |
|---|
Micron Technology, Inc. | 2.2% |
|---|
JPMorgan Chase & Co. | 2.0% |
|---|
|
| Material Fund Change [Text Block] |
Effective November 1, 2025, Victory Munder Multi-Cap Fund was renamed to Victory Multi-Cap Fund. The Fund’s investment objective, principal investment strategies, principal risks and management did not change. For more complete information, you may review the Fund's prospectus, issued November 1, 2025. |
| C000144988 |
|
| Shareholder Report [Line Items] |
|
| Fund Name |
Victory S&P 500 Index Fund
|
| Class Name |
Class A
|
| Trading Symbol |
MUXAX
|
| Annual or Semi-Annual Statement [Text Block] |
Annual Shareholder Report
|
| Additional Information [Text Block] |
You can find additional information about the Fund at advisor.vcm.com/literature/mutual-fund-prospectuses. You may also request more information by calling 800-539-3863 or visiting vcm.com/contact-us.
|
| Additional Information Phone Number |
800-539-3863
|
| Additional Information Website |
vcm.com
|
| Expenses [Text Block] |
What were the Fund's costs for the last year?(based on a hypothetical $10,000 investment) Table SummaryClass Name | Costs of a $10,000 Investment | Costs paid as a percentage of a $10,000 Investment |
|---|
Class A | $57 | 0.51% |
|---|
| | |
|---|
|
| Expenses Paid, Amount |
$ 57
|
| Expense Ratio, Percent |
0.51%
|
| Factors Affecting Performance [Text Block] |
What affected the Fund’s performance during the last year?During the reporting period, the Fund had positive absolute returns. Top contributors to performance: • During the reporting period, all 11 sectors delivered positive absolute returns. • The information technology sector was the best-performing sector. Top detractors from performance: • The financials sector lagged all other sectors. The Fund had a small allocation to derivatives during the period that did not have a material impact on performance. |
| Performance Past Does Not Indicate Future [Text] |
The investment return and principal value will fluctuate so that an investor's shares, when redeemed, may be worth more or less than the original cost. Past performance is not a good predictor of the Fund's future performance.
|
| Line Graph [Table Text Block] |
Table Summary | Victory S&P 500 Index Fund Class A @ NAV - $40,058 | Victory S&P 500 Index Fund Class A @ MOP - $39,162 | S&P 500® Index (regulatory broad based index) - $42,271 |
|---|
6/16 | $10,000 | $9,776 | $10,000 |
|---|
6/17 | $11,716 | $11,454 | $11,790 |
|---|
6/18 | $13,324 | $13,026 | $13,484 |
|---|
6/19 | $14,630 | $14,302 | $14,889 |
|---|
6/20 | $15,648 | $15,298 | $16,006 |
|---|
6/21 | $21,907 | $21,417 | $22,536 |
|---|
6/22 | $19,473 | $19,037 | $20,144 |
|---|
6/23 | $23,149 | $22,631 | $24,091 |
|---|
6/24 | $28,674 | $28,033 | $30,006 |
|---|
6/25 | $32,919 | $32,183 | $34,556 |
|---|
6/26 | $40,058 | $39,162 | $42,271 |
|---|
|
| Average Annual Return [Table Text Block] |
Table Summary | 1 Year | 5 Year | 10 Year |
|---|
Class A @ NAV | 21.69%Footnote Reference | 12.83% | 14.89% |
|---|
Class A @ MOP | 18.95% | 12.32% | 14.63% |
|---|
S&P 500® Index | 22.32% | 13.41% | 15.51% |
|---|
|
| No Deduction of Taxes [Text Block] |
The graph and table total returns do not reflect the deduction of taxes that a shareholder would pay on Fund distributions, or redemption of shares.
|
| Previous Investment Adviser [Text Block] |
The maximum offering price (“MOP”) figures reflect a maximum sales charge of 2.25% for Class A. The Net Asset Value ("NAV") figures do not reflect sales charges.
|
| AssetsNet |
$ 296,274,000
|
| Holdings Count | Holding |
509
|
| Advisory Fees Paid, Amount |
$ 537,000
|
| InvestmentCompanyPortfolioTurnover |
5.00%
|
| Additional Fund Statistics [Text Block] |
FUND STATISTICS($ amounts in 000s)(as of June 30, 2026)Table SummaryNet Assets | $296,274 |
|---|
Number of Holdings | 509 |
|---|
Investment Advisory Fees | $537 |
|---|
Portfolio Turnover | 5% |
|---|
|
| Holdings [Text Block] |
Top SectorsFootnote Reference* (% of Net Assets)Footnote Reference(as of June 30, 2026)Table SummaryValue | Value |
|---|
Materials | 1.8% | Utilities | 2.2% | Energy | 3.0% | Consumer Staples | 4.5% | Health Care | 8.8% | Industrials | 8.9% | Consumer Discretionary | 9.2% | Communication Services | 9.6% | Financials | 11.7% | Information TechnologyFootnote Reference** | 37.8% | Top 10 HoldingsFootnote Reference* (% of Net Assets)Footnote Reference(as of June 30, 2026)Table SummaryNVIDIA Corp. | 7.5% |
|---|
Apple, Inc. | 6.6% |
|---|
Microsoft Corp. | 4.3% |
|---|
Amazon.com, Inc. | 3.6% |
|---|
Alphabet, Inc., Class A | 3.2% |
|---|
Broadcom, Inc. | 2.8% |
|---|
Alphabet, Inc., Class C | 2.6% |
|---|
Micron Technology, Inc. | 2.0% |
|---|
Meta Platforms, Inc., Class A | 1.9% |
|---|
Tesla, Inc. | 1.8% |
|---|
|
| C000144989 |
|
| Shareholder Report [Line Items] |
|
| Fund Name |
Victory S&P 500 Index Fund
|
| Class Name |
Class R
|
| Trading Symbol |
MUXRX
|
| Annual or Semi-Annual Statement [Text Block] |
Annual Shareholder Report
|
| Additional Information [Text Block] |
You can find additional information about the Fund at advisor.vcm.com/literature/mutual-fund-prospectuses. You may also request more information by calling 800-539-3863 or visiting vcm.com/contact-us.
|
| Additional Information Phone Number |
800-539-3863
|
| Additional Information Website |
vcm.com
|
| Expenses [Text Block] |
What were the Fund's costs for the last year?(based on a hypothetical $10,000 investment) Table SummaryClass Name | Costs of a $10,000 Investment | Costs paid as a percentage of a $10,000 Investment |
|---|
Class R | $92 | 0.83% |
|---|
| | |
|---|
|
| Expenses Paid, Amount |
$ 92
|
| Expense Ratio, Percent |
0.83%
|
| Factors Affecting Performance [Text Block] |
What affected the Fund’s performance during the last year?During the reporting period, the Fund had positive absolute returns. Top contributors to performance: • During the reporting period, all 11 sectors delivered positive absolute returns. • The information technology sector was the best-performing sector. Top detractors from performance: • The financials sector lagged all other sectors. The Fund had a small allocation to derivatives during the period that did not have a material impact on performance. |
| Performance Past Does Not Indicate Future [Text] |
The investment return and principal value will fluctuate so that an investor's shares, when redeemed, may be worth more or less than the original cost. Past performance is not a good predictor of the Fund's future performance.
|
| Line Graph [Table Text Block] |
Table Summary | Victory S&P 500 Index Fund Class R - $38,530 | S&P 500® Index (regulatory broad based index) - $42,271 |
|---|
6/16 | $10,000 | $10,000 |
|---|
6/17 | $11,659 | $11,790 |
|---|
6/18 | $13,211 | $13,484 |
|---|
6/19 | $14,441 | $14,889 |
|---|
6/20 | $15,390 | $16,006 |
|---|
6/21 | $21,458 | $22,536 |
|---|
6/22 | $18,998 | $20,144 |
|---|
6/23 | $22,493 | $24,091 |
|---|
6/24 | $27,775 | $30,006 |
|---|
6/25 | $31,773 | $34,556 |
|---|
6/26 | $38,530 | $42,271 |
|---|
|
| Average Annual Return [Table Text Block] |
Table Summary | 1 Year | 5 Year | 10 Year |
|---|
Class R | 21.27%Footnote Reference | 12.42% | 14.44% |
|---|
S&P 500® Index | 22.32% | 13.41% | 15.51% |
|---|
|
| No Deduction of Taxes [Text Block] |
The graph and table total returns do not reflect the deduction of taxes that a shareholder would pay on Fund distributions, or redemption of shares.
|
| AssetsNet |
$ 296,274,000
|
| Holdings Count | Holding |
509
|
| Advisory Fees Paid, Amount |
$ 537,000
|
| InvestmentCompanyPortfolioTurnover |
5.00%
|
| Additional Fund Statistics [Text Block] |
FUND STATISTICS($ amounts in 000s)(as of June 30, 2026)Table SummaryNet Assets | $296,274 |
|---|
Number of Holdings | 509 |
|---|
Investment Advisory Fees | $537 |
|---|
Portfolio Turnover | 5% |
|---|
|
| Holdings [Text Block] |
Top SectorsFootnote Reference* (% of Net Assets)Footnote Reference(as of June 30, 2026)Table SummaryValue | Value |
|---|
Materials | 1.8% | Utilities | 2.2% | Energy | 3.0% | Consumer Staples | 4.5% | Health Care | 8.8% | Industrials | 8.9% | Consumer Discretionary | 9.2% | Communication Services | 9.6% | Financials | 11.7% | Information TechnologyFootnote Reference** | 37.8% | Top 10 HoldingsFootnote Reference* (% of Net Assets)Footnote Reference(as of June 30, 2026)Table SummaryNVIDIA Corp. | 7.5% |
|---|
Apple, Inc. | 6.6% |
|---|
Microsoft Corp. | 4.3% |
|---|
Amazon.com, Inc. | 3.6% |
|---|
Alphabet, Inc., Class A | 3.2% |
|---|
Broadcom, Inc. | 2.8% |
|---|
Alphabet, Inc., Class C | 2.6% |
|---|
Micron Technology, Inc. | 2.0% |
|---|
Meta Platforms, Inc., Class A | 1.9% |
|---|
Tesla, Inc. | 1.8% |
|---|
|
| C000144990 |
|
| Shareholder Report [Line Items] |
|
| Fund Name |
Victory S&P 500 Index Fund
|
| Class Name |
Class Y
|
| Trading Symbol |
MUXYX
|
| Annual or Semi-Annual Statement [Text Block] |
Annual Shareholder Report
|
| Additional Information [Text Block] |
You can find additional information about the Fund at advisor.vcm.com/literature/mutual-fund-prospectuses. You may also request more information by calling 800-539-3863 or visiting vcm.com/contact-us.
|
| Additional Information Phone Number |
800-539-3863
|
| Additional Information Website |
vcm.com
|
| Expenses [Text Block] |
What were the Fund's costs for the last year?(based on a hypothetical $10,000 investment) Table SummaryClass Name | Costs of a $10,000 Investment | Costs paid as a percentage of a $10,000 Investment |
|---|
Class Y | $41 | 0.37% |
|---|
| | |
|---|
|
| Expenses Paid, Amount |
$ 41
|
| Expense Ratio, Percent |
0.37%
|
| Factors Affecting Performance [Text Block] |
What affected the Fund’s performance during the last year?During the reporting period, the Fund had positive absolute returns. Top contributors to performance: • During the reporting period, all 11 sectors delivered positive absolute returns. • The information technology sector was the best-performing sector. Top detractors from performance: • The financials sector lagged all other sectors. The Fund had a small allocation to derivatives during the period that did not have a material impact on performance. |
| Performance Past Does Not Indicate Future [Text] |
The investment return and principal value will fluctuate so that an investor's shares, when redeemed, may be worth more or less than the original cost. Past performance is not a good predictor of the Fund's future performance.
|
| Line Graph [Table Text Block] |
Table Summary | Victory S&P 500 Index Fund Class Y - $4,050,825 | S&P 500® Index (regulatory broad based index) - $4,227,112 |
|---|
6/16 | $1,000,000 | $1,000,000 |
|---|
6/17 | $1,173,344 | $1,178,960 |
|---|
6/18 | $1,337,139 | $1,348,424 |
|---|
6/19 | $1,469,858 | $1,488,895 |
|---|
6/20 | $1,573,846 | $1,600,639 |
|---|
6/21 | $2,205,884 | $2,253,606 |
|---|
6/22 | $1,961,988 | $2,014,367 |
|---|
6/23 | $2,334,313 | $2,409,064 |
|---|
6/24 | $2,893,734 | $3,000,635 |
|---|
6/25 | $3,324,577 | $3,455,641 |
|---|
6/26 | $4,050,825 | $4,227,112 |
|---|
|
| Average Annual Return [Table Text Block] |
Table Summary | 1 Year | 5 Year | 10 Year |
|---|
Class Y | 21.85%Footnote Reference | 12.93% | 15.01%Footnote Reference |
|---|
S&P 500® Index | 22.32% | 13.41% | 15.51% |
|---|
|
| No Deduction of Taxes [Text Block] |
The graph and table total returns do not reflect the deduction of taxes that a shareholder would pay on Fund distributions, or redemption of shares.
|
| AssetsNet |
$ 296,274,000
|
| Holdings Count | Holding |
509
|
| Advisory Fees Paid, Amount |
$ 537,000
|
| InvestmentCompanyPortfolioTurnover |
5.00%
|
| Additional Fund Statistics [Text Block] |
FUND STATISTICS($ amounts in 000s)(as of June 30, 2026)Table SummaryNet Assets | $296,274 |
|---|
Number of Holdings | 509 |
|---|
Investment Advisory Fees | $537 |
|---|
Portfolio Turnover | 5% |
|---|
|
| Holdings [Text Block] |
Top SectorsFootnote Reference* (% of Net Assets)Footnote Reference(as of June 30, 2026)Table SummaryValue | Value |
|---|
Materials | 1.8% | Utilities | 2.2% | Energy | 3.0% | Consumer Staples | 4.5% | Health Care | 8.8% | Industrials | 8.9% | Consumer Discretionary | 9.2% | Communication Services | 9.6% | Financials | 11.7% | Information TechnologyFootnote Reference** | 37.8% | Top 10 HoldingsFootnote Reference* (% of Net Assets)Footnote Reference(as of June 30, 2026)Table SummaryNVIDIA Corp. | 7.5% |
|---|
Apple, Inc. | 6.6% |
|---|
Microsoft Corp. | 4.3% |
|---|
Amazon.com, Inc. | 3.6% |
|---|
Alphabet, Inc., Class A | 3.2% |
|---|
Broadcom, Inc. | 2.8% |
|---|
Alphabet, Inc., Class C | 2.6% |
|---|
Micron Technology, Inc. | 2.0% |
|---|
Meta Platforms, Inc., Class A | 1.9% |
|---|
Tesla, Inc. | 1.8% |
|---|
|
| C000144972 |
|
| Shareholder Report [Line Items] |
|
| Fund Name |
Victory Mid-Cap Core Growth Fund
|
| Class Name |
Class A
|
| Trading Symbol |
MGOAX
|
| Annual or Semi-Annual Statement [Text Block] |
Annual Shareholder Report
|
| Additional Information [Text Block] |
You can find additional information about the Fund at advisor.vcm.com/literature/ mutual-fund-prospectuses. You may also request more information by calling 800-539-3863 or visiting vcm.com/contact-us.
This report describes changes to the Fund that occurred during the period.
|
| Additional Information Phone Number |
800-539-3863
|
| Additional Information Website |
vcm.com
|
| Expenses [Text Block] |
What were the Fund's costs for the last year?(based on a hypothetical $10,000 investment) Table SummaryClass Name | Costs of a $10,000 Investment | Costs paid as a percentage of a $10,000 Investment |
|---|
Class A | $143 | 1.26% |
|---|
| | |
|---|
|
| Expenses Paid, Amount |
$ 143
|
| Expense Ratio, Percent |
1.26%
|
| Factors Affecting Performance [Text Block] |
What affected the Fund’s performance during the last year?Top contributors to performance: • The Fund’s best-performing sectors for the year on a relative basis were industrials and financials relative to the Russell MidCap® Index (the “Index”). • The largest individual contributors to the Fund’s relative performance were Comfort Systems USA, Inc. and BrightSpring Health Services, Inc. Top detractors from performance: • The Fund’s worst-performing sectors were information technology and materials. • The absence of positions in Western Digital Corp. and Corning, Inc., both holdings within the Index, were the Fund’s two largest individual detractors over the past year. |
| Performance Past Does Not Indicate Future [Text] |
The investment return and principal value will fluctuate so that an investor's shares, when redeemed, may be worth more or less than the original cost. Past performance is not a good predictor of the Fund's future performance.
|
| Line Graph [Table Text Block] |
Table Summary | Victory Mid-Cap Core Growth Fund Class A @ NAV - $29,222 | Victory Mid-Cap Core Growth Fund Class A @ MOP - $27,538 | S&P 500® Index (regulatory broad based index) - $42,271 | Russell Midcap® Index - $31,060 | Russell Midcap® Growth Index - $34,075 |
|---|
6/16 | $10,000 | $9,424 | $10,000 | $10,000 | $10,000 |
|---|
6/17 | $11,718 | $11,043 | $11,790 | $11,648 | $11,705 |
|---|
6/18 | $13,133 | $12,377 | $13,484 | $13,084 | $13,873 |
|---|
6/19 | $13,682 | $12,894 | $14,889 | $14,108 | $15,806 |
|---|
6/20 | $13,266 | $12,502 | $16,006 | $13,792 | $17,689 |
|---|
6/21 | $19,571 | $18,443 | $22,536 | $20,660 | $25,432 |
|---|
6/22 | $16,274 | $15,337 | $20,144 | $17,087 | $17,911 |
|---|
6/23 | $18,119 | $17,075 | $24,091 | $19,637 | $22,054 |
|---|
6/24 | $20,207 | $19,043 | $30,006 | $22,165 | $25,373 |
|---|
6/25 | $22,896 | $21,577 | $34,556 | $25,536 | $32,095 |
|---|
6/26 | $29,222 | $27,538 | $42,271 | $31,060 | $34,075 |
|---|
|
| Average Annual Return [Table Text Block] |
Table Summary | 1 Year | 5 Year | 10 Year |
|---|
Class A @ NAV | 27.63%Footnote Reference | 8.35% | 11.32% |
|---|
Class A @ MOP | 20.29% | 7.07% | 10.66% |
|---|
S&P 500® Index | 22.32% | 13.41% | 15.51% |
|---|
Russell Midcap® Index | 21.63% | 8.50% | 12.00% |
|---|
Russell Midcap® Growth Index | 6.17% | 6.03% | 13.04% |
|---|
|
| No Deduction of Taxes [Text Block] |
The graph and table total returns do not reflect the deduction of taxes that a shareholder would pay on Fund distributions, or redemption of shares.
|
| Previous Investment Adviser [Text Block] |
The maximum offering price (“MOP”) figures reflect a maximum sales charge of 5.75% for Class A. The Net Asset Value ("NAV") figures do not reflect sales charges.
|
| AssetsNet |
$ 319,368,000
|
| Holdings Count | Holding |
114
|
| Advisory Fees Paid, Amount |
$ 2,163,000
|
| InvestmentCompanyPortfolioTurnover |
100.00%
|
| Additional Fund Statistics [Text Block] |
FUND STATISTICS($ amounts in 000s)(as of June 30, 2026)Table SummaryNet Assets | $319,368 |
|---|
Number of Holdings | 114 |
|---|
Investment Advisory Fees | $2,163 |
|---|
Portfolio Turnover | 100% |
|---|
|
| Holdings [Text Block] |
Top SectorsFootnote Reference* (% of Net Assets)Footnote Reference(as of June 30, 2026)Table SummaryValue | Value |
|---|
Real Estate | 3.1% | Materials | 3.9% | Consumer Staples | 4.9% | Utilities | 6.1% | Energy | 6.8% | Consumer Discretionary | 9.2% | Health Care | 9.4% | Information Technology | 15.2% | Financials | 16.5% | Industrials | 22.6% | Top 10 HoldingsFootnote Reference* (% of Net Assets)Footnote Reference(as of June 30, 2026)Table SummaryThe Allstate Corp. | 2.7% |
|---|
Comfort Systems USA, Inc. | 2.7% |
|---|
Ralph Lauren Corp., Class A | 1.9% |
|---|
Monolithic Power Systems, Inc. | 1.9% |
|---|
BrightSpring Health Services, Inc. | 1.9% |
|---|
Affiliated Managers Group, Inc. | 1.9% |
|---|
Synchrony Financial | 1.8% |
|---|
FirstEnergy Corp. | 1.7% |
|---|
EMCOR Group, Inc. | 1.7% |
|---|
Delta Air Lines, Inc. | 1.7% |
|---|
|
| Material Fund Change [Text Block] |
Effective November 1, 2025, Victory Munder Mid-Cap Core Growth was renamed to Victory Mid-Cap Core Growth Fund. The Fund’s investment objective, principal investment strategies, principal risks and management did not change. For more complete information, you may review the Fund's prospectus, issued November 1, 2025. |
| C000144973 |
|
| Shareholder Report [Line Items] |
|
| Fund Name |
Victory Mid-Cap Core Growth Fund
|
| Class Name |
Class C
|
| Trading Symbol |
MGOTX
|
| Annual or Semi-Annual Statement [Text Block] |
Annual Shareholder Report
|
| Additional Information [Text Block] |
You can find additional information about the Fund at advisor.vcm.com/literature/ mutual-fund-prospectuses. You may also request more information by calling 800-539-3863 or visiting vcm.com/contact-us.
This report describes changes to the Fund that occurred during the period.
|
| Additional Information Phone Number |
800-539-3863
|
| Additional Information Website |
vcm.com
|
| Expenses [Text Block] |
What were the Fund's costs for the last year?(based on a hypothetical $10,000 investment) Table SummaryClass Name | Costs of a $10,000 Investment | Costs paid as a percentage of a $10,000 Investment |
|---|
Class C | $240 | 2.12% |
|---|
| | |
|---|
|
| Expenses Paid, Amount |
$ 240
|
| Expense Ratio, Percent |
2.12%
|
| Factors Affecting Performance [Text Block] |
What affected the Fund’s performance during the last year?Top contributors to performance: • The Fund’s best-performing sectors for the year on a relative basis were industrials and financials relative to the Russell MidCap® Index (the “Index”). • The largest individual contributors to the Fund’s relative performance were Comfort Systems USA, Inc. and BrightSpring Health Services, Inc. Top detractors from performance: • The Fund’s worst-performing sectors were information technology and materials. • The absence of positions in Western Digital Corp. and Corning, Inc., both holdings within the Index, were the Fund’s two largest individual detractors over the past year. |
| Performance Past Does Not Indicate Future [Text] |
The investment return and principal value will fluctuate so that an investor's shares, when redeemed, may be worth more or less than the original cost. Past performance is not a good predictor of the Fund's future performance.
|
| Line Graph [Table Text Block] |
Table Summary | Victory Mid-Cap Core Growth Fund Class C @ NAV - $27,518 | Victory Mid-Cap Core Growth Fund Class C @ CDSC - $27,518 | S&P 500® Index (regulatory broad based index) - $42,271 | Russell Midcap® Index - $31,060 | Russell Midcap® Growth Index - $34,075 |
|---|
6/16 | $10,000 | $10,000 | $10,000 | $10,000 | $10,000 |
|---|
6/17 | $11,643 | $11,643 | $11,790 | $11,648 | $11,705 |
|---|
6/18 | $12,955 | $12,955 | $13,484 | $13,084 | $13,873 |
|---|
6/19 | $13,410 | $13,410 | $14,889 | $14,108 | $15,806 |
|---|
6/20 | $12,897 | $12,897 | $16,006 | $13,792 | $17,689 |
|---|
6/21 | $18,895 | $18,895 | $22,536 | $20,660 | $25,432 |
|---|
6/22 | $15,583 | $15,583 | $20,144 | $17,087 | $17,911 |
|---|
6/23 | $17,188 | $17,188 | $24,091 | $19,637 | $22,054 |
|---|
6/24 | $19,029 | $19,029 | $30,006 | $22,165 | $25,373 |
|---|
6/25 | $21,561 | $21,561 | $34,556 | $25,536 | $32,095 |
|---|
6/26 | $27,518 | $27,518 | $42,271 | $31,060 | $34,075 |
|---|
|
| Average Annual Return [Table Text Block] |
Table Summary | 1 Year | 5 Year | 10 Year |
|---|
Class C @ NAV | 26.55%Footnote Reference | 7.40% | 10.65% |
|---|
Class C @ CDSC | 25.55% | 7.40% | 10.65% |
|---|
S&P 500® Index | 22.32% | 13.41% | 15.51% |
|---|
Russell Midcap® Index | 21.63% | 8.50% | 12.00% |
|---|
Russell Midcap® Growth Index | 6.17% | 6.03% | 13.04% |
|---|
|
| No Deduction of Taxes [Text Block] |
The graph and table total returns do not reflect the deduction of taxes that a shareholder would pay on Fund distributions, or redemption of shares.
|
| Previous Investment Adviser [Text Block] |
Class C is not subject to an initial sales charge, but is subject to Contingent Deferred Sales Charge (“CDSC”) of 1.00% on shares redeemed within one year of purchase. The Net Asset Value ("NAV") figures do not reflect sales charges.
|
| AssetsNet |
$ 319,368,000
|
| Holdings Count | Holding |
114
|
| Advisory Fees Paid, Amount |
$ 2,163,000
|
| InvestmentCompanyPortfolioTurnover |
100.00%
|
| Additional Fund Statistics [Text Block] |
FUND STATISTICS($ amounts in 000s)(as of June 30, 2026)Table SummaryNet Assets | $319,368 |
|---|
Number of Holdings | 114 |
|---|
Investment Advisory Fees | $2,163 |
|---|
Portfolio Turnover | 100% |
|---|
|
| Holdings [Text Block] |
Top SectorsFootnote Reference* (% of Net Assets)Footnote Reference(as of June 30, 2026)Table SummaryValue | Value |
|---|
Real Estate | 3.1% | Materials | 3.9% | Consumer Staples | 4.9% | Utilities | 6.1% | Energy | 6.8% | Consumer Discretionary | 9.2% | Health Care | 9.4% | Information Technology | 15.2% | Financials | 16.5% | Industrials | 22.6% | Top 10 HoldingsFootnote Reference* (% of Net Assets)Footnote Reference(as of June 30, 2026)Table SummaryThe Allstate Corp. | 2.7% |
|---|
Comfort Systems USA, Inc. | 2.7% |
|---|
Ralph Lauren Corp., Class A | 1.9% |
|---|
Monolithic Power Systems, Inc. | 1.9% |
|---|
BrightSpring Health Services, Inc. | 1.9% |
|---|
Affiliated Managers Group, Inc. | 1.9% |
|---|
Synchrony Financial | 1.8% |
|---|
FirstEnergy Corp. | 1.7% |
|---|
EMCOR Group, Inc. | 1.7% |
|---|
Delta Air Lines, Inc. | 1.7% |
|---|
|
| Material Fund Change [Text Block] |
Effective November 1, 2025, Victory Munder Mid-Cap Core Growth was renamed to Victory Mid-Cap Core Growth Fund. The Fund’s investment objective, principal investment strategies, principal risks and management did not change. For more complete information, you may review the Fund's prospectus, issued November 1, 2025. |
| C000144975 |
|
| Shareholder Report [Line Items] |
|
| Fund Name |
Victory Mid-Cap Core Growth Fund
|
| Class Name |
Class R6
|
| Trading Symbol |
MGOSX
|
| Annual or Semi-Annual Statement [Text Block] |
Annual Shareholder Report
|
| Additional Information [Text Block] |
You can find additional information about the Fund at advisor.vcm.com/literature/ mutual-fund-prospectuses. You may also request more information by calling 800-539-3863 or visiting vcm.com/contact-us.
This report describes changes to the Fund that occurred during the period.
|
| Additional Information Phone Number |
800-539-3863
|
| Additional Information Website |
vcm.com
|
| Expenses [Text Block] |
What were the Fund's costs for the last year?(based on a hypothetical $10,000 investment) Table SummaryClass Name | Costs of a $10,000 Investment | Costs paid as a percentage of a $10,000 Investment |
|---|
Class R6 | $99 | 0.87% |
|---|
| | |
|---|
|
| Expenses Paid, Amount |
$ 99
|
| Expense Ratio, Percent |
0.87%
|
| Factors Affecting Performance [Text Block] |
What affected the Fund’s performance during the last year?Top contributors to performance: • The Fund’s best-performing sectors for the year on a relative basis were industrials and financials relative to the Russell MidCap® Index (the “Index”). • The largest individual contributors to the Fund’s relative performance were Comfort Systems USA, Inc. and BrightSpring Health Services, Inc. Top detractors from performance: • The Fund’s worst-performing sectors were information technology and materials. • The absence of positions in Western Digital Corp. and Corning, Inc., both holdings within the Index, were the Fund’s two largest individual detractors over the past year. |
| Performance Past Does Not Indicate Future [Text] |
The investment return and principal value will fluctuate so that an investor's shares, when redeemed, may be worth more or less than the original cost. Past performance is not a good predictor of the Fund's future performance.
|
| Line Graph [Table Text Block] |
Table Summary | Victory Mid-Cap Core Growth Fund Class R6 - $30,421 | S&P 500® Index (regulatory broad based index) - $42,271 | Russell Midcap® Index - $31,060 | Russell Midcap® Growth Index - $34,075 |
|---|
6/16 | $10,000 | $10,000 | $10,000 | $10,000 |
|---|
6/17 | $11,773 | $11,790 | $11,648 | $11,705 |
|---|
6/18 | $13,252 | $13,484 | $13,084 | $13,873 |
|---|
6/19 | $13,857 | $14,889 | $14,108 | $15,806 |
|---|
6/20 | $13,497 | $16,006 | $13,792 | $17,689 |
|---|
6/21 | $20,002 | $22,536 | $20,660 | $25,432 |
|---|
6/22 | $16,695 | $20,144 | $17,087 | $17,911 |
|---|
6/23 | $18,657 | $24,091 | $19,637 | $22,054 |
|---|
6/24 | $20,891 | $30,006 | $22,165 | $25,373 |
|---|
6/25 | $23,746 | $34,556 | $25,536 | $32,095 |
|---|
6/26 | $30,421 | $42,271 | $31,060 | $34,075 |
|---|
|
| Average Annual Return [Table Text Block] |
Table Summary | 1 Year | 5 Year | 10 Year |
|---|
Class R6 | 28.11%Footnote Reference | 8.75% | 11.77% |
|---|
S&P 500® Index | 22.32% | 13.41% | 15.51% |
|---|
Russell Midcap® Index | 21.63% | 8.50% | 12.00% |
|---|
Russell Midcap® Growth Index | 6.17% | 6.03% | 13.04% |
|---|
|
| No Deduction of Taxes [Text Block] |
The graph and table total returns do not reflect the deduction of taxes that a shareholder would pay on Fund distributions, or redemption of shares.
|
| AssetsNet |
$ 319,368,000
|
| Holdings Count | Holding |
114
|
| Advisory Fees Paid, Amount |
$ 2,163,000
|
| InvestmentCompanyPortfolioTurnover |
100.00%
|
| Additional Fund Statistics [Text Block] |
FUND STATISTICS($ amounts in 000s)(as of June 30, 2026)Table SummaryNet Assets | $319,368 |
|---|
Number of Holdings | 114 |
|---|
Investment Advisory Fees | $2,163 |
|---|
Portfolio Turnover | 100% |
|---|
|
| Holdings [Text Block] |
Top SectorsFootnote Reference* (% of Net Assets)Footnote Reference(as of June 30, 2026)Table SummaryValue | Value |
|---|
Real Estate | 3.1% | Materials | 3.9% | Consumer Staples | 4.9% | Utilities | 6.1% | Energy | 6.8% | Consumer Discretionary | 9.2% | Health Care | 9.4% | Information Technology | 15.2% | Financials | 16.5% | Industrials | 22.6% | Top 10 HoldingsFootnote Reference* (% of Net Assets)Footnote Reference(as of June 30, 2026)Table SummaryThe Allstate Corp. | 2.7% |
|---|
Comfort Systems USA, Inc. | 2.7% |
|---|
Ralph Lauren Corp., Class A | 1.9% |
|---|
Monolithic Power Systems, Inc. | 1.9% |
|---|
BrightSpring Health Services, Inc. | 1.9% |
|---|
Affiliated Managers Group, Inc. | 1.9% |
|---|
Synchrony Financial | 1.8% |
|---|
FirstEnergy Corp. | 1.7% |
|---|
EMCOR Group, Inc. | 1.7% |
|---|
Delta Air Lines, Inc. | 1.7% |
|---|
|
| Material Fund Change [Text Block] |
Effective November 1, 2025, Victory Munder Mid-Cap Core Growth was renamed to Victory Mid-Cap Core Growth Fund. The Fund’s investment objective, principal investment strategies, principal risks and management did not change. For more complete information, you may review the Fund's prospectus, issued November 1, 2025. |
| C000144976 |
|
| Shareholder Report [Line Items] |
|
| Fund Name |
Victory Mid-Cap Core Growth Fund
|
| Class Name |
Class Y
|
| Trading Symbol |
MGOYX
|
| Annual or Semi-Annual Statement [Text Block] |
Annual Shareholder Report
|
| Additional Information [Text Block] |
You can find additional information about the Fund at advisor.vcm.com/literature/ mutual-fund-prospectuses. You may also request more information by calling 800-539-3863 or visiting vcm.com/contact-us.
This report describes changes to the Fund that occurred during the period.
|
| Additional Information Phone Number |
800-539-3863
|
| Additional Information Website |
vcm.com
|
| Expenses [Text Block] |
What were the Fund's costs for the last year?(based on a hypothetical $10,000 investment) Table SummaryClass Name | Costs of a $10,000 Investment | Costs paid as a percentage of a $10,000 Investment |
|---|
Class Y | $113 | 0.99% |
|---|
| | |
|---|
|
| Expenses Paid, Amount |
$ 113
|
| Expense Ratio, Percent |
0.99%
|
| Factors Affecting Performance [Text Block] |
What affected the Fund’s performance during the last year?Top contributors to performance: • The Fund’s best-performing sectors for the year on a relative basis were industrials and financials relative to the Russell MidCap® Index (the “Index”). • The largest individual contributors to the Fund’s relative performance were Comfort Systems USA, Inc. and BrightSpring Health Services, Inc. Top detractors from performance: • The Fund’s worst-performing sectors were information technology and materials. • The absence of positions in Western Digital Corp. and Corning, Inc., both holdings within the Index, were the Fund’s two largest individual detractors over the past year. |
| Performance Past Does Not Indicate Future [Text] |
The investment return and principal value will fluctuate so that an investor's shares, when redeemed, may be worth more or less than the original cost. Past performance is not a good predictor of the Fund's future performance.
|
| Line Graph [Table Text Block] |
Table Summary | Victory Mid-Cap Core Growth Fund Class Y - $3,004,823 | S&P 500® Index (regulatory broad based index) - $4,227,112 | Russell Midcap® Index - $3,105,993 | Russell Midcap® Growth Index - $3,407,536 |
|---|
6/16 | $1,000,000 | $1,000,000 | $1,000,000 | $1,000,000 |
|---|
6/17 | $1,174,874 | $1,178,960 | $1,164,839 | $1,170,467 |
|---|
6/18 | $1,320,383 | $1,348,424 | $1,308,414 | $1,387,259 |
|---|
6/19 | $1,379,336 | $1,488,895 | $1,410,801 | $1,580,637 |
|---|
6/20 | $1,341,208 | $1,600,639 | $1,379,200 | $1,768,910 |
|---|
6/21 | $1,984,956 | $2,253,606 | $2,066,025 | $2,543,186 |
|---|
6/22 | $1,654,715 | $2,014,367 | $1,708,681 | $1,791,055 |
|---|
6/23 | $1,847,355 | $2,409,064 | $1,963,692 | $2,205,359 |
|---|
6/24 | $2,067,481 | $3,000,635 | $2,216,526 | $2,537,314 |
|---|
6/25 | $2,347,539 | $3,455,641 | $2,553,558 | $3,209,452 |
|---|
6/26 | $3,004,823 | $4,227,112 | $3,105,993 | $3,407,536 |
|---|
|
| Average Annual Return [Table Text Block] |
Table Summary | 1 Year | 5 Year | 10 Year |
|---|
Class Y | 28.00%Footnote Reference | 8.65% | 11.63% |
|---|
S&P 500® Index | 22.32% | 13.41% | 15.51% |
|---|
Russell Midcap® Index | 21.63% | 8.50% | 12.00% |
|---|
Russell Midcap® Growth Index | 6.17% | 6.03% | 13.04% |
|---|
|
| No Deduction of Taxes [Text Block] |
The graph and table total returns do not reflect the deduction of taxes that a shareholder would pay on Fund distributions, or redemption of shares.
|
| AssetsNet |
$ 319,368,000
|
| Holdings Count | Holding |
114
|
| Advisory Fees Paid, Amount |
$ 2,163,000
|
| InvestmentCompanyPortfolioTurnover |
100.00%
|
| Additional Fund Statistics [Text Block] |
FUND STATISTICS($ amounts in 000s)(as of June 30, 2026)Table SummaryNet Assets | $319,368 |
|---|
Number of Holdings | 114 |
|---|
Investment Advisory Fees | $2,163 |
|---|
Portfolio Turnover | 100% |
|---|
|
| Holdings [Text Block] |
Top SectorsFootnote Reference* (% of Net Assets)Footnote Reference(as of June 30, 2026)Table SummaryValue | Value |
|---|
Real Estate | 3.1% | Materials | 3.9% | Consumer Staples | 4.9% | Utilities | 6.1% | Energy | 6.8% | Consumer Discretionary | 9.2% | Health Care | 9.4% | Information Technology | 15.2% | Financials | 16.5% | Industrials | 22.6% | Top 10 HoldingsFootnote Reference* (% of Net Assets)Footnote Reference(as of June 30, 2026)Table SummaryThe Allstate Corp. | 2.7% |
|---|
Comfort Systems USA, Inc. | 2.7% |
|---|
Ralph Lauren Corp., Class A | 1.9% |
|---|
Monolithic Power Systems, Inc. | 1.9% |
|---|
BrightSpring Health Services, Inc. | 1.9% |
|---|
Affiliated Managers Group, Inc. | 1.9% |
|---|
Synchrony Financial | 1.8% |
|---|
FirstEnergy Corp. | 1.7% |
|---|
EMCOR Group, Inc. | 1.7% |
|---|
Delta Air Lines, Inc. | 1.7% |
|---|
|
| Material Fund Change [Text Block] |
Effective November 1, 2025, Victory Munder Mid-Cap Core Growth was renamed to Victory Mid-Cap Core Growth Fund. The Fund’s investment objective, principal investment strategies, principal risks and management did not change. For more complete information, you may review the Fund's prospectus, issued November 1, 2025. |
| C000144995 |
|
| Shareholder Report [Line Items] |
|
| Fund Name |
Victory Trivalent International Fund - Core Equity
|
| Class Name |
Class A
|
| Trading Symbol |
MAICX
|
| Annual or Semi-Annual Statement [Text Block] |
Annual Shareholder Report
|
| Additional Information [Text Block] |
You can find additional information about the Fund at advisor.vcm.com/literature/ mutual-fund-prospectuses. You may also request more information by calling 800-539-3863 or visiting vcm.com/contact-us.
|
| Additional Information Phone Number |
800-539-3863
|
| Additional Information Website |
vcm.com
|
| Expenses [Text Block] |
What were the Fund's costs for the last year?(based on a hypothetical $10,000 investment) Table SummaryClass Name | Costs of a $10,000 Investment | Costs paid as a percentage of a $10,000 Investment |
|---|
Class A | $111 | 0.95% |
|---|
| | |
|---|
|
| Expenses Paid, Amount |
$ 111
|
| Expense Ratio, Percent |
0.95%
|
| Factors Affecting Performance [Text Block] |
What affected the Fund’s performance during the last year?International returns were supported by continued enthusiasm for artificial intelligence and resilient corporate earnings despite a challenging geopolitical backdrop. All six regions posted gains during the period. Nine of the eleven sectors posted gains, with technology the highest-performing sector. The communication services sector trailed the broader MSCI ACWI ex USA Index (the "Index”). Top contributors to performance: • Security selection was positive and yielded relative outperformance for the Fund. • Excess returns were generated in five of the six regions and eight of the eleven economic sectors relative to the Index. • From a regional standpoint, security selection was strongest in Japan. • From a sector standpoint, security selection was strongest in technology. • From a style perspective, the Fund’s multi-factor exposure had a positive impact on relative performance, with business momentum generating the strongest signal. Exposure to value and quality were also additive. Top detractors from performance: • From a regional perspective, security selection was weakest in the UK. • From a sector standpoint, security selection was weakest in utilities. |
| Performance Past Does Not Indicate Future [Text] |
The investment return and principal value will fluctuate so that an investor's shares, when redeemed, may be worth more or less than the original cost. Past performance is not a good predictor of the Fund's future performance.
|
| Line Graph [Table Text Block] |
Table Summary | Victory Trivalent International Fund - Core Equity Class A @ NAV - $26,987 | Victory Trivalent International Fund - Core Equity Class A @ MOP - $25,423 | MSCI ACWI ex USA Index (Net) (regulatory broad based index) - $25,765 |
|---|
6/16 | $10,000 | $9,421 | $10,000 |
|---|
6/17 | $11,895 | $11,206 | $12,045 |
|---|
6/18 | $12,816 | $12,074 | $12,922 |
|---|
6/19 | $12,618 | $11,887 | $13,088 |
|---|
6/20 | $12,005 | $11,309 | $12,460 |
|---|
6/21 | $15,640 | $14,734 | $16,910 |
|---|
6/22 | $12,617 | $11,886 | $13,626 |
|---|
6/23 | $14,520 | $13,679 | $15,359 |
|---|
6/24 | $16,824 | $15,849 | $17,144 |
|---|
6/25 | $20,226 | $19,054 | $20,183 |
|---|
6/26 | $26,987 | $25,423 | $25,765 |
|---|
|
| Average Annual Return [Table Text Block] |
Table Summary | 1 Year | 5 Year | 10 Year |
|---|
Class A @ NAV | 33.43%Footnote Reference | 11.53% | 10.44% |
|---|
Class A @ MOP | 25.77% | 10.21% | 9.78% |
|---|
MSCI ACWI ex USA Index (Net) | 27.66% | 8.79% | 9.93% |
|---|
|
| No Deduction of Taxes [Text Block] |
The graph and table total returns do not reflect the deduction of taxes that a shareholder would pay on Fund distributions, or redemption of shares.
|
| Previous Investment Adviser [Text Block] |
The maximum offering price (“MOP”) figures reflect a maximum sales charge of 5.75% for Class A. The Net Asset Value ("NAV") figures do not reflect sales charges.
|
| AssetsNet |
$ 336,059,000
|
| Holdings Count | Holding |
201
|
| Advisory Fees Paid, Amount |
$ 2,187,000
|
| InvestmentCompanyPortfolioTurnover |
44.00%
|
| Additional Fund Statistics [Text Block] |
FUND STATISTICS($ amounts in 000s)(as of June 30, 2026)Table SummaryNet Assets | $336,059 |
|---|
Number of Holdings | 201 |
|---|
Investment Advisory Fees | $2,187 |
|---|
Portfolio Turnover | 44% |
|---|
|
| C000144997 |
|
| Shareholder Report [Line Items] |
|
| Fund Name |
Victory Trivalent International Fund - Core Equity
|
| Class Name |
Class I
|
| Trading Symbol |
MICIX
|
| Annual or Semi-Annual Statement [Text Block] |
Annual Shareholder Report
|
| Additional Information [Text Block] |
You can find additional information about the Fund at advisor.vcm.com/literature/ mutual-fund-prospectuses. You may also request more information by calling 800-539-3863 or visiting vcm.com/contact-us.
|
| Additional Information Phone Number |
800-539-3863
|
| Additional Information Website |
vcm.com
|
| Expenses [Text Block] |
What were the Fund's costs for the last year?(based on a hypothetical $10,000 investment) Table SummaryClass Name | Costs of a $10,000 Investment | Costs paid as a percentage of a $10,000 Investment |
|---|
Class I | $70 | 0.60% |
|---|
| | |
|---|
|
| Expenses Paid, Amount |
$ 70
|
| Expense Ratio, Percent |
0.60%
|
| Factors Affecting Performance [Text Block] |
What affected the Fund’s performance during the last year?International returns were supported by continued enthusiasm for artificial intelligence and resilient corporate earnings despite a challenging geopolitical backdrop. All six regions posted gains during the period. Nine of the eleven sectors posted gains, with technology the highest-performing sector. The communication services sector trailed the broader MSCI ACWI ex USA Index (the "Index”). Top contributors to performance: • Security selection was positive and yielded relative outperformance for the Fund. • Excess returns were generated in five of the six regions and eight of the eleven economic sectors relative to the Index. • From a regional standpoint, security selection was strongest in Japan. • From a sector standpoint, security selection was strongest in technology. • From a style perspective, the Fund’s multi-factor exposure had a positive impact on relative performance, with business momentum generating the strongest signal. Exposure to value and quality were also additive. Top detractors from performance: • From a regional perspective, security selection was weakest in the UK. • From a sector standpoint, security selection was weakest in utilities. |
| Performance Past Does Not Indicate Future [Text] |
The investment return and principal value will fluctuate so that an investor's shares, when redeemed, may be worth more or less than the original cost. Past performance is not a good predictor of the Fund's future performance.
|
| Line Graph [Table Text Block] |
Table Summary | Victory Trivalent International Fund - Core Equity Class I - $5,589,409 | MSCI ACWI ex USA Index (Net) (regulatory broad based index) - $5,152,931 |
|---|
6/16 | $2,000,000 | $2,000,000 |
|---|
6/17 | $2,386,004 | $2,409,007 |
|---|
6/18 | $2,578,593 | $2,584,344 |
|---|
6/19 | $2,551,623 | $2,617,645 |
|---|
6/20 | $2,436,747 | $2,491,926 |
|---|
6/21 | $3,183,589 | $3,382,019 |
|---|
6/22 | $2,577,612 | $2,725,261 |
|---|
6/23 | $2,974,613 | $3,071,800 |
|---|
6/24 | $3,458,616 | $3,428,843 |
|---|
6/25 | $4,176,292 | $4,036,542 |
|---|
6/26 | $5,589,409 | $5,152,931 |
|---|
|
| Average Annual Return [Table Text Block] |
Table Summary | 1 Year | 5 Year | 10 Year |
|---|
Class I | 33.84%Footnote Reference | 11.92% | 10.82% |
|---|
MSCI ACWI ex USA Index (Net) | 27.66% | 8.79% | 9.93% |
|---|
|
| No Deduction of Taxes [Text Block] |
The graph and table total returns do not reflect the deduction of taxes that a shareholder would pay on Fund distributions, or redemption of shares.
|
| AssetsNet |
$ 336,059,000
|
| Holdings Count | Holding |
201
|
| Advisory Fees Paid, Amount |
$ 2,187,000
|
| InvestmentCompanyPortfolioTurnover |
44.00%
|
| Additional Fund Statistics [Text Block] |
FUND STATISTICS($ amounts in 000s)(as of June 30, 2026)Table SummaryNet Assets | $336,059 |
|---|
Number of Holdings | 201 |
|---|
Investment Advisory Fees | $2,187 |
|---|
Portfolio Turnover | 44% |
|---|
|
| C000155527 |
|
| Shareholder Report [Line Items] |
|
| Fund Name |
Victory Trivalent International Fund - Core Equity
|
| Class Name |
Class R6
|
| Trading Symbol |
MAIRX
|
| Annual or Semi-Annual Statement [Text Block] |
Annual Shareholder Report
|
| Additional Information [Text Block] |
You can find additional information about the Fund at advisor.vcm.com/literature/ mutual-fund-prospectuses. You may also request more information by calling 800-539-3863 or visiting vcm.com/contact-us.
|
| Additional Information Phone Number |
800-539-3863
|
| Additional Information Website |
vcm.com
|
| Expenses [Text Block] |
What were the Fund's costs for the last year?(based on a hypothetical $10,000 investment) Table SummaryClass Name | Costs of a $10,000 Investment | Costs paid as a percentage of a $10,000 Investment |
|---|
Class R6 | $64 | 0.55% |
|---|
| | |
|---|
|
| Expenses Paid, Amount |
$ 64
|
| Expense Ratio, Percent |
0.55%
|
| Factors Affecting Performance [Text Block] |
What affected the Fund’s performance during the last year?International returns were supported by continued enthusiasm for artificial intelligence and resilient corporate earnings despite a challenging geopolitical backdrop. All six regions posted gains during the period. Nine of the eleven sectors posted gains, with technology the highest-performing sector. The communication services sector trailed the broader MSCI ACWI ex USA Index (the "Index”). Top contributors to performance: • Security selection was positive and yielded relative outperformance for the Fund. • Excess returns were generated in five of the six regions and eight of the eleven economic sectors relative to the Index. • From a regional standpoint, security selection was strongest in Japan. • From a sector standpoint, security selection was strongest in technology. • From a style perspective, the Fund’s multi-factor exposure had a positive impact on relative performance, with business momentum generating the strongest signal. Exposure to value and quality were also additive. Top detractors from performance: • From a regional perspective, security selection was weakest in the UK. • From a sector standpoint, security selection was weakest in utilities. |
| Performance Past Does Not Indicate Future [Text] |
The investment return and principal value will fluctuate so that an investor's shares, when redeemed, may be worth more or less than the original cost. Past performance is not a good predictor of the Fund's future performance.
|
| Line Graph [Table Text Block] |
Table Summary | Victory Trivalent International Fund - Core Equity Class R6 - $28,088 | MSCI ACWI ex USA Index (Net) (regulatory broad based index) - $25,765 |
|---|
6/16 | $10,000 | $10,000 |
|---|
6/17 | $11,939 | $12,045 |
|---|
6/18 | $12,910 | $12,922 |
|---|
6/19 | $12,766 | $13,088 |
|---|
6/20 | $12,212 | $12,460 |
|---|
6/21 | $15,945 | $16,910 |
|---|
6/22 | $12,927 | $13,626 |
|---|
6/23 | $14,932 | $15,359 |
|---|
6/24 | $17,352 | $17,144 |
|---|
6/25 | $20,957 | $20,183 |
|---|
6/26 | $28,088 | $25,765 |
|---|
|
| Average Annual Return [Table Text Block] |
Table Summary | 1 Year | 5 Year | 10 Year |
|---|
Class R6 | 34.03%Footnote Reference | 11.99% | 10.88% |
|---|
MSCI ACWI ex USA Index (Net) | 27.66% | 8.79% | 9.93% |
|---|
|
| No Deduction of Taxes [Text Block] |
The graph and table total returns do not reflect the deduction of taxes that a shareholder would pay on Fund distributions, or redemption of shares.
|
| AssetsNet |
$ 336,059,000
|
| Holdings Count | Holding |
201
|
| Advisory Fees Paid, Amount |
$ 2,187,000
|
| InvestmentCompanyPortfolioTurnover |
44.00%
|
| Additional Fund Statistics [Text Block] |
FUND STATISTICS($ amounts in 000s)(as of June 30, 2026)Table SummaryNet Assets | $336,059 |
|---|
Number of Holdings | 201 |
|---|
Investment Advisory Fees | $2,187 |
|---|
Portfolio Turnover | 44% |
|---|
|
| C000144998 |
|
| Shareholder Report [Line Items] |
|
| Fund Name |
Victory Trivalent International Fund - Core Equity
|
| Class Name |
Class Y
|
| Trading Symbol |
MICYX
|
| Annual or Semi-Annual Statement [Text Block] |
Annual Shareholder Report
|
| Additional Information [Text Block] |
You can find additional information about the Fund at advisor.vcm.com/literature/ mutual-fund-prospectuses. You may also request more information by calling 800-539-3863 or visiting vcm.com/contact-us.
|
| Additional Information Phone Number |
800-539-3863
|
| Additional Information Website |
vcm.com
|
| Expenses [Text Block] |
What were the Fund's costs for the last year?(based on a hypothetical $10,000 investment) Table SummaryClass Name | Costs of a $10,000 Investment | Costs paid as a percentage of a $10,000 Investment |
|---|
Class Y | $82 | 0.70% |
|---|
| | |
|---|
|
| Expenses Paid, Amount |
$ 82
|
| Expense Ratio, Percent |
0.70%
|
| Factors Affecting Performance [Text Block] |
What affected the Fund’s performance during the last year?International returns were supported by continued enthusiasm for artificial intelligence and resilient corporate earnings despite a challenging geopolitical backdrop. All six regions posted gains during the period. Nine of the eleven sectors posted gains, with technology the highest-performing sector. The communication services sector trailed the broader MSCI ACWI ex USA Index (the "Index”). Top contributors to performance: • Security selection was positive and yielded relative outperformance for the Fund. • Excess returns were generated in five of the six regions and eight of the eleven economic sectors relative to the Index. • From a regional standpoint, security selection was strongest in Japan. • From a sector standpoint, security selection was strongest in technology. • From a style perspective, the Fund’s multi-factor exposure had a positive impact on relative performance, with business momentum generating the strongest signal. Exposure to value and quality were also additive. Top detractors from performance: • From a regional perspective, security selection was weakest in the UK. • From a sector standpoint, security selection was weakest in utilities. |
| Performance Past Does Not Indicate Future [Text] |
The investment return and principal value will fluctuate so that an investor's shares, when redeemed, may be worth more or less than the original cost. Past performance is not a good predictor of the Fund's future performance.
|
| Line Graph [Table Text Block] |
Table Summary | Victory Trivalent International Fund - Core Equity Class Y - $2,768,521 | MSCI ACWI ex USA Index (Net) (regulatory broad based index) - $2,576,465 |
|---|
6/16 | $1,000,000 | $1,000,000 |
|---|
6/17 | $1,192,818 | $1,204,504 |
|---|
6/18 | $1,288,331 | $1,292,172 |
|---|
6/19 | $1,271,122 | $1,308,823 |
|---|
6/20 | $1,212,669 | $1,245,963 |
|---|
6/21 | $1,584,026 | $1,691,010 |
|---|
6/22 | $1,282,462 | $1,362,631 |
|---|
6/23 | $1,477,697 | $1,535,900 |
|---|
6/24 | $1,716,482 | $1,714,421 |
|---|
6/25 | $2,068,945 | $2,018,271 |
|---|
6/26 | $2,768,521 | $2,576,465 |
|---|
|
| Average Annual Return [Table Text Block] |
Table Summary | 1 Year | 5 Year | 10 Year |
|---|
Class Y | 33.81%Footnote Reference | 11.81% | 10.72% |
|---|
MSCI ACWI ex USA Index (Net) | 27.66% | 8.79% | 9.93% |
|---|
|
| No Deduction of Taxes [Text Block] |
The graph and table total returns do not reflect the deduction of taxes that a shareholder would pay on Fund distributions, or redemption of shares.
|
| AssetsNet |
$ 336,059,000
|
| Holdings Count | Holding |
201
|
| Advisory Fees Paid, Amount |
$ 2,187,000
|
| InvestmentCompanyPortfolioTurnover |
44.00%
|
| Additional Fund Statistics [Text Block] |
FUND STATISTICS($ amounts in 000s)(as of June 30, 2026)Table SummaryNet Assets | $336,059 |
|---|
Number of Holdings | 201 |
|---|
Investment Advisory Fees | $2,187 |
|---|
Portfolio Turnover | 44% |
|---|
|
| C000144999 |
|
| Shareholder Report [Line Items] |
|
| Fund Name |
Victory Trivalent International Small-Cap Fund
|
| Class Name |
Class A
|
| Trading Symbol |
MISAX
|
| Annual or Semi-Annual Statement [Text Block] |
Annual Shareholder Report
|
| Additional Information [Text Block] |
You can find additional information about the Fund at advisor.vcm.com/literature/mutual-fund-prospectuses. You may also request more information by calling 800-539-3863 or visiting vcm.com/contact-us.
|
| Additional Information Phone Number |
800-539-3863
|
| Additional Information Website |
vcm.com
|
| Expenses [Text Block] |
What were the Fund's costs for the last year?(based on a hypothetical $10,000 investment) Table SummaryClass Name | Costs of a $10,000 Investment | Costs paid as a percentage of a $10,000 Investment |
|---|
Class A | $151 | 1.35% |
|---|
| | |
|---|
|
| Expenses Paid, Amount |
$ 151
|
| Expense Ratio, Percent |
1.35%
|
| Factors Affecting Performance [Text Block] |
What affected the Fund’s performance during the last year?International returns were supported by continued enthusiasm for artificial intelligence and resilient corporate earnings despite a challenging geopolitical backdrop. All five regions were positive during the period and nine of the eleven economic sectors posted gains in the S&P® Developed Ex-U.S. SmallCap Index (the “Index”). Technology was the strongest-performing sector while communication services detracted from performance relative to the broader Index. Top contributors to performance: • Overall security selection was positive and accounted for the Fund’s relative outperformance of the Index. • Excess returns were generated in three of the five regions and six of the eleven sectors. • Regionally, security selection was strongest in Japan. • From a sector standpoint, outperformance was generated within the industrials, materials, and information technology sectors. • From a style perspective, the Fund’s overall multi-factor exposure contributed positively to relative performance, with value generating the strongest signal. Top detractors from performance: • From a regional perspective, security selection was weakest in Europe. • At the sector level, relative underperformance was concentrated in health care, utilities, and consumer staples. • From a style perspective, exposure to quality was a minor headwind to relative performance. |
| Performance Past Does Not Indicate Future [Text] |
The investment return and principal value will fluctuate so that an investor's shares, when redeemed, may be worth more or less than the original cost. Past performance is not a good predictor of the Fund's future performance.
|
| Line Graph [Table Text Block] |
Table Summary | Victory Trivalent International Small-Cap Fund Class A @ NAV - $26,394 | Victory Trivalent International Small-Cap Fund Class A @ MOP - $24,878 | MSCI All Country World Index (regulatory broad based index) - $33,301 | S&P Developed Ex-U.S. SmallCap Index - $21,659 |
|---|
6/16 | $10,000 | $9,426 | $10,000 | $10,000 |
|---|
6/17 | $12,204 | $11,503 | $11,878 | $12,135 |
|---|
6/18 | $13,929 | $13,129 | $13,153 | $13,469 |
|---|
6/19 | $12,937 | $12,195 | $13,908 | $12,640 |
|---|
6/20 | $12,957 | $12,213 | $14,202 | $12,117 |
|---|
6/21 | $18,218 | $17,172 | $19,778 | $17,402 |
|---|
6/22 | $13,623 | $12,841 | $16,663 | $13,005 |
|---|
6/23 | $15,409 | $14,524 | $19,417 | $14,370 |
|---|
6/24 | $16,859 | $15,891 | $23,179 | $15,461 |
|---|
6/25 | $21,326 | $20,102 | $26,927 | $18,521 |
|---|
6/26 | $26,394 | $24,878 | $33,301 | $21,659 |
|---|
|
| Average Annual Return [Table Text Block] |
Table Summary | 1 Year | 5 Year | 10 Year |
|---|
Class A @ NAV | 23.70%Footnote Reference | 7.70% | 10.19% |
|---|
Class A @ MOP | 16.58% | 6.43% | 9.54% |
|---|
MSCI All Country World Index | 23.67% | 10.98% | 12.78% |
|---|
S&P Developed Ex-U.S. SmallCap Index | 16.94% | 4.47% | 8.03% |
|---|
|
| No Deduction of Taxes [Text Block] |
The graph and table total returns do not reflect the deduction of taxes that a shareholder would pay on Fund distributions, or redemption of shares.
|
| Previous Investment Adviser [Text Block] |
The maximum offering price (“MOP”) figures reflect a maximum sales charge of 5.75% for Class A. The Net Asset Value ("NAV") figures do not reflect sales charges.
|
| AssetsNet |
$ 4,676,035,000
|
| Holdings Count | Holding |
232
|
| Advisory Fees Paid, Amount |
$ 39,242,000
|
| InvestmentCompanyPortfolioTurnover |
55.00%
|
| Additional Fund Statistics [Text Block] |
FUND STATISTICS($ amounts in 000s)(as of June 30, 2026)Table SummaryNet Assets | $4,676,035 |
|---|
Number of Holdings | 232 |
|---|
Investment Advisory Fees | $39,242 |
|---|
Portfolio Turnover | 55% |
|---|
|
| C000145000 |
|
| Shareholder Report [Line Items] |
|
| Fund Name |
Victory Trivalent International Small-Cap Fund
|
| Class Name |
Class C
|
| Trading Symbol |
MCISX
|
| Annual or Semi-Annual Statement [Text Block] |
Annual Shareholder Report
|
| Additional Information [Text Block] |
You can find additional information about the Fund at advisor.vcm.com/literature/mutual-fund-prospectuses. You may also request more information by calling 800-539-3863 or visiting vcm.com/contact-us.
|
| Additional Information Phone Number |
800-539-3863
|
| Additional Information Website |
vcm.com
|
| Expenses [Text Block] |
What were the Fund's costs for the last year?(based on a hypothetical $10,000 investment) Table SummaryClass Name | Costs of a $10,000 Investment | Costs paid as a percentage of a $10,000 Investment |
|---|
Class C | $234 | 2.10% |
|---|
| | |
|---|
|
| Expenses Paid, Amount |
$ 234
|
| Expense Ratio, Percent |
2.10%
|
| Factors Affecting Performance [Text Block] |
What affected the Fund’s performance during the last year?International returns were supported by continued enthusiasm for artificial intelligence and resilient corporate earnings despite a challenging geopolitical backdrop. All five regions were positive during the period and nine of the eleven economic sectors posted gains in the S&P® Developed Ex-U.S. SmallCap Index (the “Index”). Technology was the strongest-performing sector while communication services detracted from performance relative to the broader Index. Top contributors to performance: • Overall security selection was positive and accounted for the Fund’s relative outperformance of the Index. • Excess returns were generated in three of the five regions and six of the eleven sectors. • Regionally, security selection was strongest in Japan. • From a sector standpoint, outperformance was generated within the industrials, materials, and information technology sectors. • From a style perspective, the Fund’s overall multi-factor exposure contributed positively to relative performance, with value generating the strongest signal. Top detractors from performance: • From a regional perspective, security selection was weakest in Europe. • At the sector level, relative underperformance was concentrated in health care, utilities, and consumer staples. • From a style perspective, exposure to quality was a minor headwind to relative performance. |
| Performance Past Does Not Indicate Future [Text] |
The investment return and principal value will fluctuate so that an investor's shares, when redeemed, may be worth more or less than the original cost. Past performance is not a good predictor of the Fund's future performance.
|
| Line Graph [Table Text Block] |
Table Summary | Victory Trivalent International Small-Cap Fund Class C @ NAV - $24,842 | Victory Trivalent International Small-Cap Fund Class C @ CDSC - $24,842 | MSCI All Country World Index (regulatory broad based index) - $33,301 | S&P Developed Ex-U.S. SmallCap Index - $21,659 |
|---|
6/16 | $10,000 | $10,000 | $10,000 | $10,000 |
|---|
6/17 | $12,114 | $12,114 | $11,878 | $12,135 |
|---|
6/18 | $13,723 | $13,723 | $13,153 | $13,469 |
|---|
6/19 | $12,656 | $12,656 | $13,908 | $12,640 |
|---|
6/20 | $12,573 | $12,573 | $14,202 | $12,117 |
|---|
6/21 | $17,549 | $17,549 | $19,778 | $17,402 |
|---|
6/22 | $13,014 | $13,014 | $16,663 | $13,005 |
|---|
6/23 | $14,622 | $14,622 | $19,417 | $14,370 |
|---|
6/24 | $15,868 | $15,868 | $23,179 | $15,461 |
|---|
6/25 | $20,072 | $20,072 | $26,927 | $18,521 |
|---|
6/26 | $24,842 | $24,842 | $33,301 | $21,659 |
|---|
|
| Average Annual Return [Table Text Block] |
Table Summary | 1 Year | 5 Year | 10 Year |
|---|
Class C @ NAV | 22.77%Footnote Reference | 6.88% | 9.53% |
|---|
Class C @ CDSC | 21.77% | 6.88% | 9.53% |
|---|
MSCI All Country World Index | 23.67% | 10.98% | 12.78% |
|---|
S&P Developed Ex-U.S. SmallCap Index | 16.94% | 4.47% | 8.03% |
|---|
|
| No Deduction of Taxes [Text Block] |
The graph and table total returns do not reflect the deduction of taxes that a shareholder would pay on Fund distributions, or redemption of shares.
|
| Previous Investment Adviser [Text Block] |
Class C is not subject to an initial sales charge, but is subject to Contingent Deferred Sales Charge (“CDSC”) of 1.00% on shares redeemed within one year of purchase. The Net Asset Value ("NAV") figures do not reflect sales charges.
|
| AssetsNet |
$ 4,676,035,000
|
| Holdings Count | Holding |
232
|
| Advisory Fees Paid, Amount |
$ 39,242,000
|
| InvestmentCompanyPortfolioTurnover |
55.00%
|
| Additional Fund Statistics [Text Block] |
FUND STATISTICS($ amounts in 000s)(as of June 30, 2026)Table SummaryNet Assets | $4,676,035 |
|---|
Number of Holdings | 232 |
|---|
Investment Advisory Fees | $39,242 |
|---|
Portfolio Turnover | 55% |
|---|
|
| C000145001 |
|
| Shareholder Report [Line Items] |
|
| Fund Name |
Victory Trivalent International Small-Cap Fund
|
| Class Name |
Class I
|
| Trading Symbol |
MISIX
|
| Annual or Semi-Annual Statement [Text Block] |
Annual Shareholder Report
|
| Additional Information [Text Block] |
You can find additional information about the Fund at advisor.vcm.com/literature/mutual-fund-prospectuses. You may also request more information by calling 800-539-3863 or visiting vcm.com/contact-us.
|
| Additional Information Phone Number |
800-539-3863
|
| Additional Information Website |
vcm.com
|
| Expenses [Text Block] |
What were the Fund's costs for the last year?(based on a hypothetical $10,000 investment) Table SummaryClass Name | Costs of a $10,000 Investment | Costs paid as a percentage of a $10,000 Investment |
|---|
Class I | $109 | 0.97% |
|---|
| | |
|---|
|
| Expenses Paid, Amount |
$ 109
|
| Expense Ratio, Percent |
0.97%
|
| Factors Affecting Performance [Text Block] |
What affected the Fund’s performance during the last year?International returns were supported by continued enthusiasm for artificial intelligence and resilient corporate earnings despite a challenging geopolitical backdrop. All five regions were positive during the period and nine of the eleven economic sectors posted gains in the S&P® Developed Ex-U.S. SmallCap Index (the “Index”). Technology was the strongest-performing sector while communication services detracted from performance relative to the broader Index. Top contributors to performance: • Overall security selection was positive and accounted for the Fund’s relative outperformance of the Index. • Excess returns were generated in three of the five regions and six of the eleven sectors. • Regionally, security selection was strongest in Japan. • From a sector standpoint, outperformance was generated within the industrials, materials, and information technology sectors. • From a style perspective, the Fund’s overall multi-factor exposure contributed positively to relative performance, with value generating the strongest signal. Top detractors from performance: • From a regional perspective, security selection was weakest in Europe. • At the sector level, relative underperformance was concentrated in health care, utilities, and consumer staples. • From a style perspective, exposure to quality was a minor headwind to relative performance. |
| Performance Past Does Not Indicate Future [Text] |
The investment return and principal value will fluctuate so that an investor's shares, when redeemed, may be worth more or less than the original cost. Past performance is not a good predictor of the Fund's future performance.
|
| Line Graph [Table Text Block] |
Table Summary | Victory Trivalent International Small-Cap Fund Class I - $5,490,318 | MSCI All Country World Index (regulatory broad based index) - $6,660,228 | S&P Developed Ex-U.S. SmallCap Index - $4,331,749 |
|---|
6/16 | $2,000,000 | $2,000,000 | $2,000,000 |
|---|
6/17 | $2,449,076 | $2,375,617 | $2,427,051 |
|---|
6/18 | $2,806,760 | $2,630,500 | $2,693,831 |
|---|
6/19 | $2,618,890 | $2,781,605 | $2,528,014 |
|---|
6/20 | $2,632,966 | $2,840,309 | $2,423,316 |
|---|
6/21 | $3,716,723 | $3,955,570 | $3,480,362 |
|---|
6/22 | $2,789,209 | $3,332,582 | $2,601,075 |
|---|
6/23 | $3,169,126 | $3,883,451 | $2,874,080 |
|---|
6/24 | $3,479,779 | $4,635,866 | $3,092,190 |
|---|
6/25 | $4,419,978 | $5,385,383 | $3,704,188 |
|---|
6/26 | $5,490,318 | $6,660,228 | $4,331,749 |
|---|
|
| Average Annual Return [Table Text Block] |
Table Summary | 1 Year | 5 Year | 10 Year |
|---|
Class I | 24.22%Footnote Reference | 8.12% | 10.63% |
|---|
MSCI All Country World Index | 23.67% | 10.98% | 12.78% |
|---|
S&P Developed Ex-U.S. SmallCap Index | 16.94% | 4.47% | 8.03% |
|---|
|
| No Deduction of Taxes [Text Block] |
The graph and table total returns do not reflect the deduction of taxes that a shareholder would pay on Fund distributions, or redemption of shares.
|
| AssetsNet |
$ 4,676,035,000
|
| Holdings Count | Holding |
232
|
| Advisory Fees Paid, Amount |
$ 39,242,000
|
| InvestmentCompanyPortfolioTurnover |
55.00%
|
| Additional Fund Statistics [Text Block] |
FUND STATISTICS($ amounts in 000s)(as of June 30, 2026)Table SummaryNet Assets | $4,676,035 |
|---|
Number of Holdings | 232 |
|---|
Investment Advisory Fees | $39,242 |
|---|
Portfolio Turnover | 55% |
|---|
|
| C000145002 |
|
| Shareholder Report [Line Items] |
|
| Fund Name |
Victory Trivalent International Small-Cap Fund
|
| Class Name |
Class R6
|
| Trading Symbol |
MSSIX
|
| Annual or Semi-Annual Statement [Text Block] |
Annual Shareholder Report
|
| Additional Information [Text Block] |
You can find additional information about the Fund at advisor.vcm.com/literature/mutual-fund-prospectuses. You may also request more information by calling 800-539-3863 or visiting vcm.com/contact-us.
|
| Additional Information Phone Number |
800-539-3863
|
| Additional Information Website |
vcm.com
|
| Expenses [Text Block] |
What were the Fund's costs for the last year?(based on a hypothetical $10,000 investment) Table SummaryClass Name | Costs of a $10,000 Investment | Costs paid as a percentage of a $10,000 Investment |
|---|
Class R6 | $112 | 1.00% |
|---|
| | |
|---|
|
| Expenses Paid, Amount |
$ 112
|
| Expense Ratio, Percent |
1.00%
|
| Factors Affecting Performance [Text Block] |
What affected the Fund’s performance during the last year?International returns were supported by continued enthusiasm for artificial intelligence and resilient corporate earnings despite a challenging geopolitical backdrop. All five regions were positive during the period and nine of the eleven economic sectors posted gains in the S&P® Developed Ex-U.S. SmallCap Index (the “Index”). Technology was the strongest-performing sector while communication services detracted from performance relative to the broader Index. Top contributors to performance: • Overall security selection was positive and accounted for the Fund’s relative outperformance of the Index. • Excess returns were generated in three of the five regions and six of the eleven sectors. • Regionally, security selection was strongest in Japan. • From a sector standpoint, outperformance was generated within the industrials, materials, and information technology sectors. • From a style perspective, the Fund’s overall multi-factor exposure contributed positively to relative performance, with value generating the strongest signal. Top detractors from performance: • From a regional perspective, security selection was weakest in Europe. • At the sector level, relative underperformance was concentrated in health care, utilities, and consumer staples. • From a style perspective, exposure to quality was a minor headwind to relative performance. |
| Performance Past Does Not Indicate Future [Text] |
The investment return and principal value will fluctuate so that an investor's shares, when redeemed, may be worth more or less than the original cost. Past performance is not a good predictor of the Fund's future performance.
|
| Line Graph [Table Text Block] |
Table Summary | Victory Trivalent International Small-Cap Fund Class R6 - $27,189 | MSCI All Country World Index (regulatory broad based index) - $33,301 | S&P Developed Ex-U.S. SmallCap Index - $21,659 |
|---|
6/16 | $10,000 | $10,000 | $10,000 |
|---|
6/17 | $12,228 | $11,878 | $12,135 |
|---|
6/18 | $13,999 | $13,153 | $13,469 |
|---|
6/19 | $13,039 | $13,908 | $12,640 |
|---|
6/20 | $13,086 | $14,202 | $12,117 |
|---|
6/21 | $18,470 | $19,778 | $17,402 |
|---|
6/22 | $13,841 | $16,663 | $13,005 |
|---|
6/23 | $15,716 | $19,417 | $14,370 |
|---|
6/24 | $17,251 | $23,179 | $15,461 |
|---|
6/25 | $21,898 | $26,927 | $18,521 |
|---|
6/26 | $27,189 | $33,301 | $21,659 |
|---|
|
| Average Annual Return [Table Text Block] |
Table Summary | 1 Year | 5 Year | 10 Year |
|---|
Class R6 | 24.16%Footnote Reference | 8.04% | 10.52% |
|---|
MSCI All Country World Index | 23.67% | 10.98% | 12.78% |
|---|
S&P Developed Ex-U.S. SmallCap Index | 16.94% | 4.47% | 8.03% |
|---|
|
| No Deduction of Taxes [Text Block] |
The graph and table total returns do not reflect the deduction of taxes that a shareholder would pay on Fund distributions, or redemption of shares.
|
| AssetsNet |
$ 4,676,035,000
|
| Holdings Count | Holding |
232
|
| Advisory Fees Paid, Amount |
$ 39,242,000
|
| InvestmentCompanyPortfolioTurnover |
55.00%
|
| Additional Fund Statistics [Text Block] |
FUND STATISTICS($ amounts in 000s)(as of June 30, 2026)Table SummaryNet Assets | $4,676,035 |
|---|
Number of Holdings | 232 |
|---|
Investment Advisory Fees | $39,242 |
|---|
Portfolio Turnover | 55% |
|---|
|
| C000145003 |
|
| Shareholder Report [Line Items] |
|
| Fund Name |
Victory Trivalent International Small-Cap Fund
|
| Class Name |
Class Y
|
| Trading Symbol |
MYSIX
|
| Annual or Semi-Annual Statement [Text Block] |
Annual Shareholder Report
|
| Additional Information [Text Block] |
You can find additional information about the Fund at advisor.vcm.com/literature/mutual-fund-prospectuses. You may also request more information by calling 800-539-3863 or visiting vcm.com/contact-us.
|
| Additional Information Phone Number |
800-539-3863
|
| Additional Information Website |
vcm.com
|
| Expenses [Text Block] |
What were the Fund's costs for the last year?(based on a hypothetical $10,000 investment) Table SummaryClass Name | Costs of a $10,000 Investment | Costs paid as a percentage of a $10,000 Investment |
|---|
Class Y | $123 | 1.10% |
|---|
| | |
|---|
|
| Expenses Paid, Amount |
$ 123
|
| Expense Ratio, Percent |
1.10%
|
| Factors Affecting Performance [Text Block] |
What affected the Fund’s performance during the last year?International returns were supported by continued enthusiasm for artificial intelligence and resilient corporate earnings despite a challenging geopolitical backdrop. All five regions were positive during the period and nine of the eleven economic sectors posted gains in the S&P® Developed Ex-U.S. SmallCap Index (the “Index”). Technology was the strongest-performing sector while communication services detracted from performance relative to the broader Index. Top contributors to performance: • Overall security selection was positive and accounted for the Fund’s relative outperformance of the Index. • Excess returns were generated in three of the five regions and six of the eleven sectors. • Regionally, security selection was strongest in Japan. • From a sector standpoint, outperformance was generated within the industrials, materials, and information technology sectors. • From a style perspective, the Fund’s overall multi-factor exposure contributed positively to relative performance, with value generating the strongest signal. Top detractors from performance: • From a regional perspective, security selection was weakest in Europe. • At the sector level, relative underperformance was concentrated in health care, utilities, and consumer staples. • From a style perspective, exposure to quality was a minor headwind to relative performance. |
| Performance Past Does Not Indicate Future [Text] |
The investment return and principal value will fluctuate so that an investor's shares, when redeemed, may be worth more or less than the original cost. Past performance is not a good predictor of the Fund's future performance.
|
| Line Graph [Table Text Block] |
Table Summary | Victory Trivalent International Small-Cap Fund Class Y - $2,704,953 | MSCI All Country World Index (regulatory broad based index) - $3,330,114 | S&P Developed Ex-U.S. SmallCap Index - $2,165,874 |
|---|
6/16 | $1,000,000 | $1,000,000 | $1,000,000 |
|---|
6/17 | $1,222,733 | $1,187,809 | $1,213,526 |
|---|
6/18 | $1,399,405 | $1,315,250 | $1,346,916 |
|---|
6/19 | $1,303,167 | $1,390,803 | $1,264,007 |
|---|
6/20 | $1,308,501 | $1,420,155 | $1,211,658 |
|---|
6/21 | $1,844,509 | $1,977,785 | $1,740,181 |
|---|
6/22 | $1,382,121 | $1,666,291 | $1,300,538 |
|---|
6/23 | $1,567,776 | $1,941,726 | $1,437,040 |
|---|
6/24 | $1,718,874 | $2,317,933 | $1,546,095 |
|---|
6/25 | $2,180,436 | $2,692,692 | $1,852,094 |
|---|
6/26 | $2,704,953 | $3,330,114 | $2,165,874 |
|---|
|
| Average Annual Return [Table Text Block] |
Table Summary | 1 Year | 5 Year | 10 Year |
|---|
Class Y | 24.06%Footnote Reference | 7.96% | 10.46% |
|---|
MSCI All Country World Index | 23.67% | 10.98% | 12.78% |
|---|
S&P Developed Ex-U.S. SmallCap Index | 16.94% | 4.47% | 8.03% |
|---|
|
| No Deduction of Taxes [Text Block] |
The graph and table total returns do not reflect the deduction of taxes that a shareholder would pay on Fund distributions, or redemption of shares.
|
| AssetsNet |
$ 4,676,035,000
|
| Holdings Count | Holding |
232
|
| Advisory Fees Paid, Amount |
$ 39,242,000
|
| InvestmentCompanyPortfolioTurnover |
55.00%
|
| Additional Fund Statistics [Text Block] |
FUND STATISTICS($ amounts in 000s)(as of June 30, 2026)Table SummaryNet Assets | $4,676,035 |
|---|
Number of Holdings | 232 |
|---|
Investment Advisory Fees | $39,242 |
|---|
Portfolio Turnover | 55% |
|---|
|
| C000002333 |
|
| Shareholder Report [Line Items] |
|
| Fund Name |
Victory Diversified Stock Fund
|
| Class Name |
Class A
|
| Trading Symbol |
SRVEX
|
| Annual or Semi-Annual Statement [Text Block] |
Annual Shareholder Report
|
| Additional Information [Text Block] |
You can find additional information about the Fund at advisor.vcm.com/literature/mutual-fund-prospectuses. You may also request more information by calling 800-539-3863 or visiting vcm.com/contact-us.
|
| Additional Information Phone Number |
800-539-3863
|
| Additional Information Website |
vcm.com
|
| Expenses [Text Block] |
What were the Fund's costs for the last year?(based on a hypothetical $10,000 investment) Table SummaryClass Name | Costs of a $10,000 Investment | Costs paid as a percentage of a $10,000 Investment |
|---|
Class A | $118 | 1.04% |
|---|
| | |
|---|
|
| Expenses Paid, Amount |
$ 118
|
| Expense Ratio, Percent |
1.04%
|
| Factors Affecting Performance [Text Block] |
What affected the Fund’s performance during the last year?Top contributors to performance: The Fund’s strongest relative performance versus the S&P 500® Index was driven by the financials and industrials sectors. Stocks that contributed most positively to the Fund’s relative performance were KLA Corp. and Comfort Systems USA, Inc.
Top detractors from performance: The information technology and materials sectors weighed most heavily on the Fund's relative performance. The Fund's underweight position in Micron Technology, Inc. and lack of exposure to Advanced Micro Devices, Inc. were the largest detractors in terms of relative performance.
|
| Performance Past Does Not Indicate Future [Text] |
The investment return and principal value will fluctuate so that an investor's shares, when redeemed, may be worth more or less than the original cost. Past performance is not a good predictor of the Fund's future performance.
|
| Line Graph [Table Text Block] |
Table Summary | Victory Diversified Stock Fund Class A @ NAV - $39,732 | Victory Diversified Stock Fund Class A @ MOP - $37,441 | S&P 500® Index (regulatory broad based index) - $42,271 |
|---|
6/16 | $10,000 | $9,423 | $10,000 |
|---|
6/17 | $11,186 | $10,541 | $11,790 |
|---|
6/18 | $12,758 | $12,022 | $13,484 |
|---|
6/19 | $13,319 | $12,551 | $14,889 |
|---|
6/20 | $13,811 | $13,015 | $16,006 |
|---|
6/21 | $19,457 | $18,335 | $22,536 |
|---|
6/22 | $17,816 | $16,789 | $20,144 |
|---|
6/23 | $21,732 | $20,479 | $24,091 |
|---|
6/24 | $26,873 | $25,323 | $30,006 |
|---|
6/25 | $31,370 | $29,561 | $34,556 |
|---|
6/26 | $39,732 | $37,441 | $42,271 |
|---|
|
| Average Annual Return [Table Text Block] |
Table Summary | 1 Year | 5 Year | 10 Year |
|---|
Class A @ NAV | 26.66%Footnote Reference | 15.35%Footnote Reference | 14.79% |
|---|
Class A @ MOP | 19.38% | 13.99% | 14.11% |
|---|
S&P 500® Index | 22.32% | 13.41% | 15.51% |
|---|
|
| No Deduction of Taxes [Text Block] |
The graph and table total returns do not reflect the deduction of taxes that a shareholder would pay on Fund distributions, or redemption of shares.
|
| Previous Investment Adviser [Text Block] |
The maximum offering price (“MOP”) figures reflect a maximum sales charge of 5.75% for Class A. The Net Asset Value ("NAV") figures do not reflect sales charges.
|
| AssetsNet |
$ 395,838,000
|
| Holdings Count | Holding |
114
|
| Advisory Fees Paid, Amount |
$ 2,407,000
|
| InvestmentCompanyPortfolioTurnover |
80.00%
|
| Additional Fund Statistics [Text Block] |
FUND STATISTICS($ amounts in 000s)(as of June 30, 2026)Table SummaryNet Assets | $395,838 |
|---|
Number of Holdings | 114 |
|---|
Investment Advisory Fees | $2,407 |
|---|
Portfolio Turnover | 80% |
|---|
|
| Holdings [Text Block] |
Top SectorsFootnote Reference* (% of Net Assets)Footnote Reference(as of June 30, 2026)Table SummaryValue | Value |
|---|
Utilities | 2.0% | Energy | 2.8% | Materials | 3.1% | Consumer Staples | 5.7% | Consumer Discretionary | 7.1% | Communication Services | 9.1% | Health Care | 9.2% | Industrials | 10.1% | Financials | 12.2% | Information TechnologyFootnote Reference** | 36.4% | Top 10 HoldingsFootnote Reference* (% of Net Assets)Footnote Reference(as of June 30, 2026)Table SummaryNVIDIA Corp. | 8.5% |
|---|
Apple, Inc. | 7.6% |
|---|
Alphabet, Inc., Class C | 5.9% |
|---|
Microsoft Corp. | 3.5% |
|---|
Broadcom, Inc. | 2.9% |
|---|
Micron Technology, Inc. | 2.5% |
|---|
KLA Corp. | 2.2% |
|---|
Amazon.com, Inc. | 1.8% |
|---|
State Street Real Estate Select Sector SPDR ETF | 1.8% |
|---|
Amphenol Corp., Class A | 1.6% |
|---|
|
| C000002336 |
|
| Shareholder Report [Line Items] |
|
| Fund Name |
Victory Diversified Stock Fund
|
| Class Name |
Class C
|
| Trading Symbol |
VDSCX
|
| Annual or Semi-Annual Statement [Text Block] |
Annual Shareholder Report
|
| Additional Information [Text Block] |
You can find additional information about the Fund at advisor.vcm.com/literature/mutual-fund-prospectuses. You may also request more information by calling 800-539-3863 or visiting vcm.com/contact-us.
|
| Additional Information Phone Number |
800-539-3863
|
| Additional Information Website |
vcm.com
|
| Expenses [Text Block] |
What were the Fund's costs for the last year?(based on a hypothetical $10,000 investment) Table SummaryClass Name | Costs of a $10,000 Investment | Costs paid as a percentage of a $10,000 Investment |
|---|
Class C | $228 | 2.02% |
|---|
| | |
|---|
|
| Expenses Paid, Amount |
$ 228
|
| Expense Ratio, Percent |
2.02%
|
| Factors Affecting Performance [Text Block] |
What affected the Fund’s performance during the last year?Top contributors to performance: The Fund’s strongest relative performance versus the S&P 500® Index was driven by the financials and industrials sectors. Stocks that contributed most positively to the Fund’s relative performance were KLA Corp. and Comfort Systems USA, Inc.
Top detractors from performance: The information technology and materials sectors weighed most heavily on the Fund's relative performance. The Fund's underweight position in Micron Technology, Inc. and lack of exposure to Advanced Micro Devices, Inc. were the largest detractors in terms of relative performance.
|
| Performance Past Does Not Indicate Future [Text] |
The investment return and principal value will fluctuate so that an investor's shares, when redeemed, may be worth more or less than the original cost. Past performance is not a good predictor of the Fund's future performance.
|
| Line Graph [Table Text Block] |
Table Summary | Victory Diversified Stock Fund Class C @ NAV - $36,922 | Victory Diversified Stock Fund Class C @ CDSC - $36,922 | S&P 500® Index (regulatory broad based index) - $42,271 |
|---|
6/16 | $10,000 | $10,000 | $10,000 |
|---|
6/17 | $11,088 | $11,088 | $11,790 |
|---|
6/18 | $12,542 | $12,542 | $13,484 |
|---|
6/19 | $12,979 | $12,979 | $14,889 |
|---|
6/20 | $13,332 | $13,332 | $16,006 |
|---|
6/21 | $18,602 | $18,602 | $22,536 |
|---|
6/22 | $16,873 | $16,873 | $20,144 |
|---|
6/23 | $20,394 | $20,394 | $24,091 |
|---|
6/24 | $24,972 | $24,972 | $30,006 |
|---|
6/25 | $29,150 | $29,150 | $34,556 |
|---|
6/26 | $36,922 | $36,922 | $42,271 |
|---|
|
| Average Annual Return [Table Text Block] |
Table Summary | 1 Year | 5 Year | 10 Year |
|---|
Class C @ NAV | 25.45%Footnote Reference | 14.25% | 13.95% |
|---|
Class C @ CDSC | 24.45% | 14.25% | 13.95% |
|---|
S&P 500® Index | 22.32% | 13.41% | 15.51% |
|---|
|
| No Deduction of Taxes [Text Block] |
The graph and table total returns do not reflect the deduction of taxes that a shareholder would pay on Fund distributions, or redemption of shares.
|
| Previous Investment Adviser [Text Block] |
Class C is not subject to an initial sales charge, but is subject to Contingent Deferred Sales Charge (“CDSC”) of 1.00% on shares redeemed within one year of purchase. The Net Asset Value ("NAV") figures do not reflect sales charges.
|
| AssetsNet |
$ 395,838,000
|
| Holdings Count | Holding |
114
|
| Advisory Fees Paid, Amount |
$ 2,407,000
|
| InvestmentCompanyPortfolioTurnover |
80.00%
|
| Additional Fund Statistics [Text Block] |
FUND STATISTICS($ amounts in 000s)(as of June 30, 2026)Table SummaryNet Assets | $395,838 |
|---|
Number of Holdings | 114 |
|---|
Investment Advisory Fees | $2,407 |
|---|
Portfolio Turnover | 80% |
|---|
|
| Holdings [Text Block] |
Top SectorsFootnote Reference* (% of Net Assets)Footnote Reference(as of June 30, 2026)Table SummaryValue | Value |
|---|
Utilities | 2.0% | Energy | 2.8% | Materials | 3.1% | Consumer Staples | 5.7% | Consumer Discretionary | 7.1% | Communication Services | 9.1% | Health Care | 9.2% | Industrials | 10.1% | Financials | 12.2% | Information TechnologyFootnote Reference** | 36.4% | Top 10 HoldingsFootnote Reference* (% of Net Assets)Footnote Reference(as of June 30, 2026)Table SummaryNVIDIA Corp. | 8.5% |
|---|
Apple, Inc. | 7.6% |
|---|
Alphabet, Inc., Class C | 5.9% |
|---|
Microsoft Corp. | 3.5% |
|---|
Broadcom, Inc. | 2.9% |
|---|
Micron Technology, Inc. | 2.5% |
|---|
KLA Corp. | 2.2% |
|---|
Amazon.com, Inc. | 1.8% |
|---|
State Street Real Estate Select Sector SPDR ETF | 1.8% |
|---|
Amphenol Corp., Class A | 1.6% |
|---|
|
| C000052113 |
|
| Shareholder Report [Line Items] |
|
| Fund Name |
Victory Diversified Stock Fund
|
| Class Name |
Class I
|
| Trading Symbol |
VDSIX
|
| Annual or Semi-Annual Statement [Text Block] |
Annual Shareholder Report
|
| Additional Information [Text Block] |
You can find additional information about the Fund at advisor.vcm.com/literature/mutual-fund-prospectuses. You may also request more information by calling 800-539-3863 or visiting vcm.com/contact-us.
|
| Additional Information Phone Number |
800-539-3863
|
| Additional Information Website |
vcm.com
|
| Expenses [Text Block] |
What were the Fund's costs for the last year?(based on a hypothetical $10,000 investment) Table SummaryClass Name | Costs of a $10,000 Investment | Costs paid as a percentage of a $10,000 Investment |
|---|
Class I | $94 | 0.83% |
|---|
| | |
|---|
|
| Expenses Paid, Amount |
$ 94
|
| Expense Ratio, Percent |
0.83%
|
| Factors Affecting Performance [Text Block] |
What affected the Fund’s performance during the last year?Top contributors to performance: The Fund’s strongest relative performance versus the S&P 500® Index was driven by the financials and industrials sectors. Stocks that contributed most positively to the Fund’s relative performance were KLA Corp. and Comfort Systems USA, Inc.
Top detractors from performance: The information technology and materials sectors weighed most heavily on the Fund's relative performance. The Fund's underweight position in Micron Technology, Inc. and lack of exposure to Advanced Micro Devices, Inc. were the largest detractors in terms of relative performance.
|
| Performance Past Does Not Indicate Future [Text] |
The investment return and principal value will fluctuate so that an investor's shares, when redeemed, may be worth more or less than the original cost. Past performance is not a good predictor of the Fund's future performance.
|
| Line Graph [Table Text Block] |
Table Summary | Victory Diversified Stock Fund Class I - $8,140,637 | S&P 500® Index (regulatory broad based index) - $8,454,225 |
|---|
6/16 | $2,000,000 | $2,000,000 |
|---|
6/17 | $2,241,997 | $2,357,920 |
|---|
6/18 | $2,563,826 | $2,696,848 |
|---|
6/19 | $2,683,635 | $2,977,791 |
|---|
6/20 | $2,789,879 | $3,201,277 |
|---|
6/21 | $3,939,973 | $4,507,211 |
|---|
6/22 | $3,617,038 | $4,028,733 |
|---|
6/23 | $4,423,091 | $4,818,127 |
|---|
6/24 | $5,480,428 | $6,001,270 |
|---|
6/25 | $6,411,980 | $6,911,282 |
|---|
6/26 | $8,140,637 | $8,454,225 |
|---|
|
| Average Annual Return [Table Text Block] |
Table Summary | 1 Year | 5 Year | 10 Year |
|---|
Class I | 26.96%Footnote Reference | 15.62%Footnote Reference | 15.07%Footnote Reference |
|---|
S&P 500® Index | 22.32% | 13.41% | 15.51% |
|---|
|
| No Deduction of Taxes [Text Block] |
The graph and table total returns do not reflect the deduction of taxes that a shareholder would pay on Fund distributions, or redemption of shares.
|
| AssetsNet |
$ 395,838,000
|
| Holdings Count | Holding |
114
|
| Advisory Fees Paid, Amount |
$ 2,407,000
|
| InvestmentCompanyPortfolioTurnover |
80.00%
|
| Additional Fund Statistics [Text Block] |
FUND STATISTICS($ amounts in 000s)(as of June 30, 2026)Table SummaryNet Assets | $395,838 |
|---|
Number of Holdings | 114 |
|---|
Investment Advisory Fees | $2,407 |
|---|
Portfolio Turnover | 80% |
|---|
|
| Holdings [Text Block] |
Top SectorsFootnote Reference* (% of Net Assets)Footnote Reference(as of June 30, 2026)Table SummaryValue | Value |
|---|
Utilities | 2.0% | Energy | 2.8% | Materials | 3.1% | Consumer Staples | 5.7% | Consumer Discretionary | 7.1% | Communication Services | 9.1% | Health Care | 9.2% | Industrials | 10.1% | Financials | 12.2% | Information TechnologyFootnote Reference** | 36.4% | Top 10 HoldingsFootnote Reference* (% of Net Assets)Footnote Reference(as of June 30, 2026)Table SummaryNVIDIA Corp. | 8.5% |
|---|
Apple, Inc. | 7.6% |
|---|
Alphabet, Inc., Class C | 5.9% |
|---|
Microsoft Corp. | 3.5% |
|---|
Broadcom, Inc. | 2.9% |
|---|
Micron Technology, Inc. | 2.5% |
|---|
KLA Corp. | 2.2% |
|---|
Amazon.com, Inc. | 1.8% |
|---|
State Street Real Estate Select Sector SPDR ETF | 1.8% |
|---|
Amphenol Corp., Class A | 1.6% |
|---|
|
| C000002337 |
|
| Shareholder Report [Line Items] |
|
| Fund Name |
Victory Diversified Stock Fund
|
| Class Name |
Class R
|
| Trading Symbol |
GRINX
|
| Annual or Semi-Annual Statement [Text Block] |
Annual Shareholder Report
|
| Additional Information [Text Block] |
You can find additional information about the Fund at advisor.vcm.com/literature/mutual-fund-prospectuses. You may also request more information by calling 800-539-3863 or visiting vcm.com/contact-us.
|
| Additional Information Phone Number |
800-539-3863
|
| Additional Information Website |
vcm.com
|
| Expenses [Text Block] |
What were the Fund's costs for the last year?(based on a hypothetical $10,000 investment) Table SummaryClass Name | Costs of a $10,000 Investment | Costs paid as a percentage of a $10,000 Investment |
|---|
Class R | $151 | 1.33% |
|---|
| | |
|---|
|
| Expenses Paid, Amount |
$ 151
|
| Expense Ratio, Percent |
1.33%
|
| Factors Affecting Performance [Text Block] |
What affected the Fund’s performance during the last year?Top contributors to performance: The Fund’s strongest relative performance versus the S&P 500® Index was driven by the financials and industrials sectors. Stocks that contributed most positively to the Fund’s relative performance were KLA Corp. and Comfort Systems USA, Inc.
Top detractors from performance: The information technology and materials sectors weighed most heavily on the Fund's relative performance. The Fund's underweight position in Micron Technology, Inc. and lack of exposure to Advanced Micro Devices, Inc. were the largest detractors in terms of relative performance.
|
| Performance Past Does Not Indicate Future [Text] |
The investment return and principal value will fluctuate so that an investor's shares, when redeemed, may be worth more or less than the original cost. Past performance is not a good predictor of the Fund's future performance.
|
| Line Graph [Table Text Block] |
Table Summary | Victory Diversified Stock Fund Class R - $38,623 | S&P 500® Index (regulatory broad based index) - $42,271 |
|---|
6/16 | $10,000 | $10,000 |
|---|
6/17 | $11,153 | $11,790 |
|---|
6/18 | $12,684 | $13,484 |
|---|
6/19 | $13,210 | $14,889 |
|---|
6/20 | $13,657 | $16,006 |
|---|
6/21 | $19,182 | $22,536 |
|---|
6/22 | $17,516 | $20,144 |
|---|
6/23 | $21,312 | $24,091 |
|---|
6/24 | $26,266 | $30,006 |
|---|
6/25 | $30,570 | $34,556 |
|---|
6/26 | $38,623 | $42,271 |
|---|
|
| Average Annual Return [Table Text Block] |
Table Summary | 1 Year | 5 Year | 10 Year |
|---|
Class R | 26.34%Footnote Reference | 15.02%Footnote Reference | 14.47% |
|---|
S&P 500® Index | 22.32% | 13.41% | 15.51% |
|---|
|
| No Deduction of Taxes [Text Block] |
The graph and table total returns do not reflect the deduction of taxes that a shareholder would pay on Fund distributions, or redemption of shares.
|
| AssetsNet |
$ 395,838,000
|
| Holdings Count | Holding |
114
|
| Advisory Fees Paid, Amount |
$ 2,407,000
|
| InvestmentCompanyPortfolioTurnover |
80.00%
|
| Additional Fund Statistics [Text Block] |
FUND STATISTICS($ amounts in 000s)(as of June 30, 2026)Table SummaryNet Assets | $395,838 |
|---|
Number of Holdings | 114 |
|---|
Investment Advisory Fees | $2,407 |
|---|
Portfolio Turnover | 80% |
|---|
|
| Holdings [Text Block] |
Top SectorsFootnote Reference* (% of Net Assets)Footnote Reference(as of June 30, 2026)Table SummaryValue | Value |
|---|
Utilities | 2.0% | Energy | 2.8% | Materials | 3.1% | Consumer Staples | 5.7% | Consumer Discretionary | 7.1% | Communication Services | 9.1% | Health Care | 9.2% | Industrials | 10.1% | Financials | 12.2% | Information TechnologyFootnote Reference** | 36.4% | Top 10 HoldingsFootnote Reference* (% of Net Assets)Footnote Reference(as of June 30, 2026)Table SummaryNVIDIA Corp. | 8.5% |
|---|
Apple, Inc. | 7.6% |
|---|
Alphabet, Inc., Class C | 5.9% |
|---|
Microsoft Corp. | 3.5% |
|---|
Broadcom, Inc. | 2.9% |
|---|
Micron Technology, Inc. | 2.5% |
|---|
KLA Corp. | 2.2% |
|---|
Amazon.com, Inc. | 1.8% |
|---|
State Street Real Estate Select Sector SPDR ETF | 1.8% |
|---|
Amphenol Corp., Class A | 1.6% |
|---|
|
| C000138365 |
|
| Shareholder Report [Line Items] |
|
| Fund Name |
Victory Diversified Stock Fund
|
| Class Name |
Class R6
|
| Trading Symbol |
VDSRX
|
| Annual or Semi-Annual Statement [Text Block] |
Annual Shareholder Report
|
| Additional Information [Text Block] |
You can find additional information about the Fund at advisor.vcm.com/literature/mutual-fund-prospectuses. You may also request more information by calling 800-539-3863 or visiting vcm.com/contact-us.
|
| Additional Information Phone Number |
800-539-3863
|
| Additional Information Website |
vcm.com
|
| Expenses [Text Block] |
What were the Fund's costs for the last year?(based on a hypothetical $10,000 investment) Table SummaryClass Name | Costs of a $10,000 Investment | Costs paid as a percentage of a $10,000 Investment |
|---|
Class R6 | $89 | 0.78% |
|---|
| | |
|---|
|
| Expenses Paid, Amount |
$ 89
|
| Expense Ratio, Percent |
0.78%
|
| Factors Affecting Performance [Text Block] |
What affected the Fund’s performance during the last year?Top contributors to performance: The Fund’s strongest relative performance versus the S&P 500® Index was driven by the financials and industrials sectors. Stocks that contributed most positively to the Fund’s relative performance were KLA Corp. and Comfort Systems USA, Inc.
Top detractors from performance: The information technology and materials sectors weighed most heavily on the Fund's relative performance. The Fund's underweight position in Micron Technology, Inc. and lack of exposure to Advanced Micro Devices, Inc. were the largest detractors in terms of relative performance.
|
| Performance Past Does Not Indicate Future [Text] |
The investment return and principal value will fluctuate so that an investor's shares, when redeemed, may be worth more or less than the original cost. Past performance is not a good predictor of the Fund's future performance.
|
| Line Graph [Table Text Block] |
Table Summary | Victory Diversified Stock Fund Class R6 - $40,910 | S&P 500® Index (regulatory broad based index) - $42,271 |
|---|
6/16 | $10,000 | $10,000 |
|---|
6/17 | $11,214 | $11,790 |
|---|
6/18 | $12,831 | $13,484 |
|---|
6/19 | $13,437 | $14,889 |
|---|
6/20 | $13,976 | $16,006 |
|---|
6/21 | $19,747 | $22,536 |
|---|
6/22 | $18,136 | $20,144 |
|---|
6/23 | $22,195 | $24,091 |
|---|
6/24 | $27,506 | $30,006 |
|---|
6/25 | $32,198 | $34,556 |
|---|
6/26 | $40,910 | $42,271 |
|---|
|
| Average Annual Return [Table Text Block] |
Table Summary | 1 Year | 5 Year | 10 Year |
|---|
Class R6 | 27.06%Footnote Reference | 15.68%Footnote Reference | 15.13%Footnote Reference |
|---|
S&P 500® Index | 22.32% | 13.41% | 15.51% |
|---|
|
| No Deduction of Taxes [Text Block] |
The graph and table total returns do not reflect the deduction of taxes that a shareholder would pay on Fund distributions, or redemption of shares.
|
| AssetsNet |
$ 395,838,000
|
| Holdings Count | Holding |
114
|
| Advisory Fees Paid, Amount |
$ 2,407,000
|
| InvestmentCompanyPortfolioTurnover |
80.00%
|
| Additional Fund Statistics [Text Block] |
FUND STATISTICS($ amounts in 000s)(as of June 30, 2026)Table SummaryNet Assets | $395,838 |
|---|
Number of Holdings | 114 |
|---|
Investment Advisory Fees | $2,407 |
|---|
Portfolio Turnover | 80% |
|---|
|
| Holdings [Text Block] |
Top SectorsFootnote Reference* (% of Net Assets)Footnote Reference(as of June 30, 2026)Table SummaryValue | Value |
|---|
Utilities | 2.0% | Energy | 2.8% | Materials | 3.1% | Consumer Staples | 5.7% | Consumer Discretionary | 7.1% | Communication Services | 9.1% | Health Care | 9.2% | Industrials | 10.1% | Financials | 12.2% | Information TechnologyFootnote Reference** | 36.4% | Top 10 HoldingsFootnote Reference* (% of Net Assets)Footnote Reference(as of June 30, 2026)Table SummaryNVIDIA Corp. | 8.5% |
|---|
Apple, Inc. | 7.6% |
|---|
Alphabet, Inc., Class C | 5.9% |
|---|
Microsoft Corp. | 3.5% |
|---|
Broadcom, Inc. | 2.9% |
|---|
Micron Technology, Inc. | 2.5% |
|---|
KLA Corp. | 2.2% |
|---|
Amazon.com, Inc. | 1.8% |
|---|
State Street Real Estate Select Sector SPDR ETF | 1.8% |
|---|
Amphenol Corp., Class A | 1.6% |
|---|
|
| C000111270 |
|
| Shareholder Report [Line Items] |
|
| Fund Name |
Victory Diversified Stock Fund
|
| Class Name |
Class Y
|
| Trading Symbol |
VDSYX
|
| Annual or Semi-Annual Statement [Text Block] |
Annual Shareholder Report
|
| Additional Information [Text Block] |
You can find additional information about the Fund at advisor.vcm.com/literature/mutual-fund-prospectuses. You may also request more information by calling 800-539-3863 or visiting vcm.com/contact-us.
|
| Additional Information Phone Number |
800-539-3863
|
| Additional Information Website |
vcm.com
|
| Expenses [Text Block] |
What were the Fund's costs for the last year?(based on a hypothetical $10,000 investment) Table SummaryClass Name | Costs of a $10,000 Investment | Costs paid as a percentage of a $10,000 Investment |
|---|
Class Y | $98 | 0.86% |
|---|
| | |
|---|
|
| Expenses Paid, Amount |
$ 98
|
| Expense Ratio, Percent |
0.86%
|
| Factors Affecting Performance [Text Block] |
What affected the Fund’s performance during the last year?Top contributors to performance: The Fund’s strongest relative performance versus the S&P 500® Index was driven by the financials and industrials sectors. Stocks that contributed most positively to the Fund’s relative performance were KLA Corp. and Comfort Systems USA, Inc.
Top detractors from performance: The information technology and materials sectors weighed most heavily on the Fund's relative performance. The Fund's underweight position in Micron Technology, Inc. and lack of exposure to Advanced Micro Devices, Inc. were the largest detractors in terms of relative performance.
|
| Performance Past Does Not Indicate Future [Text] |
The investment return and principal value will fluctuate so that an investor's shares, when redeemed, may be worth more or less than the original cost. Past performance is not a good predictor of the Fund's future performance.
|
| Line Graph [Table Text Block] |
Table Summary | Victory Diversified Stock Fund Class Y - $4,057,576 | S&P 500® Index (regulatory broad based index) - $4,227,112 |
|---|
6/16 | $1,000,000 | $1,000,000 |
|---|
6/17 | $1,120,900 | $1,178,960 |
|---|
6/18 | $1,280,447 | $1,348,424 |
|---|
6/19 | $1,339,730 | $1,488,895 |
|---|
6/20 | $1,392,466 | $1,600,639 |
|---|
6/21 | $1,965,982 | $2,253,606 |
|---|
6/22 | $1,804,824 | $2,014,367 |
|---|
6/23 | $2,206,520 | $2,409,064 |
|---|
6/24 | $2,732,329 | $3,000,635 |
|---|
6/25 | $3,195,693 | $3,455,641 |
|---|
6/26 | $4,057,576 | $4,227,112 |
|---|
|
| Average Annual Return [Table Text Block] |
Table Summary | 1 Year | 5 Year | 10 Year |
|---|
Class Y | 26.97%Footnote Reference | 15.59%Footnote Reference | 15.03%Footnote Reference |
|---|
S&P 500® Index | 22.32% | 13.41% | 15.51% |
|---|
|
| No Deduction of Taxes [Text Block] |
The graph and table total returns do not reflect the deduction of taxes that a shareholder would pay on Fund distributions, or redemption of shares.
|
| AssetsNet |
$ 395,838,000
|
| Holdings Count | Holding |
114
|
| Advisory Fees Paid, Amount |
$ 2,407,000
|
| InvestmentCompanyPortfolioTurnover |
80.00%
|
| Additional Fund Statistics [Text Block] |
FUND STATISTICS($ amounts in 000s)(as of June 30, 2026)Table SummaryNet Assets | $395,838 |
|---|
Number of Holdings | 114 |
|---|
Investment Advisory Fees | $2,407 |
|---|
Portfolio Turnover | 80% |
|---|
|
| Holdings [Text Block] |
Top SectorsFootnote Reference* (% of Net Assets)Footnote Reference(as of June 30, 2026)Table SummaryValue | Value |
|---|
Utilities | 2.0% | Energy | 2.8% | Materials | 3.1% | Consumer Staples | 5.7% | Consumer Discretionary | 7.1% | Communication Services | 9.1% | Health Care | 9.2% | Industrials | 10.1% | Financials | 12.2% | Information TechnologyFootnote Reference** | 36.4% | Top 10 HoldingsFootnote Reference* (% of Net Assets)Footnote Reference(as of June 30, 2026)Table SummaryNVIDIA Corp. | 8.5% |
|---|
Apple, Inc. | 7.6% |
|---|
Alphabet, Inc., Class C | 5.9% |
|---|
Microsoft Corp. | 3.5% |
|---|
Broadcom, Inc. | 2.9% |
|---|
Micron Technology, Inc. | 2.5% |
|---|
KLA Corp. | 2.2% |
|---|
Amazon.com, Inc. | 1.8% |
|---|
State Street Real Estate Select Sector SPDR ETF | 1.8% |
|---|
Amphenol Corp., Class A | 1.6% |
|---|
|
| C000002344 |
|
| Shareholder Report [Line Items] |
|
| Fund Name |
Victory Fund for Income
|
| Class Name |
Class A
|
| Trading Symbol |
IPFIX
|
| Annual or Semi-Annual Statement [Text Block] |
Annual Shareholder Report
|
| Additional Information [Text Block] |
You can find additional information about the Fund at advisor.vcm.com/literature/mutual-fund-prospectuses. You may also request more information by calling 800-539-3863 or visiting vcm.com/contact-us.
|
| Additional Information Phone Number |
800-539-3863
|
| Additional Information Website |
vcm.com
|
| Expenses [Text Block] |
What were the Fund's costs for the last year?(based on a hypothetical $10,000 investment) Table SummaryClass Name | Costs of a $10,000 Investment | Costs paid as a percentage of a $10,000 Investment |
|---|
Class A | $92 | 0.91% |
|---|
| | |
|---|
|
| Expenses Paid, Amount |
$ 92
|
| Expense Ratio, Percent |
0.91%
|
| Factors Affecting Performance [Text Block] |
What affected the Fund’s performance during the last year?Top contributors to performance: The mortgage market had a larger excess return relative to duration-neutral U.S. Treasury bonds than any of the other five fixed-income sectors in the Bloomberg U.S. Aggregate Bond Index. Ginnie Mae (“GNMA”) had the greatest excess return relative to duration-neutral U.S. Treasury bonds compared to the other mortgage bond types (i.e., Fannie Mae and Freddie Mac). Within the Fund’s portfolio, the largest allocation to older, higher-coupon GNMA drove fund performance, while the Fund’s approximately 23% allocation to U.S. Treasury bonds provided strong support and ample liquidity. The Fund’s modest 2% allocation to structured products (collateralized mortgage obligations) had the highest excess return versus duration-neutral U.S. Treasury bonds.
Top detractors from performance: Given the Fund’s primary holding of older GNMA, the behavior of the short end of the yield curve is meaningful to the Fund’s performance. At the beginning of the period the U.S. Treasury two-year yield was about 3.72%, falling roughly 35 basis points to 3.37% on February 27, 2026, for the low, yet rose to 4.17% by June 30, 2026. As bond prices move inversely to yields, this rise in rates weighed on relative performance.
|
| Performance Past Does Not Indicate Future [Text] |
The investment return and principal value will fluctuate so that an investor's shares, when redeemed, may be worth more or less than the original cost. Past performance is not a good predictor of the Fund's future performance.
|
| Line Graph [Table Text Block] |
Table Summary | Victory Fund for Income Class A @ NAV - $11,283 | Victory Fund for Income Class A @ MOP - $11,026 | Bloomberg U.S. Aggregate Bond Index (regulatory broad based index) - $11,656 | Bloomberg 1-5 Year U.S. Government Bond Index - $11,744 |
|---|
6/16 | $10,000 | $9,772 | $10,000 | $10,000 |
|---|
6/17 | $9,877 | $9,652 | $9,969 | $9,948 |
|---|
6/18 | $9,815 | $9,591 | $9,929 | $9,911 |
|---|
6/19 | $10,269 | $10,035 | $10,710 | $10,401 |
|---|
6/20 | $10,655 | $10,413 | $11,646 | $10,956 |
|---|
6/21 | $10,554 | $10,313 | $11,607 | $10,921 |
|---|
6/22 | $10,024 | $9,796 | $10,413 | $10,389 |
|---|
6/23 | $9,979 | $9,752 | $10,315 | $10,350 |
|---|
6/24 | $10,403 | $10,166 | $10,587 | $10,778 |
|---|
6/25 | $10,977 | $10,727 | $11,230 | $11,436 |
|---|
6/26 | $11,283 | $11,026 | $11,656 | $11,744 |
|---|
|
| Average Annual Return [Table Text Block] |
Table Summary | 1 Year | 5 Year | 10 Year |
|---|
Class A @ NAV | 2.79% | 1.35% | 1.21% |
|---|
Class A @ MOP | 0.44% | 0.88% | 0.98% |
|---|
Bloomberg U.S. Aggregate Bond Index | 3.79% | 0.08% | 1.54% |
|---|
Bloomberg 1-5 Year U.S. Government Bond Index | 2.69% | 1.46% | 1.62% |
|---|
|
| No Deduction of Taxes [Text Block] |
The graph and table total returns do not reflect the deduction of taxes that a shareholder would pay on Fund distributions, or redemption of shares.
|
| Previous Investment Adviser [Text Block] |
The maximum offering price (“MOP”) figures reflect a maximum sales charge of 2.25% for Class A. The Net Asset Value ("NAV") figures do not reflect sales charges.
|
| AssetsNet |
$ 337,739,000
|
| Holdings Count | Holding |
490
|
| Advisory Fees Paid, Amount |
$ 1,677,000
|
| InvestmentCompanyPortfolioTurnover |
29.00%
|
| Additional Fund Statistics [Text Block] |
FUND STATISTICS($ amounts in 000s)(as of June 30, 2026)Table SummaryNet Assets | $337,739 |
|---|
Number of Holdings | 490 |
|---|
Investment Advisory Fees | $1,677 |
|---|
Portfolio Turnover | 29% |
|---|
|
| Holdings [Text Block] |
Asset AllocationFootnote Reference* ^ (% of Net Assets)(as of June 30, 2026)Table SummaryValue | Value |
|---|
U.S. Government Agency Mortgages | 69.1% | U.S. Treasury Obligations | 20.0% | Collateralized Mortgage Obligations | 1.5% | |
| C000002345 |
|
| Shareholder Report [Line Items] |
|
| Fund Name |
Victory Fund for Income
|
| Class Name |
Class C
|
| Trading Symbol |
VFFCX
|
| Annual or Semi-Annual Statement [Text Block] |
Annual Shareholder Report
|
| Additional Information [Text Block] |
You can find additional information about the Fund at advisor.vcm.com/literature/mutual-fund-prospectuses. You may also request more information by calling 800-539-3863 or visiting vcm.com/contact-us.
|
| Additional Information Phone Number |
800-539-3863
|
| Additional Information Website |
vcm.com
|
| Expenses [Text Block] |
What were the Fund's costs for the last year?(based on a hypothetical $10,000 investment) Table SummaryClass Name | Costs of a $10,000 Investment | Costs paid as a percentage of a $10,000 Investment |
|---|
Class C | $173 | 1.71% |
|---|
| | |
|---|
|
| Expenses Paid, Amount |
$ 173
|
| Expense Ratio, Percent |
1.71%
|
| Factors Affecting Performance [Text Block] |
What affected the Fund’s performance during the last year?Top contributors to performance: The mortgage market had a larger excess return relative to duration-neutral U.S. Treasury bonds than any of the other five fixed-income sectors in the Bloomberg U.S. Aggregate Bond Index. Ginnie Mae (“GNMA”) had the greatest excess return relative to duration-neutral U.S. Treasury bonds compared to the other mortgage bond types (i.e., Fannie Mae and Freddie Mac). Within the Fund’s portfolio, the largest allocation to older, higher-coupon GNMA drove fund performance, while the Fund’s approximately 23% allocation to U.S. Treasury bonds provided strong support and ample liquidity. The Fund’s modest 2% allocation to structured products (collateralized mortgage obligations) had the highest excess return versus duration-neutral U.S. Treasury bonds.
Top detractors from performance: Given the Fund’s primary holding of older GNMA, the behavior of the short end of the yield curve is meaningful to the Fund’s performance. At the beginning of the period the U.S. Treasury two-year yield was about 3.72%, falling roughly 35 basis points to 3.37% on February 27, 2026, for the low, yet rose to 4.17% by June 30, 2026. As bond prices move inversely to yields, this rise in rates weighed on relative performance.
|
| Performance Past Does Not Indicate Future [Text] |
The investment return and principal value will fluctuate so that an investor's shares, when redeemed, may be worth more or less than the original cost. Past performance is not a good predictor of the Fund's future performance.
|
| Line Graph [Table Text Block] |
Table Summary | Victory Fund for Income Class C @ NAV - $10,600 | Victory Fund for Income Class C @ CDSC - $10,600 | Bloomberg U.S. Aggregate Bond Index (regulatory broad based index) - $11,656 | Bloomberg 1-5 Year U.S. Government Bond Index - $11,744 |
|---|
6/16 | $10,000 | $10,000 | $10,000 | $10,000 |
|---|
6/17 | $9,809 | $9,809 | $9,969 | $9,948 |
|---|
6/18 | $9,661 | $9,661 | $9,929 | $9,911 |
|---|
6/19 | $10,032 | $10,032 | $10,710 | $10,401 |
|---|
6/20 | $10,321 | $10,321 | $11,646 | $10,956 |
|---|
6/21 | $10,140 | $10,140 | $11,607 | $10,921 |
|---|
6/22 | $9,550 | $9,550 | $10,413 | $10,389 |
|---|
6/23 | $9,444 | $9,444 | $10,315 | $10,350 |
|---|
6/24 | $9,773 | $9,773 | $10,587 | $10,778 |
|---|
6/25 | $10,312 | $10,312 | $11,230 | $11,436 |
|---|
6/26 | $10,600 | $10,600 | $11,656 | $11,744 |
|---|
|
| Average Annual Return [Table Text Block] |
Table Summary | 1 Year | 5 Year | 10 Year |
|---|
Class C @ NAV | 1.90% | 0.55% | 0.58% |
|---|
Class C @ CDSC | 0.92% | 0.55% | 0.58% |
|---|
Bloomberg U.S. Aggregate Bond Index | 3.79% | 0.08% | 1.54% |
|---|
Bloomberg 1-5 Year U.S. Government Bond Index | 2.69% | 1.46% | 1.62% |
|---|
|
| No Deduction of Taxes [Text Block] |
The graph and table total returns do not reflect the deduction of taxes that a shareholder would pay on Fund distributions, or redemption of shares.
|
| Previous Investment Adviser [Text Block] |
Class C is not subject to an initial sales charge, but is subject to Contingent Deferred Sales Charge (“CDSC”) of 1.00% on shares redeemed within one year of purchase. The Net Asset Value ("NAV") figures do not reflect sales charges.
|
| AssetsNet |
$ 337,739,000
|
| Holdings Count | Holding |
490
|
| Advisory Fees Paid, Amount |
$ 1,677,000
|
| InvestmentCompanyPortfolioTurnover |
29.00%
|
| Additional Fund Statistics [Text Block] |
FUND STATISTICS($ amounts in 000s)(as of June 30, 2026)Table SummaryNet Assets | $337,739 |
|---|
Number of Holdings | 490 |
|---|
Investment Advisory Fees | $1,677 |
|---|
Portfolio Turnover | 29% |
|---|
|
| Holdings [Text Block] |
Asset AllocationFootnote Reference* ^ (% of Net Assets)(as of June 30, 2026)Table SummaryValue | Value |
|---|
U.S. Government Agency Mortgages | 69.1% | U.S. Treasury Obligations | 20.0% | Collateralized Mortgage Obligations | 1.5% | |
| C000098399 |
|
| Shareholder Report [Line Items] |
|
| Fund Name |
Victory Fund for Income
|
| Class Name |
Class I
|
| Trading Symbol |
VFFIX
|
| Annual or Semi-Annual Statement [Text Block] |
Annual Shareholder Report
|
| Additional Information [Text Block] |
You can find additional information about the Fund at advisor.vcm.com/literature/mutual-fund-prospectuses. You may also request more information by calling 800-539-3863 or visiting vcm.com/contact-us.
|
| Additional Information Phone Number |
800-539-3863
|
| Additional Information Website |
vcm.com
|
| Expenses [Text Block] |
What were the Fund's costs for the last year?(based on a hypothetical $10,000 investment) Table SummaryClass Name | Costs of a $10,000 Investment | Costs paid as a percentage of a $10,000 Investment |
|---|
Class I | $65 | 0.64% |
|---|
| | |
|---|
|
| Expenses Paid, Amount |
$ 65
|
| Expense Ratio, Percent |
0.64%
|
| Factors Affecting Performance [Text Block] |
What affected the Fund’s performance during the last year?Top contributors to performance: The mortgage market had a larger excess return relative to duration-neutral U.S. Treasury bonds than any of the other five fixed-income sectors in the Bloomberg U.S. Aggregate Bond Index. Ginnie Mae (“GNMA”) had the greatest excess return relative to duration-neutral U.S. Treasury bonds compared to the other mortgage bond types (i.e., Fannie Mae and Freddie Mac). Within the Fund’s portfolio, the largest allocation to older, higher-coupon GNMA drove fund performance, while the Fund’s approximately 23% allocation to U.S. Treasury bonds provided strong support and ample liquidity. The Fund’s modest 2% allocation to structured products (collateralized mortgage obligations) had the highest excess return versus duration-neutral U.S. Treasury bonds.
Top detractors from performance: Given the Fund’s primary holding of older GNMA, the behavior of the short end of the yield curve is meaningful to the Fund’s performance. At the beginning of the period the U.S. Treasury two-year yield was about 3.72%, falling roughly 35 basis points to 3.37% on February 27, 2026, for the low, yet rose to 4.17% by June 30, 2026. As bond prices move inversely to yields, this rise in rates weighed on relative performance.
|
| Performance Past Does Not Indicate Future [Text] |
The investment return and principal value will fluctuate so that an investor's shares, when redeemed, may be worth more or less than the original cost. Past performance is not a good predictor of the Fund's future performance.
|
| Line Graph [Table Text Block] |
Table Summary | Victory Fund for Income Class I - $2,319,869 | Bloomberg U.S. Aggregate Bond Index (regulatory broad based index) - $2,331,106 | Bloomberg 1-5 Year U.S. Government Bond Index - $2,348,759 |
|---|
6/16 | $2,000,000 | $2,000,000 | $2,000,000 |
|---|
6/17 | $1,983,073 | $1,993,707 | $1,989,658 |
|---|
6/18 | $1,973,800 | $1,985,787 | $1,982,143 |
|---|
6/19 | $2,070,887 | $2,142,053 | $2,080,129 |
|---|
6/20 | $2,154,495 | $2,329,261 | $2,191,165 |
|---|
6/21 | $2,141,925 | $2,321,499 | $2,184,107 |
|---|
6/22 | $2,036,951 | $2,082,567 | $2,077,762 |
|---|
6/23 | $2,036,010 | $2,063,037 | $2,069,906 |
|---|
6/24 | $2,128,044 | $2,117,316 | $2,155,627 |
|---|
6/25 | $2,251,220 | $2,245,965 | $2,287,257 |
|---|
6/26 | $2,319,869 | $2,331,106 | $2,348,759 |
|---|
|
| Average Annual Return [Table Text Block] |
Table Summary | 1 Year | 5 Year | 10 Year |
|---|
Class I | 3.05% | 1.61% | 1.49% |
|---|
Bloomberg U.S. Aggregate Bond Index | 3.79% | 0.08% | 1.54% |
|---|
Bloomberg 1-5 Year U.S. Government Bond Index | 2.69% | 1.46% | 1.62% |
|---|
|
| No Deduction of Taxes [Text Block] |
The graph and table total returns do not reflect the deduction of taxes that a shareholder would pay on Fund distributions, or redemption of shares.
|
| AssetsNet |
$ 337,739,000
|
| Holdings Count | Holding |
490
|
| Advisory Fees Paid, Amount |
$ 1,677,000
|
| InvestmentCompanyPortfolioTurnover |
29.00%
|
| Additional Fund Statistics [Text Block] |
FUND STATISTICS($ amounts in 000s)(as of June 30, 2026)Table SummaryNet Assets | $337,739 |
|---|
Number of Holdings | 490 |
|---|
Investment Advisory Fees | $1,677 |
|---|
Portfolio Turnover | 29% |
|---|
|
| Holdings [Text Block] |
Asset AllocationFootnote Reference* ^ (% of Net Assets)(as of June 30, 2026)Table SummaryValue | Value |
|---|
U.S. Government Agency Mortgages | 69.1% | U.S. Treasury Obligations | 20.0% | Collateralized Mortgage Obligations | 1.5% | |
| C000002346 |
|
| Shareholder Report [Line Items] |
|
| Fund Name |
Victory Fund for Income
|
| Class Name |
Class R
|
| Trading Symbol |
GGIFX
|
| Annual or Semi-Annual Statement [Text Block] |
Annual Shareholder Report
|
| Additional Information [Text Block] |
You can find additional information about the Fund at advisor.vcm.com/literature/mutual-fund-prospectuses. You may also request more information by calling 800-539-3863 or visiting vcm.com/contact-us.
|
| Additional Information Phone Number |
800-539-3863
|
| Additional Information Website |
vcm.com
|
| Expenses [Text Block] |
What were the Fund's costs for the last year?(based on a hypothetical $10,000 investment) Table SummaryClass Name | Costs of a $10,000 Investment | Costs paid as a percentage of a $10,000 Investment |
|---|
Class R | $92 | 0.91% |
|---|
| | |
|---|
|
| Expenses Paid, Amount |
$ 92
|
| Expense Ratio, Percent |
0.91%
|
| Factors Affecting Performance [Text Block] |
What affected the Fund’s performance during the last year?Top contributors to performance: The mortgage market had a larger excess return relative to duration-neutral U.S. Treasury bonds than any of the other five fixed-income sectors in the Bloomberg U.S. Aggregate Bond Index. Ginnie Mae (“GNMA”) had the greatest excess return relative to duration-neutral U.S. Treasury bonds compared to the other mortgage bond types (i.e., Fannie Mae and Freddie Mac). Within the Fund’s portfolio, the largest allocation to older, higher-coupon GNMA drove fund performance, while the Fund’s approximately 23% allocation to U.S. Treasury bonds provided strong support and ample liquidity. The Fund’s modest 2% allocation to structured products (collateralized mortgage obligations) had the highest excess return versus duration-neutral U.S. Treasury bonds.
Top detractors from performance: Given the Fund’s primary holding of older GNMA, the behavior of the short end of the yield curve is meaningful to the Fund’s performance. At the beginning of the period the U.S. Treasury two-year yield was about 3.72%, falling roughly 35 basis points to 3.37% on February 27, 2026, for the low, yet rose to 4.17% by June 30, 2026. As bond prices move inversely to yields, this rise in rates weighed on relative performance.
|
| Performance Past Does Not Indicate Future [Text] |
The investment return and principal value will fluctuate so that an investor's shares, when redeemed, may be worth more or less than the original cost. Past performance is not a good predictor of the Fund's future performance.
|
| Line Graph [Table Text Block] |
Table Summary | Victory Fund for Income Class R - $11,294 | Bloomberg U.S. Aggregate Bond Index (regulatory broad based index) - $11,656 | Bloomberg 1-5 Year U.S. Government Bond Index - $11,744 |
|---|
6/16 | $10,000 | $10,000 | $10,000 |
|---|
6/17 | $9,887 | $9,969 | $9,948 |
|---|
6/18 | $9,827 | $9,929 | $9,911 |
|---|
6/19 | $10,281 | $10,710 | $10,401 |
|---|
6/20 | $10,655 | $11,646 | $10,956 |
|---|
6/21 | $10,566 | $11,607 | $10,921 |
|---|
6/22 | $10,035 | $10,413 | $10,389 |
|---|
6/23 | $9,991 | $10,315 | $10,350 |
|---|
6/24 | $10,414 | $10,587 | $10,778 |
|---|
6/25 | $10,988 | $11,230 | $11,436 |
|---|
6/26 | $11,294 | $11,656 | $11,744 |
|---|
|
| Average Annual Return [Table Text Block] |
Table Summary | 1 Year | 5 Year | 10 Year |
|---|
Class R | 2.78% | 1.34% | 1.22% |
|---|
Bloomberg U.S. Aggregate Bond Index | 3.79% | 0.08% | 1.54% |
|---|
Bloomberg 1-5 Year U.S. Government Bond Index | 2.69% | 1.46% | 1.62% |
|---|
|
| No Deduction of Taxes [Text Block] |
The graph and table total returns do not reflect the deduction of taxes that a shareholder would pay on Fund distributions, or redemption of shares.
|
| AssetsNet |
$ 337,739,000
|
| Holdings Count | Holding |
490
|
| Advisory Fees Paid, Amount |
$ 1,677,000
|
| InvestmentCompanyPortfolioTurnover |
29.00%
|
| Additional Fund Statistics [Text Block] |
FUND STATISTICS($ amounts in 000s)(as of June 30, 2026)Table SummaryNet Assets | $337,739 |
|---|
Number of Holdings | 490 |
|---|
Investment Advisory Fees | $1,677 |
|---|
Portfolio Turnover | 29% |
|---|
|
| Holdings [Text Block] |
Asset AllocationFootnote Reference* ^ (% of Net Assets)(as of June 30, 2026)Table SummaryValue | Value |
|---|
U.S. Government Agency Mortgages | 69.1% | U.S. Treasury Obligations | 20.0% | Collateralized Mortgage Obligations | 1.5% | |
| C000155524 |
|
| Shareholder Report [Line Items] |
|
| Fund Name |
Victory Fund for Income
|
| Class Name |
Class R6
|
| Trading Symbol |
VFFRX
|
| Annual or Semi-Annual Statement [Text Block] |
Annual Shareholder Report
|
| Additional Information [Text Block] |
You can find additional information about the Fund at advisor.vcm.com/literature/mutual-fund-prospectuses. You may also request more information by calling 800-539-3863 or visiting vcm.com/contact-us.
|
| Additional Information Phone Number |
800-539-3863
|
| Additional Information Website |
vcm.com
|
| Expenses [Text Block] |
What were the Fund's costs for the last year?(based on a hypothetical $10,000 investment) Table SummaryClass Name | Costs of a $10,000 Investment | Costs paid as a percentage of a $10,000 Investment |
|---|
Class R6 | $64 | 0.63% |
|---|
| | |
|---|
|
| Expenses Paid, Amount |
$ 64
|
| Expense Ratio, Percent |
0.63%
|
| Factors Affecting Performance [Text Block] |
What affected the Fund’s performance during the last year?Top contributors to performance: The mortgage market had a larger excess return relative to duration-neutral U.S. Treasury bonds than any of the other five fixed-income sectors in the Bloomberg U.S. Aggregate Bond Index. Ginnie Mae (“GNMA”) had the greatest excess return relative to duration-neutral U.S. Treasury bonds compared to the other mortgage bond types (i.e., Fannie Mae and Freddie Mac). Within the Fund’s portfolio, the largest allocation to older, higher-coupon GNMA drove fund performance, while the Fund’s approximately 23% allocation to U.S. Treasury bonds provided strong support and ample liquidity. The Fund’s modest 2% allocation to structured products (collateralized mortgage obligations) had the highest excess return versus duration-neutral U.S. Treasury bonds.
Top detractors from performance: Given the Fund’s primary holding of older GNMA, the behavior of the short end of the yield curve is meaningful to the Fund’s performance. At the beginning of the period the U.S. Treasury two-year yield was about 3.72%, falling roughly 35 basis points to 3.37% on February 27, 2026, for the low, yet rose to 4.17% by June 30, 2026. As bond prices move inversely to yields, this rise in rates weighed on relative performance.
|
| Performance Past Does Not Indicate Future [Text] |
The investment return and principal value will fluctuate so that an investor's shares, when redeemed, may be worth more or less than the original cost. Past performance is not a good predictor of the Fund's future performance.
|
| Line Graph [Table Text Block] |
Table Summary | Victory Fund for Income Class R6 - $11,611 | Bloomberg U.S. Aggregate Bond Index (regulatory broad based index) - $11,656 | Bloomberg 1-5 Year U.S. Government Bond Index - $11,744 |
|---|
6/16 | $10,000 | $10,000 | $10,000 |
|---|
6/17 | $9,914 | $9,969 | $9,948 |
|---|
6/18 | $9,879 | $9,929 | $9,911 |
|---|
6/19 | $10,366 | $10,710 | $10,401 |
|---|
6/20 | $10,775 | $11,646 | $10,956 |
|---|
6/21 | $10,714 | $11,607 | $10,921 |
|---|
6/22 | $10,189 | $10,413 | $10,389 |
|---|
6/23 | $10,171 | $10,315 | $10,350 |
|---|
6/24 | $10,663 | $10,587 | $10,778 |
|---|
6/25 | $11,265 | $11,230 | $11,436 |
|---|
6/26 | $11,611 | $11,656 | $11,744 |
|---|
|
| Average Annual Return [Table Text Block] |
Table Summary | 1 Year | 5 Year | 10 Year |
|---|
Class R6 | 3.06% | 1.62% | 1.50% |
|---|
Bloomberg U.S. Aggregate Bond Index | 3.79% | 0.08% | 1.54% |
|---|
Bloomberg 1-5 Year U.S. Government Bond Index | 2.69% | 1.46% | 1.62% |
|---|
|
| No Deduction of Taxes [Text Block] |
The graph and table total returns do not reflect the deduction of taxes that a shareholder would pay on Fund distributions, or redemption of shares.
|
| AssetsNet |
$ 337,739,000
|
| Holdings Count | Holding |
490
|
| Advisory Fees Paid, Amount |
$ 1,677,000
|
| InvestmentCompanyPortfolioTurnover |
29.00%
|
| Additional Fund Statistics [Text Block] |
FUND STATISTICS($ amounts in 000s)(as of June 30, 2026)Table SummaryNet Assets | $337,739 |
|---|
Number of Holdings | 490 |
|---|
Investment Advisory Fees | $1,677 |
|---|
Portfolio Turnover | 29% |
|---|
|
| Holdings [Text Block] |
Asset AllocationFootnote Reference* ^ (% of Net Assets)(as of June 30, 2026)Table SummaryValue | Value |
|---|
U.S. Government Agency Mortgages | 69.1% | U.S. Treasury Obligations | 20.0% | Collateralized Mortgage Obligations | 1.5% | |
| C000111273 |
|
| Shareholder Report [Line Items] |
|
| Fund Name |
Victory Fund for Income
|
| Class Name |
Class Y
|
| Trading Symbol |
VFFYX
|
| Annual or Semi-Annual Statement [Text Block] |
Annual Shareholder Report
|
| Additional Information [Text Block] |
You can find additional information about the Fund at advisor.vcm.com/literature/mutual-fund-prospectuses. You may also request more information by calling 800-539-3863 or visiting vcm.com/contact-us.
|
| Additional Information Phone Number |
800-539-3863
|
| Additional Information Website |
vcm.com
|
| Expenses [Text Block] |
What were the Fund's costs for the last year?(based on a hypothetical $10,000 investment) Table SummaryClass Name | Costs of a $10,000 Investment | Costs paid as a percentage of a $10,000 Investment |
|---|
Class Y | $72 | 0.71% |
|---|
| | |
|---|
|
| Expenses Paid, Amount |
$ 72
|
| Expense Ratio, Percent |
0.71%
|
| Factors Affecting Performance [Text Block] |
What affected the Fund’s performance during the last year?Top contributors to performance: The mortgage market had a larger excess return relative to duration-neutral U.S. Treasury bonds than any of the other five fixed-income sectors in the Bloomberg U.S. Aggregate Bond Index. Ginnie Mae (“GNMA”) had the greatest excess return relative to duration-neutral U.S. Treasury bonds compared to the other mortgage bond types (i.e., Fannie Mae and Freddie Mac). Within the Fund’s portfolio, the largest allocation to older, higher-coupon GNMA drove fund performance, while the Fund’s approximately 23% allocation to U.S. Treasury bonds provided strong support and ample liquidity. The Fund’s modest 2% allocation to structured products (collateralized mortgage obligations) had the highest excess return versus duration-neutral U.S. Treasury bonds.
Top detractors from performance: Given the Fund’s primary holding of older GNMA, the behavior of the short end of the yield curve is meaningful to the Fund’s performance. At the beginning of the period the U.S. Treasury two-year yield was about 3.72%, falling roughly 35 basis points to 3.37% on February 27, 2026, for the low, yet rose to 4.17% by June 30, 2026. As bond prices move inversely to yields, this rise in rates weighed on relative performance.
|
| Performance Past Does Not Indicate Future [Text] |
The investment return and principal value will fluctuate so that an investor's shares, when redeemed, may be worth more or less than the original cost. Past performance is not a good predictor of the Fund's future performance.
|
| Line Graph [Table Text Block] |
Table Summary | Victory Fund for Income Class Y - $1,151,199 | Bloomberg U.S. Aggregate Bond Index (regulatory broad based index) - $1,165,553 | Bloomberg 1-5 Year U.S. Government Bond Index - $1,174,380 |
|---|
6/16 | $1,000,000 | $1,000,000 | $1,000,000 |
|---|
6/17 | $989,577 | $996,854 | $994,829 |
|---|
6/18 | $985,373 | $992,893 | $991,071 |
|---|
6/19 | $1,033,097 | $1,071,027 | $1,040,065 |
|---|
6/20 | $1,074,124 | $1,164,631 | $1,095,582 |
|---|
6/21 | $1,065,975 | $1,160,749 | $1,092,054 |
|---|
6/22 | $1,013,462 | $1,041,283 | $1,038,881 |
|---|
6/23 | $1,010,827 | $1,031,519 | $1,034,953 |
|---|
6/24 | $1,057,355 | $1,058,658 | $1,077,814 |
|---|
6/25 | $1,117,842 | $1,122,982 | $1,143,629 |
|---|
6/26 | $1,151,199 | $1,165,553 | $1,174,380 |
|---|
|
| Average Annual Return [Table Text Block] |
Table Summary | 1 Year | 5 Year | 10 Year |
|---|
Class Y | 2.98% | 1.55% | 1.42% |
|---|
Bloomberg U.S. Aggregate Bond Index | 3.79% | 0.08% | 1.54% |
|---|
Bloomberg 1-5 Year U.S. Government Bond Index | 2.69% | 1.46% | 1.62% |
|---|
|
| No Deduction of Taxes [Text Block] |
The graph and table total returns do not reflect the deduction of taxes that a shareholder would pay on Fund distributions, or redemption of shares.
|
| AssetsNet |
$ 337,739,000
|
| Holdings Count | Holding |
490
|
| Advisory Fees Paid, Amount |
$ 1,677,000
|
| InvestmentCompanyPortfolioTurnover |
29.00%
|
| Additional Fund Statistics [Text Block] |
FUND STATISTICS($ amounts in 000s)(as of June 30, 2026)Table SummaryNet Assets | $337,739 |
|---|
Number of Holdings | 490 |
|---|
Investment Advisory Fees | $1,677 |
|---|
Portfolio Turnover | 29% |
|---|
|
| Holdings [Text Block] |
Asset AllocationFootnote Reference* ^ (% of Net Assets)(as of June 30, 2026)Table SummaryValue | Value |
|---|
U.S. Government Agency Mortgages | 69.1% | U.S. Treasury Obligations | 20.0% | Collateralized Mortgage Obligations | 1.5% | |
| C000219862 |
|
| Shareholder Report [Line Items] |
|
| Fund Name |
Victory Fund for Income
|
| Class Name |
Member Class
|
| Trading Symbol |
VFFMX
|
| Annual or Semi-Annual Statement [Text Block] |
Annual Shareholder Report
|
| Additional Information [Text Block] |
You can find additional information about the Fund at advisor.vcm.com/literature/mutual-fund-prospectuses. You may also request more information by calling 800-235-8396 or visiting vcm.com/contact-us.
|
| Additional Information Phone Number |
800-235-8396
|
| Additional Information Website |
vcm.com
|
| Expenses [Text Block] |
What were the Fund's costs for the last year?(based on a hypothetical $10,000 investment) Table SummaryClass Name | Costs of a $10,000 Investment | Costs paid as a percentage of a $10,000 Investment |
|---|
Member Class | $76 | 0.75% |
|---|
| | |
|---|
|
| Expenses Paid, Amount |
$ 76
|
| Expense Ratio, Percent |
0.75%
|
| Factors Affecting Performance [Text Block] |
What affected the Fund’s performance during the last year?Top contributors to performance: The mortgage market had a larger excess return relative to duration-neutral U.S. Treasury bonds than any of the other five fixed-income sectors in the Bloomberg U.S. Aggregate Bond Index. Ginnie Mae (“GNMA”) had the greatest excess return relative to duration-neutral U.S. Treasury bonds compared to the other mortgage bond types (i.e., Fannie Mae and Freddie Mac). Within the Fund’s portfolio, the largest allocation to older, higher-coupon GNMA drove fund performance, while the Fund’s approximately 23% allocation to U.S. Treasury bonds provided strong support and ample liquidity. The Fund’s modest 2% allocation to structured products (collateralized mortgage obligations) had the highest excess return versus duration-neutral U.S. Treasury bonds.
Top detractors from performance: Given the Fund’s primary holding of older GNMA, the behavior of the short end of the yield curve is meaningful to the Fund’s performance. At the beginning of the period the U.S. Treasury two-year yield was about 3.72%, falling roughly 35 basis points to 3.37% on February 27, 2026, for the low, yet rose to 4.17% by June 30, 2026. As bond prices move inversely to yields, this rise in rates weighed on relative performance.
|
| Performance Past Does Not Indicate Future [Text] |
The investment return and principal value will fluctuate so that an investor's shares, when redeemed, may be worth more or less than the original cost. Past performance is not a good predictor of the Fund's future performance.
|
| Line Graph [Table Text Block] |
Table Summary | Victory Fund for Income Member Class - $10,711 | Bloomberg U.S. Aggregate Bond Index (regulatory broad based index) - $9,983 | Bloomberg 1-5 Year U.S. Government Bond Index - $10,718 |
|---|
11/20Footnote Reference* | $10,000 | $10,000 | $10,000 |
|---|
6/21 | $9,942 | $9,942 | $9,967 |
|---|
6/22 | $9,447 | $8,919 | $9,481 |
|---|
6/23 | $9,420 | $8,835 | $9,446 |
|---|
6/24 | $9,848 | $9,068 | $9,837 |
|---|
6/25 | $10,406 | $9,619 | $10,437 |
|---|
6/26 | $10,711 | $9,983 | $10,718 |
|---|
|
| Average Annual Return [Table Text Block] |
Table Summary | 1 Year | 5 Year | Since Inception |
|---|
Member Class | 2.94% | 1.50% | 1.22% |
|---|
Bloomberg U.S. Aggregate Bond Index | 3.79% | 0.08% | -0.03% |
|---|
Bloomberg 1-5 Year U.S. Government Bond Index | 2.69% | 1.46% | 1.23% |
|---|
|
| No Deduction of Taxes [Text Block] |
The graph and table total returns do not reflect the deduction of taxes that a shareholder would pay on Fund distributions, or redemption of shares.
|
| AssetsNet |
$ 337,739,000
|
| Holdings Count | Holding |
490
|
| Advisory Fees Paid, Amount |
$ 1,677,000
|
| InvestmentCompanyPortfolioTurnover |
29.00%
|
| Additional Fund Statistics [Text Block] |
FUND STATISTICS($ amounts in 000s)(as of June 30, 2026)Table SummaryNet Assets | $337,739 |
|---|
Number of Holdings | 490 |
|---|
Investment Advisory Fees | $1,677 |
|---|
Portfolio Turnover | 29% |
|---|
|
| Holdings [Text Block] |
Asset AllocationFootnote Reference* ^ (% of Net Assets)(as of June 30, 2026)Table SummaryValue | Value |
|---|
U.S. Government Agency Mortgages | 69.1% | U.S. Treasury Obligations | 20.0% | Collateralized Mortgage Obligations | 1.5% | |
| C000002332 |
|
| Shareholder Report [Line Items] |
|
| Fund Name |
Victory Investment Grade Convertible Fund
|
| Class Name |
Class A
|
| Trading Symbol |
SBFCX
|
| Annual or Semi-Annual Statement [Text Block] |
Annual Shareholder Report
|
| Additional Information [Text Block] |
You can find additional information about the Fund at advisor.vcm.com/literature/mutual-fund-prospectuses. You may also request more information by calling 800-539-3863 or visiting vcm.com/contact-us.
|
| Additional Information Phone Number |
800-539-3863
|
| Additional Information Website |
vcm.com
|
| Expenses [Text Block] |
What were the Fund's costs for the last year?(based on a hypothetical $10,000 investment) Table SummaryClass Name | Costs of a $10,000 Investment | Costs paid as a percentage of a $10,000 Investment |
|---|
Class A | $131 | 1.26% |
|---|
| | |
|---|
|
| Expenses Paid, Amount |
$ 131
|
| Expense Ratio, Percent |
1.26%
|
| Factors Affecting Performance [Text Block] |
What affected the Fund’s performance during the last year?The Fund invests in convertible bonds and convertible preferred stocks that are influenced by both the stock market and bond market. Stock market returns were quite positive over the last year, and this led to positive convertible returns as well. Furthermore, the fixed coupons and/or preferred dividends of the convertible holdings provided income to the Fund. As of June 30, 2026, the Fund is overweight compared to the ICE BofAML Investment Grade U.S. Conv 5% Constrained Index (the “Index”) in the consumer discretionary, health care, industrials, and information technology sectors. It is underweight in the real estate and utilities sectors. It is approximately equally weighted to other sectors. The Fund is broadly diversified among individual issues, economic sectors, credits, and convertible types. Top contributors to performance: Absolute performance of the Fund during the fiscal year ended June 30, 2026, was led by the information technology sector, followed by the real estate and utilities sectors. Performance relative to the Index was helped by an overweight position in the materials sector, and positive security selection in the consumer discretionary and real estate sectors.
Top detractors from performance: Performance in the financials, industrials, and energy sectors subtracted from returns. Performance relative to the Index was hurt by an overweight in the financials and industrials sectors, and an underweight in the utilities sectors.
|
| Performance Past Does Not Indicate Future [Text] |
The investment return and principal value will fluctuate so that an investor's shares, when redeemed, may be worth more or less than the original cost. Past performance is not a good predictor of the Fund's future performance.
|
| Line Graph [Table Text Block] |
Table Summary | Victory Investment Grade Convertible Fund Class A @ NAV - $20,823 | Victory Investment Grade Convertible Fund Class A @ MOP - $20,361 | Bloomberg U.S. Aggregate Bond Index (regulatory broad based index) - $11,656 | ICE BofAML Investment Grade U.S. Conv 5% Constrained Index - $24,295 | ICE BofAML Investment Grade U.S. Convertible Index - $27,289 |
|---|
6/16 | $10,000 | $9,778 | $10,000 | $10,000 | $10,000 |
|---|
6/17 | $11,342 | $11,091 | $9,969 | $11,658 | $12,040 |
|---|
6/18 | $12,574 | $12,295 | $9,929 | $12,944 | $13,827 |
|---|
6/19 | $13,534 | $13,234 | $10,710 | $14,432 | $15,280 |
|---|
6/20 | $14,030 | $13,719 | $11,646 | $14,703 | $15,457 |
|---|
6/21 | $17,636 | $17,245 | $11,607 | $17,990 | $18,661 |
|---|
6/22 | $16,063 | $15,708 | $10,413 | $17,421 | $17,776 |
|---|
6/23 | $16,626 | $16,258 | $10,315 | $18,071 | $18,371 |
|---|
6/24 | $17,873 | $17,477 | $10,587 | $19,579 | $19,840 |
|---|
6/25 | $19,193 | $18,768 | $11,230 | $21,894 | $21,984 |
|---|
6/26 | $20,823 | $20,361 | $11,656 | $24,295 | $27,289 |
|---|
|
| Average Annual Return [Table Text Block] |
Table Summary | 1 Year | 5 Year | 10 Year |
|---|
Class A @ NAV | 8.49% | 3.38% | 7.61% |
|---|
Class A @ MOP | 6.07% | 2.91% | 7.37% |
|---|
Bloomberg U.S. Aggregate Bond Index | 3.79% | 0.08% | 1.54% |
|---|
ICE BofAML Investment Grade U.S. Conv 5% Constrained Index | 10.97% | 6.19% | 9.28% |
|---|
ICE BofAML Investment Grade U.S. Convertible Index | 24.13% | 7.90% | 10.56% |
|---|
|
| No Deduction of Taxes [Text Block] |
The graph and table total returns do not reflect the deduction of taxes that a shareholder would pay on Fund distributions, or redemption of shares.
|
| Previous Investment Adviser [Text Block] |
The maximum offering price (“MOP”) figures reflect a maximum sales charge of 2.25% for Class A. The Net Asset Value ("NAV") figures do not reflect sales charges.
|
| AssetsNet |
$ 241,596,000
|
| Holdings Count | Holding |
61
|
| Advisory Fees Paid, Amount |
$ 1,861,000
|
| InvestmentCompanyPortfolioTurnover |
27.00%
|
| Additional Fund Statistics [Text Block] |
FUND STATISTICS($ amounts in 000s)(as of June 30, 2026)Table SummaryNet Assets | $241,596 |
|---|
Number of Holdings | 61 |
|---|
Investment Advisory Fees | $1,861 |
|---|
Portfolio Turnover | 27% |
|---|
|
| Holdings [Text Block] |
Top SectorsFootnote Reference* (% of Net Assets)Footnote Reference(as of June 30, 2026)Table SummaryValue | Value |
|---|
Communication Services | 0.2% | Materials | 1.1% | Consumer Discretionary | 4.1% | Health Care | 5.1% | Industrials | 8.3% | Information Technology | 8.4% | Real Estate | 14.1% | Utilities | 26.5% | Financials | 29.5% | Top 10 HoldingsFootnote Reference* (% of Net Assets)Footnote Reference(as of June 30, 2026)Table SummaryBank of America Corp., Series L, 7.25% | 5.1% |
|---|
Uber Technologies, Inc., 0.88%, 12/1/28 | 5.0% |
|---|
Welltower OP LLC, 2.75%, 5/15/28 | 4.8% |
|---|
Wells Fargo & Co., Series L, 7.50% | 4.5% |
|---|
Vishay Intertechnology, Inc., 2.25%, 9/15/30 | 4.4% |
|---|
Meritage Homes Corp., 1.75%, 5/15/28 | 4.1% |
|---|
Envista Holdings Corp., 1.75%, 8/15/28 | 3.7% |
|---|
Barclays Bank PLC, 1.00%, 2/16/29 | 3.7% |
|---|
NextEra Energy, Inc., 7.30%, 6/1/27 | 3.3% |
|---|
The Southern Co., Series A, 7.13%, 12/15/28 | 3.3% |
|---|
|
| C000052112 |
|
| Shareholder Report [Line Items] |
|
| Fund Name |
Victory Investment Grade Convertible Fund
|
| Class Name |
Class I
|
| Trading Symbol |
VICIX
|
| Annual or Semi-Annual Statement [Text Block] |
Annual Shareholder Report
|
| Additional Information [Text Block] |
You can find additional information about the Fund at advisor.vcm.com/literature/mutual-fund-prospectuses. You may also request more information by calling 800-539-3863 or visiting vcm.com/contact-us.
|
| Additional Information Phone Number |
800-539-3863
|
| Additional Information Website |
vcm.com
|
| Expenses [Text Block] |
What were the Fund's costs for the last year?(based on a hypothetical $10,000 investment) Table SummaryClass Name | Costs of a $10,000 Investment | Costs paid as a percentage of a $10,000 Investment |
|---|
Class I | $99 | 0.95% |
|---|
| | |
|---|
|
| Expenses Paid, Amount |
$ 99
|
| Expense Ratio, Percent |
0.95%
|
| Factors Affecting Performance [Text Block] |
What affected the Fund’s performance during the last year?The Fund invests in convertible bonds and convertible preferred stocks that are influenced by both the stock market and bond market. Stock market returns were quite positive over the last year, and this led to positive convertible returns as well. Furthermore, the fixed coupons and/or preferred dividends of the convertible holdings provided income to the Fund. As of June 30, 2026, the Fund is overweight compared to the ICE BofAML Investment Grade U.S. Conv 5% Constrained Index (the “Index”) in the consumer discretionary, health care, industrials, and information technology sectors. It is underweight in the real estate and utilities sectors. It is approximately equally weighted to other sectors. The Fund is broadly diversified among individual issues, economic sectors, credits, and convertible types. Top contributors to performance: Absolute performance of the Fund during the fiscal year ended June 30, 2026, was led by the information technology sector, followed by the real estate and utilities sectors. Performance relative to the Index was helped by an overweight position in the materials sector, and positive security selection in the consumer discretionary and real estate sectors.
Top detractors from performance: Performance in the financials, industrials, and energy sectors subtracted from returns. Performance relative to the Index was hurt by an overweight in the financials and industrials sectors, and an underweight in the utilities sectors.
|
| Performance Past Does Not Indicate Future [Text] |
The investment return and principal value will fluctuate so that an investor's shares, when redeemed, may be worth more or less than the original cost. Past performance is not a good predictor of the Fund's future performance.
|
| Line Graph [Table Text Block] |
Table Summary | Victory Investment Grade Convertible Fund Class I - $4,326,300 | Bloomberg U.S. Aggregate Bond Index (regulatory broad based index) - $2,331,106 | ICE BofAML Investment Grade U.S. Conv 5% Constrained Index - $4,859,002 | ICE BofAML Investment Grade U.S. Convertible Index - $5,457,735 |
|---|
6/16 | $2,000,000 | $2,000,000 | $2,000,000 | $2,000,000 |
|---|
6/17 | $2,279,634 | $1,993,707 | $2,331,504 | $2,408,053 |
|---|
6/18 | $2,536,487 | $1,985,787 | $2,588,873 | $2,765,387 |
|---|
6/19 | $2,742,419 | $2,142,053 | $2,886,436 | $3,055,992 |
|---|
6/20 | $2,856,876 | $2,329,261 | $2,940,538 | $3,091,312 |
|---|
6/21 | $3,607,812 | $2,321,499 | $3,598,060 | $3,732,235 |
|---|
6/22 | $3,298,283 | $2,082,567 | $3,484,241 | $3,555,168 |
|---|
6/23 | $3,420,978 | $2,063,037 | $3,614,138 | $3,674,217 |
|---|
6/24 | $3,691,933 | $2,117,316 | $3,915,784 | $3,968,072 |
|---|
6/25 | $3,976,476 | $2,245,965 | $4,378,844 | $4,396,798 |
|---|
6/26 | $4,326,300 | $2,331,106 | $4,859,002 | $5,457,735 |
|---|
|
| Average Annual Return [Table Text Block] |
Table Summary | 1 Year | 5 Year | 10 Year |
|---|
Class I | 8.80% | 3.70% | 8.02% |
|---|
Bloomberg U.S. Aggregate Bond Index | 3.79% | 0.08% | 1.54% |
|---|
ICE BofAML Investment Grade U.S. Conv 5% Constrained Index | 10.97% | 6.19% | 9.28% |
|---|
ICE BofAML Investment Grade U.S. Convertible Index | 24.13% | 7.90% | 10.56% |
|---|
|
| No Deduction of Taxes [Text Block] |
The graph and table total returns do not reflect the deduction of taxes that a shareholder would pay on Fund distributions, or redemption of shares.
|
| AssetsNet |
$ 241,596,000
|
| Holdings Count | Holding |
61
|
| Advisory Fees Paid, Amount |
$ 1,861,000
|
| InvestmentCompanyPortfolioTurnover |
27.00%
|
| Additional Fund Statistics [Text Block] |
FUND STATISTICS($ amounts in 000s)(as of June 30, 2026)Table SummaryNet Assets | $241,596 |
|---|
Number of Holdings | 61 |
|---|
Investment Advisory Fees | $1,861 |
|---|
Portfolio Turnover | 27% |
|---|
|
| Holdings [Text Block] |
Top SectorsFootnote Reference* (% of Net Assets)Footnote Reference(as of June 30, 2026)Table SummaryValue | Value |
|---|
Communication Services | 0.2% | Materials | 1.1% | Consumer Discretionary | 4.1% | Health Care | 5.1% | Industrials | 8.3% | Information Technology | 8.4% | Real Estate | 14.1% | Utilities | 26.5% | Financials | 29.5% | Top 10 HoldingsFootnote Reference* (% of Net Assets)Footnote Reference(as of June 30, 2026)Table SummaryBank of America Corp., Series L, 7.25% | 5.1% |
|---|
Uber Technologies, Inc., 0.88%, 12/1/28 | 5.0% |
|---|
Welltower OP LLC, 2.75%, 5/15/28 | 4.8% |
|---|
Wells Fargo & Co., Series L, 7.50% | 4.5% |
|---|
Vishay Intertechnology, Inc., 2.25%, 9/15/30 | 4.4% |
|---|
Meritage Homes Corp., 1.75%, 5/15/28 | 4.1% |
|---|
Envista Holdings Corp., 1.75%, 8/15/28 | 3.7% |
|---|
Barclays Bank PLC, 1.00%, 2/16/29 | 3.7% |
|---|
NextEra Energy, Inc., 7.30%, 6/1/27 | 3.3% |
|---|
The Southern Co., Series A, 7.13%, 12/15/28 | 3.3% |
|---|
|
| C000219861 |
|
| Shareholder Report [Line Items] |
|
| Fund Name |
Victory Investment Grade Convertible Fund
|
| Class Name |
Member Class
|
| Trading Symbol |
SBFMX
|
| Annual or Semi-Annual Statement [Text Block] |
Annual Shareholder Report
|
| Additional Information [Text Block] |
You can find additional information about the Fund at advisor.vcm.com/literature/mutual-fund-prospectuses. You may also request more information by calling 800-235-8396 or visiting vcm.com/contact-us.
|
| Additional Information Phone Number |
800-235-8396
|
| Additional Information Website |
vcm.com
|
| Expenses [Text Block] |
What were the Fund's costs for the last year?(based on a hypothetical $10,000 investment) Table SummaryClass Name | Costs of a $10,000 Investment | Costs paid as a percentage of a $10,000 Investment |
|---|
Member Class | $115 | 1.10% |
|---|
| | |
|---|
|
| Expenses Paid, Amount |
$ 115
|
| Expense Ratio, Percent |
1.10%
|
| Factors Affecting Performance [Text Block] |
What affected the Fund’s performance during the last year?The Fund invests in convertible bonds and convertible preferred stocks that are influenced by both the stock market and bond market. Stock market returns were quite positive over the last year, and this led to positive convertible returns as well. Furthermore, the fixed coupons and/or preferred dividends of the convertible holdings provided income to the Fund. As of June 30, 2026, the Fund is overweight compared to the ICE BofAML Investment Grade U.S. Conv 5% Constrained Index (the “Index”) in the consumer discretionary, health care, industrials, and information technology sectors. It is underweight in the real estate and utilities sectors. It is approximately equally weighted to other sectors. The Fund is broadly diversified among individual issues, economic sectors, credits, and convertible types. Top contributors to performance: Absolute performance of the Fund during the fiscal year ended June 30, 2026, was led by the information technology sector, followed by the real estate and utilities sectors. Performance relative to the Index was helped by an overweight position in the materials sector, and positive security selection in the consumer discretionary and real estate sectors.
Top detractors from performance: Performance in the financials, industrials, and energy sectors subtracted from returns. Performance relative to the Index was hurt by an overweight in the financials and industrials sectors, and an underweight in the utilities sectors.
|
| Performance Past Does Not Indicate Future [Text] |
The investment return and principal value will fluctuate so that an investor's shares, when redeemed, may be worth more or less than the original cost. Past performance is not a good predictor of the Fund's future performance.
|
| Line Graph [Table Text Block] |
Table Summary | Victory Investment Grade Convertible Fund Member Class - $14,122 | Bloomberg U.S. Aggregate Bond Index (regulatory broad based index) - $9,983 | ICE BofAML Investment Grade U.S. Conv 5% Constrained Index - $15,630 | ICE BofAML Investment Grade U.S. Convertible Index - $16,509 |
|---|
11/20Footnote Reference* | $10,000 | $10,000 | $10,000 | $10,000 |
|---|
6/21 | $11,869 | $9,942 | $11,574 | $11,290 |
|---|
6/22 | $10,829 | $8,919 | $11,208 | $10,754 |
|---|
6/23 | $11,215 | $8,835 | $11,626 | $11,114 |
|---|
6/24 | $12,082 | $9,068 | $12,596 | $12,003 |
|---|
6/25 | $12,991 | $9,619 | $14,086 | $13,300 |
|---|
6/26 | $14,122 | $9,983 | $15,630 | $16,509 |
|---|
|
| Average Annual Return [Table Text Block] |
Table Summary | 1 Year | 5 Year | Since Inception |
|---|
Member Class | 8.70% | 3.54% | 6.29% |
|---|
Bloomberg U.S. Aggregate Bond Index | 3.79% | 0.08% | -0.03% |
|---|
ICE BofAML Investment Grade U.S. Conv 5% Constrained Index | 10.97% | 6.19% | 8.21% |
|---|
ICE BofAML Investment Grade U.S. Convertible Index | 24.13% | 7.90% | 9.27% |
|---|
|
| No Deduction of Taxes [Text Block] |
The graph and table total returns do not reflect the deduction of taxes that a shareholder would pay on Fund distributions, or redemption of shares.
|
| AssetsNet |
$ 241,596,000
|
| Holdings Count | Holding |
61
|
| Advisory Fees Paid, Amount |
$ 1,861,000
|
| InvestmentCompanyPortfolioTurnover |
27.00%
|
| Additional Fund Statistics [Text Block] |
FUND STATISTICS($ amounts in 000s)(as of June 30, 2026)Table SummaryNet Assets | $241,596 |
|---|
Number of Holdings | 61 |
|---|
Investment Advisory Fees | $1,861 |
|---|
Portfolio Turnover | 27% |
|---|
|
| Holdings [Text Block] |
Top SectorsFootnote Reference* (% of Net Assets)Footnote Reference(as of June 30, 2026)Table SummaryValue | Value |
|---|
Communication Services | 0.2% | Materials | 1.1% | Consumer Discretionary | 4.1% | Health Care | 5.1% | Industrials | 8.3% | Information Technology | 8.4% | Real Estate | 14.1% | Utilities | 26.5% | Financials | 29.5% | Top 10 HoldingsFootnote Reference* (% of Net Assets)Footnote Reference(as of June 30, 2026)Table SummaryBank of America Corp., Series L, 7.25% | 5.1% |
|---|
Uber Technologies, Inc., 0.88%, 12/1/28 | 5.0% |
|---|
Welltower OP LLC, 2.75%, 5/15/28 | 4.8% |
|---|
Wells Fargo & Co., Series L, 7.50% | 4.5% |
|---|
Vishay Intertechnology, Inc., 2.25%, 9/15/30 | 4.4% |
|---|
Meritage Homes Corp., 1.75%, 5/15/28 | 4.1% |
|---|
Envista Holdings Corp., 1.75%, 8/15/28 | 3.7% |
|---|
Barclays Bank PLC, 1.00%, 2/16/29 | 3.7% |
|---|
NextEra Energy, Inc., 7.30%, 6/1/27 | 3.3% |
|---|
The Southern Co., Series A, 7.13%, 12/15/28 | 3.3% |
|---|
|
| C000002334 |
|
| Shareholder Report [Line Items] |
|
| Fund Name |
Victory Sycamore Established Value Fund
|
| Class Name |
Class A
|
| Trading Symbol |
VETAX
|
| Annual or Semi-Annual Statement [Text Block] |
Annual Shareholder Report
|
| Additional Information [Text Block] |
You can find additional information about the Fund at advisor.vcm.com/literature/mutual-fund-prospectuses. You may also request more information by calling 800-539-3863 or visiting vcm.com/contact-us.
|
| Additional Information Phone Number |
800-539-3863
|
| Additional Information Website |
vcm.com
|
| Expenses [Text Block] |
What were the Fund's costs for the last year?(based on a hypothetical $10,000 investment) Table SummaryClass Name | Costs of a $10,000 Investment | Costs paid as a percentage of a $10,000 Investment |
|---|
Class A | $97 | 0.89% |
|---|
| | |
|---|
|
| Expenses Paid, Amount |
$ 97
|
| Expense Ratio, Percent |
0.89%
|
| Factors Affecting Performance [Text Block] |
What affected the Fund’s performance during the last year?The Fund underperformed the Russell Midcap® Value Index (the “Index”) for the trailing 12-month period ended June 30, 2026. Index returns were positive across 10 of the 11 major economic sectors, with three sectors outpacing the broader Index. Information technology was the top-performing sector in the Index, posting a return of 126.33%. By contrast, consumer staples was the weakest-performing sector in the Index, returning -0.48%. Top contributors to performance: Stock selection in the consumer staples and consumer discretionary sectors contributed positively to relative performance. The Fund’s underweight allocations to the financials and real estate sectors also contributed positively to relative performance. The Fund had no exposure to the communication services sector, which detracted from the broader Index returns and therefore contributed positively to the Fund’s relative performance.
Top detractors from performance: For the trailing 12-month period ended June 30, 2026, stock selection and sector allocation both detracted from relative return, with stock selection having the larger impact on relative underperformance for the period. Stock selection in the information technology, industrials, health care and energy sectors detracted from relative performance. The Fund’s underweight allocation to the information technology sector (the top-performing sector) also detracted from relative performance.
|
| Performance Past Does Not Indicate Future [Text] |
The investment return and principal value will fluctuate so that an investor's shares, when redeemed, may be worth more or less than the original cost. Past performance is not a good predictor of the Fund's future performance.
|
| Line Graph [Table Text Block] |
Table Summary | Victory Sycamore Established Value Fund Class A @ NAV - $28,627 | Victory Sycamore Established Value Fund Class A @ MOP - $26,980 | S&P 500® Index (regulatory broad based index) - $42,271 | Russell Midcap® Value Index - $27,455 |
|---|
6/16 | $10,000 | $9,425 | $10,000 | $10,000 |
|---|
6/17 | $11,594 | $10,927 | $11,790 | $11,593 |
|---|
6/18 | $12,890 | $12,149 | $13,484 | $12,473 |
|---|
6/19 | $13,592 | $12,811 | $14,889 | $12,932 |
|---|
6/20 | $12,471 | $11,754 | $16,006 | $11,405 |
|---|
6/21 | $19,393 | $18,278 | $22,536 | $17,456 |
|---|
6/22 | $18,519 | $17,454 | $20,144 | $15,711 |
|---|
6/23 | $20,977 | $19,770 | $24,091 | $17,361 |
|---|
6/24 | $23,224 | $21,888 | $30,006 | $19,441 |
|---|
6/25 | $24,224 | $22,830 | $34,556 | $21,683 |
|---|
6/26 | $28,627 | $26,980 | $42,271 | $27,455 |
|---|
|
| Average Annual Return [Table Text Block] |
Table Summary | 1 Year | 5 Year | 10 Year |
|---|
Class A @ NAV | 18.18%Footnote Reference | 8.10% | 11.09% |
|---|
Class A @ MOP | 11.38% | 6.83% | 10.43% |
|---|
S&P 500® Index | 22.32% | 13.41% | 15.51% |
|---|
Russell Midcap® Value Index | 26.62% | 9.48% | 10.63% |
|---|
|
| No Deduction of Taxes [Text Block] |
The graph and table total returns do not reflect the deduction of taxes that a shareholder would pay on Fund distributions, or redemption of shares.
|
| Previous Investment Adviser [Text Block] |
The maximum offering price (“MOP”) figures reflect a maximum sales charge of 5.75% for Class A. The Net Asset Value ("NAV") figures do not reflect sales charges.
|
| AssetsNet |
$ 15,415,164,000
|
| Holdings Count | Holding |
77
|
| Advisory Fees Paid, Amount |
$ 73,320,000
|
| InvestmentCompanyPortfolioTurnover |
60.00%
|
| Additional Fund Statistics [Text Block] |
FUND STATISTICS($ amounts in 000s)(as of June 30, 2026)Table SummaryNet Assets | $15,415,164 |
|---|
Number of Holdings | 77 |
|---|
Investment Advisory Fees | $73,320 |
|---|
Portfolio Turnover | 60% |
|---|
|
| Holdings [Text Block] |
Top SectorsFootnote Reference* (% of Net Assets)Footnote Reference(as of June 30, 2026)Table SummaryValue | Value |
|---|
Consumer Staples | 4.8% | Utilities | 5.6% | Real Estate | 6.1% | Energy | 6.7% | Financials | 7.5% | Health Care | 8.9% | Materials | 10.2% | Information Technology | 11.6% | Consumer Discretionary | 12.7% | Industrials | 23.7% | Top 10 HoldingsFootnote Reference* (% of Net Assets)Footnote Reference(as of June 30, 2026)Table SummaryLabcorp Holdings, Inc. | 2.6% |
|---|
U.S. Foods Holding Corp. | 2.3% |
|---|
Molina Healthcare, Inc. | 2.1% |
|---|
Alliant Energy Corp. | 2.1% |
|---|
Microchip Technology, Inc. | 2.0% |
|---|
Packaging Corp. of America | 2.0% |
|---|
RPM International, Inc. | 2.0% |
|---|
Keysight Technologies, Inc. | 1.9% |
|---|
Truist Financial Corp. | 1.9% |
|---|
Hubbell, Inc., Class B | 1.9% |
|---|
|
| C000169232 |
|
| Shareholder Report [Line Items] |
|
| Fund Name |
Victory Sycamore Established Value Fund
|
| Class Name |
Class C
|
| Trading Symbol |
VEVCX
|
| Annual or Semi-Annual Statement [Text Block] |
Annual Shareholder Report
|
| Additional Information [Text Block] |
You can find additional information about the Fund at advisor.vcm.com/literature/mutual-fund-prospectuses. You may also request more information by calling 800-539-3863 or visiting vcm.com/contact-us.
|
| Additional Information Phone Number |
800-539-3863
|
| Additional Information Website |
vcm.com
|
| Expenses [Text Block] |
What were the Fund's costs for the last year?(based on a hypothetical $10,000 investment) Table SummaryClass Name | Costs of a $10,000 Investment | Costs paid as a percentage of a $10,000 Investment |
|---|
Class C | $200 | 1.84% |
|---|
| | |
|---|
|
| Expenses Paid, Amount |
$ 200
|
| Expense Ratio, Percent |
1.84%
|
| Factors Affecting Performance [Text Block] |
What affected the Fund’s performance during the last year?The Fund underperformed the Russell Midcap® Value Index (the “Index”) for the trailing 12-month period ended June 30, 2026. Index returns were positive across 10 of the 11 major economic sectors, with three sectors outpacing the broader Index. Information technology was the top-performing sector in the Index, posting a return of 126.33%. By contrast, consumer staples was the weakest-performing sector in the Index, returning -0.48%. Top contributors to performance: Stock selection in the consumer staples and consumer discretionary sectors contributed positively to relative performance. The Fund’s underweight allocations to the financials and real estate sectors also contributed positively to relative performance. The Fund had no exposure to the communication services sector, which detracted from the broader Index returns and therefore contributed positively to the Fund’s relative performance.
Top detractors from performance: For the trailing 12-month period ended June 30, 2026, stock selection and sector allocation both detracted from relative return, with stock selection having the larger impact on relative underperformance for the period. Stock selection in the information technology, industrials, health care and energy sectors detracted from relative performance. The Fund’s underweight allocation to the information technology sector (the top-performing sector) also detracted from relative performance.
|
| Performance Past Does Not Indicate Future [Text] |
The investment return and principal value will fluctuate so that an investor's shares, when redeemed, may be worth more or less than the original cost. Past performance is not a good predictor of the Fund's future performance.
|
| Line Graph [Table Text Block] |
Table Summary | Victory Sycamore Established Value Fund Class C @ NAV - $26,917 | Victory Sycamore Established Value Fund Class C @ CDSC - $26,917 | S&P 500® Index (regulatory broad based index) - $42,271 | Russell Midcap® Value Index - $27,455 |
|---|
6/16 | $10,000 | $10,000 | $10,000 | $10,000 |
|---|
6/17 | $11,503 | $11,503 | $11,790 | $11,593 |
|---|
6/18 | $12,689 | $12,689 | $13,484 | $12,473 |
|---|
6/19 | $13,279 | $13,279 | $14,889 | $12,932 |
|---|
6/20 | $12,091 | $12,091 | $16,006 | $11,405 |
|---|
6/21 | $18,658 | $18,658 | $22,536 | $17,456 |
|---|
6/22 | $17,683 | $17,683 | $20,144 | $15,711 |
|---|
6/23 | $19,876 | $19,876 | $24,091 | $17,361 |
|---|
6/24 | $21,837 | $21,837 | $30,006 | $19,441 |
|---|
6/25 | $22,777 | $22,777 | $34,556 | $21,683 |
|---|
6/26 | $26,917 | $26,917 | $42,271 | $27,455 |
|---|
|
| Average Annual Return [Table Text Block] |
Table Summary | 1 Year | 5 Year | 10 Year |
|---|
Class C @ NAV | 17.04%Footnote Reference | 7.21% | 10.41% |
|---|
Class C @ CDSC | 16.04% | 7.21% | 10.41% |
|---|
S&P 500® Index | 22.32% | 13.41% | 15.51% |
|---|
Russell Midcap® Value Index | 26.62% | 9.48% | 10.63% |
|---|
|
| No Deduction of Taxes [Text Block] |
The graph and table total returns do not reflect the deduction of taxes that a shareholder would pay on Fund distributions, or redemption of shares.
|
| Previous Investment Adviser [Text Block] |
Class C is not subject to an initial sales charge, but is subject to Contingent Deferred Sales Charge (“CDSC”) of 1.00% on shares redeemed within one year of purchase. The Net Asset Value ("NAV") figures do not reflect sales charges.
|
| AssetsNet |
$ 15,415,164,000
|
| Holdings Count | Holding |
77
|
| Advisory Fees Paid, Amount |
$ 73,320,000
|
| InvestmentCompanyPortfolioTurnover |
60.00%
|
| Additional Fund Statistics [Text Block] |
FUND STATISTICS($ amounts in 000s)(as of June 30, 2026)Table SummaryNet Assets | $15,415,164 |
|---|
Number of Holdings | 77 |
|---|
Investment Advisory Fees | $73,320 |
|---|
Portfolio Turnover | 60% |
|---|
|
| Holdings [Text Block] |
Top SectorsFootnote Reference* (% of Net Assets)Footnote Reference(as of June 30, 2026)Table SummaryValue | Value |
|---|
Consumer Staples | 4.8% | Utilities | 5.6% | Real Estate | 6.1% | Energy | 6.7% | Financials | 7.5% | Health Care | 8.9% | Materials | 10.2% | Information Technology | 11.6% | Consumer Discretionary | 12.7% | Industrials | 23.7% | Top 10 HoldingsFootnote Reference* (% of Net Assets)Footnote Reference(as of June 30, 2026)Table SummaryLabcorp Holdings, Inc. | 2.6% |
|---|
U.S. Foods Holding Corp. | 2.3% |
|---|
Molina Healthcare, Inc. | 2.1% |
|---|
Alliant Energy Corp. | 2.1% |
|---|
Microchip Technology, Inc. | 2.0% |
|---|
Packaging Corp. of America | 2.0% |
|---|
RPM International, Inc. | 2.0% |
|---|
Keysight Technologies, Inc. | 1.9% |
|---|
Truist Financial Corp. | 1.9% |
|---|
Hubbell, Inc., Class B | 1.9% |
|---|
|
| C000052114 |
|
| Shareholder Report [Line Items] |
|
| Fund Name |
Victory Sycamore Established Value Fund
|
| Class Name |
Class I
|
| Trading Symbol |
VEVIX
|
| Annual or Semi-Annual Statement [Text Block] |
Annual Shareholder Report
|
| Additional Information [Text Block] |
You can find additional information about the Fund at advisor.vcm.com/literature/mutual-fund-prospectuses. You may also request more information by calling 800-539-3863 or visiting vcm.com/contact-us.
|
| Additional Information Phone Number |
800-539-3863
|
| Additional Information Website |
vcm.com
|
| Expenses [Text Block] |
What were the Fund's costs for the last year?(based on a hypothetical $10,000 investment) Table SummaryClass Name | Costs of a $10,000 Investment | Costs paid as a percentage of a $10,000 Investment |
|---|
Class I | $62 | 0.57% |
|---|
| | |
|---|
|
| Expenses Paid, Amount |
$ 62
|
| Expense Ratio, Percent |
0.57%
|
| Factors Affecting Performance [Text Block] |
What affected the Fund’s performance during the last year?The Fund underperformed the Russell Midcap® Value Index (the “Index”) for the trailing 12-month period ended June 30, 2026. Index returns were positive across 10 of the 11 major economic sectors, with three sectors outpacing the broader Index. Information technology was the top-performing sector in the Index, posting a return of 126.33%. By contrast, consumer staples was the weakest-performing sector in the Index, returning -0.48%. Top contributors to performance: Stock selection in the consumer staples and consumer discretionary sectors contributed positively to relative performance. The Fund’s underweight allocations to the financials and real estate sectors also contributed positively to relative performance. The Fund had no exposure to the communication services sector, which detracted from the broader Index returns and therefore contributed positively to the Fund’s relative performance.
Top detractors from performance: For the trailing 12-month period ended June 30, 2026, stock selection and sector allocation both detracted from relative return, with stock selection having the larger impact on relative underperformance for the period. Stock selection in the information technology, industrials, health care and energy sectors detracted from relative performance. The Fund’s underweight allocation to the information technology sector (the top-performing sector) also detracted from relative performance.
|
| Performance Past Does Not Indicate Future [Text] |
The investment return and principal value will fluctuate so that an investor's shares, when redeemed, may be worth more or less than the original cost. Past performance is not a good predictor of the Fund's future performance.
|
| Line Graph [Table Text Block] |
Table Summary | Victory Sycamore Established Value Fund Class I - $5,902,189 | S&P 500® Index (regulatory broad based index) - $8,454,225 | Russell Midcap® Value Index - $5,491,043 |
|---|
6/16 | $2,000,000 | $2,000,000 | $2,000,000 |
|---|
6/17 | $2,324,436 | $2,357,920 | $2,318,510 |
|---|
6/18 | $2,591,786 | $2,696,848 | $2,494,608 |
|---|
6/19 | $2,742,013 | $2,977,791 | $2,586,441 |
|---|
6/20 | $2,523,522 | $3,201,277 | $2,280,934 |
|---|
6/21 | $3,936,786 | $4,507,211 | $3,491,289 |
|---|
6/22 | $3,771,239 | $4,028,733 | $3,142,267 |
|---|
6/23 | $4,285,638 | $4,818,127 | $3,472,290 |
|---|
6/24 | $4,759,586 | $6,001,270 | $3,888,183 |
|---|
6/25 | $4,978,776 | $6,911,282 | $4,336,648 |
|---|
6/26 | $5,902,189 | $8,454,225 | $5,491,043 |
|---|
|
| Average Annual Return [Table Text Block] |
Table Summary | 1 Year | 5 Year | 10 Year |
|---|
Class I | 18.55%Footnote Reference | 8.44% | 11.43% |
|---|
S&P 500® Index | 22.32% | 13.41% | 15.51% |
|---|
Russell Midcap® Value Index | 26.62% | 9.48% | 10.63% |
|---|
|
| No Deduction of Taxes [Text Block] |
The graph and table total returns do not reflect the deduction of taxes that a shareholder would pay on Fund distributions, or redemption of shares.
|
| AssetsNet |
$ 15,415,164,000
|
| Holdings Count | Holding |
77
|
| Advisory Fees Paid, Amount |
$ 73,320,000
|
| InvestmentCompanyPortfolioTurnover |
60.00%
|
| Additional Fund Statistics [Text Block] |
FUND STATISTICS($ amounts in 000s)(as of June 30, 2026)Table SummaryNet Assets | $15,415,164 |
|---|
Number of Holdings | 77 |
|---|
Investment Advisory Fees | $73,320 |
|---|
Portfolio Turnover | 60% |
|---|
|
| Holdings [Text Block] |
Top SectorsFootnote Reference* (% of Net Assets)Footnote Reference(as of June 30, 2026)Table SummaryValue | Value |
|---|
Consumer Staples | 4.8% | Utilities | 5.6% | Real Estate | 6.1% | Energy | 6.7% | Financials | 7.5% | Health Care | 8.9% | Materials | 10.2% | Information Technology | 11.6% | Consumer Discretionary | 12.7% | Industrials | 23.7% | Top 10 HoldingsFootnote Reference* (% of Net Assets)Footnote Reference(as of June 30, 2026)Table SummaryLabcorp Holdings, Inc. | 2.6% |
|---|
U.S. Foods Holding Corp. | 2.3% |
|---|
Molina Healthcare, Inc. | 2.1% |
|---|
Alliant Energy Corp. | 2.1% |
|---|
Microchip Technology, Inc. | 2.0% |
|---|
Packaging Corp. of America | 2.0% |
|---|
RPM International, Inc. | 2.0% |
|---|
Keysight Technologies, Inc. | 1.9% |
|---|
Truist Financial Corp. | 1.9% |
|---|
Hubbell, Inc., Class B | 1.9% |
|---|
|
| C000002335 |
|
| Shareholder Report [Line Items] |
|
| Fund Name |
Victory Sycamore Established Value Fund
|
| Class Name |
Class R
|
| Trading Symbol |
GETGX
|
| Annual or Semi-Annual Statement [Text Block] |
Annual Shareholder Report
|
| Additional Information [Text Block] |
You can find additional information about the Fund at advisor.vcm.com/literature/mutual-fund-prospectuses. You may also request more information by calling 800-539-3863 or visiting vcm.com/contact-us.
|
| Additional Information Phone Number |
800-539-3863
|
| Additional Information Website |
vcm.com
|
| Expenses [Text Block] |
What were the Fund's costs for the last year?(based on a hypothetical $10,000 investment) Table SummaryClass Name | Costs of a $10,000 Investment | Costs paid as a percentage of a $10,000 Investment |
|---|
Class R | $118 | 1.08% |
|---|
| | |
|---|
|
| Expenses Paid, Amount |
$ 118
|
| Expense Ratio, Percent |
1.08%
|
| Factors Affecting Performance [Text Block] |
What affected the Fund’s performance during the last year?The Fund underperformed the Russell Midcap® Value Index (the “Index”) for the trailing 12-month period ended June 30, 2026. Index returns were positive across 10 of the 11 major economic sectors, with three sectors outpacing the broader Index. Information technology was the top-performing sector in the Index, posting a return of 126.33%. By contrast, consumer staples was the weakest-performing sector in the Index, returning -0.48%. Top contributors to performance: Stock selection in the consumer staples and consumer discretionary sectors contributed positively to relative performance. The Fund’s underweight allocations to the financials and real estate sectors also contributed positively to relative performance. The Fund had no exposure to the communication services sector, which detracted from the broader Index returns and therefore contributed positively to the Fund’s relative performance.
Top detractors from performance: For the trailing 12-month period ended June 30, 2026, stock selection and sector allocation both detracted from relative return, with stock selection having the larger impact on relative underperformance for the period. Stock selection in the information technology, industrials, health care and energy sectors detracted from relative performance. The Fund’s underweight allocation to the information technology sector (the top-performing sector) also detracted from relative performance.
|
| Performance Past Does Not Indicate Future [Text] |
The investment return and principal value will fluctuate so that an investor's shares, when redeemed, may be worth more or less than the original cost. Past performance is not a good predictor of the Fund's future performance.
|
| Line Graph [Table Text Block] |
Table Summary | Victory Sycamore Established Value Fund Class R - $28,041 | S&P 500® Index (regulatory broad based index) - $42,271 | Russell Midcap® Value Index - $27,455 |
|---|
6/16 | $10,000 | $10,000 | $10,000 |
|---|
6/17 | $11,569 | $11,790 | $11,593 |
|---|
6/18 | $12,840 | $13,484 | $12,473 |
|---|
6/19 | $13,511 | $14,889 | $12,932 |
|---|
6/20 | $12,371 | $16,006 | $11,405 |
|---|
6/21 | $19,199 | $22,536 | $17,456 |
|---|
6/22 | $18,295 | $20,144 | $15,711 |
|---|
6/23 | $20,677 | $24,091 | $17,361 |
|---|
6/24 | $22,848 | $30,006 | $19,441 |
|---|
6/25 | $23,776 | $34,556 | $21,683 |
|---|
6/26 | $28,041 | $42,271 | $27,455 |
|---|
|
| Average Annual Return [Table Text Block] |
Table Summary | 1 Year | 5 Year | 10 Year |
|---|
Class R | 17.94%Footnote Reference | 7.87% | 10.86% |
|---|
S&P 500® Index | 22.32% | 13.41% | 15.51% |
|---|
Russell Midcap® Value Index | 26.62% | 9.48% | 10.63% |
|---|
|
| No Deduction of Taxes [Text Block] |
The graph and table total returns do not reflect the deduction of taxes that a shareholder would pay on Fund distributions, or redemption of shares.
|
| AssetsNet |
$ 15,415,164,000
|
| Holdings Count | Holding |
77
|
| Advisory Fees Paid, Amount |
$ 73,320,000
|
| InvestmentCompanyPortfolioTurnover |
60.00%
|
| Additional Fund Statistics [Text Block] |
FUND STATISTICS($ amounts in 000s)(as of June 30, 2026)Table SummaryNet Assets | $15,415,164 |
|---|
Number of Holdings | 77 |
|---|
Investment Advisory Fees | $73,320 |
|---|
Portfolio Turnover | 60% |
|---|
|
| Holdings [Text Block] |
Top SectorsFootnote Reference* (% of Net Assets)Footnote Reference(as of June 30, 2026)Table SummaryValue | Value |
|---|
Consumer Staples | 4.8% | Utilities | 5.6% | Real Estate | 6.1% | Energy | 6.7% | Financials | 7.5% | Health Care | 8.9% | Materials | 10.2% | Information Technology | 11.6% | Consumer Discretionary | 12.7% | Industrials | 23.7% | Top 10 HoldingsFootnote Reference* (% of Net Assets)Footnote Reference(as of June 30, 2026)Table SummaryLabcorp Holdings, Inc. | 2.6% |
|---|
U.S. Foods Holding Corp. | 2.3% |
|---|
Molina Healthcare, Inc. | 2.1% |
|---|
Alliant Energy Corp. | 2.1% |
|---|
Microchip Technology, Inc. | 2.0% |
|---|
Packaging Corp. of America | 2.0% |
|---|
RPM International, Inc. | 2.0% |
|---|
Keysight Technologies, Inc. | 1.9% |
|---|
Truist Financial Corp. | 1.9% |
|---|
Hubbell, Inc., Class B | 1.9% |
|---|
|
| C000138366 |
|
| Shareholder Report [Line Items] |
|
| Fund Name |
Victory Sycamore Established Value Fund
|
| Class Name |
Class R6
|
| Trading Symbol |
VEVRX
|
| Annual or Semi-Annual Statement [Text Block] |
Annual Shareholder Report
|
| Additional Information [Text Block] |
You can find additional information about the Fund at advisor.vcm.com/literature/mutual-fund-prospectuses. You may also request more information by calling 800-539-3863 or visiting vcm.com/contact-us.
|
| Additional Information Phone Number |
800-539-3863
|
| Additional Information Website |
vcm.com
|
| Expenses [Text Block] |
What were the Fund's costs for the last year?(based on a hypothetical $10,000 investment) Table SummaryClass Name | Costs of a $10,000 Investment | Costs paid as a percentage of a $10,000 Investment |
|---|
Class R6 | $58 | 0.53% |
|---|
| | |
|---|
|
| Expenses Paid, Amount |
$ 58
|
| Expense Ratio, Percent |
0.53%
|
| Factors Affecting Performance [Text Block] |
What affected the Fund’s performance during the last year?The Fund underperformed the Russell Midcap® Value Index (the “Index”) for the trailing 12-month period ended June 30, 2026. Index returns were positive across 10 of the 11 major economic sectors, with three sectors outpacing the broader Index. Information technology was the top-performing sector in the Index, posting a return of 126.33%. By contrast, consumer staples was the weakest-performing sector in the Index, returning -0.48%. Top contributors to performance: Stock selection in the consumer staples and consumer discretionary sectors contributed positively to relative performance. The Fund’s underweight allocations to the financials and real estate sectors also contributed positively to relative performance. The Fund had no exposure to the communication services sector, which detracted from the broader Index returns and therefore contributed positively to the Fund’s relative performance.
Top detractors from performance: For the trailing 12-month period ended June 30, 2026, stock selection and sector allocation both detracted from relative return, with stock selection having the larger impact on relative underperformance for the period. Stock selection in the information technology, industrials, health care and energy sectors detracted from relative performance. The Fund’s underweight allocation to the information technology sector (the top-performing sector) also detracted from relative performance.
|
| Performance Past Does Not Indicate Future [Text] |
The investment return and principal value will fluctuate so that an investor's shares, when redeemed, may be worth more or less than the original cost. Past performance is not a good predictor of the Fund's future performance.
|
| Line Graph [Table Text Block] |
Table Summary | Victory Sycamore Established Value Fund Class R6 - $29,647 | S&P 500® Index (regulatory broad based index) - $42,271 | Russell Midcap® Value Index - $27,455 |
|---|
6/16 | $10,000 | $10,000 | $10,000 |
|---|
6/17 | $11,634 | $11,790 | $11,593 |
|---|
6/18 | $12,984 | $13,484 | $12,473 |
|---|
6/19 | $13,737 | $14,889 | $12,932 |
|---|
6/20 | $12,645 | $16,006 | $11,405 |
|---|
6/21 | $19,736 | $22,536 | $17,456 |
|---|
6/22 | $18,914 | $20,144 | $15,711 |
|---|
6/23 | $21,501 | $24,091 | $17,361 |
|---|
6/24 | $23,892 | $30,006 | $19,441 |
|---|
6/25 | $25,000 | $34,556 | $21,683 |
|---|
6/26 | $29,647 | $42,271 | $27,455 |
|---|
|
| Average Annual Return [Table Text Block] |
Table Summary | 1 Year | 5 Year | 10 Year |
|---|
Class R6 | 18.59%Footnote Reference | 8.48% | 11.48% |
|---|
S&P 500® Index | 22.32% | 13.41% | 15.51% |
|---|
Russell Midcap® Value Index | 26.62% | 9.48% | 10.63% |
|---|
|
| No Deduction of Taxes [Text Block] |
The graph and table total returns do not reflect the deduction of taxes that a shareholder would pay on Fund distributions, or redemption of shares.
|
| AssetsNet |
$ 15,415,164,000
|
| Holdings Count | Holding |
77
|
| Advisory Fees Paid, Amount |
$ 73,320,000
|
| InvestmentCompanyPortfolioTurnover |
60.00%
|
| Additional Fund Statistics [Text Block] |
FUND STATISTICS($ amounts in 000s)(as of June 30, 2026)Table SummaryNet Assets | $15,415,164 |
|---|
Number of Holdings | 77 |
|---|
Investment Advisory Fees | $73,320 |
|---|
Portfolio Turnover | 60% |
|---|
|
| Holdings [Text Block] |
Top SectorsFootnote Reference* (% of Net Assets)Footnote Reference(as of June 30, 2026)Table SummaryValue | Value |
|---|
Consumer Staples | 4.8% | Utilities | 5.6% | Real Estate | 6.1% | Energy | 6.7% | Financials | 7.5% | Health Care | 8.9% | Materials | 10.2% | Information Technology | 11.6% | Consumer Discretionary | 12.7% | Industrials | 23.7% | Top 10 HoldingsFootnote Reference* (% of Net Assets)Footnote Reference(as of June 30, 2026)Table SummaryLabcorp Holdings, Inc. | 2.6% |
|---|
U.S. Foods Holding Corp. | 2.3% |
|---|
Molina Healthcare, Inc. | 2.1% |
|---|
Alliant Energy Corp. | 2.1% |
|---|
Microchip Technology, Inc. | 2.0% |
|---|
Packaging Corp. of America | 2.0% |
|---|
RPM International, Inc. | 2.0% |
|---|
Keysight Technologies, Inc. | 1.9% |
|---|
Truist Financial Corp. | 1.9% |
|---|
Hubbell, Inc., Class B | 1.9% |
|---|
|
| C000111271 |
|
| Shareholder Report [Line Items] |
|
| Fund Name |
Victory Sycamore Established Value Fund
|
| Class Name |
Class Y
|
| Trading Symbol |
VEVYX
|
| Annual or Semi-Annual Statement [Text Block] |
Annual Shareholder Report
|
| Additional Information [Text Block] |
You can find additional information about the Fund at advisor.vcm.com/literature/mutual-fund-prospectuses. You may also request more information by calling 800-539-3863 or visiting vcm.com/contact-us.
|
| Additional Information Phone Number |
800-539-3863
|
| Additional Information Website |
vcm.com
|
| Expenses [Text Block] |
What were the Fund's costs for the last year?(based on a hypothetical $10,000 investment) Table SummaryClass Name | Costs of a $10,000 Investment | Costs paid as a percentage of a $10,000 Investment |
|---|
Class Y | $70 | 0.64% |
|---|
| | |
|---|
|
| Expenses Paid, Amount |
$ 70
|
| Expense Ratio, Percent |
0.64%
|
| Factors Affecting Performance [Text Block] |
What affected the Fund’s performance during the last year?The Fund underperformed the Russell Midcap® Value Index (the “Index”) for the trailing 12-month period ended June 30, 2026. Index returns were positive across 10 of the 11 major economic sectors, with three sectors outpacing the broader Index. Information technology was the top-performing sector in the Index, posting a return of 126.33%. By contrast, consumer staples was the weakest-performing sector in the Index, returning -0.48%. Top contributors to performance: Stock selection in the consumer staples and consumer discretionary sectors contributed positively to relative performance. The Fund’s underweight allocations to the financials and real estate sectors also contributed positively to relative performance. The Fund had no exposure to the communication services sector, which detracted from the broader Index returns and therefore contributed positively to the Fund’s relative performance.
Top detractors from performance: For the trailing 12-month period ended June 30, 2026, stock selection and sector allocation both detracted from relative return, with stock selection having the larger impact on relative underperformance for the period. Stock selection in the information technology, industrials, health care and energy sectors detracted from relative performance. The Fund’s underweight allocation to the information technology sector (the top-performing sector) also detracted from relative performance.
|
| Performance Past Does Not Indicate Future [Text] |
The investment return and principal value will fluctuate so that an investor's shares, when redeemed, may be worth more or less than the original cost. Past performance is not a good predictor of the Fund's future performance.
|
| Line Graph [Table Text Block] |
Table Summary | Victory Sycamore Established Value Fund Class Y - $2,939,223 | S&P 500® Index (regulatory broad based index) - $4,227,112 | Russell Midcap® Value Index - $2,745,521 |
|---|
6/16 | $1,000,000 | $1,000,000 | $1,000,000 |
|---|
6/17 | $1,162,374 | $1,178,960 | $1,159,255 |
|---|
6/18 | $1,296,214 | $1,348,424 | $1,247,304 |
|---|
6/19 | $1,371,049 | $1,488,895 | $1,293,221 |
|---|
6/20 | $1,261,333 | $1,600,639 | $1,140,467 |
|---|
6/21 | $1,967,494 | $2,253,606 | $1,745,645 |
|---|
6/22 | $1,883,998 | $2,014,367 | $1,571,133 |
|---|
6/23 | $2,139,169 | $2,409,064 | $1,736,145 |
|---|
6/24 | $2,373,889 | $3,000,635 | $1,944,092 |
|---|
6/25 | $2,481,418 | $3,455,641 | $2,168,324 |
|---|
6/26 | $2,939,223 | $4,227,112 | $2,745,521 |
|---|
|
| Average Annual Return [Table Text Block] |
Table Summary | 1 Year | 5 Year | 10 Year |
|---|
Class Y | 18.45%Footnote Reference | 8.36% | 11.38% |
|---|
S&P 500® Index | 22.32% | 13.41% | 15.51% |
|---|
Russell Midcap® Value Index | 26.62% | 9.48% | 10.63% |
|---|
|
| No Deduction of Taxes [Text Block] |
The graph and table total returns do not reflect the deduction of taxes that a shareholder would pay on Fund distributions, or redemption of shares.
|
| AssetsNet |
$ 15,415,164,000
|
| Holdings Count | Holding |
77
|
| Advisory Fees Paid, Amount |
$ 73,320,000
|
| InvestmentCompanyPortfolioTurnover |
60.00%
|
| Additional Fund Statistics [Text Block] |
FUND STATISTICS($ amounts in 000s)(as of June 30, 2026)Table SummaryNet Assets | $15,415,164 |
|---|
Number of Holdings | 77 |
|---|
Investment Advisory Fees | $73,320 |
|---|
Portfolio Turnover | 60% |
|---|
|
| Holdings [Text Block] |
Top SectorsFootnote Reference* (% of Net Assets)Footnote Reference(as of June 30, 2026)Table SummaryValue | Value |
|---|
Consumer Staples | 4.8% | Utilities | 5.6% | Real Estate | 6.1% | Energy | 6.7% | Financials | 7.5% | Health Care | 8.9% | Materials | 10.2% | Information Technology | 11.6% | Consumer Discretionary | 12.7% | Industrials | 23.7% | Top 10 HoldingsFootnote Reference* (% of Net Assets)Footnote Reference(as of June 30, 2026)Table SummaryLabcorp Holdings, Inc. | 2.6% |
|---|
U.S. Foods Holding Corp. | 2.3% |
|---|
Molina Healthcare, Inc. | 2.1% |
|---|
Alliant Energy Corp. | 2.1% |
|---|
Microchip Technology, Inc. | 2.0% |
|---|
Packaging Corp. of America | 2.0% |
|---|
RPM International, Inc. | 2.0% |
|---|
Keysight Technologies, Inc. | 1.9% |
|---|
Truist Financial Corp. | 1.9% |
|---|
Hubbell, Inc., Class B | 1.9% |
|---|
|
| C000002356 |
|
| Shareholder Report [Line Items] |
|
| Fund Name |
Victory Sycamore Small Company Opportunity Fund
|
| Class Name |
Class A
|
| Trading Symbol |
SSGSX
|
| Annual or Semi-Annual Statement [Text Block] |
Annual Shareholder Report
|
| Additional Information [Text Block] |
You can find additional information about the Fund at advisor.vcm.com/literature/ mutual-fund-prospectuses. You may also request more information by calling 800-539-3863 or visiting vcm.com/contact-us.
|
| Additional Information Phone Number |
800-539-3863
|
| Additional Information Website |
vcm.com
|
| Expenses [Text Block] |
What were the Fund's costs for the last year?(based on a hypothetical $10,000 investment) Table SummaryClass Name | Costs of a $10,000 Investment | Costs paid as a percentage of a $10,000 Investment |
|---|
Class A | $143 | 1.24% |
|---|
| | |
|---|
|
| Expenses Paid, Amount |
$ 143
|
| Expense Ratio, Percent |
1.24%
|
| Factors Affecting Performance [Text Block] |
What affected the Fund’s performance during the last year?The Fund underperformed the Russell 2000® Value Index (the “Index”) for the trailing 12-month period ended June 30, 2026. Index returns were positive across all 11 major economic sectors, with four sectors outpacing the broader Index. Within the Index, information technology was the top-performing sector, returning 128.58%. Utilities was the weakest-performing sector within the Index, returning 15.04%. Top contributors to performance: The Fund’s underweight in the real estate and utilities (the weakest-performing sector within the Index) sectors contributed positively to relative performance. Stock selection in the information technology sector (the top-performing sector) contributed positively to relative performance, and the Fund's overweight position in that sector further added to relative return.
Top detractors from performance: For the trailing 12-month period ended June 30, 2026, stock selection was the primary driver of relative underperformance, while sector allocation was roughly neutral for the period. Stock selection in the materials, financials, health care, and consumer discretionary sectors detracted most from relative performance for the period. The Fund's underweight position in the health care sector, which outperformed the broader Index, also detracted from relative performance. The Fund’s underweight position in the communication services sector also detracted from relative performance.
|
| Performance Past Does Not Indicate Future [Text] |
The investment return and principal value will fluctuate so that an investor's shares, when redeemed, may be worth more or less than the original cost. Past performance is not a good predictor of the Fund's future performance.
|
| Line Graph [Table Text Block] |
Table Summary | Victory Sycamore Small Company Opportunity Fund Class A @ NAV - $27,610 | Victory Sycamore Small Company Opportunity Fund Class A @ MOP - $26,021 | Russell 3000® Index (regulatory broad based index) - $40,672 | Russell 2000® Value Index - $28,123 |
|---|
6/16 | $10,000 | $9,424 | $10,000 | $10,000 |
|---|
6/17 | $12,439 | $11,723 | $11,851 | $12,486 |
|---|
6/18 | $14,209 | $13,391 | $13,602 | $14,121 |
|---|
6/19 | $14,633 | $13,791 | $14,824 | $13,241 |
|---|
6/20 | $12,692 | $11,961 | $15,792 | $10,927 |
|---|
6/21 | $19,605 | $18,477 | $22,767 | $18,934 |
|---|
6/22 | $17,820 | $16,795 | $19,610 | $15,851 |
|---|
6/23 | $19,973 | $18,824 | $23,327 | $16,803 |
|---|
6/24 | $20,955 | $19,749 | $28,721 | $18,634 |
|---|
6/25 | $21,231 | $20,009 | $33,114 | $19,666 |
|---|
6/26 | $27,610 | $26,021 | $40,672 | $28,123 |
|---|
|
| Average Annual Return [Table Text Block] |
Table Summary | 1 Year | 5 Year | 10 Year |
|---|
Class A @ NAV | 30.05%Footnote Reference | 7.09% | 10.69% |
|---|
Class A @ MOP | 22.56% | 5.83% | 10.04% |
|---|
Russell 3000® Index | 22.82% | 12.31% | 15.06% |
|---|
Russell 2000® Value Index | 43.01% | 8.23% | 10.89% |
|---|
|
| No Deduction of Taxes [Text Block] |
The graph and table total returns do not reflect the deduction of taxes that a shareholder would pay on Fund distributions, or redemption of shares.
|
| Previous Investment Adviser [Text Block] |
The maximum offering price (“MOP”) figures reflect a maximum sales charge of 5.75% for Class A. The Net Asset Value ("NAV") figures do not reflect sales charges.
|
| AssetsNet |
$ 4,677,890,000
|
| Holdings Count | Holding |
105
|
| Advisory Fees Paid, Amount |
$ 38,611,000
|
| InvestmentCompanyPortfolioTurnover |
54.00%
|
| Additional Fund Statistics [Text Block] |
FUND STATISTICS($ amounts in 000s)(as of June 30, 2026)Table SummaryNet Assets | $4,677,890 |
|---|
Number of Holdings | 105 |
|---|
Investment Advisory Fees | $38,611 |
|---|
Portfolio Turnover | 54% |
|---|
|
| Holdings [Text Block] |
Top SectorsFootnote Reference* (% of Net Assets)Footnote Reference(as of June 30, 2026)Table SummaryValue | Value |
|---|
Utilities | 2.1% | Real Estate | 3.3% | Consumer Staples | 4.7% | Materials | 5.8% | Health Care | 6.8% | Energy | 6.9% | Information Technology | 9.7% | Consumer Discretionary | 10.9% | Industrials | 22.0% | Financials | 23.0% | Top 10 HoldingsFootnote Reference* (% of Net Assets)Footnote Reference(as of June 30, 2026)Table SummaryUnited Bankshares, Inc. | 1.6% |
|---|
Renasant Corp. | 1.6% |
|---|
UMB Financial Corp. | 1.6% |
|---|
Charles River Laboratories International, Inc. | 1.6% |
|---|
Old National Bancorp | 1.5% |
|---|
The Chefs' Warehouse, Inc. | 1.5% |
|---|
MSA Safety, Inc. | 1.4% |
|---|
Ryman Hospitality Properties, Inc. | 1.4% |
|---|
Simpson Manufacturing Co., Inc. | 1.4% |
|---|
McGrath RentCorp | 1.4% |
|---|
|
| C000052116 |
|
| Shareholder Report [Line Items] |
|
| Fund Name |
Victory Sycamore Small Company Opportunity Fund
|
| Class Name |
Class I
|
| Trading Symbol |
VSOIX
|
| Annual or Semi-Annual Statement [Text Block] |
Annual Shareholder Report
|
| Additional Information [Text Block] |
You can find additional information about the Fund at advisor.vcm.com/literature/ mutual-fund-prospectuses. You may also request more information by calling 800-539-3863 or visiting vcm.com/contact-us.
|
| Additional Information Phone Number |
800-539-3863
|
| Additional Information Website |
vcm.com
|
| Expenses [Text Block] |
What were the Fund's costs for the last year?(based on a hypothetical $10,000 investment) Table SummaryClass Name | Costs of a $10,000 Investment | Costs paid as a percentage of a $10,000 Investment |
|---|
Class I | $103 | 0.89% |
|---|
| | |
|---|
|
| Expenses Paid, Amount |
$ 103
|
| Expense Ratio, Percent |
0.89%
|
| Factors Affecting Performance [Text Block] |
What affected the Fund’s performance during the last year?The Fund underperformed the Russell 2000® Value Index (the “Index”) for the trailing 12-month period ended June 30, 2026. Index returns were positive across all 11 major economic sectors, with four sectors outpacing the broader Index. Within the Index, information technology was the top-performing sector, returning 128.58%. Utilities was the weakest-performing sector within the Index, returning 15.04%. Top contributors to performance: The Fund’s underweight in the real estate and utilities (the weakest-performing sector within the Index) sectors contributed positively to relative performance. Stock selection in the information technology sector (the top-performing sector) contributed positively to relative performance, and the Fund's overweight position in that sector further added to relative return.
Top detractors from performance: For the trailing 12-month period ended June 30, 2026, stock selection was the primary driver of relative underperformance, while sector allocation was roughly neutral for the period. Stock selection in the materials, financials, health care, and consumer discretionary sectors detracted most from relative performance for the period. The Fund's underweight position in the health care sector, which outperformed the broader Index, also detracted from relative performance. The Fund’s underweight position in the communication services sector also detracted from relative performance.
|
| Performance Past Does Not Indicate Future [Text] |
The investment return and principal value will fluctuate so that an investor's shares, when redeemed, may be worth more or less than the original cost. Past performance is not a good predictor of the Fund's future performance.
|
| Line Graph [Table Text Block] |
Table Summary | Victory Sycamore Small Company Opportunity Fund Class I - $5,712,758 | Russell 3000® Index (regulatory broad based index) - $8,134,350 | Russell 2000® Value Index - $5,624,633 |
|---|
6/16 | $2,000,000 | $2,000,000 | $2,000,000 |
|---|
6/17 | $2,495,808 | $2,370,189 | $2,497,139 |
|---|
6/18 | $2,859,941 | $2,720,458 | $2,824,245 |
|---|
6/19 | $2,955,479 | $2,964,824 | $2,648,141 |
|---|
6/20 | $2,572,261 | $3,158,414 | $2,185,325 |
|---|
6/21 | $3,986,608 | $4,553,309 | $3,786,724 |
|---|
6/22 | $3,636,622 | $3,921,964 | $3,170,228 |
|---|
6/23 | $4,091,110 | $4,665,320 | $3,360,681 |
|---|
6/24 | $4,307,503 | $5,744,180 | $3,726,851 |
|---|
6/25 | $4,378,217 | $6,622,796 | $3,933,146 |
|---|
6/26 | $5,712,758 | $8,134,350 | $5,624,633 |
|---|
|
| Average Annual Return [Table Text Block] |
Table Summary | 1 Year | 5 Year | 10 Year |
|---|
Class I | 30.48%Footnote Reference | 7.46% | 11.07% |
|---|
Russell 3000® Index | 22.82% | 12.31% | 15.06% |
|---|
Russell 2000® Value Index | 43.01% | 8.23% | 10.89% |
|---|
|
| No Deduction of Taxes [Text Block] |
The graph and table total returns do not reflect the deduction of taxes that a shareholder would pay on Fund distributions, or redemption of shares.
|
| AssetsNet |
$ 4,677,890,000
|
| Holdings Count | Holding |
105
|
| Advisory Fees Paid, Amount |
$ 38,611,000
|
| InvestmentCompanyPortfolioTurnover |
54.00%
|
| Additional Fund Statistics [Text Block] |
FUND STATISTICS($ amounts in 000s)(as of June 30, 2026)Table SummaryNet Assets | $4,677,890 |
|---|
Number of Holdings | 105 |
|---|
Investment Advisory Fees | $38,611 |
|---|
Portfolio Turnover | 54% |
|---|
|
| Holdings [Text Block] |
Top SectorsFootnote Reference* (% of Net Assets)Footnote Reference(as of June 30, 2026)Table SummaryValue | Value |
|---|
Utilities | 2.1% | Real Estate | 3.3% | Consumer Staples | 4.7% | Materials | 5.8% | Health Care | 6.8% | Energy | 6.9% | Information Technology | 9.7% | Consumer Discretionary | 10.9% | Industrials | 22.0% | Financials | 23.0% | Top 10 HoldingsFootnote Reference* (% of Net Assets)Footnote Reference(as of June 30, 2026)Table SummaryUnited Bankshares, Inc. | 1.6% |
|---|
Renasant Corp. | 1.6% |
|---|
UMB Financial Corp. | 1.6% |
|---|
Charles River Laboratories International, Inc. | 1.6% |
|---|
Old National Bancorp | 1.5% |
|---|
The Chefs' Warehouse, Inc. | 1.5% |
|---|
MSA Safety, Inc. | 1.4% |
|---|
Ryman Hospitality Properties, Inc. | 1.4% |
|---|
Simpson Manufacturing Co., Inc. | 1.4% |
|---|
McGrath RentCorp | 1.4% |
|---|
|
| C000002357 |
|
| Shareholder Report [Line Items] |
|
| Fund Name |
Victory Sycamore Small Company Opportunity Fund
|
| Class Name |
Class R
|
| Trading Symbol |
GOGFX
|
| Annual or Semi-Annual Statement [Text Block] |
Annual Shareholder Report
|
| Additional Information [Text Block] |
You can find additional information about the Fund at advisor.vcm.com/literature/ mutual-fund-prospectuses. You may also request more information by calling 800-539-3863 or visiting vcm.com/contact-us.
|
| Additional Information Phone Number |
800-539-3863
|
| Additional Information Website |
vcm.com
|
| Expenses [Text Block] |
What were the Fund's costs for the last year?(based on a hypothetical $10,000 investment) Table SummaryClass Name | Costs of a $10,000 Investment | Costs paid as a percentage of a $10,000 Investment |
|---|
Class R | $165 | 1.44% |
|---|
| | |
|---|
|
| Expenses Paid, Amount |
$ 165
|
| Expense Ratio, Percent |
1.44%
|
| Factors Affecting Performance [Text Block] |
What affected the Fund’s performance during the last year?The Fund underperformed the Russell 2000® Value Index (the “Index”) for the trailing 12-month period ended June 30, 2026. Index returns were positive across all 11 major economic sectors, with four sectors outpacing the broader Index. Within the Index, information technology was the top-performing sector, returning 128.58%. Utilities was the weakest-performing sector within the Index, returning 15.04%. Top contributors to performance: The Fund’s underweight in the real estate and utilities (the weakest-performing sector within the Index) sectors contributed positively to relative performance. Stock selection in the information technology sector (the top-performing sector) contributed positively to relative performance, and the Fund's overweight position in that sector further added to relative return.
Top detractors from performance: For the trailing 12-month period ended June 30, 2026, stock selection was the primary driver of relative underperformance, while sector allocation was roughly neutral for the period. Stock selection in the materials, financials, health care, and consumer discretionary sectors detracted most from relative performance for the period. The Fund's underweight position in the health care sector, which outperformed the broader Index, also detracted from relative performance. The Fund’s underweight position in the communication services sector also detracted from relative performance.
|
| Performance Past Does Not Indicate Future [Text] |
The investment return and principal value will fluctuate so that an investor's shares, when redeemed, may be worth more or less than the original cost. Past performance is not a good predictor of the Fund's future performance.
|
| Line Graph [Table Text Block] |
Table Summary | Victory Sycamore Small Company Opportunity Fund Class R - $27,069 | Russell 3000® Index (regulatory broad based index) - $40,672 | Russell 2000® Value Index - $28,123 |
|---|
6/16 | $10,000 | $10,000 | $10,000 |
|---|
6/17 | $12,413 | $11,851 | $12,486 |
|---|
6/18 | $14,145 | $13,602 | $14,121 |
|---|
6/19 | $14,534 | $14,824 | $13,241 |
|---|
6/20 | $12,586 | $15,792 | $10,927 |
|---|
6/21 | $19,408 | $22,767 | $18,934 |
|---|
6/22 | $17,612 | $19,610 | $15,851 |
|---|
6/23 | $19,706 | $23,327 | $16,803 |
|---|
6/24 | $20,634 | $28,721 | $18,634 |
|---|
6/25 | $20,854 | $33,114 | $19,666 |
|---|
6/26 | $27,069 | $40,672 | $28,123 |
|---|
|
| Average Annual Return [Table Text Block] |
Table Summary | 1 Year | 5 Year | 10 Year |
|---|
Class R | 29.80%Footnote Reference | 6.88% | 10.47% |
|---|
Russell 3000® Index | 22.82% | 12.31% | 15.06% |
|---|
Russell 2000® Value Index | 43.01% | 8.23% | 10.89% |
|---|
|
| No Deduction of Taxes [Text Block] |
The graph and table total returns do not reflect the deduction of taxes that a shareholder would pay on Fund distributions, or redemption of shares.
|
| AssetsNet |
$ 4,677,890,000
|
| Holdings Count | Holding |
105
|
| Advisory Fees Paid, Amount |
$ 38,611,000
|
| InvestmentCompanyPortfolioTurnover |
54.00%
|
| Additional Fund Statistics [Text Block] |
FUND STATISTICS($ amounts in 000s)(as of June 30, 2026)Table SummaryNet Assets | $4,677,890 |
|---|
Number of Holdings | 105 |
|---|
Investment Advisory Fees | $38,611 |
|---|
Portfolio Turnover | 54% |
|---|
|
| Holdings [Text Block] |
Top SectorsFootnote Reference* (% of Net Assets)Footnote Reference(as of June 30, 2026)Table SummaryValue | Value |
|---|
Utilities | 2.1% | Real Estate | 3.3% | Consumer Staples | 4.7% | Materials | 5.8% | Health Care | 6.8% | Energy | 6.9% | Information Technology | 9.7% | Consumer Discretionary | 10.9% | Industrials | 22.0% | Financials | 23.0% | Top 10 HoldingsFootnote Reference* (% of Net Assets)Footnote Reference(as of June 30, 2026)Table SummaryUnited Bankshares, Inc. | 1.6% |
|---|
Renasant Corp. | 1.6% |
|---|
UMB Financial Corp. | 1.6% |
|---|
Charles River Laboratories International, Inc. | 1.6% |
|---|
Old National Bancorp | 1.5% |
|---|
The Chefs' Warehouse, Inc. | 1.5% |
|---|
MSA Safety, Inc. | 1.4% |
|---|
Ryman Hospitality Properties, Inc. | 1.4% |
|---|
Simpson Manufacturing Co., Inc. | 1.4% |
|---|
McGrath RentCorp | 1.4% |
|---|
|
| C000164985 |
|
| Shareholder Report [Line Items] |
|
| Fund Name |
Victory Sycamore Small Company Opportunity Fund
|
| Class Name |
Class R6
|
| Trading Symbol |
VSORX
|
| Annual or Semi-Annual Statement [Text Block] |
Annual Shareholder Report
|
| Additional Information [Text Block] |
You can find additional information about the Fund at advisor.vcm.com/literature/ mutual-fund-prospectuses. You may also request more information by calling 800-539-3863 or visiting vcm.com/contact-us.
|
| Additional Information Phone Number |
800-539-3863
|
| Additional Information Website |
vcm.com
|
| Expenses [Text Block] |
What were the Fund's costs for the last year?(based on a hypothetical $10,000 investment) Table SummaryClass Name | Costs of a $10,000 Investment | Costs paid as a percentage of a $10,000 Investment |
|---|
Class R6 | $97 | 0.84% |
|---|
| | |
|---|
|
| Expenses Paid, Amount |
$ 97
|
| Expense Ratio, Percent |
0.84%
|
| Factors Affecting Performance [Text Block] |
What affected the Fund’s performance during the last year?The Fund underperformed the Russell 2000® Value Index (the “Index”) for the trailing 12-month period ended June 30, 2026. Index returns were positive across all 11 major economic sectors, with four sectors outpacing the broader Index. Within the Index, information technology was the top-performing sector, returning 128.58%. Utilities was the weakest-performing sector within the Index, returning 15.04%. Top contributors to performance: The Fund’s underweight in the real estate and utilities (the weakest-performing sector within the Index) sectors contributed positively to relative performance. Stock selection in the information technology sector (the top-performing sector) contributed positively to relative performance, and the Fund's overweight position in that sector further added to relative return.
Top detractors from performance: For the trailing 12-month period ended June 30, 2026, stock selection was the primary driver of relative underperformance, while sector allocation was roughly neutral for the period. Stock selection in the materials, financials, health care, and consumer discretionary sectors detracted most from relative performance for the period. The Fund's underweight position in the health care sector, which outperformed the broader Index, also detracted from relative performance. The Fund’s underweight position in the communication services sector also detracted from relative performance.
|
| Performance Past Does Not Indicate Future [Text] |
The investment return and principal value will fluctuate so that an investor's shares, when redeemed, may be worth more or less than the original cost. Past performance is not a good predictor of the Fund's future performance.
|
| Line Graph [Table Text Block] |
Table Summary | Victory Sycamore Small Company Opportunity Fund Class R6 - $28,670 | Russell 3000® Index (regulatory broad based index) - $40,672 | Russell 2000® Value Index - $28,123 |
|---|
6/16 | $10,000 | $10,000 | $10,000 |
|---|
6/17 | $12,478 | $11,851 | $12,486 |
|---|
6/18 | $14,302 | $13,602 | $14,121 |
|---|
6/19 | $14,783 | $14,824 | $13,241 |
|---|
6/20 | $12,874 | $15,792 | $10,927 |
|---|
6/21 | $19,961 | $22,767 | $18,934 |
|---|
6/22 | $18,219 | $19,610 | $15,851 |
|---|
6/23 | $20,499 | $23,327 | $16,803 |
|---|
6/24 | $21,594 | $28,721 | $18,634 |
|---|
6/25 | $21,958 | $33,114 | $19,666 |
|---|
6/26 | $28,670 | $40,672 | $28,123 |
|---|
|
| Average Annual Return [Table Text Block] |
Table Summary | 1 Year | 5 Year | 10 Year |
|---|
Class R6 | 30.57%Footnote Reference | 7.51% | 11.11% |
|---|
Russell 3000® Index | 22.82% | 12.31% | 15.06% |
|---|
Russell 2000® Value Index | 43.01% | 8.23% | 10.89% |
|---|
|
| No Deduction of Taxes [Text Block] |
The graph and table total returns do not reflect the deduction of taxes that a shareholder would pay on Fund distributions, or redemption of shares.
|
| AssetsNet |
$ 4,677,890,000
|
| Holdings Count | Holding |
105
|
| Advisory Fees Paid, Amount |
$ 38,611,000
|
| InvestmentCompanyPortfolioTurnover |
54.00%
|
| Additional Fund Statistics [Text Block] |
FUND STATISTICS($ amounts in 000s)(as of June 30, 2026)Table SummaryNet Assets | $4,677,890 |
|---|
Number of Holdings | 105 |
|---|
Investment Advisory Fees | $38,611 |
|---|
Portfolio Turnover | 54% |
|---|
|
| Holdings [Text Block] |
Top SectorsFootnote Reference* (% of Net Assets)Footnote Reference(as of June 30, 2026)Table SummaryValue | Value |
|---|
Utilities | 2.1% | Real Estate | 3.3% | Consumer Staples | 4.7% | Materials | 5.8% | Health Care | 6.8% | Energy | 6.9% | Information Technology | 9.7% | Consumer Discretionary | 10.9% | Industrials | 22.0% | Financials | 23.0% | Top 10 HoldingsFootnote Reference* (% of Net Assets)Footnote Reference(as of June 30, 2026)Table SummaryUnited Bankshares, Inc. | 1.6% |
|---|
Renasant Corp. | 1.6% |
|---|
UMB Financial Corp. | 1.6% |
|---|
Charles River Laboratories International, Inc. | 1.6% |
|---|
Old National Bancorp | 1.5% |
|---|
The Chefs' Warehouse, Inc. | 1.5% |
|---|
MSA Safety, Inc. | 1.4% |
|---|
Ryman Hospitality Properties, Inc. | 1.4% |
|---|
Simpson Manufacturing Co., Inc. | 1.4% |
|---|
McGrath RentCorp | 1.4% |
|---|
|
| C000111275 |
|
| Shareholder Report [Line Items] |
|
| Fund Name |
Victory Sycamore Small Company Opportunity Fund
|
| Class Name |
Class Y
|
| Trading Symbol |
VSOYX
|
| Annual or Semi-Annual Statement [Text Block] |
Annual Shareholder Report
|
| Additional Information [Text Block] |
You can find additional information about the Fund at advisor.vcm.com/literature/ mutual-fund-prospectuses. You may also request more information by calling 800-539-3863 or visiting vcm.com/contact-us.
|
| Additional Information Phone Number |
800-539-3863
|
| Additional Information Website |
vcm.com
|
| Expenses [Text Block] |
What were the Fund's costs for the last year?(based on a hypothetical $10,000 investment) Table SummaryClass Name | Costs of a $10,000 Investment | Costs paid as a percentage of a $10,000 Investment |
|---|
Class Y | $111 | 0.96% |
|---|
| | |
|---|
|
| Expenses Paid, Amount |
$ 111
|
| Expense Ratio, Percent |
0.96%
|
| Factors Affecting Performance [Text Block] |
What affected the Fund’s performance during the last year?The Fund underperformed the Russell 2000® Value Index (the “Index”) for the trailing 12-month period ended June 30, 2026. Index returns were positive across all 11 major economic sectors, with four sectors outpacing the broader Index. Within the Index, information technology was the top-performing sector, returning 128.58%. Utilities was the weakest-performing sector within the Index, returning 15.04%. Top contributors to performance: The Fund’s underweight in the real estate and utilities (the weakest-performing sector within the Index) sectors contributed positively to relative performance. Stock selection in the information technology sector (the top-performing sector) contributed positively to relative performance, and the Fund's overweight position in that sector further added to relative return.
Top detractors from performance: For the trailing 12-month period ended June 30, 2026, stock selection was the primary driver of relative underperformance, while sector allocation was roughly neutral for the period. Stock selection in the materials, financials, health care, and consumer discretionary sectors detracted most from relative performance for the period. The Fund's underweight position in the health care sector, which outperformed the broader Index, also detracted from relative performance. The Fund’s underweight position in the communication services sector also detracted from relative performance.
|
| Performance Past Does Not Indicate Future [Text] |
The investment return and principal value will fluctuate so that an investor's shares, when redeemed, may be worth more or less than the original cost. Past performance is not a good predictor of the Fund's future performance.
|
| Line Graph [Table Text Block] |
Table Summary | Victory Sycamore Small Company Opportunity Fund Class Y - $2,822,379 | Russell 3000® Index (regulatory broad based index) - $4,067,175 | Russell 2000® Value Index - $2,812,317 |
|---|
6/16 | $1,000,000 | $1,000,000 | $1,000,000 |
|---|
6/17 | $1,244,872 | $1,185,095 | $1,248,570 |
|---|
6/18 | $1,423,363 | $1,360,229 | $1,412,122 |
|---|
6/19 | $1,468,780 | $1,482,412 | $1,324,070 |
|---|
6/20 | $1,276,651 | $1,579,207 | $1,092,663 |
|---|
6/21 | $1,975,895 | $2,276,654 | $1,893,362 |
|---|
6/22 | $1,801,853 | $1,960,982 | $1,585,114 |
|---|
6/23 | $2,025,351 | $2,332,660 | $1,680,340 |
|---|
6/24 | $2,131,036 | $2,872,090 | $1,863,426 |
|---|
6/25 | $2,164,713 | $3,311,398 | $1,966,573 |
|---|
6/26 | $2,822,379 | $4,067,175 | $2,812,317 |
|---|
|
| Average Annual Return [Table Text Block] |
Table Summary | 1 Year | 5 Year | 10 Year |
|---|
Class Y | 30.38%Footnote Reference | 7.39% | 10.93% |
|---|
Russell 3000® Index | 22.82% | 12.31% | 15.06% |
|---|
Russell 2000® Value Index | 43.01% | 8.23% | 10.89% |
|---|
|
| No Deduction of Taxes [Text Block] |
The graph and table total returns do not reflect the deduction of taxes that a shareholder would pay on Fund distributions, or redemption of shares.
|
| AssetsNet |
$ 4,677,890,000
|
| Holdings Count | Holding |
105
|
| Advisory Fees Paid, Amount |
$ 38,611,000
|
| InvestmentCompanyPortfolioTurnover |
54.00%
|
| Additional Fund Statistics [Text Block] |
FUND STATISTICS($ amounts in 000s)(as of June 30, 2026)Table SummaryNet Assets | $4,677,890 |
|---|
Number of Holdings | 105 |
|---|
Investment Advisory Fees | $38,611 |
|---|
Portfolio Turnover | 54% |
|---|
|
| Holdings [Text Block] |
Top SectorsFootnote Reference* (% of Net Assets)Footnote Reference(as of June 30, 2026)Table SummaryValue | Value |
|---|
Utilities | 2.1% | Real Estate | 3.3% | Consumer Staples | 4.7% | Materials | 5.8% | Health Care | 6.8% | Energy | 6.9% | Information Technology | 9.7% | Consumer Discretionary | 10.9% | Industrials | 22.0% | Financials | 23.0% | Top 10 HoldingsFootnote Reference* (% of Net Assets)Footnote Reference(as of June 30, 2026)Table SummaryUnited Bankshares, Inc. | 1.6% |
|---|
Renasant Corp. | 1.6% |
|---|
UMB Financial Corp. | 1.6% |
|---|
Charles River Laboratories International, Inc. | 1.6% |
|---|
Old National Bancorp | 1.5% |
|---|
The Chefs' Warehouse, Inc. | 1.5% |
|---|
MSA Safety, Inc. | 1.4% |
|---|
Ryman Hospitality Properties, Inc. | 1.4% |
|---|
Simpson Manufacturing Co., Inc. | 1.4% |
|---|
McGrath RentCorp | 1.4% |
|---|
|